Susan started her Real Estate practice in 2005. She specializes in the luxury markets within the BROADMOOR, KISSING CAMELS, OLD NORTH END, MANITOU SPRINGS, BRIARGATE, and FLYING HORSE areas.
Before real estate, SUSAN worked in the FINANCE INDUSTRY. She brings her multifaceted finance and investment background to her work as a Realtor®, supplying her clients with unique and insightful resources via analytical strategies that emphasize professional advisory service.
With over two decades of real estate experience, SUSAN has a proven track record of bringing her client’s goals to fruition. Whatever their goal is, she will do everything in her power to help them accomplish it. For buyers, that means playing the part of a matchmaker to create a harmonious marriage between the ideal buyer and the perfect home. For sellers, she advises her clients on how best to prepare their property to sell faster and at the highest price possible.
BUYING AND SELLING can be an emotional, stressful process, which is why Susan emphasizes working alongside her clients in a respectful, considerate partnership. She integrates her years of financial, analytical, and marketing aptitude with systematic client development and programming methods to stay one step ahead of the latest market trends.
She earned her BBA in Finance from TEXAS CHRISTIAN UNIVERSITY and earned her MBA in Real Estate Management from COLUMBIA COLLEGE. Susan is currently in the process of completing her DBA in Real Estate Development from LIBERTY UNIVERSITY. Throughout her many years in the business, SUSAN has won countless production awards for her intuitive approach in helping her clients achieve their goals.
TABLE OF CONTENTS
PAGE 4 LUXURY REPORT EXPLAINED
PAGE 5 WELCOME MESSAGE
PAGE 6-9 NORTH AMERICAN LUXURY MARKET REVIEW
PAGE 10 13-MONTH MARKET TRENDS
PAGE 11 SINGLE-FAMILY HOMES MONTHLY OVERVIEW
PAGE 12 ATTACHED HOMES MONTHLY OVERVIEW
PAGE 13-16 MONTHLY STATISTICS BY CITY
PAGE 17 LOCAL LUXURY MARKET REVIEW
PAGE 18-19 SINGLE-FAMILY HOMES - Monthly Statistics
PAGE 20-21 ATTACHED HOMES - Monthly Statistics
PAGE 22 THANK YOU
– LUXURY REPORT EXPLAINED –
The Institute for Luxury Home Marketing has analyzed a number of metrics — including sales prices, sales volumes, number of sales, sales-price-to-list-price ratios, days on market and price-per-square-foot – to provide you a comprehensive North American Luxury Market report.
Additionally, we have further examined all of the individual luxury markets to provide both an overview and an in-depth analysis - including, where data is sufficient, a breakdown by luxury single-family homes and luxury attached homes.
It is our intention to include additional luxury markets on a continual basis. If your market is not featured, please contact us so we can implement the necessary qualification process. More in-depth reports on the luxury communities in your market are available as well.
Looking through this report, you will notice three distinct market statuses, Buyer's Market, Seller's Market, and Balanced Market. A Buyer's Market indicates that buyers have greater control over the price point. This market type is demonstrated by a substantial number of homes on the market and few sales, suggesting demand for residential properties is slow for that market and/or price point.
By contrast, a Seller's Market gives sellers greater control over the price point. Typically, this means there are few homes on the market and a generous demand, causing competition between buyers who ultimately drive sales prices higher.
A Balanced Market indicates that neither the buyers nor the sellers control the price point at which that property will sell and that there is neither a glut nor a lack of inventory. Typically, this type of market sees a stabilization of both the list and sold price, the length of time the property is on the market as well as the expectancy amongst homeowners in their respective communities – so long as their home is priced in accordance with the current market value.
REPORT GLOSSARY
DAYS ON MARKET: Measures the number of days a home is available on the market before a purchase offer is accepted.
LUXURY BENCHMARK PRICE: The price point that marks the transition from traditional homes to luxury homes.
NEW LISTINGS: The number of homes that entered the market during the current month.
PRICE PER SQUARE FOOT: Measures the dollar amount of the home's price for an individual square foot.
SALES RATIO: Sales Ratio defines market speed and determines whether the market currently favors buyers or sellers. A Buyer's Market has a Sales Ratio of less than 12%; a Balanced Market has a ratio of 12% up to 21%; a Seller's Market has a ratio of 21% or higher. A Sales Ratio greater than 100% indicates the number of sold listings exceeds the number of listings available at the end of the month.
SP/LP RATIO: The Sales Price/List Price Ratio compares the value of the sold price to the value of the list price.
REMAINING INVENTORY: The total number of homes available at the close of a month.
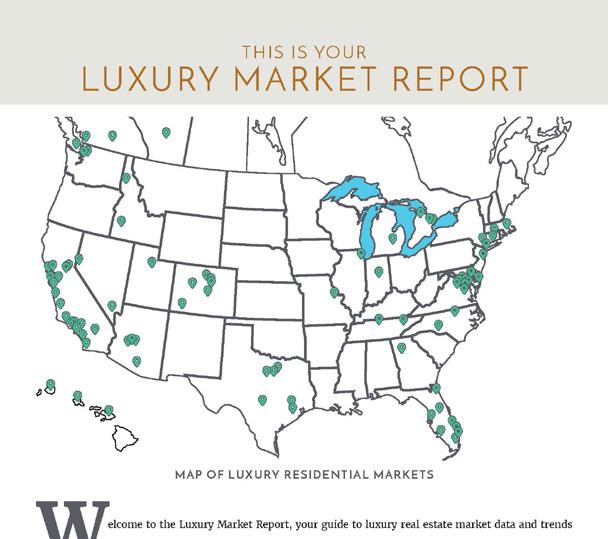
LUXURY RESIDENTIAL MARKETS
The Luxury Market Report is your guide to luxury real estate market data and trends for North America. Produced monthly by The Institute for Luxury Home Marketing, this report provides an indepth look at the top residential markets across the United States and Canada. Within the individual markets, you will find established luxury benchmark prices and detailed survey of luxury active and sold properties designed to showcase current market status and recent trends. The national report illustrates a compilation of the top North American markets to review overall standards and trends.
The Luxury Market Report is a monthly analysis provided by The Institute for Luxury Home Marketing. Luxury benchmark prices are determined by The Institute. This active and sold data has been provided by REAL Marketing, who has compiled the data through various sources, including local MLS boards, local tax records and Realtor.com. Data is deemed reliable to the best of our knowledge, but is not guaranteed.
NORTH AMERICAN LUXURY REVIEW
Market of Mixed Expectations
September saw a mix of expectations as mortgage rates fell, inventory levels increased, yet home prices remained elevated.
Mortgage rates have been trending downward since spring, and in September, we saw interest rate cuts of 0.5% by the US Fed and 0.25% by the Bank of Canada. In the U.S., interest rates dropped as low as 4.75% on average, while in Canada, they fell to around 4%. This helped bring down some mortgage rates to their lowest levels in over a year.
However, buyers have been slow to respond. This reluctance is partly due to elevated home prices but also because many are waiting to see if rates will drop further.
Institute members report that some potential buyers are holding out, waiting to see if rates will drop further – some hoping to see rates as low as 5%. In the U.S., additional hesitation comes from uncertainty surrounding the new National Association of Realtors’ rules and the upcoming presidential election.
Despite this, demand showed signs of picking up, with agents reporting increased early-stage activity, such as visits to real estate websites, property viewings, mortgage applications, and pending offers.
Pending sales saw an uptick in late September spurred by the interest rate cuts, even though mortgage rates had been declining for several weeks in anticipation the changes.
Sales trends in September varied across property types. Based on the 150 markets reviewed by The Institute, single-family home sales rose by 5.11% while condominium and townhome sales fell by 4.22% also creating a mix picture of the market.
New listings also increased significantly, with a year-over-year uptick of 17.52% for single-family homes and 18.31% for condominiums and townhomes. Unlike the rise in pending sales, which reflects a recent trend, both inventory levels and new listings entering the market have been growing for nearly a year.
Home prices showed little movement compared to last September. The median sold price for single-family homes dipped by just 0.56% and attached properties by 0.26%.
Impact of Interest Rates on Luxury Real Estate
While affluent buyers rely less on borrowing— with over 40% of luxury real estate purchases in the past year made in cash—falling interest rates are still poised to influence the market. Lower rates may encourage more sellers to list their homes and give buyers greater confidence in pursuing high-end purchases.
Interest rate cuts could also make alternative loan options more attractive to wealthy buyers who prefer leveraging lower rates rather than using cash outright. Even though borrowing costs may not be the primary factor for many luxury buyers, the decision to finance a home often fits into a broader investment or portfolio strategy.
For instance, in a competitive real estate market where cash offers are advantageous, a buyer might opt to take a loan against their stock portfolio rather than liquidating securities and triggering capital gains taxes.
Additionally, many high-net-worth individuals work with private banks or wealth management firms where the interest rates they pay are often dictated by their banking relationship, portfolio size, and contract terms, rather than the standard base rate. However, as banks gain access to cheaper capital, they may have more flexibility to negotiate lower rates on an individual basis.
Another reason to believe the luxury market is poised for a boost: interest rate cuts, as well as the falling mortgage rates, may reflect a larger shift in the market. Even individuals who took a wait-and-see attitude are beginning to feel that the real estate market has reached a turning point, especially as mortgage rates have fallen consistently over the past year.
A WSJ Intelligence poll conducted in August further supports this outlook, showing increased confidence among wealthy home buyers. The survey, which included approximately 4,000 Wall Street Journal readers with an average net worth of $4.7 million, revealed that most respondents were more optimistic about the housing market than they had been at the beginning of the year.
A Calmer Market even if Rates Continue to Fall
The frenzied real estate market of the pandemic era was driven by a perfect storm: a surge in demand for luxury homes, record-low interest rates, and a booming stock market that fueled soaring prices and bidding wars.
However, the next peak in the luxury real estate market is unlikely in the foreseeable future, as the favorable conditions that once boosted the market have now shifted and, in many cases, become obstacles.
While mortgage rates have declined from their 2023 peak, the market is more likely to see a gradual return to balance rather than a rapid shift to either a buyer’s or seller’s market. Rates are unlikely to drop back to the historic lows of 2% or 3% for many years, if ever.
Despite the decline in mortgage rates, luxury home prices remain elevated, especially in highdemand regions. The combination of elevated prices and still higher-than-preferred interest rates is likely to keep some buyers out of the market, shrinking the pool of active participants and making a market frenzy less likely.
Many homeowners with low-interest mortgages are hesitant to sell, knowing that purchasing a new property at today’s higher rates would mean significantly higher monthly payments. This reluctance has kept some inventory off the market, preventing the high turnover that typically fuels buying frenzies.
Though inventory levels are rising, they remain relatively low compared to the demand seen in recent years. This imbalance between supply and demand has tempered competition, with buyers having fewer choices, reducing the urgency to act quickly before prices rise further.
During past housing booms, investors—both institutional and individual—played a significant role in driving up demand. However, with borrowing costs higher and uncertainty around future price appreciation, many investors are stepping back, reducing the speculative energy that once fueled rapid price increases.
Post-pandemic changes in buyer preferences, such as a greater desire for space or moves to different locations, have slowed certain urban real estate markets. This shift in what buyers are looking for has altered demand patterns, contributing to a slower market recovery.
Together, these factors are creating a more balanced and measured market environment. Buyers and sellers are no longer rushing to make decisions, which is preventing the kind of frenzy that characterized past real estate booms.
The art of selling and buying in this market requires a critical and analytical approach; understanding the realities and setting expectations accordingly will help you achieve your goals. For homeowners looking to buy or sell in today’s market, we recommend working with a Realtor who can capitalize on the preferences, trends, and demands in this dynamic and evolving environment.
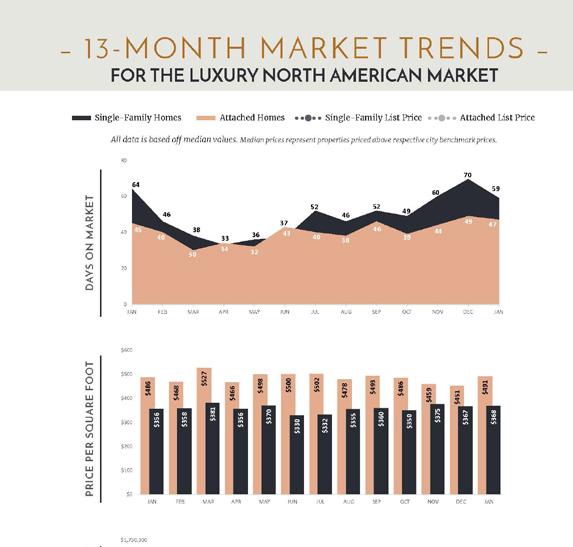
– 13 - MONTH MARKET
FOR THE LUXURY NORTH AMERICAN MARKET
All data is based off median values. Median prices represent properties priced above respective city benchmark prices.
$1,300,000 $1,500,000 $1,700,000
$1,100,000
$900,000
$700,000
$500,000
– LUXURY MONTHLY MARKET REVIEW –
A Review of Key Market Differences Year over Year
September 2023 | September 2024
SINGLE-FAMILY HOMES
4.51%
SINGLE-FAMILY HOMES MARKET SUMMARY | SEPTEMBER 2024
• Official Market Type: Balanced Market with a 20.85% Sales Ratio.1
• Homes are selling for an average of 98.23% of list price.
• The median luxury threshold2 price is $900,000, and the median luxury home sales price is $1,296,250.
• Markets with the Highest Median Sales Price: Telluride ($5,304,000), Vail ($5,200,000), Naples ($3,900,000), and Los Angeles Beach Cities ($3,875,000).
• Markets with the Highest Sales Ratio: Howard County, MD (77.5%), St. Louis (73.0%), Cleveland Suburbs (68.2%), and East Bay (62.0%).
1
A Review of Key Market Differences Year over Year
September 2023 | September 2024
1,056
187
HOMES MARKET SUMMARY | SEPTEMBER 2024
• Official Market Type: Balanced Market with a 16.24% Sales Ratio. 1
• Attached homes are selling for an average of 98.65% of list price.
• The median luxury threshold2 price is $700,000, and the median attached luxury sale price is $852,000
• Markets with the Highest Median Sales Price: Vail ($3,050,000), Whistler ($2,850,000), Sarasota & Beaches ($2,565,100), and San Francisco ($2,475,000).
• Markets with the Highest Sales Ratio: Fairfax County, VA (83.6%), Anne Arundel County, MD (73.0%), Arlington & Alexandria (65.4%), and Howard County, MD (64.6%).
– LUXURY MONTHLY MARKET REVIEW –
– LUXURY MONTHLY MARKET REVIEW –
– LUXURY MONTHLY MARKET REVIEW –
– LUXURY MONTHLY MARKET REVIEW –
COLORADO SPRINGS COLORADO
COLORADO SPRINGS SINGLE
Luxury Benchmark Price 1: $720,000
LUXURY INVENTORY VS. SALES | SEPTEMBER 2024
Inventory Sales
$3,145,000+
$2,845,000 - $3,144,999
$2,545,000 - $2,844,999
$2,245,000 - $2,544,999
$1,945,000 - $2,244,999
$1,645,000 - $1,944,999
$1,445,000 - $1,644,999
$1,245,000
$945,000 - $1,044,999
$845,000 - $944,999
$795,000 - $844,999
$745,000 - $794,999
$720,000 - $744,999
Luxury Benchmark Price 1: $720,000
13 - MONTH LUXURY MARKET TREND 4
MEDIAN DATA REVIEW | SEPTEMBER
98.19% SALE TO LIST PRICE RATIO VARIANCE: 0 % $242 $242 SALE PRICE PER SQFT.
- 1 %
27 DAYS ON MARKET
-
• The single-family luxury market is a Balanced Market with a 14% Sales Ratio.
• Homes sold for a median of 98.19% of list price in September 2024.
• The most active price band is $745,000-$794,999, where the sales ratio is 22%
• The median luxury sales price for single-family homes is $875,000. • The median days on market for September 2024 was 27 days, down from 36 in September 2023.
LUXURY INVENTORY
VS. SALES | SEPTEMBER 2024
$1,100,000 - $1,149,999
$1,050,000 - $1,099,999
$1,000,000
$600,000
$550,000
$500,000
13 - MONTH LUXURY MARKET TREND 4
MEDIAN DATA REVIEW | SEPTEMBER
• The attached luxury market is a Seller's Market with a 37% Sales Ratio. • Homes sold for a median of 99.33% of list price in September 2024.
• The most active price band is $700,000-$749,999, where the sales ratio is 150%
• The median luxury sales price for attached homes is $580,000.
• The median days on market for September 2024 was 20 days, up from 15 in September 2023.