Patricia Cain Designated Owner7633 E Acoma Dr., 104 - Scottsdale, AZ 85260 480-490-9269 Email: connect@ateam.realestate - www.ascend.realty BrittanyThomas REALTOR® LuxuryMarketLuxuryMarketLuxuryMarketMarketLuxury REPORT September 2022


MEET THE A TEAM,
After 10 years of company ownership, Patricia began building a team with Brittany Thomas, who has a decade long background serving customers and client relations. Working closely together as a team has allowed them to best serve clients and to ensure someone is always available to meet their real estate needs.
In her free time, Patricia loves helping small businesses grow by assisting other small companies with growth strategies, business setup and design. She also loves traveling, jewelry making, the arts, and focusing on health and personal growth.
Firsthand knowledge of Maricopa County history — from its beginning development to its current reputation as being one of top places people move to most frequently across the United States. Her insight comes from experience. She was born and raised in Chicago, IL, and moved to Arizona in 1985 after becoming legally emancipated at 16. Entrepreneurial at heart, Patricia worked for smaller companies and assisted them with company growth and perfecting client experiences. She began her own company which she ran for a decade. When she got into real estate, she began to do the same thing but on a much different scale. Since then, she now owns 2 RE/MAX franchises and feels this is where she is most fulfilled, as she can help agents grow and assist more clients with their real estate desires, whether that be residential or commercial.
in the community is also a paramount priority for Patricia. She has coordinated multiple fundraisers for pet adoptions, hydrocephalus, Phoenix Children’s hospital, food banks, and debt collection just to name a few. But her true passion in outreach lies with in keeping animals off the streets and out of shelters. She and her team regularly coordinate donations to pet rescue and resources.
Patricia

It takes a special kind of dedication to be recognized as one of the top agents in Arizona and the United States. Patricia Cain, Owner of RE/MAX Ascend Realty and RE/MAX Ascend Commercial Realty has earned this distinction and possesses a high level of local market understanding and a commitment to client service.


Designated Owner7633 E Acoma Dr., 104 - Scottsdale, AZ 85260 480-490-9269 Email: connect@ateam.realestate - www.ascend.realty BrittanyThomas REALTOR®
Outreachrow.
Clients routinely return to Patricia for later transactions. They find value in her negotiating skills, uncompromising standards and exemplary personal attention. Over the course of her decorated career, Patricia has furthermore been named as one of the best Real Estate Agents in Arizona and America multiple years in a
Her sales record set the tone. Patricia has closed on over $200 million in sales throughout her 20+ year career of marketing and selling multiple types of Arizona Real Estate including luxury homes, single family homes, condominiums, commercial buildings, and land.


If you are considering buying or selling, relocating, downsizing, or upscaling, contact the A-Team. We are excited to help and look forward to hearing from you. Cain


6-9 NORTH AMERICAN LUXURY MARKET REVIEW

PAGE
22-23 SINGLE-FAMILY HOMES - Monthly Statistics
11 SINGLE-FAMILY HOMES MONTHLY OVERVIEW
PAGE
4 LUXURY REPORT EXPLAINED PAGE 5 WELCOME MESSAGE
17-20 MONTHLY STATISTICS BY CITY - Attached Homes PAGE 21 LOCAL LUXURY MARKET REVIEW
PAGE
TABLE OF CONTENTS
12 ATTACHED HOMES MONTHLY OVERVIEW
PAGE
PAGE
10 13-MONTH MARKET TRENDS
24-25 ATTACHED HOMES - Monthly Statistics PAGE 26 THANK YOU
PAGE
13-16 MONTHLY STATISTICS BY CITY - Single-Family Homes
PAGE
PAGE
PAGE
REMAINING INVENTORY: The total number of homes available at the close of a month.
DAYS ON MARKET: Measures the number of days a home is available on the market before a purchase offer is accepted.
The Institute for Luxury Home Marketing has analyzed a number of metrics — including sales prices, sales volumes, number of sales, sales-price-to-list-price ratios, days on market and price-per-square-foot – to provide you a comprehensive North American Luxury Market report. Additionally, we have further examined all of the individual luxury markets to provide both an overview and an in-depth analysis - including, where data is sufficient, a breakdown by luxury single-family homes and luxury attached homes.
SP/LP RATIO: The Sales Price/List Price Ratio compares the value of the sold price to the value of the list price.
LUXURY REPORT EXPLAINED
A Balanced Market indicates that neither the buyers nor the sellers control the price point at which that property will sell and that there is neither a glut nor a lack of inventory. Typically, this type of market sees a stabilization of both the list and sold price, the length of time the property is on the market as well as the expectancy amongst homeowners in their respective communities – so long as their home is priced in accordance with the current market value.
PRICE PER SQUARE FOOT: Measures the dollar amount of the home's price for an individual square foot.
SALES RATIO: Sales Ratio defines market speed and determines whether the market currently favors buyers or sellers. Buyer's Market = up to 14%; Balanced Market = 15 to 20%; Seller's Market = 21% plus. If >100%, sales from previous month exceed current inventory.
–
It is our intention to include additional luxury markets on a continual basis. If your market is not featured, please contact us so we can implement the necessary qualification process. More in-depth reports on the luxury communities in your market are available as well.
REPORT GLOSSARY
Looking through this report, you will notice three distinct market statuses, Buyer's Market, Seller's Market, and Balanced Market. A Buyer's Market indicates that buyers have greater control over the price point. This market type is demonstrated by a substantial number of homes on the market and few sales, suggesting demand for residential properties is slow for that market and/or price point.
NEW LISTINGS: The number of homes that entered the market during the current month.
–
LUXURY BENCHMARK PRICE: The price point that marks the transition from traditional homes to luxury homes.
By contrast, a Seller's Market gives sellers greater control over the price point. Typically, this means there are few homes on the market and a generous demand, causing competition between buyers who ultimately drive sales prices higher.
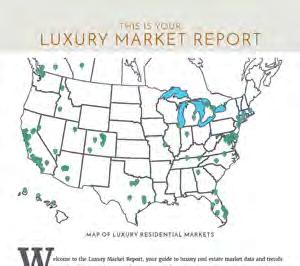
elcome to the Luxury Market Report, your guide to luxury real estate market data and trends for North America. Produced monthly by The Institute for Luxury Home Marketing, this report provides an in-depth look at the top residential markets across the United States and Canada. Within the individual markets, you will find established luxury benchmark prices and detailed survey of luxury active and sold properties designed to showcase current market status and recent trends. The national report illustrates a compilation of the top North American markets to review overall standards and trends.
LUXURY MARKET REPORT
THIS IS YOUR
Copyright © 2022 Institute for Luxury Home Marketing | www.luxuryhomemarketing.com | 214.485.3000
MAP OF LUXURY RESIDENTIAL MARKETS
The Luxury Market Report is a monthly analysis provided by The Institute for Luxury Home Marketing. Luxury benchmark prices are determined by The Institute. This active and sold data has been provided by REAL Marketing, who has compiled the data through various sources, including local MLS boards, local tax records and Realtor.com. Data is deemed reliable to the best of our knowledge, but is not guaranteed.
W
NORTH AMERICAN LUXURY REVIEW
Market Changes to Consider
Whether the overall luxury real estate market moves towards a balanced or buyer’s market will likely depend on changes in inventory levels and whether the available homes match buyers' demand. Even at the height of the buyer frenzy in spring 2021, homes that were considerably over-priced or needed extensive renovations or repairs often remained unsold.
Over the last few months, the luxury real estate market has experienced the return of a more normal pace for those looking to buy and sell their homes. Recent trends also continue to show a considerable moderation in the number of sales and the rate of price increases, which has certainly taken the pressure off the market.
While it is contended that we are moving towards a buyer’s market, the current data for August 2022 shows that conditions in most luxury markets are still favorable to sellers – of the 140 single-family markets showcased in our report, 106 remain seller markets. However, the sales ratio percentage, which measures the rate of sales against available inventory each month, is trending downwards in most markets month over month, in comparison to 2021 levels.
Demand for move-in-ready properties remains a top priority for affluent buyers who have little time or desire to embark on any more than simple updating projects. As we highlighted last month, properties that are fully furnished, down to kitchen utensils, dishware, and all the soft furnishings, are highly prized, often seeing some of the shortest days on the market.
The level of inventory may have risen since May 2022, and now approximately 50% higher for single family homes and 18% for attached properties compared to August 2021, but of greater significance is that the number of new listings entering the market has continued to drop since June 2022. Expectations are that these numbers will rise as we enter the fall season, but it seems that some luxury sellers are hesitant to enter the current market.
The drop in new listings might be explained as, traditionally, summer months do see fewer homes enter the market as families take time to vacation. However, according to Danielle Halle, Chief Economist at Realtor.com, “even though home prices are near record highs and home equity has soared, homeowners appear to be less eager to list homes for sale compared to last year. Recent survey data shows that while home sellers are in a good position, typically getting their list price and still generally satisfied with the price and other aspects of their home sale, some of their (seller) markers have shifted over the last year.”
It seems that some sellers are not quite ready to contend with the return of negotiating terms or, depending on their level of wealth, simply do not need to sell, so they are ready to wait until the market becomes more favorable.

Sellers are facing several problems, including appraisals not matching the value of their asking price and the return of contract contingencies such as requests for repairs or compensation. In the last year especially, these were not included in buyer contracts because multiple offers and cash buyers mitigated these sorts of requests.
As we move into the fall season, we review both new opportunities and trends that homeowners and investors should consider during their property search.
Equally, after two long years of unrest and upheaval, many affluent are content with their purchases and now looking for more stability and continuity. So, expectations are that they might not be ready to sell any time soon. If these affluent purchased using a ‘fixed-term’ low-interest rate mortgage, it is also unlikely that they would trade in these favorable terms if they do not have to sell or move unless a life-changing event occurs.
If we are returning to a more traditional real estate cycle, then over the next couple of months, inventory levels should start to increase again, and we may see more luxury markets become balanced or buyer’s markets.
Cities from Vancouver and Toronto in Canada to Atlanta, Austin, Chicago, and San Francisco in the US saw their emerging neighborhoods stall in 2020 as people chose to purchase away from the more crowded metropolitan communities.
Today, emerging neighborhoods not only afford buyers better values but have the potential to create greater equity returns. These are ideal for buyers ready to invest in a property for the longer term, understanding that they are buying early and will need to wait for the neighborhood to evolve and mature.
Emerging City Neighborhoods
While cities are starting to experience an influx of new and returning buyers, some of the best deals may be found in emerging neighborhoods. Before the pandemic, many of these inner, mid-city communities and industrial areas had been on trend for gentrification.
Return to Urban Living
An increasing number of buyers are starting to return to the larger metropolitan cities for multiple reasons, including simply missing the lifestyle or looking for a potential investment opportunity. This door may close soon, as also in the mix are foreign investors (now that travel restrictions are easing) and first-time buyers heading to urban markets looking for the opportunity to purchase a property. Experts predict that city markets may see stronger returns on investment than their suburban counterparts.

Vacation and second home properties are expected to continue to increase in popularity, especially for those who need escape options from their primary property. The affluent are continuing to seek diversity in their lifestyle, and owning multiple properties, whether in the city, mountains, or beach locations, is an important facet in meeting that requirement.
New Priorities
As we enter the latter part of 2022, mainly due to the historic rise in property values over the last 24 months, many affluent are now starting to reprioritize with a keen eye on market stability and potential returns.

While people want extra space, they do not want to be overwhelmed with larger debt, especially as interest rates continue to rise. Equally, land and privacy are still important, but as things return to normal, the shift back to living closer to amenities and locations closer to work are becoming the main priority once more.
The art of selling and buying in this market needs a critical and analytical approach; understanding the realities and setting expectations accordingly will ensure that goals are achieved. For homeowners looking to buy or sell in today’s market, we recommend working with a Realtor who can capitalize on the preferences, trends, and demands in this dynamic and evolving environment.
Which trends will see better investment return; larger estate-sized homes, properties with views, those located on expansive land, or smaller homes closer to amenities, are questions being asked of our luxury real estate professionals.
Now that remote working is mainstream, there is still an increased focus on investing in real estate that aligns with people’s lifestyle choices.
Time to Diversify
The answer may lie in reviewing the sales data for the last six months, which reveals that luxury mid-sized homes ranging from 3,000 to 3,500 sq ft are proving to be in the greatest demand for single family homes and 1,500 to 2,000 sq ft for attached properties.
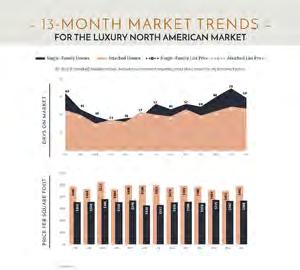
– 13 - MONTH MARKET TRENDS –Single-Family Homes Attached Homes Single-Family List Price Attached List Price PRICELISTVS.PRICESALESMARKETONDAYS All data is based off median values. Median prices represent properties priced above respective city benchmark prices. FOR THE LUXURY NORTH AMERICAN MARKET 11 13 14 15 15 17 18 13 9 7 7 9 12 16 16 15 12 15 16 18 11 8 8 9 9 13 0 2 4 6 8 10 12 14 16 18 20 JUL AUG SEP OCT NOV DEC JAN FEB MAR APR MAY JUN JUL FOOTSQUAREPERPRICE $492 $486 $504 $501 $498 $535 $516 $526 $543 $526 $540 $550 $538 $376 $392 $397 $400 $396 $415 $410 $420 $421 $443 $438 $431 $430 $0 $100 $200 $300 $400 $500 $600 JUL AUG SEP OCT NOV DEC JAN FEB MAR APR MAY JUN JUL $500,000 $700,000 $900,000 $1,100,000 $1,300,000 $1,500,000 $1,700,000 $1,900,000 $2,100,000 JUL AUG SEP OCT NOV DEC JAN FEB MAR APR MAY JUN JUL Discrepancies in previous month statistics between the August 2022 and September 2022 reports are due to the addition of Whistler, BC.
• Markets with the Highest Sales Ratio: Cleveland Suburbs (131%), Hamilton County (95%), St. Louis (91%) and Howard County (79%).
SINGLE-FAMILY HOMES
• Official Market Type: Seller's Market with a 34.84% Sales Ratio.
1Sales Ratio defines market speed and market type: Buyer's < 15.5%; Balanced >= 15.5 to < 20.5%; Seller's >= 20.5% plus. If >100%, sales from previous month exceeds current inventory. 2The luxury threshold price is set by The Institute for Luxury Home Marketing.
Median List Price $1,680,750 $1,595,000
Median SP/LP Ratio 100.00% 99.17%
• Markets with the Highest Median Sales Price: Aspen ($11,500,000), Whistler ($5,550,000), Vail ($4,550,000), and Naples ($4,200,000).
SINGLE-FAMILY HOMES MARKET SUMMARY | AUGUST 2022
Median Sale Price $1,360,697 $1,299,000
Median Price per Sq. Ft. $392 $418
• Homes are selling for an average of 99.17% of list price
Median Days on Market 13 18
Total Sold 18,947 18,001
1
Average Home Size 3,528 3,185 city benchmark prices.
A Review of Key Market Differences Year over Year August 2021 | August 2022 Median prices represent properties priced above respective
.
Total Sales Ratio 56.05% 34.84%
Total Inventory 33,805 51,674
New Listings 11,760 16,673
August 2022August 2021 August 2022August 2021 New Listings Total Sold Days on Market Sales RatioMed. Sale Price 4,913 946 $61,697 5 21.21%
• The median luxury threshold2 price is $925,000, and the median luxury home sales price is $1,299,000.
– LUXURY MONTHLY MARKET REVIEW –
Median List Price $998,585 $942,225
Median SP/LP Ratio 100.00% 98.92%
New Listings 4,137 4,841
Median Days on Market 16 18
Average Home Size 1,960 1,843
Median prices represent properties priced above respective city benchmark prices.
Median Price per Sq. Ft. $489 $527
Median Sale Price $830,000 $876,250
ATTACHED HOMES New Listings Total Sold Sales RatioMed. Sale Price 704 675 11.18% ATTACHED HOMES MARKET SUMMARY | AUGUST 20 22 • Official Market Type: Seller's Market with a 30.34% Sales Ratio.1 • Attached homes are selling for an average of 98.92% of list price. • The median luxury threshold2 price is $700,000, and the median attached luxury sale price is $876,250 • Markets with the Highest Median Sales Price: Aspen ($4,125,000), Vail ($3,250,000), Whistler ($2,342,500), and San Francisco ($2,275,000). • Markets with the Highest Sales Ratio: Santa Barbara (127%), Howard County (122%), Anne Arundel County (91%) and Sussex County Coastal (84%). 1Sales Ratio defines market speed and market type: Buyer's < 15.5%; Balanced >= 15.5 to < 20.5%; Seller's >= 20.5% plus. If >100%, sales from previous month exceeds current inventory. 2The luxury threshold price is set by The Institute for Luxury Home Marketing.
Total Sold 5,124 4,449
Days on Market 2 $46,250 A Review of Key Market Differences Year over Year August 2021 | August 2022 August 2022August 2021 August 2022August 2021
Total Sales Ratio 41.52% 30.34%
Total Inventory 12,341 14,665
– LUXURY MONTHLY MARKET REVIEW –
CA Sacramento $949,000 $915,000 668 253 339 19 Seller's
CA Silicon Valley $3,798,000 $3,287,500 486 224 268 15 Seller's
CA Ventura County $1,992,500 $1,775,000 262 82 103 28 Seller's
State Market Name
CO Boulder $2,295,000 $1,600,000 201 74 81 49 Seller's
Median prices represent properties priced above respective city benchmark prices. Prices shown for Canadian cites are shown in Canadian Dollars.
BC Vancouver $4,500,000 $3,259,000 1144 272 66 25 Buyer's
CO Aspen $14,900,000 $11,500,000 105 13 7 76 Buyer's
AZ Flagstaff $1,462,250 $1,272,500 84 24 24 50 Seller's
CA Sonoma County $2,274,500 $1,750,000 214 35 65 36 Seller's
AZ Paradise Valley $4,995,000 $3,025,000 110 27 21 74 Balanced
CA Placer County $1,195,000 $1,149,000 256 95 101 21 Seller's
BC Victoria $2,499,000 $1,950,000 139 55 23 17 Balanced
CA San Diego $2,215,000 $1,868,500 933 366 354 15 Seller's
CA San Luis Obispo County $1,875,000 $1,447,500 183 61 74 40 Seller's
CA East Bay $2,198,775 $1,869,500 534 272 412 16 Seller's
AZ Scottsdale $1,850,000 $1,755,000 630 185 153 48 Seller's
CA Los Angeles Beach Cities $5,899,000 $3,915,000 297 88 71 12 Seller's
BC Mid Vancouver Island $1,650,000 $1,465,000 231 86 24 22 Buyer's BC Okanagan Valley $1,790,000 $1,530,000 917 276 65 47 Buyer's
– LUXURY MONTHLY MARKET REVIEW –
SINGLE-FAMILY HOMES
CA Central Coast $2,850,000 $2,150,000 240 82 71 20 Seller's
CO Colorado Springs $935,000 $844,500 471 146 146 13 Seller's
CA Los Angeles The Valley $2,495,000 $2,025,500 468 187 190 20 Seller's
CA Orange County $2,689,000 $2,274,000 1012 335 383 15 Seller's
BC Whistler $4,500,000 $5,550,000 55 10 4 41 Buyer's
CA Santa Barbara $5,750,000 $3,500,000 123 48 57 11 Seller's
$1,099,999 $930,000 537 238 147 23 Seller's
AB Calgary
CA Greater Palm Springs $1,849,000 $1,599,000 213 67 78 33 Seller's
CA Lake Tahoe
AZ Mesa $847,000 $835,000 216 87 69 33 Seller's
AZ Phoenix $849,900 $787,000 873 286 272 41 Seller's
AZ Chandler and Gilbert $1,075,000 $1,000,000 265 89 72 41 Seller's
$2,250,000 $1,885,000 218 51 40 20 Balanced
CA San Francisco $4,495,000 $3,425,000 119 42 55 17 Seller's
CA Los Angeles City $4,999,000 $3,500,000 646 187 119 18 Balanced
ListMedianPrice SoldMedianPrice Inventory ListingsNew Sold Days Marketon MarketStatus
AZ Tucson $718,000 $655,000 723 237 261 15 Seller's
CA Marin County $4,122,500 $2,900,000 118 25 47 17 Seller's CA Napa County $4,309,000 $2,300,000 52 7 22 26 Seller's
ON Mississauga $2,950,000 $2,310,000 137 64 26 18 Balanced
WA King County - Greater Seattle $1,970,000 $1,695,000 1014 543 538 6 Seller's
TX Collin County $749,000 $717,786 1445 681 627 11 Seller's
GA Duluth $1,199,500 21 7 8 24
ID Northern Idaho $1,600,000 $1,325,000 515 137 58 64 Buyer's
Median prices represent properties priced above respective city benchmark prices. Prices shown for Canadian cites are shown in Canadian Dollars.
FL Orlando $1,250,000 $1,135,000 678 176 185 13
FL Boca Raton/Delray Beach $2,699,500 $2,000,000 442 109 67 23 Balanced
CO Douglas County $1,349,950 $1,167,500 264 84 140 16
TX Dallas
TX Denton County $775,786 $750,000 1101 508 425 9 Seller's
TX Houston $979,000 $880,000 1149 439 333 9 Seller's
FL Tampa $750,000 $675,000 1251 463 431 8 Seller's
UT Salt Lake City $1,132,096 $979,000 469 210 157 21 Seller's
FL Weston $1,275,000 $1,026,100 113 35 37 18
ON Oakville $2,514,900 $2,400,000 132 82 33 17 Seller's ON Toronto $3,799,444 $3,100,000 420 178 54 20 Buyer's ON Waterloo Region $1,474,000 $1,300,000 166 103 49 12 Seller's OR Portland $1,350,000 $1,075,000 615 248 283 6 Seller's QC Montreal $1,999,000 $1,600,000 363 87 16 39 Buyer's SC Hilton Head $2,095,000 $1,349,000 243 58 55 12 Seller's TN Greater Chattanooga $965,000 $824,000 180 49 43 4 Seller's TN Nashville $1,699,900 $1,355,500 653 246 220 4 Seller's
FL Marco Island $2,560,000 $2,162,500 91 15 16 54 Balanced
LUXURY MONTHLY MARKET REVIEW –
$1,749,000 $1,555,000 211 136 46 14 Seller's ON GTA - York $2,375,000 $1,880,000 563 327 137 13 Seller's ON Hamilton $1,839,500 $1,510,000 254 121 27 23 Buyer's
FL Coastal Pinellas County $2,275,000 90 18 17 35 Balanced
HI Maui $3,188,000 $1,947,500 137 32 26 81 Balanced
$6,500,000 $3,797,500 83 10 6 55 Buyer's
FL Naples $4,985,000 $4,200,000 232 35 39 29 Balanced
$1,300,000 $1,004,001 450 209 186 11 Seller's
–
DC Washington D.C. $4,495,000 $2,650,000 46 7 17 8 Seller's
SINGLE-FAMILY HOMES
FL Miami $1,950,000 $1,350,000 890 223 118 Buyer's
FL South Pinellas County $1,595,000 $1,497,500 244 71 56 17
HI Kauai $2,850,000 45 9 6 11 Buyer's
HI Oahu $3,000,000 $2,200,000 196 51 55 17
ListMedianPrice SoldMedianPrice Inventory ListingsNew Sold Days Marketon MarketStatus
ON GTA - Durham
CO Denver
VA McLean & Vienna $2,750,000 $1,850,000 147 31 61 6 Seller's
$1,545,000 $1,328,000 535 199 276 13
FL Space Coast $850,000 $770,000 339 138 153 12
CT Coastal Connecticut $2,275,000 527 119 254 26
State Market Name
FL Jacksonville Beaches $1,472,125 $1,150,000 298 91 93 30
FL Lee County $1,399,900 $1,375,000 546 141 113 24 Balanced
VA Smith Mountain Lake $1,750,000 $1,325,000 33 9 8 4 Seller's
WA Seattle $1,893,217 $1,715,000 254 140 167 6 Seller's
WA Spokane $1,150,000 $987,500 135 62 46 9 Seller's
TX El Paso $610,800 $583,000 154 53 29 15 Balanced
UT Park City $4,250,000 $3,075,000 202 57 16 7 Buyer's
CO Telluride
FL Greater Fort Lauderdale $1,055,000 297 21 Balanced
HI Island of Hawaii $1,972,500 112 19 17 26 Balanced
IL Chicago $1,498,888 $1,349,000 637 225 379
IL DuPage County $1,189,000 $955,000 313 99 161 11 Seller's
TX Fort Worth $825,000 $800,000 970 393 465 8 Seller's
ID Ada County $779,900 $759,450 985 338 316 14
DE Sussex County Coastal $1,399,950 $1,189,677 163 46 44 5
CT Central Connecticut $699,900 $619,725 375 79 276 7
FL South Walton $2,340,000 $2,100,000 400 85 59 33 Buyer's
TX San Angelo $650,000 $594,950 51 27 16 68 Seller's
VA Fairfax County $1,999,900 $1,500,000 346 113 152 7 Seller's
VA Charlottesville $1,300,000 $1,019,000 144 22 44 6 Seller's
VA Arlington & Alexandria $2,250,000 $1,850,000 77 32 49 6 Seller's
VA Richmond $799,900 $790,153 291 110 197 6 Seller's
CO Summit County 87 20 15 13
TX San Antonio $799,070 $717,515 636 262 191 16 Seller's
TX The Woodlands & Spring $809,000 $741,000 213 119 162 7 Seller's
CO Durango $1,250,000 119 22 56 Seller's
GA Atlanta $1,475,000 $1,167,500 639 234 250 8
TX Austin $1,098,222 $995,000 1242 586 354 9 Seller's
TX Lubbock $652,500 $599,950 88 34 28 50 Seller's
CO Vail $4,590,000 $4,550,000 83 15 11 31
FL Sarasota & Beaches $2,950,000 $2,200,000 251 49 49 35 Balanced
TX Greater Tyler $737,500 $611,500 148 77 48 9 Seller's
FL Palm Beach Towns $3,087,500 $2,487,500 228 46 26 17 Buyer's
SINGLE-FAMILY HOMES
NY Nassau County $1,877,500 $1,410,000 736 155 221 21
NM Taos $992,500 79 18 8 54 Buyer's
NV Las Vegas $1,650,000 790 223 108 26 Buyer's
Charlotte $1,125,000 $907,500 606 207 378 6
OH Cincinnati $874,950 $750,000 190 40 112 2 Seller's
NJ Ocean County $909,900 $830,000 470 163 153 13 Seller's
MO St. Louis 100 44 91 6
–
UT Salt Lake City $1,132,096 $979,000 469 210 157 21 Seller's
Asheville $1,000,000 $872,092 247 84 115 11
TX Dallas $1,300,000 $1,004,001 450 209 186 11 Seller's
VA Smith Mountain Lake $1,750,000 $1,325,000 33 9 8 4 Seller's
Lake Norman $1,185,000 $948,550 212 86 11 Seller's Raleigh-Durham $1,067,000 $925,000 512 173 255 4 Seller's
NY Finger Lakes $2,200,000 $1,290,000 31 12 8
TX The Woodlands & Spring $809,000 $741,000 213 119 162 7 Seller's
TX El Paso $610,800 $583,000 154 53 29 15 Balanced
MA Cape Cod $2,350,000 $1,837,500 130 30 38 21
MD Frederick County $889,000 $860,000 61 22 27 10 Seller's MD Howard County $1,149,990 $1,061,000 107 49 85 6
TX Collin County $749,000 $717,786 1445 681 627 11 Seller's
MI Monroe County $599,999 $615,000 17 5 6 19 Oakland County $725,000 $650,000 908 342 412 13 Washtenaw County $892,500 162 48 6 Seller's Wayne County
NV Lake Tahoe $3,450,000 $2,565,000 159 23 19 105 Buyer's
TX Houston $979,000 $880,000 1149 439 333 9 Seller's
$717,000 $621,250 224 92 98 9
TX Austin $1,098,222 $995,000 1242 586 354 9 Seller's
$1,150,000 $919,500 279 96 158 9
NY Staten Island $1,250,000 $1,098,000 182 39 27 40 Buyer's
LUXURY MONTHLY MARKET REVIEW –
TX Greater Tyler $737,500 $611,500 148 77 48 9 Seller's
MN Olmsted County $824,900 $670,000 75 14 27 11
ListMedianPrice SoldMedianPrice Inventory ListingsNew Sold Days Marketon MarketStatus
MD Talbot County $2,457,500 40 8 2 36 Buyer's
MD Anne Arundel County
MA South Shore 64 19 50 22
TX Denton County $775,786 $750,000 1101 508 425 9 Seller's
TX San Angelo $650,000 $594,950 51 27 16 68 Seller's
VA McLean & Vienna $2,750,000 $1,850,000 147 31 61 6 Seller's
VA Charlottesville $1,300,000 $1,019,000 144 22 44 6 Seller's
$1,000,000 $935,419 160 60 112 8
WA King County - Greater Seattle $1,970,000 $1,695,000 1014 543 538 6 Seller's
TX Fort Worth $825,000 $800,000 970 393 465 8 Seller's
WA Seattle $1,893,217 $1,715,000 254 140 167 6 Seller's
Median prices represent properties priced above respective city benchmark prices. Prices shown for Canadian cites are shown in Canadian Dollars.
IL Lake County
WA Spokane $1,150,000 $987,500 135 62 46 9 Seller's
NV Reno $1,900,000 $1,575,000 36 15 52 Buyer's
NY Suffolk County $1,950,000 $1,247,500 911 206 202 24
ON Oakville $2,514,900 $2,400,000 132 82 33 17 Seller's ON Toronto $3,799,444 $3,100,000 420 178 54 20 Buyer's ON Waterloo Region $1,474,000 $1,300,000 166 103 49 12 Seller's OR Portland $1,350,000 $1,075,000 615 248 283 6 Seller's QC Montreal $1,999,000 $1,600,000 363 87 16 39 Buyer's SC Hilton Head $2,095,000 $1,349,000 243 58 55 12 Seller's TN Greater Chattanooga $965,000 $824,000 180 49 43 4 Seller's TN Nashville $1,699,900 $1,355,500 653 246 220 4 Seller's
$1,749,000 $1,555,000 211 136 46 14 Seller's ON GTA - York $2,375,000 $1,880,000 563 327 137 13 Seller's ON Hamilton $1,839,500 $1,510,000 254 121 27 23 Buyer's
VA Fairfax County $1,999,900 $1,500,000 346 113 152 7 Seller's
IN Hamilton County $849,950 $750,000 140 48 133 5 Seller's
VA Arlington & Alexandria $2,250,000 $1,850,000 77 32 49 6 Seller's
MO Kansas City 1368 296 560 4
VA Richmond $799,900 $790,153 291 110 197 6 Seller's
UT Park City $4,250,000 $3,075,000 202 57 16 7 Buyer's
MD Worcester County $995,000 $902,500 53 13 18 38 Seller's Livingston County $707,500 121 38 40 16
State Market Name
TX Lubbock $652,500 $599,950 88 34 28 50 Seller's
MN Twin Cities $1,200,000 $973,390 691 211 276 14
MD Montgomery County $1,899,228 $1,510,000 166 45 129 Seller's
IL Will County $687,450 $625,000 230 101 9
ON GTA - Durham
ON Mississauga $2,950,000 $2,310,000 137 64 26 18 Balanced
KS Johnson County $817,160 $804,000 362 186 3 Seller's
TX San Antonio $799,070 $717,515 636 262 191 16 Seller's
MA Greater Boston $3,224,500 $2,700,000 82 18 26 Seller's
VA Smith Mountain Lake $1,750,000 $1,325,000 33 9 8 4 Seller's
TX El Paso $610,800 $583,000 154 53 29 15 Balanced
UT Salt Lake City $1,132,096 $979,000 469 210 157 21 Seller's
TX The Woodlands & Spring $849,450 $765,000 206 104 151 9 Seller's
LUXURY MONTHLY MARKET REVIEW –
State Market Name
VA Arlington & Alexandria $2,250,000 $1,850,000 77 32 49 6 Seller's
Median prices represent properties priced above respective city benchmark prices. Prices shown for Canadian cites are shown in Canadian Dollars.
ON Oakville $2,514,900 $2,400,000 132 82 33 17 Seller's ON Toronto $3,799,444 $3,100,000 420 178 54 20 Buyer's ON Waterloo Region $1,474,000 $1,300,000 166 103 49 12 Seller's OR Portland $1,350,000 $1,075,000 615 248 283 6 Seller's QC Montreal $1,999,000 $1,600,000 363 87 16 39 Buyer's SC Hilton Head $2,095,000 $1,349,000 243 58 55 12 Seller's TN Greater Chattanooga $965,000 $824,000 180 49 43 4 Seller's TN Nashville $1,699,900 $1,355,500 653 246 220 4 Seller's
TX San Angelo $649,500 $565,000 54 20 17 49
TX Greater Tyler $737,500 $611,500 148 77 48 9 Seller's
ON Waterloo Region $1,299,000 128 74 51 19
ON Mississauga $2,950,000 $2,310,000 137 64 26 18 Balanced
OR Portland $1,317,995 $1,140,500 595 200 244 9 Seller's
TX Dallas $1,300,000 $1,004,001 450 209 186 11 Seller's
SC Hilton Head $2,095,000 $1,432,500 231 38 48 11 Balanced
UT Park City $4,250,000 $3,075,000 202 57 16 7 Buyer's
ON Oakville $2,460,000 113 58 26 24 Seller's Toronto $3,798,888 341 147 67 20 Balanced
King County - Greater Seattle $1,850,000 $1,650,000 1105 480 559 11
Greater Tyler $609,500 189 109 57 16
WA Seattle $1,893,217 $1,715,000 254 140 167 6 Seller's
Collin County $750,000 $710,000 1355 620 17
McLean & Vienna $2,824,950 $1,701,849 136 35 44 13
TX Fort Worth $825,000 $800,000 970 393 465 8 Seller's
GTA - York $2,499,000 $1,809,000 470 257 182 17 Seller's Hamilton $1,849,000 245 101 31 32 Buyer's Mississauga $2,337,500 108 53 30 22
QC Montreal $1,898,000 97 91 18 61 Balanced
TX Denton County $775,786 $750,000 1101 508 425 9 Seller's
VA Smith Mountain Lake $1,637,475 24 6 13
SINGLE-FAMILY HOMES
–
TX Collin County $749,000 $717,786 1445 681 627 11 Seller's
TX The Woodlands & Spring $809,000 $741,000 213 119 162 7 Seller's
WA Spokane $1,150,000 $987,500 135 62 46 9 Seller's
ON GTA - Durham
UT Park City $4,650,000 $2,625,000 198 40 18 22 Buyer's
WA Spokane $1,162,500 $1,100,000 130 51 33 33 Seller's
TN Nashville $1,650,000 $1,246,500 626 205 210 8
TX San Angelo $650,000 $594,950 51 27 16 68 Seller's
TX Lubbock $619,000 95 50 40 56
VA Richmond $799,900 $790,153 291 110 197 6 Seller's
ListMedianPrice SoldMedianPrice Inventory ListingsNew Sold Days Marketon MarketStatus
Greater Chattanooga $998,950 $852,500 202 71 58 9
TX San Antonio $798,412 677 210 187 22
VA Fairfax County $1,999,900 $1,500,000 346 113 152 7 Seller's
Austin $1,075,713 $1,021,000 1126 347 307 18
TX Lubbock $652,500 $599,950 88 34 28 50 Seller's
TX Houston $949,989 $837,000 1071 339 285 10
VA Arlington & Alexandria $2,299,000 $1,885,000 71 24 26 9
Richmond $799,000 $775,000 304 94 179 6
TX San Antonio $799,070 $717,515 636 262 191 16 Seller's
VA Charlottesville $1,300,000 $1,019,000 144 22 44 6 Seller's
UT Salt Lake City $1,195,000 $992,500 460 186 178 22
Seattle $1,850,000 $1,718,000 235 125 132 7
Cleveland Suburbs
VA McLean & Vienna $2,750,000 $1,850,000 147 31 61 6 Seller's
Fort Worth $849,995 $799,000 890 290 435 13
WA King County - Greater Seattle $1,970,000 $1,695,000 1014 543 538 6 Seller's
$1,749,000 $1,555,000 211 136 46 14 Seller's ON GTA - York $2,375,000 $1,880,000 563 327 137 13 Seller's ON Hamilton $1,839,500 $1,510,000 254 121 27 23 Buyer's
Dallas $1,333,698 $1,095,000 398 136 183 13
Denton County 1023 324 410 14 Seller's El Paso $615,000 147 42 45 20
VA Charlottesville $1,300,000 $1,021,500 134 24 44
TX Austin $1,098,222 $995,000 1242 586 354 9 Seller's
Fairfax County $2,098,950 $1,449,900 316 90 141 11
TX Houston $979,000 $880,000 1149 439 333 9 Seller's
$650,000 $679,393 29 6 38 25 Durham $1,810,000 $1,551,750 189 118 56 18
CO Aspen $3,674,000 $4,125,000 42 11 5 67 Buyer's
CO Boulder $871,470 $1,127,500 63 28 40 67 Seller's CO Colorado Springs
BC Vancouver $1,988,500 $1,769,000 906 265 80 27 Buyer's
CA Los Angeles City $1,699,500 $1,434,000 338 122 86 24 Seller's CA Los Angeles The Valley $789,000 $825,000 153 76 83 17 Seller's
CA Santa Barbara $1,399,000 $1,625,000 11 6 14 26 Seller's CA Silicon Valley $1,699,999 $1,590,000 113 64 71 14 Seller's CA Sonoma County $834,000 $751,785 18 6 7 40 Seller's
ListMedianPrice SoldMedianPrice Inventory ListingsNew Sold Days Marketon MarketStatus
Markets with dashes do not have a significant luxury market for this report. Median prices represent properties priced above respective city benchmark prices. Prices shown for Canadian cites are shown in Canadian Dollars.
AZ Chandler and Gilbert
CA Sacramento
CA San Diego
CA Ventura County $750,000 $785,000 113 53 50 16 Seller's
AZ Tucson
AZ Phoenix
CA Marin County $1,297,500 $1,150,000 34 9 19 24 Seller's CA Napa County
$1,100,000 $1,043,500 345 163 212 12 Seller's
AZ Scottsdale $875,000 $790,000 193 63 47 34 Seller's
AZ Flagstaff
CA San Francisco $2,750,000 $2,275,000 75 16 9 35 Buyer's CA San Luis Obispo County
AZ Mesa
BC Okanagan Valley
BC Victoria $999,000 $892,500 124 72 42 16 Seller's BC Whistler $2,635,250 $2,342,500 36 9 2 62 Buyer's
CA Orange County $1,200,000 $1,160,000 368 158 220 15 Seller's CA Placer County
CA Los Angeles Beach Cities $1,897,000 $1,775,000 156 52 71 18 Seller's
State Market Name
ATTACHED HOMES
AZ Paradise Valley
CA Lake Tahoe
BC Mid Vancouver Island $848,950 $802,500 62 21 10 39 Balanced
LUXURY MONTHLY MARKET REVIEW –
CA Central Coast $1,275,000 $1,025,000 25 10 21 14 Seller's CA East Bay $999,970 $1,072,500 166 90 134 14 Seller's CA Greater Palm Springs
AB Calgary $750,000 $695,000 153 41 25 39 Balanced
$1,625,000 $880,000 25 6 3 48 Buyer's
–
ID Ada County $673,500 $607,500 59 27 14 18
UT Park City $4,250,000 $3,075,000 202 57 16 7 Buyer's
FL Coastal Pinellas County $1,396,550 $1,050,000 94 22 25 9
TX Dallas
DC Washington D.C. $1,457,500 159 43 62 11 Seller's
TX Lubbock $652,500 $599,950 88 34 28 50 Seller's
CO Summit County $1,524,000 $1,378,500 30 10 8 9 Seller's CO Telluride
TX El Paso $610,800 $583,000 154 53 29 15 Balanced
ON Oakville $2,514,900 $2,400,000 132 82 33 17 Seller's ON Toronto $3,799,444 $3,100,000 420 178 54 20 Buyer's ON Waterloo Region $1,474,000 $1,300,000 166 103 49 12 Seller's
GA Duluth
TX San Angelo $650,000 $594,950 51 27 16 68 Seller's
FL Weston
TX The Woodlands & Spring $809,000 $741,000 213 119 162 7 Seller's
FL Lee County $849,900 $825,000 215 48 68
FL Marco Island $1,749,000 $1,350,000 37 5 9 25
IL Chicago $1,275,000 739 219 144 30 Balanced
FL Palm Beach Towns $1,975,000 $1,525,500 181 32 32 25 Balanced
ON Hamilton $1,839,500 $1,510,000 254 121 27 23 Buyer's
TX Collin County $749,000 $717,786 1445 681 627 11 Seller's
TX Houston $979,000 $880,000 1149 439 333 9 Seller's
VA Charlottesville $1,300,000 $1,019,000 144 22 44 6 Seller's
WA King County - Greater Seattle $1,970,000 $1,695,000 1014 543 538 6 Seller's
CT Central Connecticut
–
FL Greater Fort Lauderdale $849,450 $735,000 860 220 167 27 Balanced
FL Sarasota & Beaches $1,692,500 $1,375,000 126 24 17 Balanced
ON Mississauga $2,950,000 $2,310,000 137 64 26 18 Balanced
FL Jacksonville Beaches $930,000 38 14 14 22
FL Space Coast $824,900 $685,000 24 41 13
FL Tampa $774,500 $667,000 187 68 51 9 Seller's
ID Northern Idaho
VA Arlington & Alexandria $2,250,000 $1,850,000 77 32 49 6 Seller's
IL DuPage County $990,000 $675,000 21 7 11 5 Seller's
VA McLean & Vienna $2,750,000 $1,850,000 147 31 61 6 Seller's
CO Durango $793,905 $910,000 18 2 15 51 Seller's
HI Maui $2,125,000 $1,672,500 76 19 28 97
$1,300,000 $1,004,001 450 209 186 11 Seller's TX Denton County $775,786 $750,000 1101 508 425 9 Seller's
FL South Pinellas County $1,122,800 $900,000 175 47 48 12
ATTACHED HOMES
HI Kauai $1,592,000 42 9 15 14
FL South Walton $1,550,000 $1,150,000 225 43 27 24 Buyer's
HI Oahu $1,175,000 $905,000 383 87 85 18
$749,900 $601,410 425 158 178 18
$1,530,000 $1,483,750 47 7 16 8
Markets with dashes do not have a significant luxury market for this report. Median prices represent properties priced above respective city benchmark prices. Prices shown for Canadian cites are shown in Canadian Dollars.
WA Spokane $1,150,000 $987,500 135 62 46 9 Seller's
$1,749,000 $1,555,000 211 136 46 14 Seller's
CO Vail $3,250,000 51 4 3 9
VA Smith Mountain Lake $1,750,000 $1,325,000 33 9 8 4 Seller's
ListMedianPrice SoldMedianPrice Inventory ListingsNew Sold Days Marketon MarketStatus
State Market Name
VA Richmond $799,900 $790,153 291 110 197 6 Seller's
CO Denver $917,500 $720,313 140 43 44 11
WA Seattle $1,893,217 $1,715,000 254 140 167 6 Seller's
DE Sussex County Coastal $975,000 $779,316 19 9 16 7
LUXURY MONTHLY MARKET REVIEW –
FL Boca Raton/Delray Beach $865,125 280 100 57 18 Balanced
FL Naples $2,345,000 $1,800,000 129 30 35 26
TX Greater Tyler $737,500 $611,500 148 77 48 9 Seller's
GA Atlanta
OR Portland $1,350,000 $1,075,000 615 248 283 6 Seller's QC Montreal $1,999,000 $1,600,000 363 87 16 39 Buyer's SC Hilton Head $2,095,000 $1,349,000 243 58 55 12 Seller's TN Greater Chattanooga $965,000 $824,000 180 49 43 4 Seller's TN Nashville $1,699,900 $1,355,500 653 246 220 4 Seller's TX Austin $1,098,222 $995,000 1242 586 354 9 Seller's
CT Coastal Connecticut $1,495,000 $853,000 154 18 52 24
UT Salt Lake City $1,132,096 $979,000 469 210 157 21 Seller's
ON GTA - Durham
ON GTA - York $2,375,000 $1,880,000 563 327 137 13 Seller's
TX Fort Worth $825,000 $800,000 970 393 465 8 Seller's
TX San Antonio $799,070 $717,515 636 262 191 16 Seller's
VA Fairfax County $1,999,900 $1,500,000 346 113 152 7 Seller's
FL Miami $1,450,000 $1,150,000 1225 218 121 43 Buyer's
FL Orlando $565,000 $560,500 204 61 69
HI Island of Hawaii
CO Douglas County $549,990 $587,450 25 7 13 14
VA McLean & Vienna $2,750,000 $1,850,000 147 31 61 6 Seller's
NV Reno
TX Lubbock $652,500 $599,950 88 34 28 50 Seller's TX San Angelo $650,000 $594,950 51 27 16 68 Seller's
MD Howard County
MD Montgomery County $788,700 $766,000 100 12
MO St. Louis
MD Worcester County $681,750 44 14 23 24 Livingston County Monroe County
MD Anne Arundel County $577,000 $576,000 55 30 50
NV Lake Tahoe $1,294,500 $1,225,500 32 4 8 70
OH Cincinnati $674,900 $720,000 17 1 10 61 Seller's
ON GTA - Durham
ON Waterloo Region $1,474,000 $1,300,000 166 103 49 12 Seller's
NY Nassau County $1,561,944 $1,202,500 80 15 32 29
ON Mississauga $2,950,000 $2,310,000 137 64 26 18 Balanced
WA Spokane $1,150,000 $987,500 135 62 46 9 Seller's
MA Cape Cod $797,500 $910,000 22 1 9 22
NC Charlotte $650,000 $618,898 170 35 96 15
NM Taos
LUXURY MONTHLY MARKET REVIEW –
VA Arlington & Alexandria $2,250,000 $1,850,000 77 32 49 6 Seller's
ON GTA - York $2,375,000 $1,880,000 563 327 137 13 Seller's
Oakland County $692,000 $615,000 72 22 17 16 Washtenaw County $627,450 $599,000 54 15 18 27 Seller's Wayne County $649,900 $550,510 92 21 9 7 Buyer's MN Olmsted County
VA Smith Mountain Lake $1,750,000 $1,325,000 33 9 8 4 Seller's
VA Fairfax County $1,999,900 $1,500,000 346 113 152 7 Seller's
–
TX Fort Worth $825,000 $800,000 970 393 465 8 Seller's TX Greater Tyler $737,500 $611,500 148 77 48 9 Seller's TX Houston $979,000 $880,000 1149 439 333 9 Seller's
TX San Antonio $799,070 $717,515 636 262 191 16 Seller's
IL Will County
NC Raleigh-Durham
MA Greater Boston $2,482,500 $1,997,500 256 50 78 21 Seller's
KS Johnson County $611,663 $595,509 110 29 25 3 Seller's
NY Staten Island $615,000 $630,000 96 35 37 26
WA Seattle $1,893,217 $1,715,000 254 140 167 6 Seller's
NC Lake Norman $598,711 $625,000 23 7 13 18 Seller's
State Market Name
WA King County - Greater Seattle $1,970,000 $1,695,000 1014 543 538 6 Seller's
MA South Shore $837,450 $825,000 16 7 13 20
TN Greater Chattanooga $965,000 $824,000 180 49 43 4 Seller's TN Nashville $1,699,900 $1,355,500 653 246 220 4 Seller's TX Austin $1,098,222 $995,000 1242 586 354 9 Seller's
MO Kansas City
MD Frederick County
TX The Woodlands & Spring $809,000 $741,000 213 119 162 7 Seller's UT Park City $4,250,000 $3,075,000 202 57 16 7 Buyer's
MD Talbot County
NJ Ocean County $882,500 $820,000 48 19 17 17
IL Lake County
TX Collin County $749,000 $717,786 1445 681 627 11 Seller's TX Dallas $1,300,000 $1,004,001 450 209 186 11 Seller's TX Denton County $775,786 $750,000 1101 508 425 9 Seller's
OR Portland $1,350,000 $1,075,000 615 248 283 6 Seller's QC Montreal $1,999,000 $1,600,000 363 87 16 39 Buyer's SC Hilton Head $2,095,000 $1,349,000 243 58 55 12 Seller's
ON Hamilton $1,839,500 $1,510,000 254 121 27 23 Buyer's
VA Charlottesville $1,300,000 $1,019,000 144 22 44 6 Seller's
ATTACHED HOMES
$600,000 $599,990 27 20 33 7
ListMedianPrice SoldMedianPrice Inventory ListingsNew Sold Days Marketon MarketStatus
VA Richmond $799,900 $790,153 291 110 197 6 Seller's
MN Twin Cities
TX El Paso $610,800 $583,000 154 53 29 15 Balanced
UT Salt Lake City $1,132,096 $979,000 469 210 157 21 Seller's
NY Finger Lakes
Markets with dashes do not have a significant luxury market for this report. Median prices represent properties priced above respective city benchmark prices. Prices shown for Canadian cites are shown in Canadian Dollars.
NC Asheville $577,500 25 6 15 24
NV Las Vegas
$1,749,000 $1,555,000 211 136 46 14 Seller's
ON Oakville $2,514,900 $2,400,000 132 82 33 17 Seller's ON Toronto $3,799,444 $3,100,000 420 178 54 20 Buyer's
IN Hamilton County
NY Suffolk County $769,000 165 47 56 28
ListMedianPrice SoldMedianPrice Inventory ListingsNew Sold Days Marketon MarketStatus
ON Waterloo Region $847,400 $750,000 23 20 11 25
San Antonio
Arlington & Alexandria $955,000 $992,500 88 40 68 12
VA Fairfax County $1,999,900 $1,500,000 346 113 152 7 Seller's
WA Spokane
GTA - York $789,000 $760,444 261 164 88 18 Seller's Hamilton $929,450 $872,500 18 16 8 19 Seller's
El Paso
Dallas $744,950 $630,000 114 41 50 11 Denton County
VA Charlottesville $1,300,000 $1,019,000 144 22 44 6 Seller's
$1,749,000 $1,555,000 211 136 46 14 Seller's
ON Mississauga $2,950,000 $2,310,000 137 64 26 18 Balanced
King County - Greater Seattle $1,124,000 $1,000,000 253 91 100 8
ON Oakville $1,239,000 27 15 6 22 Seller's Toronto $1,150,000 674 374 170
Markets with dashes do not have a significant luxury market for this report. Median prices represent properties priced above respective city benchmark prices. Prices shown for Canadian cites are shown in Canadian Dollars.
$745,000 $623,250 33 7 4 199 Buyer's The Woodlands & Spring Park City $1,895,000 $2,077,500 99 28 26 13
TX Lubbock $652,500 $599,950 88 34 28 50 Seller's TX San Angelo $650,000 $594,950 51 27 16 68 Seller's
OR Portland $1,350,000 $1,075,000 615 248 283 6 Seller's QC Montreal $1,999,000 $1,600,000 363 87 16 39 Buyer's SC Hilton Head $2,095,000 $1,349,000 243 58 55 12 Seller's
VA Arlington & Alexandria $2,250,000 $1,850,000 77 32 49 6 Seller's
ON Hamilton $1,839,500 $1,510,000 254 121 27 23 Buyer's
SC Hilton Head $1,045,000 $1,000,000 40 7 11 Seller's Greater Chattanooga
WA Spokane $1,150,000 $987,500 135 62 46 9 Seller's
ON Mississauga $969,000 $917,500 129 77 32 21
ON GTA - Durham
Charlottesville $759,900 $666,013 31 13 10 29
TX San Antonio $799,070 $717,515 636 262 191 16 Seller's
Seattle $1,495,000 $1,235,000 121 31 22 7 Balanced
VA McLean & Vienna $2,750,000 $1,850,000 147 31 61 6 Seller's
TN Greater Chattanooga $965,000 $824,000 180 49 43 4 Seller's TN Nashville $1,699,900 $1,355,500 653 246 220 4 Seller's TX Austin $1,098,222 $995,000 1242 586 354 9 Seller's
LUXURY MONTHLY MARKET REVIEW –
ON Oakville $2,514,900 $2,400,000 132 82 33 17 Seller's ON Toronto $3,799,444 $3,100,000 420 178 54 20 Buyer's
Durham $829,450 $825,000 28 15 11 11
Fort Worth Greater Tyler
WA Seattle $1,893,217 $1,715,000 254 140 167 6 Seller's
VA Smith Mountain Lake
TX The Woodlands & Spring $809,000 $741,000 213 119 162 7 Seller's UT Park City $4,250,000 $3,075,000 202 57 16 7 Buyer's
ON GTA - York $2,375,000 $1,880,000 563 327 137 13 Seller's
ATTACHED HOMES
TX El Paso $610,800 $583,000 154 53 29 15 Balanced
TX Fort Worth $825,000 $800,000 970 393 465 8 Seller's TX Greater Tyler $737,500 $611,500 148 77 48 9 Seller's TX Houston $979,000 $880,000 1149 439 333 9 Seller's
State Market Name
Richmond
VA Smith Mountain Lake $1,750,000 $1,325,000 33 9 8 4 Seller's
ON Waterloo Region $1,474,000 $1,300,000 166 103 49 12 Seller's
–
San Angelo
OR Portland $742,450 $589,000 204 69 76 18 Seller's
TX Collin County $749,000 $717,786 1445 681 627 11 Seller's TX Dallas $1,300,000 $1,004,001 450 209 186 11 Seller's TX Denton County $775,786 $750,000 1101 508 425 9 Seller's
UT Salt Lake City $1,132,096 $979,000 469 210 157 21 Seller's
VA Richmond $799,900 $790,153 291 110 197 6 Seller's
Collin County
Cleveland Suburbs
QC Montreal $1,501,291 $1,400,000 90 11 55 Buyer's
Fairfax County $775,000 $690,000 213 101 139 15 McLean & Vienna $1,112,475 $1,025,000 32 8 16 22
WA King County - Greater Seattle $1,970,000 $1,695,000 1014 543 538 6 Seller's
TN Nashville $739,000 $660,000 117 39 60 6 Seller's Austin $750,000 243 83 53 15
Houston $586,570 135 19 Balanced Lubbock
UT Salt Lake City $596,950 $555,000 170 68 73 25
SCOTTSDALEARIZONA
2022 SEPTEMBER
$1,150,000 - $1,199,999
$3,900,000 - $4,499,999
$1,400,000 - $1,499,999
$1,700,000 - $1,899,999
$1,100,000 - $1,149,999
$2,300,000 - $2,699,999
$2,700,000 - $3,099,999
$1,900,000 - $2,299,999
$1,250,000 - $1,299,999
$4,500,000+
68 32 28 31 40 49 53 47 73 36 49 41 16 46 21 7 5 9 7 6 8 19 24 20 11 9 8 7 7 6
$3,500,000 - $3,899,999
InventorySales Square-Range-Feet3 -MedianPriceSold- -MedianBedsSold- -MedianBathsSold- -Total-Sold Inventory-Total- Sales -Sold/Inventory-Ratio 0 - 3,499 $1,381,339 4 3 54 261 21% 3,500 - 4,499 $1,772,500 4 4 62 183 34% 4,500 - 5,499 $2,747,500 5 5 18 78 23% 5,500 - 6,499 $3,675,000 5 6 8 50 16% 6,500 - 7,499 $3,775,000 6 7 4 30 13% 7,500+ $5,260,000 5 7 7 28 25% SCOTTSDALE SINGLE FAMILY HOMES LUXURY INVENTORY VS. SALES | AUGUST 2022 Luxury Benchmark Price 1: $1,100,000 Seller's Market630Total Inventory: 153Total Sales: 24%Total Sales Ratio2: 1 The luxury threshold price is set by The Institute for Luxury Home Marketing. 2Sales Ratio defines market speed and market type: Buyer's < 14.5%; Balanced >= 14.5 to < 20.5%; Seller's >= 20.5% plus. If >100% MLS® data reported previous month’s sales exceeded current inventory.
$3,100,000 - $3,499,999
$1,500,000 - $1,699,999
$1,200,000 - $1,249,999
$1,300,000 - $1,399,999
MEDIAN DATA REVIEW | AUGUST 13 - MONTH LUXURY MARKET TREND 4 SoldsMedian Sales Price Inventory 307 292 297 266 241 217 218 256 323 480 625 639 630 174 181 185 186 214 180 215 297 295 269 234 143 153 $1,577,768 $1,500,000 $1,575,100 $1,487,500 $1,675,000 $1,682,500 $1,675,000 $1,615,000 $1,600,000 $1,640,000 $1,664,781 $1,615,600 $1,755,000 Aug-21Sep-21Oct-21 Nov-21 Dec-21Jan-22Feb-22Mar-22Apr-22 May-22 Jun-22Jul-22 Aug-22 3Square foot table does not account for listings and solds where square foot data is not disclosed. 4Data reported includes Active and Sold properties and does not include Pending properties. • The Scottsdale single-family luxury market is a Seller's Market with a 24% Sales Ratio. • Homes sold for a median of 96.47% of list price in August 2022. • The most active price band is $1,700,000-$1,899,999, where the sales ratio is 51% • The median luxury sales price for single-family homes is $1,755,000. • The median days on market for August 2022 was 48 days, up from 37 in August 2021. SCOTTSDALE SINGLE FAMILY HOMES SCOTTSDALE MARKET SUMMARY | AUGUST 2022 VARIANCE: 105 % 307630 Aug. 2021Aug. 2022 TOTAL INVENTORY VARIANCE: 12 % 174153 TOTAL SOLDS VARIANCE: 11 % $1.58m $1.76m SALES PRICE VARIANCE: 30 % 3748 DAYS ON MARKET VARIANCE: 3 % 99.18% 96.47% SALE TO LIST PRICE RATIO VARIANCE: 18 % $404 $478 SALE PRICE PER SQFT. Aug. 2021Aug. 2022 Aug. 2021Aug. 2022 Aug. 2021Aug. 2022 Aug. 2021Aug. 2022 Aug. 2021Aug. 2022
-
$1,000,000
$1,600,000 - $1,999,999
8 7 9 9 21 11 7 9 7 15 9 23 17 27 14 0 0 1 4 3 2 2 1 3 5 2 7 5 8 4 $3,000,000+
$2,500,000 $2,999,999
$1,200,000 - $1,599,999
-
$2,000,000 $2,499,999
$1,100,000 - $1,199,999
$600,000$650,000$700,000$750,000$800,000$850,000$900,000$950,000$1,099,999-$999,999-$949,999-$899,999-$849,999-$799,999-$749,999-$699,999-$649,999 InventorySales SCOTTSDALE ATTACHED HOMES Square-Range-Feet3 -MedianPriceSold- -MedianBedsSold- -MedianBathsSold- -Total-Sold Inventory-Total- Sales -Sold/Inventory-Ratio 0 - 1,499 $707,500 2 2 6 42 14% 1,500 - 1,999 $760,000 2 2 23 68 34% 2,000 - 2,499 $910,000 3 3 12 51 24% 2,500 - 2,999 $1,040,109 3 3 5 16 31% 3,000 - 3,499 $1,100,000 3 4 1 11 9% 3,500+ NA NA NA 0 5 0% LUXURY INVENTORY VS. SALES | AUGUST 2022 Luxury Benchmark Price 1: $600,000 Seller's Market193Total Inventory: 47Total Sales: 24%Total Sales Ratio2: 1 The luxury threshold price is set by The Institute for Luxury Home Marketing. 2Sales Ratio defines market speed and market type: Buyer's < 14.5%; Balanced >= 14.5 to < 20.5%; Seller's >= 20.5% plus. If >100% MLS® data reported previous month’s sales exceeded current inventory.
83 85 78 78 64 71 79 87 113 139 213 202 193 60 48 62 72 82 66 68 107 107 112 90 44 47 $750,000$749,975 $774,000 $781,000 $805,000 $792,500 $780,000 $785,000 $830,000 $820,000 $786,500 $799,500 $790,000 Aug-21Sep-21Oct-21 Nov-21 Dec-21Jan-22Feb-22Mar-22Apr-22 May-22 Jun-22Jul-22 Aug-22 SoldsSale Price Inventory 3Square foot table does not account for listings and solds where square foot data is not disclosed. 4Data reported includes Active and Sold properties and does not include Pending properties. 13 - MONTH LUXURY MARKET TREND 4 VARIANCE: 133 % 83193 VARIANCE: 22 % 6047 VARIANCE: 5 % $750k $790k SALES PRICE VARIANCE: 6 % 3234 DAYS ON MARKET VARIANCE: 2 % 100.00% 97.83% SALE TO LIST PRICE RATIO VARIANCE: 10 % $386 $425 SALE PRICE PER SCOTTSDALESQFT. MARKET SUMMARY | AUGUST 2022 SCOTTSDALE ATTACHED HOMES • The Scottsdale attached luxury market is a Seller's Market with a 24% Sales Ratio. • Homes sold for a median of 97.83% of list price in August 2022. • The most active price band is $1,600,000-$1,999,999, where the sales ratio is 44% • The median luxury sales price for attached homes is $790,000. • The median days on market for August 2022 was 34 days, up from 32 in August 2021. Aug. 2021Aug. 2022 Aug. 2021Aug. 2022 Aug. 2021Aug. 2022 Aug. 2021Aug. 2022 Aug. 2021Aug. 2022 Aug. 2021Aug. 2022 MEDIAN DATA REVIEW | AUGUST TOTAL INVENTORY TOTAL SOLDS
Patricia Cain Designated Owner7633 E Acoma Dr., 104 - Scottsdale, AZ 85260 480-490-9269 Email: connect@ateam.realestate - www.ascend.realty BrittanyThomas REALTOR®