


Designated Owner7633 E Acoma Dr., 104 - Scottsdale, AZ 85260 480-490-9269 Email: connect@ateam.realestate - www.ascend.realty BrittanyThomas REALTOR® Luxury Market LuxuryMarket LuxuryMarket LuxuryMarket REPORT OCTOBER 2022


It takes a special kind of dedication to be recognized as one of the top agents in Arizona and the United States. Patricia Cain, Owner of RE/MAX Ascend Realty and RE/MAX Ascend Commercial Realty has earned this distinction and possesses a high level of local market understanding and a commitment to client service.


Her sales record set the tone. Patricia has closed on over $200 million in sales throughout her 20+ year career of marketing and selling multiple types of Arizona Real Estate including luxury homes, single family homes, condominiums, commercial buildings, and land.


Firsthand knowledge of Maricopa County history — from its beginning development to its current reputation as being one of top places people move to most frequently across the United States. Her insight comes from experience. She was born and raised in Chicago, IL, and moved to Arizona in 1985 after becoming legally emancipated at 16. Entrepreneurial at heart, Patricia worked for smaller companies and assisted them with company growth and perfecting client experiences. She began her own company which she ran for a decade. When she got into real estate, she began to do the same thing but on a much different scale. Since then, she now owns 2 RE/MAX franchises and feels this is where she is most fulfilled, as she can help agents grow and assist more clients with their real estate desires, whether that be residential or commercial.
After 10 years of company ownership, Patricia began building a team with Brittany Thomas, who has a decade long background serving customers and client relations. Working closely together as a team has allowed them to best serve clients and to ensure someone is always available to meet their real estate needs.
Clients routinely return to Patricia for later transactions. They find value in her negotiating skills, uncompromising standards and exemplary personal attention. Over the course of her decorated career, Patricia has furthermore been named as one of the best Real Estate Agents in Arizona and America multiple years in a row.
Outreach in the community is also a paramount priority for Patricia. She has coordinated multiple fundraisers for pet adoptions, hydrocephalus, Phoenix Children’s hospital, food banks, and debt collection just to name a few. But her true passion in outreach lies with in keeping animals off the streets and out of shelters. She and her team regularly coordinate donations to pet rescue and resources.
In her free time, Patricia loves helping small businesses grow by assisting other small companies with growth strategies, business setup and design. She also loves traveling, jewelry making, the arts, and focusing on health and personal growth.
are

to help
buying or
look
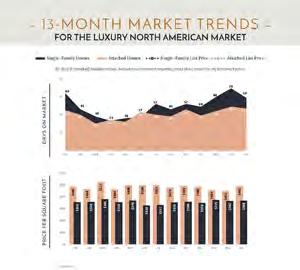


TheInstituteforLuxuryHomeMarketinghasanalyzedanumberofmetrics—includingsales prices,salesvolumes,numberofsales,sales-price-to-list-priceratios,daysonmarketand price-per-square-foot–toprovideyouacomprehensiveNorthAmericanLuxuryMarketreport.
Additionally,wehavefurtherexaminedalloftheindividualluxurymarketstoprovidebothan overviewandanin-depthanalysis-including,wheredataissufficient,abreakdownbyluxury single-familyhomesandluxuryattachedhomes.
Itisourintentiontoincludeadditionalluxurymarketsonacontinualbasis.Ifyourmarketis notfeatured,pleasecontactussowecanimplementthenecessaryqualificationprocess.More in-depthreportsontheluxurycommunitiesinyourmarketareavailableaswell.
Lookingthroughthisreport,youwillnoticethreedistinctmarketstatuses,Buyer'sMarket, Seller'sMarket,andBalancedMarket.A Buyer's Market indicatesthatbuyershavegreater controloverthepricepoint.Thismarkettypeisdemonstratedbyasubstantialnumberof homesonthemarketandfewsales,suggestingdemandforresidentialpropertiesisslowfor thatmarketand/orpricepoint.
Bycontrast,a Seller's Market givessellersgreatercontroloverthepricepoint.Typically,this meanstherearefewhomesonthemarketandagenerousdemand,causingcompetitionbetween buyerswhoultimatelydrivesalespriceshigher.
A Balanced Market indicatesthatneitherthebuyersnorthesellerscontrolthepricepointat whichthatpropertywillsellandthatthereisneitheraglutnoralackofinventory.Typically, thistypeofmarketseesastabilizationofboththelistandsoldprice,thelengthoftimethe propertyisonthemarketaswellastheexpectancyamongsthomeownersintheirrespective communities–solongastheirhomeispricedinaccordancewiththecurrentmarketvalue.
REMAININGINVENTORY:Thetotalnumberofhomesavailableatthecloseofamonth.
DAYSONMARKET:Measuresthenumberofdaysahomeisavailableonthemarketbeforea purchaseofferisaccepted.
LUXURYBENCHMARKPRICE:Thepricepointthatmarksthetransitionfromtraditionalhomes toluxuryhomes.
NEWLISTINGS:Thenumberofhomesthatenteredthemarketduringthecurrentmonth.
PRICEPERSQUAREFOOT:Measuresthedollaramountofthehome'spriceforanindividual squarefoot.
SALESRATIO:SalesRatiodefinesmarketspeedanddetermineswhetherthemarketcurrently favorsbuyersorsellers.Buyer'sMarket=upto14%;BalancedMarket=15to20%;Seller's Market=21%plus.If>100%,salesfrompreviousmonthexceedcurrentinventory.
SP/LPRATIO:TheSalesPrice/ListPriceRatiocomparesthevalueofthesoldpricetothevalue ofthelistprice.
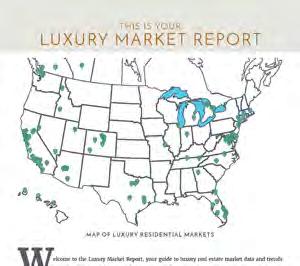
elcome to the Luxury Market Report, your guide to luxury real estate market data and trends for North America. Produced monthly by The Institute for Luxury Home Marketing, this report provides an in-depth look at the top residential markets across the United States and Canada. Within the individual markets, you will find established luxury benchmark prices and detailed survey of luxury active and sold properties designed to showcase current market status and recent trends. The national report illustrates a compilation of the top North American markets to review overall standards and trends.
Copyright © 2022 Institute for Luxury Home Marketing | www.luxuryhomemarketing.com | 214.485.3000
The Luxury Market Report is a monthly analysis provided by The Institute for Luxury Home Marketing. Luxury benchmark prices are determined by The Institute. This active and sold data has been provided by REAL Marketing, who has compiled the data through various sources, including local MLS boards, local tax records and Realtor.com. Data is deemed reliable to the best of our knowledge, but is not guaranteed.
Itishardtopicturethatlessthan12monthsago,theluxuryrealestatemarketwasonastrong upwardtrajectory,consistentlyseeingdemandincrease,pricessoar,andinventorylevelsfall.
Eventhoughwerealizedthatthistrendcouldnotcontinueinfinitely,thespeedatwhichthemarket appearedtoturninMay2022seemedalmostasdramaticastheupswinginMay2020atthestartof thepandemic.
Althoughthetableschangedearlierthissummer,withthenumberofhomeslistedforsaleclimbing forthefirsttimesincethestartofthepandemic,therewasstillafeelingthatwhiletherewouldbea transition,itwouldbemoregradual,eventuallysettlingintoatraditionallypacedmarket.
Instead,whatwesawoverthelastfewmonthswasaturmoilofdifferingopinionsaboutthecurrent status,mediahypeofdoomandgloom,andexpertcontradictionsaboutthefutureoftheluxuryreal estatemarket.
Thesimpletruthisthatboththeeconomyandtherealestatemarketareinastateofunpredictable flux,wheneventraditionalmethods,suchasraisinginterestrates,arenotachievingthedesired resultsasinflationincreases.InSeptember,U.S.inflationroseto6.6%;inCanada,itiscurrently7%.
Insomelocations,weseethesevereimpactofthisincreaseininterestratesonthenumberofsales, whereas,inothers,thelackofinventoryisstillplayingheavilyintheseller’sfavor.Somebuyersare feelingtheaffordabilitysqueezebecauseoftheadditionalincreaseinthecostofborrowing.Yet,with veryfewsellersneedingtoputtheirhomesonthemarket,inventorylevelsremainhistoricallylow, leavingevencashbuyerswithoutthenegotiatingpowertypicallyexpectedinatransitioningmarket.
Therealityisthefactorsofhowbuyersandsellersarereactingcombinedwithinfluencesfrom outsidetheindustryarecreatingconflictingmessagesthatareresultinginstrangetimesthroughout therealestatemarket.
ItmaybeasurprisetodiscoverthatouranalysisforSeptembershowsthatmanymarketsremain favorabletosellersforbothluxurysingle-familyandattachedproperties.
Lastmonthwereportedthat106ofour140single-familymarketswerestillfavorabletosellers. While16havetransitionedtobalanced–wherethemarketisequallyfavorabletosellersasitisto buyers–90remainseller’smarkets.
Intheattachedmarket,ofthe96marketsreportedonbytheInstitute,77remainseller’smarkets. Itseemsthattherearestillplentyofbuyers–indeed,asurveybyBankofAmericafoundthatthe youngandwealthypreferassetslikecryptocurrency,realestate,andprivateequityoverinvesting inthestockmarket.
“Individualsages21to42withatleast$3millioninassetshaveonlyaquarteroftheirportfolioin equities,comparedwithmorethanhalfforthosewhoareolder”,accordingtothestudy.
Thisissignificant,especiallyforthefuture,asBabyBoomersareestimatedtotransferover$84 trillionoftheirwealthtoGenerationXandmillennialsbetweennowand2045,accordingtomarket researchbyCerulliAssociates.
Comingbacktothecurrentstatus,itisimportanttorealizethatmostluxurymarketsarestartingor transitioningtowardmorefavorableconditionsforbuyersasinventorylevelssteadilyclimbmonth overmonth.
AsofSeptember,thesalesratio,whichmeasuresthemonthlysalesagainsttheremainingactive listingsattheendofthemonthforbothsingle-familyhomeandattachedpropertymarkets,sawa furthershiftdownwardstowardsthe21%thresholdmark,whichsignifiesachangefromsellertoa balancedmarket.

However,thereisananomalyintheclaimthatinventorylevelsarerising–therealityisthatthey arealsoincreasingbecausehomesarestayingonthemarketlonger.Morechoicehasslowedthe velocityofsalescomparedto2021,butthelackofnewinventoryhasequallyslowed.

September’sincreaseinnewinventoryistypicallyoneofthelargestofthecalendaryear,escalatedby individualsreturningfromthevacationseasonwithnewplans;itkicksoffthesecondbusiestseason inrealestate.WhiletheactualnumberofpropertiesforsaleinSeptember2022rosesignificantly comparedtoSeptember2021,anincreaseofjust6%fromAugust2022iswellunderthetraditional expectednormsofa12-18%increasebetweenthesetwomonths.
Butitwouldbeunrealistictoexpecttheextraordinaryresultsof2021,wherethenumberofsaleswas greaterthantheremaininginventoryeachmonth.Norshouldweexpecttoseemanysalesclosing overtheaskingpriceandevenfewermultipleoffers–alltypifyingadirectionaltransitiontowarda morebalancedmarket.
Giventhetimeofyear,thecurrenteconomicinfluences,andtheuncertaintysurroundingrealestate demand,itisstillhardtopredictwhenoreveniftheluxurymarketwillfullybecomeabuyer’smarket.
September’snumbersindicateanoverallshift.However,asweheadtowardsthewintermonths whentypically,lessinventoryentersthemarket,wemayseethatratioclimbbackup,especiallyif currentsellerswhosepropertieshavebeenonthemarketforsometimestarttodroptheirprices furtherandattractmoresales.
Muchmightalsodependonwhetherweenterarecession.Currently,interestratesbeinghiked, stockmarketsfalling,andcompaniesscalingbacktheirworkforcearecausinghomebuyerstoputon thebrakes.
But,ifwedogointoarecession,interestratehikeswillbelesslikelyasgovernmentswilllookfor peopletostartspendingagaintodrivetheeconomy.Thiswillmeanthecostofborrowingmoney willeitherstallatitspresentrateorevenfall,creatingmorefavorableconditionsforpurchasingreal estateagain.
Allthisspeculationtranslatesintoadisconnectwithinthemarket,especiallywheresellersarenot readytodroptheirpricesandbuyersarelookingtonegotiate.Butwhileeconomistsandrealestate expertsdebatethefuture,itisobviousthattheluxuryrealestatemarkethasstartedtogothrougha correction,anditsoverallstatushasshifteddirection.
Thoselookingforinvestmentopportunitiesarefocusingonthenewerandsecondhomemarkets, whichsawsomeofthebiggestpriceincreasesduringthepandemic,asindicationsarethatprices, althoughnotlowerthanSeptember2021,havedecreasedinthelastsixmonths.
Contrarytothis,othermarketsareseeingtheirsellersholdoff,notwantingtotradetheirlow mortgageratesforconsiderablyhigherones,orrealizingtheyhavemissedthepeak,theyaresimply notputtingtheirhomesupforsale.Thismeansthatinventorylevelsarenotincreasingatthe expectedrate,whichwillslowthefallofhomepricesforthesemarkets.
Equally,thereisstillahousingshortageinmanyluxurymarkets,albeitahighlyvariedonedepending onthelocationandpricepoint.However,incertainhigh-demandcommunities,theresimplyisn’t anyinventoryavailablebecauseitwasallsnappedupduringthelasttwoyears.
Onethingiscertain,nowmorethanever,itisimportanttoworkwithaluxurypropertyspecialist toascertainwhatistrulyhappeninginyourlocalmarketplace.Theartofsellingandbuyinginthis marketneedsacriticalandanalyticalapproach;understandingtherealitiesandsettingexpectations accordinglywillensurethatgoalsareachieved.

ABCalgary$1,100,000$960,00055726414224Seller's AZChandlerandGilbert$1,069,850$970,000269878248Seller's AZFlagstaff$1,397,000$1,182,00094231481Buyer's AZMesa$847,000$830,000236717042Seller's AZParadiseValley$4,999,000$3,600,000133311544Buyer's AZPhoenix$850,000$775,00093531727545Seller's AZScottsdale$1,850,000$1,570,00073723113949Balanced AZTucson$699,900$640,00085027922312Seller's BCMidVancouverIsland$1,599,900$1,440,000199691522Buyer's BCOkanaganValley$1,779,500$1,587,5009282436541Buyer's BCVancouver$4,480,000$3,638,80011873125917Buyer's BCVictoria$2,299,000$2,067,000136672749Balanced
BCWhistler$4,500,000$5,815,0005211497Buyer's CACentralCoast$2,755,000$2,600,000245807213Seller's CAEastBay$2,195,000$1,920,00052729539716Seller's CAGreaterPalmSprings$1,895,000$1,567,5002981517037Seller's CALakeTahoe$2,495,000$1,697,500194303828Balanced CALosAngelesBeachCities$5,997,000$4,260,0003041027717Seller's CALosAngelesCity$4,995,000$3,405,00068421912024Balanced
CALosAngelesTheValley$2,458,888$2,100,00050721314024Seller's CAMarinCounty$3,895,000$2,950,000136203011Seller's CANapaCounty$4,750,000$2,650,000117162020Balanced
CAOrangeCounty$2,549,000$2,212,500103133637019Seller's CAPlacerCounty$1,159,000$1,082,500274868823Seller's CASacramento$945,000$905,00071128425518Seller's CASanDiego$2,099,000$1,850,000114443930319Seller's CASanFrancisco$4,497,500$3,182,500166664814Seller's CASanLuisObispoCounty$1,799,000$1,395,000161507237Seller's CASantaBarbara$6,495,000$3,537,500127444016Seller's CASiliconValley$3,950,000$3,350,00052626624512Seller's CASonomaCounty$2,500,000$1,625,000225434732Balanced
CAVenturaCounty$2,074,000$1,660,000262707538Seller's COAspen$14,900,000$7,750,000955387Buyer's COBoulder$2,185,000$1,650,000228887342Seller's COColoradoSprings$900,000$859,00042812413718Seller's
StateMarket Name
Median List Price Median Sold PriceInventory
New ListingsSold Days on Market Market Status
ONGTA-Durham$1,749,000$1,555,0002111364614Seller's ONGTA-York$2,375,000$1,880,00056332713713Seller's ONHamilton$1,839,500$1,510,0002541212723Buyer's ONMississauga$2,950,000$2,310,000137642618Balanced
CODouglasCounty$1,352,500$1,220,00029610314225Seller's
COSummitCounty$3,262,500$2,500,00090171125Buyer's COTelluride$6,475,000$3,100,0008261096Buyer's
CTCentralConnecticut$699,000$625,0003871031857Seller's
DCWashingtonD.C.$3,995,000$2,655,87551241019Balanced
DESussexCountyCoastal$1,458,000$1,250,000158344214Seller's
FLCoastalPinellasCounty$2,399,000$1,940,00088131228Buyer's FLGreaterFortLauderdale$1,346,500$1,050,000146042827027Balanced FLJacksonvilleBeaches$1,472,125$1,150,000306966126Balanced FLLeeCounty$1,399,999$1,192,500497836833Buyer's
FLMiami$1,999,450$1,450,0008941809443Buyer's FLNaples$4,900,000$3,600,000245441827Buyer's FLOrlando$1,250,000$1,120,00068617613622Balanced
FLPalmBeachTowns$3,450,000$2,010,300235482639Buyer's FLSarasota&Beaches$2,872,500$1,895,000252394330Balanced
FLSouthWalton$2,300,000$2,100,000421893841Buyer's
FLWeston$1,249,000$960,000113353226Seller's GAAtlanta$1,499,000$1,220,00069127022516Seller's
HIIslandofHawaii$1,900,000$1,630,000113222028Balanced HIKauai$2,695,000$2,100,000519715Buyer's HIMaui$2,997,000$2,558,0001383013100Buyer's HIOahu$3,130,000$2,300,000195443721Balanced
IDNorthernIdaho$1,700,000$1,402,000436907176Balanced
ONOakville$2,514,900$2,400,000132823317Seller's ONToronto$3,799,444$3,100,0004201785420Buyer's ONWaterlooRegion$1,474,000$1,300,0001661034912Seller's ORPortland$1,350,000$1,075,0006152482836Seller's QCMontreal$1,999,000$1,600,000363871639Buyer's SCHiltonHead$2,095,000$1,349,000243585512Seller's TNGreaterChattanooga$965,000$824,00018049434Seller's TNNashville$1,699,900$1,355,5006532462204Seller's TXAustin$1,098,222$995,00012425863549Seller's TXCollinCounty$749,000$717,786144568162711Seller's TXDallas$1,300,000$1,004,00145020918611Seller's TXDentonCounty$775,786$750,00011015084259Seller's TXElPaso$610,800$583,000154532915Balanced TXFortWorth$825,000$800,0009703934658Seller's TXGreaterTyler$737,500$611,50014877489Seller's TXHouston$979,000$880,00011494393339Seller's TXLubbock$652,500$599,95088342850Seller's TXSanAngelo$650,000$594,95051271668Seller's TXSanAntonio$799,070$717,51563626219116Seller's TXTheWoodlands&Spring$809,000$741,0002131191627Seller's UTParkCity$4,250,000$3,075,00020257167Buyer's UTSaltLakeCity$1,132,096$979,00046921015721Seller's VAArlington&Alexandria$2,250,000$1,850,0007732496Seller's VACharlottesville$1,300,000$1,019,00014422446Seller's VAFairfaxCounty$1,999,900$1,500,0003461131527Seller's VAMcLean&Vienna$2,750,000$1,850,00014731616Seller's VARichmond$799,900$790,1532911101976Seller's VASmithMountainLake$1,750,000$1,325,00033984Seller's WAKingCounty-GreaterSeattle$1,970,000$1,695,00010145435386Seller's WASeattle$1,893,217$1,715,0002541401676Seller's WASpokane$1,150,000$987,50013562469Seller's
ILDuPageCounty$1,173,000$863,75033411210018Seller's
StateMarket Name
Median List Price Median Sold PriceInventory
New ListingsSold Days on Market Market Status
ILLakeCounty$1,185,000$912,5002848912022Seller's ILWillCounty$649,900$615,0002479911916Seller's
ONGTA-Durham$1,749,000$1,555,0002111364614Seller's ONGTA-York$2,375,000$1,880,00056332713713Seller's ONHamilton$1,839,500$1,510,0002541212723Buyer's ONMississauga$2,950,000$2,310,000137642618Balanced
KSJohnsonCounty$824,385$822,6394048214512Seller's MACapeCod$2,497,450$1,800,000118394524Seller's MAGreaterBoston$2,995,000$2,847,500133733846Seller's MASouthShore$1,822,500$1,425,00072294125Seller's MDAnneArundelCounty$964,500$869,000194781036Seller's
MDHowardCounty$1,134,488$1,085,000110375315Seller's
MDTalbotCounty$2,112,000$2,295,000409117Seller's MDWorcesterCounty$1,047,500$740,0005618138Seller's MILivingstonCounty$750,000$652,000104312020Balanced MIMonroeCounty$650,000$547,000134436Seller's
MIWashtenawCounty$875,000$740,000180625111Seller's MIWayneCounty$695,000$625,000250889516Seller's MNOlmstedCounty$809,900$750,00083221638Balanced
MOKansasCity$675,000$651,71013493134327Seller's MOSt.Louis$799,950$649,00012463776Seller's NCCharlotte$1,100,000$960,0006272433457Seller's NCLakeNorman$1,187,500$1,108,93021876936Seller's NMTaos$1,200,000$984,50084914114Balanced
NVLasVegas$1,599,000$1,288,6928072158631Buyer's NVReno$1,925,000$1,900,000145311984Buyer's NYFingerLakes$1,999,000$866,000315823Seller's
ONOakville$2,514,900$2,400,000132823317Seller's ONToronto$3,799,444$3,100,0004201785420Buyer's ONWaterlooRegion$1,474,000$1,300,0001661034912Seller's ORPortland$1,350,000$1,075,0006152482836Seller's QCMontreal$1,999,000$1,600,000363871639Buyer's SCHiltonHead$2,095,000$1,349,000243585512Seller's TNGreaterChattanooga$965,000$824,00018049434Seller's TNNashville$1,699,900$1,355,5006532462204Seller's TXAustin$1,098,222$995,00012425863549Seller's TXCollinCounty$749,000$717,786144568162711Seller's TXDallas$1,300,000$1,004,00145020918611Seller's TXDentonCounty$775,786$750,00011015084259Seller's TXElPaso$610,800$583,000154532915Balanced TXFortWorth$825,000$800,0009703934658Seller's TXGreaterTyler$737,500$611,50014877489Seller's TXHouston$979,000$880,00011494393339Seller's TXLubbock$652,500$599,95088342850Seller's TXSanAngelo$650,000$594,95051271668Seller's TXSanAntonio$799,070$717,51563626219116Seller's TXTheWoodlands&Spring$809,000$741,0002131191627Seller's UTParkCity$4,250,000$3,075,00020257167Buyer's UTSaltLakeCity$1,132,096$979,00046921015721Seller's VAArlington&Alexandria$2,250,000$1,850,0007732496Seller's VACharlottesville$1,300,000$1,019,00014422446Seller's VAFairfaxCounty$1,999,900$1,500,0003461131527Seller's VAMcLean&Vienna$2,750,000$1,850,00014731616Seller's VARichmond$799,900$790,1532911101976Seller's VASmithMountainLake$1,750,000$1,325,00033984Seller's WAKingCounty-GreaterSeattle$1,970,000$1,695,00010145435386Seller's WASeattle$1,893,217$1,715,0002541401676Seller's WASpokane$1,150,000$987,50013562469Seller's
NYStatenIsland$1,279,450$999,000178402953Balanced NYSuffolkCounty$1,900,000$1,185,00084518916835Balanced OHCincinnati$849,900$770,00023833594Seller's
Median
StateMarket Name
Median List Price Median Sold PriceInventory
New ListingsSold Days on Market Market Status
ONGTA-York$2,500,000$1,780,00051732112711Seller's ONHamilton$1,799,900$1,748,7502371191819Buyer's ONMississauga$3,049,500$2,705,444120631023Buyer's ONOakville$2,548,800$2,710,000109712814Seller's ONToronto$3,799,444$3,178,000430292758Balanced ONWaterlooRegion$1,512,400$1,212,50015182254Buyer's ORPortland$1,300,000$1,100,00064522520112Seller's QCMontreal$1,690,000$1,502,5001771592225Buyer's SCHiltonHead$2,065,000$1,672,500239516820Seller's TNGreaterChattanooga$1,070,000$984,060202505322Seller's
TXAustin$1,095,000$999,750121944327632Seller's
TXCollinCounty$749,900$699,599142152751622Seller's TXDallas$1,299,000$1,135,92543519014622Seller's
TXDentonCounty$767,269$700,000112937532721Seller's
TXElPaso$629,500$616,000170513325Balanced
TXFortWorth$849,900$757,00095334335420Seller's
TXGreaterTyler$799,450$622,500198694422Seller's
TXLubbock$645,000$650,000103422356Seller's TXSanAngelo$648,888$575,00053161172Balanced TXSanAntonio$799,995$702,50062016017233Seller's
UTParkCity$4,590,000$3,882,725181272857Balanced
VAArlington&Alexandria$2,199,999$2,050,0008947157Balanced
VACharlottesville$1,336,975$1,175,00014038296Balanced
VAFairfaxCounty$1,999,999$1,437,5003511349818Seller's VAMcLean&Vienna$2,773,975$1,829,943156543020Balanced
VASmithMountainLake$1,750,000$1,180,0002161221Seller's WAKingCounty-GreaterSeattle$1,898,000$1,720,000114356052315Seller's WASeattle$1,820,000$1,700,00029917814314Seller's
ONGTA-Durham$1,749,000$1,555,0002111364614Seller's ONGTA-York$2,375,000$1,880,00056332713713Seller's ONHamilton$1,839,500$1,510,0002541212723Buyer's ONMississauga$2,950,000$2,310,000137642618Balanced ONOakville$2,514,900$2,400,000132823317Seller's ONToronto$3,799,444$3,100,0004201785420Buyer's ONWaterlooRegion$1,474,000$1,300,0001661034912Seller's ORPortland$1,350,000$1,075,0006152482836Seller's QCMontreal$1,999,000$1,600,000363871639Buyer's SCHiltonHead$2,095,000$1,349,000243585512Seller's TNGreaterChattanooga$965,000$824,00018049434Seller's TNNashville$1,699,900$1,355,5006532462204Seller's TXAustin$1,098,222$995,00012425863549Seller's TXCollinCounty$749,000$717,786144568162711Seller's TXDallas$1,300,000$1,004,00145020918611Seller's TXDentonCounty$775,786$750,00011015084259Seller's TXElPaso$610,800$583,000154532915Balanced TXFortWorth$825,000$800,0009703934658Seller's TXGreaterTyler$737,500$611,50014877489Seller's TXHouston$979,000$880,00011494393339Seller's TXLubbock$652,500$599,95088342850Seller's TXSanAngelo$650,000$594,95051271668Seller's TXSanAntonio$799,070$717,51563626219116Seller's TXTheWoodlands&Spring$809,000$741,0002131191627Seller's UTParkCity$4,250,000$3,075,00020257167Buyer's UTSaltLakeCity$1,132,096$979,00046921015721Seller's VAArlington&Alexandria$2,250,000$1,850,0007732496Seller's VACharlottesville$1,300,000$1,019,00014422446Seller's VAFairfaxCounty$1,999,900$1,500,0003461131527Seller's VAMcLean&Vienna$2,750,000$1,850,00014731616Seller's VARichmond$799,900$790,1532911101976Seller's VASmithMountainLake$1,750,000$1,325,00033984Seller's WAKingCounty-GreaterSeattle$1,970,000$1,695,00010145435386Seller's WASeattle$1,893,217$1,715,0002541401676Seller's WASpokane$1,150,000$987,50013562469Seller's
WASpokane$1,095,000$1,010,000148723914Seller's
Median
Median
New
StateMarket Name
ABCalgary$750,000$720,000145442946Balanced
AZChandlerandGilbert
AZFlagstaff
AZMesa
AZParadiseValley
AZPhoenix AZScottsdale$872,500$690,000208604448Seller's AZTucson
BCMidVancouverIsland$869,900$822,72267361046Buyer's BCOkanaganValley
BCVancouver$1,998,000$1,787,50010184005627Buyer's BCVictoria$971,950$930,000142943235Seller's BCWhistler$2,518,500$1,917,5004015256Buyer's CACentralCoast$1,249,000$1,075,00029133114Seller's CAEastBay$1,100,000$1,072,5001558610217Seller's CAGreaterPalmSprings
CALakeTahoe$1,850,000$1,846,289298826Seller's CALosAngelesBeachCities$1,850,000$1,618,750155585816Seller's CALosAngelesCity$1,649,000$1,392,5003831337826Balanced CALosAngelesTheValley$799,000$785,000144546423Seller's CAMarinCounty$1,300,000$977,5003221013Seller's CANapaCounty
CAOrangeCounty$1,180,000$1,129,99538216416225Seller's CAPlacerCounty
CASacramento
CASanDiego$1,124,000$1,031,00041317615619Seller's CASanFrancisco$2,750,000$2,500,000139342533Balanced CASanLuisObispoCounty
CASantaBarbara$1,695,000$1,625,00013986Seller's CASiliconValley$1,684,444$1,610,000120667415Seller's CASonomaCounty$914,500$744,7502051032Seller's CAVenturaCounty$750,000$747,000118506425Seller's COAspen$3,649,000$3,637,500386664Balanced COBoulder$876,950$955,00074374048Seller's COColoradoSprings$590,156$602,50044101813Seller's
StateMarket Name
CODouglasCounty$570,000$560,0002681038Seller's
COSummitCounty$1,495,000$1,150,0003381215Seller's COTelluride
COVail$4,074,500$3,500,0006411151Seller's CTCentralConnecticut
DCWashingtonD.C.$1,846,995$1,584,0002461274110Balanced
DESussexCountyCoastal$949,450$889,00026111612Seller's
FLCoastalPinellasCounty$1,369,000$988,150100292425Seller's FLGreaterFortLauderdale$849,000$780,00088818615233Balanced
FLJacksonvilleBeaches$1,197,000$937,500346847Seller's FLLeeCounty$850,000$795,000228533729Balanced
FLMiami$1,399,250$1,250,000128025011153Buyer's FLNaples$2,300,000$2,100,000143422911Balanced
FLOrlando$564,950$549,950204594414Seller's FLPalmBeachTowns$1,750,000$1,650,000224712421Buyer's
FLSouthPinellasCounty$1,077,500$932,500178403617Balanced FLWeston
GAAtlanta$715,000$649,50048718015218Seller's GADuluth
HIIslandofHawaii$1,475,000$1,342,50052161421Seller's IDNorthernIdaho
ONGTA-Durham$1,749,000$1,555,0002111364614Seller's ONGTA-York$2,375,000$1,880,00056332713713Seller's ONHamilton$1,839,500$1,510,0002541212723Buyer's ONMississauga$2,950,000$2,310,000137642618Balanced ONOakville$2,514,900$2,400,000132823317Seller's ONToronto$3,799,444$3,100,0004201785420Buyer's ONWaterlooRegion$1,474,000$1,300,0001661034912Seller's ORPortland$1,350,000$1,075,0006152482836Seller's QCMontreal$1,999,000$1,600,000363871639Buyer's SCHiltonHead$2,095,000$1,349,000243585512Seller's TNGreaterChattanooga$965,000$824,00018049434Seller's TNNashville$1,699,900$1,355,5006532462204Seller's TXAustin$1,098,222$995,00012425863549Seller's TXCollinCounty$749,000$717,786144568162711Seller's TXDallas$1,300,000$1,004,00145020918611Seller's TXDentonCounty$775,786$750,00011015084259Seller's TXElPaso$610,800$583,000154532915Balanced TXFortWorth$825,000$800,0009703934658Seller's TXGreaterTyler$737,500$611,50014877489Seller's TXHouston$979,000$880,00011494393339Seller's TXLubbock$652,500$599,95088342850Seller's TXSanAngelo$650,000$594,95051271668Seller's TXSanAntonio$799,070$717,51563626219116Seller's TXTheWoodlands&Spring$809,000$741,0002131191627Seller's UTParkCity$4,250,000$3,075,00020257167Buyer's UTSaltLakeCity$1,132,096$979,00046921015721Seller's VAArlington&Alexandria$2,250,000$1,850,0007732496Seller's VACharlottesville$1,300,000$1,019,00014422446Seller's VAFairfaxCounty$1,999,900$1,500,0003461131527Seller's VAMcLean&Vienna$2,750,000$1,850,00014731616Seller's VARichmond$799,900$790,1532911101976Seller's VASmithMountainLake$1,750,000$1,325,00033984Seller's WAKingCounty-GreaterSeattle$1,970,000$1,695,00010145435386Seller's WASeattle$1,893,217$1,715,0002541401676Seller's WASpokane$1,150,000$987,50013562469Seller's
ILChicago$1,200,000$930,00089230315130Balanced ILDuPageCounty$925,000$775,00021101018Seller's
StateMarket Name
Median List Price Median Sold PriceInventory
New ListingsSold Days on Market Market Status
ILLakeCounty
ILWillCounty
INHamiltonCounty
MACapeCod$1,147,000$1,025,0251891622Seller's
MASouthShore$830,000$810,0001981721Seller's MDAnneArundelCounty$580,000$555,74057234511Seller's MDFrederickCounty
MDHowardCounty$599,990$582,5004230526Seller's MDMontgomeryCounty$799,990$737,950117676012Seller's MDTalbotCounty
MDWorcesterCounty$699,500$643,5005729347Seller's MILivingstonCounty MIMonroeCounty
MIWashtenawCounty$635,000$617,7005717912Balanced MIWayneCounty$649,900$572,1709724855Buyer's MNOlmstedCounty
MNTwinCities
MOKansasCity
MOSt.Louis
NCCharlotte$660,000$605,00017959678Seller's NCLakeNorman$591,534$595,00027987Seller's NCRaleigh-Durham
NMTaos
NVLakeTahoe$1,250,000$1,200,000335550Balanced NVLasVegas
NVReno
NYFingerLakes
ONGTA-Durham$1,749,000$1,555,0002111364614Seller's ONGTA-York$2,375,000$1,880,00056332713713Seller's ONHamilton$1,839,500$1,510,0002541212723Buyer's ONMississauga$2,950,000$2,310,000137642618Balanced ONOakville$2,514,900$2,400,000132823317Seller's ONToronto$3,799,444$3,100,0004201785420Buyer's ONWaterlooRegion$1,474,000$1,300,0001661034912Seller's ORPortland$1,350,000$1,075,0006152482836Seller's QCMontreal$1,999,000$1,600,000363871639Buyer's SCHiltonHead$2,095,000$1,349,000243585512Seller's TNGreaterChattanooga$965,000$824,00018049434Seller's TNNashville$1,699,900$1,355,5006532462204Seller's TXAustin$1,098,222$995,00012425863549Seller's TXCollinCounty$749,000$717,786144568162711Seller's TXDallas$1,300,000$1,004,00145020918611Seller's TXDentonCounty$775,786$750,00011015084259Seller's TXElPaso$610,800$583,000154532915Balanced TXFortWorth$825,000$800,0009703934658Seller's TXGreaterTyler$737,500$611,50014877489Seller's TXHouston$979,000$880,00011494393339Seller's TXLubbock$652,500$599,95088342850Seller's TXSanAngelo$650,000$594,95051271668Seller's TXSanAntonio$799,070$717,51563626219116Seller's TXTheWoodlands&Spring$809,000$741,0002131191627Seller's UTParkCity$4,250,000$3,075,00020257167Buyer's UTSaltLakeCity$1,132,096$979,00046921015721Seller's VAArlington&Alexandria$2,250,000$1,850,0007732496Seller's VACharlottesville$1,300,000$1,019,00014422446Seller's VAFairfaxCounty$1,999,900$1,500,0003461131527Seller's VAMcLean&Vienna$2,750,000$1,850,00014731616Seller's VARichmond$799,900$790,1532911101976Seller's VASmithMountainLake$1,750,000$1,325,00033984Seller's WAKingCounty-GreaterSeattle$1,970,000$1,695,00010145435386Seller's WASeattle$1,893,217$1,715,0002541401676Seller's WASpokane$1,150,000$987,50013562469Seller's
NYNassauCounty$1,667,500$1,550,00080221330Balanced OHCincinnati$674,900-1710-Buyer's
StateMarket Name
Median List Price Median Sold
New ListingsSold Days on Market Market Status
OHClevelandSuburbs
ONGTA-Durham$847,900$825,000352857Buyer's ONGTA-York$799,000$782,5002731807121Seller's ONHamilton$887,400$925,000222047Balanced
ONMississauga$972,500$918,000136853526Seller's ONOakville$1,379,000$1,222,5003220819Seller's ONToronto$1,248,000$1,145,00077552619017Seller's ONWaterlooRegion$799,950$735,0004836565Buyer's ORPortland$719,000$620,0002551055626Seller's QCMontreal$1,325,000$1,062,5005732848Buyer's SCHiltonHead$1,045,000$892,0004151241Seller's
TNGreaterChattanooga
TXAustin$857,500$820,0002841075319Balanced
TXCollinCounty
TXDallas$750,000$639,680129544210Seller's TXDentonCounty
TXElPaso
TXFortWorth
TXGreaterTyler
TXHouston$627,000$610,000142542818Balanced
TXLubbock
TXSanAngelo
TXTheWoodlands&Spring
VAArlington&Alexandria$949,950$980,000130824214Seller's VACharlottesville$774,900$686,70032658Balanced
VAFairfaxCounty$775,000$705,00023212315213Seller's
VARichmond
VASmithMountainLake
WAKingCounty-GreaterSeattle$1,099,900$975,0002771108914Seller's
ONGTA-Durham$1,749,000$1,555,0002111364614Seller's ONGTA-York$2,375,000$1,880,00056332713713Seller's ONHamilton$1,839,500$1,510,0002541212723Buyer's ONMississauga$2,950,000$2,310,000137642618Balanced ONOakville$2,514,900$2,400,000132823317Seller's ONToronto$3,799,444$3,100,0004201785420Buyer's ONWaterlooRegion$1,474,000$1,300,0001661034912Seller's ORPortland$1,350,000$1,075,0006152482836Seller's QCMontreal$1,999,000$1,600,000363871639Buyer's SCHiltonHead$2,095,000$1,349,000243585512Seller's TNGreaterChattanooga$965,000$824,00018049434Seller's TNNashville$1,699,900$1,355,5006532462204Seller's TXAustin$1,098,222$995,00012425863549Seller's TXCollinCounty$749,000$717,786144568162711Seller's TXDallas$1,300,000$1,004,00145020918611Seller's TXDentonCounty$775,786$750,00011015084259Seller's TXElPaso$610,800$583,000154532915Balanced TXFortWorth$825,000$800,0009703934658Seller's TXGreaterTyler$737,500$611,50014877489Seller's TXHouston$979,000$880,00011494393339Seller's TXLubbock$652,500$599,95088342850Seller's TXSanAngelo$650,000$594,95051271668Seller's TXSanAntonio$799,070$717,51563626219116Seller's TXTheWoodlands&Spring$809,000$741,0002131191627Seller's UTParkCity$4,250,000$3,075,00020257167Buyer's UTSaltLakeCity$1,132,096$979,00046921015721Seller's VAArlington&Alexandria$2,250,000$1,850,0007732496Seller's VACharlottesville$1,300,000$1,019,00014422446Seller's VAFairfaxCounty$1,999,900$1,500,0003461131527Seller's VAMcLean&Vienna$2,750,000$1,850,00014731616Seller's VARichmond$799,900$790,1532911101976Seller's VASmithMountainLake$1,750,000$1,325,00033984Seller's WAKingCounty-GreaterSeattle$1,970,000$1,695,00010145435386Seller's WASeattle$1,893,217$1,715,0002541401676Seller's WASpokane$1,150,000$987,50013562469Seller's
WASpokane
$4,500,000+
$3,900,000 - $4,499,999
$3,500,000 - $3,899,999
$3,100,000 - $3,499,999
$2,700,000 - $3,099,999
$2,300,000 - $2,699,999
$1,900,000 - $2,299,999
$1,700,000 - $1,899,999
$1,500,000 - $1,699,999
$1,400,000 - $1,499,999
$1,300,000 - $1,399,999
$1,250,000 - $1,299,999
$1,200,000 - $1,249,999
$1,150,000 - $1,199,999
$1,100,000 - $1,149,999
$3,000,000+
$2,500,000 - $2,999,999
$2,000,000 - $2,499,999
$1,600,000 - $1,999,999
$1,200,000 - $1,599,999
$1,100,000 - $1,199,999
$1,000,000 - $1,099,999
$950,000 - $999,999
$900,000 - $949,999
$850,000 - $899,999
$800,000 - $849,999
$750,000 - $799,999
$700,000 - $749,999
$650,000 - $699,999
$600,000 - $649,999