


Patricia Cain Designated Owner 7633 E Acoma Dr., 104 - Scottsdale, AZ 85260 480-490-9269 Email: connect@ateam.realestate - www.ascend.realty BrittanyThomas REALTOR® Luxury Market LuxuryMarket LuxuryMarket LuxuryMarket REPORT NOVEMBER 2022


It takes a special kind of dedication to be recognized as one of the top agents in Arizona and the United States. Patricia Cain, Owner of RE/MAX Ascend Realty and RE/MAX Ascend Commercial Realty has earned this distinction and possesses a high level of local market understanding and a commitment to client service.

Her sales record set the tone. Patricia has closed on over $200 million in sales throughout her 20+ year career of marketing and selling multiple types of Arizona Real Estate including luxury homes, single family homes, condominiums, commercial buildings, and land.

Firsthand knowledge of Maricopa County history — from its beginning development to its current reputation as being one of top places people move to most frequently across the United States. Her insight comes from experience. She was born and raised in Chicago, IL, and moved to Arizona in 1985 after becoming legally emancipated at 16. Entrepreneurial at heart, Patricia worked for smaller companies and assisted them with company growth and perfecting client experiences. She began her own company which she ran for a decade. When she got into real estate, she began to do the same thing but on a much different scale. Since then, she now owns 2 RE/MAX franchises and feels this is where she is most fulfilled, as she can help agents grow and assist more clients with their real estate desires, whether that be residential or commercial.
After 10 years of company ownership, Patricia began building a team with Brittany Thomas, who has a decade long background serving customers and client relations. Working closely together as a team has allowed them to best serve clients and to ensure someone is always available to meet their real estate needs.


Clients routinely return to Patricia for later transactions. They find value in her negotiating skills, uncompromising standards and exemplary personal attention. Over the course of her decorated career, Patricia has furthermore been named as one of the best Real Estate Agents in Arizona and America multiple years in a row.
Outreach in the community is also a paramount priority for Patricia. She has coordinated multiple fundraisers for pet adoptions, hydrocephalus, Phoenix Children’s hospital, food banks, and debt collection just to name a few. But her true passion in outreach lies with in keeping animals off the streets and out of shelters. She and her team regularly coordinate donations to pet rescue and resources.
In her free time, Patricia loves helping small businesses grow by assisting other small companies with growth strategies, business setup and design. She also loves traveling, jewelry making, the arts, and focusing on health and personal growth.
If you are considering buying or selling, relocating, downsizing, or upscaling, contact the A-Team. We are excited to help and look forward to hearing from you.
Email: connect@ateam.realestate - www.ascend.realty
 Patricia Cain

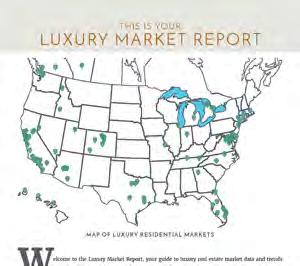

elcome to the Luxury Market Report, your guide to luxury real estate market data and trends for North America. Produced monthly by The Institute for Luxury Home Marketing, this report provides an in-depth look at the top residential markets across the United States and Canada. Within the individual markets, you will find established luxury benchmark prices and detailed survey of luxury active and sold properties designed to showcase current market status and recent trends. The national report illustrates a compilation of the top North American markets to review overall standards and trends.
Copyright © 2022 Institute for Luxury Home Marketing | www.luxuryhomemarketing.com | 214.485.3000
The Luxury Market Report is a monthly analysis provided by The Institute for Luxury Home Marketing. Luxury benchmark prices are determined by The Institute. This active and sold data has been provided by REAL Marketing, who has compiled the data through various sources, including local MLS boards, local tax records and Realtor.com. Data is deemed reliable to the best of our knowledge, but is not guaranteed.
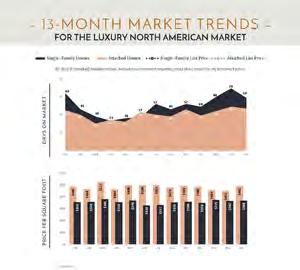
TheInstituteforLuxuryHomeMarketinghasanalyzedanumberofmetrics—includingsales prices,salesvolumes,numberofsales,sales-price-to-list-priceratios,daysonmarketand price-per-square-foot–toprovideyouacomprehensiveNorthAmericanLuxuryMarketreport. Additionally,wehavefurtherexaminedalloftheindividualluxurymarketstoprovidebothan overviewandanin-depthanalysis-including,wheredataissufficient,abreakdownbyluxury single-familyhomesandluxuryattachedhomes.
Itisourintentiontoincludeadditionalluxurymarketsonacontinualbasis.Ifyourmarketis notfeatured,pleasecontactussowecanimplementthenecessaryqualificationprocess.More in-depthreportsontheluxurycommunitiesinyourmarketareavailableaswell.
Lookingthroughthisreport,youwillnoticethreedistinctmarketstatuses,Buyer'sMarket, Seller'sMarket,andBalancedMarket.A Buyer's Market indicatesthatbuyershavegreater controloverthepricepoint.Thismarkettypeisdemonstratedbyasubstantialnumberof homesonthemarketandfewsales,suggestingdemandforresidentialpropertiesisslowfor thatmarketand/orpricepoint.
Bycontrast,a Seller's Market givessellersgreatercontroloverthepricepoint.Typically,this meanstherearefewhomesonthemarketandagenerousdemand,causingcompetitionbetween buyerswhoultimatelydrivesalespriceshigher.
A Balanced Market indicatesthatneitherthebuyersnorthesellerscontrolthepricepointat whichthatpropertywillsellandthatthereisneitheraglutnoralackofinventory.Typically, thistypeofmarketseesastabilizationofboththelistandsoldprice,thelengthoftimethe propertyisonthemarketaswellastheexpectancyamongsthomeownersintheirrespective communities–solongastheirhomeispricedinaccordancewiththecurrentmarketvalue.
REMAININGINVENTORY:Thetotalnumberofhomesavailableatthecloseofamonth.
DAYSONMARKET:Measuresthenumberofdaysahomeisavailableonthemarketbeforea
LUXURYBENCHMARKPRICE:Thepricepointthatmarksthetransitionfromtraditionalhomes
NEWLISTINGS:Thenumberofhomesthatenteredthemarketduringthecurrentmonth.
PRICEPERSQUAREFOOT:Measuresthedollaramountofthehome'spriceforanindividual squarefoot.
SALESRATIO:SalesRatiodefinesmarketspeedanddetermineswhetherthemarketcurrently favorsbuyersorsellers.Buyer'sMarket=upto14%;BalancedMarket=15to20%;Seller's Market=21%plus.If>100%,salesfrompreviousmonthexceedcurrentinventory.
SP/LPRATIO:TheSalesPrice/ListPriceRatiocomparesthevalueofthesoldpricetothevalue ofthelistprice.
Thereislittledoubttheluxuryrealestatemarketisfacingsomeinterestingchallengesthateven haveexpertscontradictingeachotherintheirpredictionsandassumptions.
Statisticsinmanyluxurymarketsstillshowthattheyarefavorabletosellers–sowhyarehomeowners remaininghesitanttolisttheirhomes?Forthefourthstraightmonth,thenumberofnewlistings enteringthemarkethasfallen,withincreasesininventorylevelsmainlyattributabletostalelistings lingeringon.

Bothsellersandbuyersaresittingonthefence,withneithersidewantingtojumpintothis unconventionalmarketunlesspresentedwiththerightopportunity.Theaveragedaysonmarket haveincreasedcomparedtolastyear,butrelativetopre-pandemicaverages,homesthathavesold recentlyarestillsellingtwiceasfast.
Outsideinfluences,someofwhicharenottypicallyidentifiedasbeingimpactfulonaffluentbuyers andsellers,arealsocausingdisruptionstotheirspendinghabits:suchasconcernsoverapotential recession,interestrateincreases,andavolatilestockmarket.
Mortgagecompaniesareofferingcreativealternatives,butevenaslightdipinrecentratesisn’t drivingbuyerstopurchasedespitestatisticsfromtheNationalAssociationofRealtors(NAR),the NationalAssociationofHomeBuilders(NAHB),andRealtor.com,showingdemandstilloutweighs supplyinmanypricepoints,propertytypes,andlocations.
Allindicationsarethatthosewhoneedtobuyand/orsellarecontinuingtodoso,butforthosewhose criteriaaremorebasedon‘wantingtobuy,’thereishesitancyastheyhopeinventorychoicewill improveand/orpriceswillbecomemorefavorable.
Thisisabigquestion,andyetthejuryremainscautiousastowhatextentpriceswillfallandwhich locations,propertytypes,andsizeswillbemostaffected.
SinceJuly2022,therehasbeenaslight,butcontinueddeclineinthemediansoldpriceforsingle familyhomesdroppingfrom$1,311,000inJulyto$1,275,000inSeptember;however,inOctober,the medianpriceclimbedbackupto$1,313,525.
Incontrast,intheattachedluxurypropertymarket,themediansoldpriceincreasedfrom$832,375 inJuly2022to$890,500inSeptember,onlytodropto$878,500inOctober.

Thesearenotdramaticswings,buttheyshowthereissomevolatilityintheluxurymarket. Interestingly,arecentarticlebyNasdaq1speakstoanincreaseintheultra-wealthycurrently investinginluxuryrealestate.
“Asthevalueofthedollarremainsvolatile,we’veseenmorenewclientslookingtoparktheir moneyinalow-risk,luxuryassetwhoselikelihoodofappreciationishigher,forgedbyhistorically beautifulsurroundingneighborhoods,sprawlingacreageandsquarefootage,andnewlyrenovated constructions.”
AccordingtotheirarticleandTheTrendReport20222byColdwellBankerGlobalLuxury,they foreseethevalueofluxurypropertieswillcontinuetoappreciate.Bothsitethehistoricgainsinthis segmentoftherealestatemarketandexplainthatpriceswilloscillatebymonthorquarter,buthow theappreciationisclearlyrecognizedbyinvestorsandhomeownersasbeingalong-termdecision.
“Pronetobehavingcautiously,theaffluenthavebeguntosignalthattheyarelookingformore stablelong-terminvestmentstoprotecttheirwealthandgivethempeaceofmind.”
TheTrendReportalsoshedslightonwhyaffluenthomeownershaveshiftedfromtheirfearlessand ‘FOMO’buyingoflastyeartotakingamoreconsideredapproach.
“Betweenrisingeconomicuncertainty,stockandcryptomarketvolatility,climatechange,andtwo yearsoflivingthroughanunprecedentedhealthcrisis,wealthybuyershavebegunturningtoward opportunitiesthatgivethemlong-termfinancialsecurityandqualityoflife.
Realestategenerallyoffersreliabilityandstabilityforthoseinvestorswhoareabletoplaythelong game:holdontotheirassetwhenthemarkettrendsdownandwaituntilpricesstarttoriseagain.”
Equally,withinterestratesmorethandoublecomparedto2020,2021,andthefirstquarterof2022, manyhomeownersrecognizethatsellingtheirhometopurchaseanotherwouldbeanexpensive replacementunlesstheyneedtosell.
Thishasledtomanysellersdecidingnottoputtheirhomesonthemarket,which,whencombined withbuyerstakingmoretimetomaketheirdecisions,hasultimatelyresultedintheslowingdown ofthemarket.
Itissupplyratherthandemandthatiscreatingthebiggerconundruminthemarkettoday.Buyers arestilleagertobuy,albeitataslowerpace,butthereissimplyalackofnewinventoryentering themarket.
Inventorylevelsmayhaveincreasedcomparedtolastyear,butwithoutnewinventory,thereturn topre-pandemiclevelsisunlikely,addingafurthercomplicationforbuyersascurrentlevelsare unlikelytocreatethedownwardpressureonhomepricestheyanticipate.
AccordingtoNasdaq,therehasneverbeenmoreliquidityonthebuyers’sideforqualityhomes,but untilsellers’priceexpectationsstarttoalignwithbuyers’perceptionofvalue,wewillcontinueto seethiscontradictioninthemarket.

Aftertwoyearsofaffluentbuyersheadingawayfromurbancenters,therehasbeenasignificant returntotraditionalcentersofluxuryin2022,andoldfavoritesacrossNorthAmerica,suchasNew York,Boston,Chicago,Toronto,andVancouver,areseeingthebenefitsofthisdemand.
Whilepricesdecreasedduringthepandemicforthesmallercityfootprints,theysubsequentlybecame comparativelymoreaffordableagainsttheescalatingvaluesseeninruraldestinations,emerging markets,andresortmarkets.
Muchliketheownershipofluxuryrealestate,thesemetropoliseshaveonceagainbeenrecognized bytheaffluentaslocationsthatwillholdtheirvalueoverthelongterm–seenequallybydomestic andreturningforeigninvestorsassafeinvestmenthavens.
Incontrast,marketsthatbenefitedfromthedemandfrenzyof2020and2021andthesubsequent influxofbuyersmayseethegreatestcoolingoffduringthelastpartof2022.Indeed,compared to2021,thevelocityofsaleshasalreadydroppedsignificantlyinmany,andexpectationsarethat demandandpriceswillsettleintoamorematurerhythmin2023.

Whilethereismuchdebateabouthowthingswillplayoutoverthenextsixmonths,likeallmarkets, thereisalwaysanopportunityforthosewhoareready.Therearenichesineverymarket:whether movingtoalocationthataffordsabettercostofliving,recognizingluxurypocketsorpropertytypes thatarenextinthedemandcycle,orsimplybidingone’stimeinanticipationoffindingaproperty thatisbelowmarketvalue.
Butmoreimportantly,accordingtoasurveyconductedbyColdwellBankerGlobalLuxuryfortheir TrendReport,itseemsthatluxuryrealestateremainsanimportantassetfortheaffluent.
“Regardlessofanaffluentbuyer’sfinancialprofile,thereisstillsignificantconfidenceintheluxury realestatemarket.Accordingtooursurvey,nearly90%ofrespondentsbelieveinthestabilityof owningproperty.Evenifsomebuyershavedroppedoutoftherealestategameduetofatigue, frustration,orevenhesitationthisyear,theymaybeprimedtoreturnasinventorylevelsimprove.”
ABCalgary$1,100,000$985,00049921816124Seller's AZChandlerandGilbert$1,099,000$950,000259726347Seller's AZFlagstaff$1,549,000$1,500,00073151385Balanced
AZMesa$857,450$860,000246806349Seller's
AZParadiseValley$5,200,000$3,225,000164381397Buyer's
AZPhoenix$849,900$805,26091627324850Seller's AZScottsdale$1,950,000$1,500,00076318913454Balanced
AZTucson$695,000$650,00092128420114Seller's BCMidVancouverIsland$1,675,000$1,530,000185652329Buyer's BCOkanaganValley$1,788,000$1,550,0008472214540Buyer's
BCVancouver$4,480,000$3,300,00011182515724Buyer's BCVictoria$2,395,000$2,038,750133552816Seller's BCWhistler$4,899,000$6,000,0005714171Buyer's CACentralCoast$2,750,000$2,400,000249655527Seller's CAEastBay$2,198,800$1,930,00055025337914Seller's
CAGreaterPalmSprings$1,842,500$1,600,0003641426327Balanced CALakeTahoe$2,495,000$1,712,500168404252Seller's
CALosAngelesBeachCities$6,342,500$4,550,0003261105531Balanced CALosAngelesCity$4,999,950$3,380,0006871999925Buyer's CALosAngelesTheValley$2,497,000$2,090,00051420112617Seller's CAMarinCounty$4,495,000$2,650,000124214913Seller's CANapaCounty$3,995,000$1,942,500125171055Buyer's CAOrangeCounty$2,600,000$2,100,000100627026924Seller's CAPlacerCounty$1,158,000$1,036,520295987316Seller's
CASacramento$964,990$913,75064722423218Seller's
CASanDiego$2,199,000$1,900,00094935625320Seller's
CASanFrancisco$4,598,000$3,350,000173445112Seller's
CASanLuisObispoCounty$1,800,000$1,350,000188514942Seller's
CASantaBarbara$4,995,000$3,000,000107283833Seller's CASiliconValley$3,988,000$3,250,00054122522912Seller's CASonomaCounty$2,495,000$1,725,000217334446Balanced
CAVenturaCounty$2,024,500$1,717,756250787334Seller's COAspen$14,250,000$15,750,000896896Buyer's COBoulder$2,250,000$1,473,306230805942Seller's COColoradoSprings$899,900$887,77841610312032Seller's CODenver$1,597,000$1,425,00060018720812Seller's CODouglasCounty$1,380,000$1,227,500297908020Seller's
Median prices represent properties priced above respective city benchmark prices. Prices shown for Canadian cites are shown in Canadian Dollars.
StateMarket Name
CODurango$1,600,000$1,252,000115201859Balanced
COSummitCounty$3,345,000$2,700,0007561158Buyer's COTelluride$5,995,000$3,200,0007491389Balanced
COVail$4,500,000$4,995,0007971777Seller's
CTCentralConnecticut$699,999$615,0003829114719Seller's CTCoastalConnecticut$2,395,000$1,500,00057314112732Seller's DCWashingtonD.C.$3,700,000$2,410,00043111411Seller's
DESussexCountyCoastal$1,474,990$1,320,000153292711Balanced
FLBocaRaton/DelrayBeach$2,499,000$1,778,7004831136725Buyer's FLCoastalPinellasCounty$2,425,000$1,900,000106321730Balanced
FLGreaterFortLauderdale$1,350,000$1,050,000161445520533Buyer's FLJacksonvilleBeaches$1,375,000$1,226,184315808838Seller's FLLeeCounty$1,379,900$1,222,5004491006231Buyer's FLMarcoIsland$2,790,000$2,250,00099181169Buyer's FLMiami$2,000,000$1,450,00095923910952Buyer's FLNaples$4,950,000$3,500,000301853947Buyer's FLOrlando$1,250,000$1,122,50067816818615Seller's
FLPalmBeachTowns$3,050,000$1,725,000271581920Buyer's FLSarasota&Beaches$2,900,000$1,676,000278785326Balanced FLSouthPinellasCounty$1,600,000$1,220,000294976231Seller's FLSouthWalton$2,340,000$1,900,000417684726Buyer's
FLSpaceCoast$839,900$750,0003511098621Seller's FLTampa$744,995$700,000130434835718Seller's
FLWeston$1,199,500$985,000139462635Balanced
GAAtlanta$1,595,000$1,180,82165222421012Seller's
GADuluth$1,637,500$1,270,0002210265Buyer's
HIIslandofHawaii$1,960,000$1,525,000120242150Balanced HIKauai$3,790,000$1,800,000254576Balanced HIMaui$2,950,000$2,550,0001392421108Balanced
HIOahu$2,900,000$2,362,500207432421Buyer's IDAdaCounty$789,900$754,00083624129521Seller's
IDNorthernIdaho$1,599,000$1,350,000401865992Buyer's ILChicago$1,579,000$1,250,00065519618826Seller's ILDuPageCounty$1,148,000$912,000307887129Seller's
ILLakeCounty$1,185,000$877,500257726714Seller's ILWillCounty$650,000$597,000231749121Seller's
INHamiltonCounty$849,950$750,000173551264Seller's
Median prices represent properties priced above respective city benchmark prices. Prices shown for Canadian cites are shown in Canadian Dollars.
StateMarket Name
ONGTA-Durham$1,749,000$1,555,0002111364614Seller's
ONGTA-York$2,375,000$1,880,00056332713713Seller's
ONHamilton$1,839,500$1,510,0002541212723Buyer's
ONMississauga$2,950,000$2,310,000137642618Balanced
ONOakville$2,514,900$2,400,000132823317Seller's
ONToronto$3,799,444$3,100,0004201785420Buyer's
ONWaterlooRegion$1,474,000$1,300,0001661034912Seller's
ORPortland$1,350,000$1,075,0006152482836Seller's
QCMontreal$1,999,000$1,600,000363871639Buyer's
SCHiltonHead$2,095,000$1,349,000243585512Seller's
TNGreaterChattanooga$965,000$824,00018049434Seller's TNNashville$1,699,900$1,355,5006532462204Seller's TXAustin$1,098,222$995,00012425863549Seller's
TXCollinCounty$749,000$717,786144568162711Seller's TXDallas$1,300,000$1,004,00145020918611Seller's TXDentonCounty$775,786$750,00011015084259Seller's
TXElPaso$610,800$583,000154532915Balanced TXFortWorth$825,000$800,0009703934658Seller's
TXGreaterTyler$737,500$611,50014877489Seller's TXHouston$979,000$880,00011494393339Seller's
TXLubbock$652,500$599,95088342850Seller's
TXSanAngelo$650,000$594,95051271668Seller's TXSanAntonio$799,070$717,51563626219116Seller's
TXTheWoodlands&Spring$809,000$741,0002131191627Seller's UTParkCity$4,250,000$3,075,00020257167Buyer's UTSaltLakeCity$1,132,096$979,00046921015721Seller's
MACapeCod$2,495,000$1,789,500135403822Seller's MAGreaterBoston$2,950,000$3,250,000133491715Buyer's MASouthShore$1,875,000$1,350,00072232724Seller's MDAnneArundelCounty$999,999$954,95019057749Seller's MDFrederickCounty$875,000$847,35362202211Seller's MDHowardCounty$1,129,990$1,085,000111243219Seller's MDMontgomeryCounty$1,892,000$1,556,00018666757Seller's MDTalbotCounty$1,995,000$1,800,0003971310Seller's MDWorcesterCounty$1,000,000$855,0005391022Balanced MILivingstonCounty$765,000$695,00087222833Seller's MIMonroeCounty$624,500$567,500163440Seller's MIOaklandCounty$750,000$650,00090531624620Seller's MIWashtenawCounty$885,000$770,000167354424Seller's MIWayneCounty$699,900$615,200221848511Seller's MNOlmstedCounty$799,000$750,00081222310Seller's MNTwinCities$1,180,000$985,00068119619722Seller's MOKansasCity$675,000$662,431140225638410Seller's MOSt.Louis$825,000$675,000121516619Seller's NCAsheville$1,100,000$892,500255906814Seller's NCCharlotte$1,099,000$935,0006452292958Seller's NCLakeNorman$1,192,500$1,110,750198488014Seller's NCRaleigh-Durham$1,100,000$947,5005501611744Seller's NJBergenCounty$2,299,995$1,672,0002715110021Seller's NJHudsonCounty$1,699,500$1,587,500202829Seller's NJOceanCounty$899,900$850,00049413513219Seller's NMTaos$1,195,000$1,057,0256971852Seller's
NVLakeTahoe$3,495,000$2,397,5001381826133Balanced
NVLasVegas$1,699,000$1,537,9067241889136Buyer's NVReno$1,950,000$1,725,000142251784Buyer's
VAArlington&Alexandria$2,250,000$1,850,0007732496Seller's VACharlottesville$1,300,000$1,019,00014422446Seller's VAFairfaxCounty$1,999,900$1,500,0003461131527Seller's
VAMcLean&Vienna$2,750,000$1,850,00014731616Seller's VARichmond$799,900$790,1532911101976Seller's
NYFingerLakes$1,999,000$1,269,00039101210Seller's NYNassauCounty$1,800,000$1,549,50074915713034Balanced
VASmithMountainLake$1,750,000$1,325,00033984Seller's WAKingCounty-GreaterSeattle$1,970,000$1,695,00010145435386Seller's WASeattle$1,893,217$1,715,0002541401676Seller's WASpokane$1,150,000$987,50013562469Seller's
NYStatenIsland$1,275,000$1,251,250175403050Balanced NYSuffolkCounty$1,850,000$1,250,00090618015044Balanced OHCincinnati$849,900$700,00022554732Seller's OHClevelandSuburbs$789,500$667,7003073020Seller's NYSuffolkCounty$1,900,000$1,185,00084518916835Balanced
Median prices represent properties priced above respective city benchmark prices. Prices shown for Canadian cites are shown in Canadian Dollars.
StateMarket Name
ONGTA-Durham$1,749,000$1,555,0002111364614Seller's
ONGTA-York$2,375,000$1,880,00056332713713Seller's
ONHamilton$1,839,500$1,510,0002541212723Buyer's
ONMississauga$2,950,000$2,310,000137642618Balanced
ONOakville$2,514,900$2,400,000132823317Seller's
ONToronto$3,799,444$3,100,0004201785420Buyer's
ONGTA-Durham$1,882,500$1,525,0001921253313Balanced ONGTA-York$2,539,000$1,847,50047626411418Seller's ONHamilton$1,893,500$1,550,000216882534Buyer's ONMississauga$2,899,999$2,488,00012165922Buyer's ONOakville$2,424,950$2,300,000118782519Seller's ONToronto$3,799,888$3,200,0004032408513Seller's
ONWaterlooRegion$1,449,000$1,350,00012165435Buyer's
ONWaterlooRegion$1,474,000$1,300,0001661034912Seller's
ORPortland$1,350,000$1,075,0006152482836Seller's
QCMontreal$1,999,000$1,600,000363871639Buyer's
ORPortland$1,361,450$1,112,99863616716616Seller's QCMontreal$1,899,000$1,785,000349691773Buyer's SCHiltonHead$2,025,000$1,392,500248524614Balanced
SCHiltonHead$2,095,000$1,349,000243585512Seller's
SCTheGrandStrand$1,100,999$785,0003653639283Seller's TNGreaterChattanooga$992,500$804,75021658388Balanced
TNGreaterChattanooga$965,000$824,00018049434Seller's TNNashville$1,699,900$1,355,5006532462204Seller's TXAustin$1,098,222$995,00012425863549Seller's
TNNashville$1,736,000$1,220,0007052292079Seller's
TXAustin$1,100,000$942,500116536024630Seller's
TXCollinCounty$749,000$717,786144568162711Seller's TXDallas$1,300,000$1,004,00145020918611Seller's TXDentonCounty$775,786$750,00011015084259Seller's
TXCollinCounty$749,900$695,000141746340526Seller's
TXDallas$1,300,000$1,157,37545917716221Seller's TXDentonCounty$759,347$733,135110032529826Seller's
TXElPaso$610,800$583,000154532915Balanced
TXElPaso$610,800$585,000175382529Buyer's
TXFortWorth$825,000$800,0009703934658Seller's
TXFortWorth$849,987$799,95096331126821Seller's
TXGreaterTyler$737,500$611,50014877489Seller's TXHouston$979,000$880,00011494393339Seller's
TXGreaterTyler$799,000$621,900197653718Balanced
TXHouston$972,450$872,000115839724220Balanced
TXLubbock$652,500$599,95088342850Seller's
TXLubbock$640,000$599,500114413076Seller's
TXSanAngelo$650,000$594,95051271668Seller's TXSanAntonio$799,070$717,51563626219116Seller's
TXSanAngelo$643,944$571,75050151255Seller's
TXSanAntonio$799,000$731,25067019812443Balanced
TXTheWoodlands&Spring$831,250$740,000212898316Seller's
UTParkCity$4,925,000$3,438,850168272438Buyer's
UTSaltLakeCity$1,150,000$1,001,85046711612041Seller's
TXTheWoodlands&Spring$809,000$741,0002131191627Seller's UTParkCity$4,250,000$3,075,00020257167Buyer's UTSaltLakeCity$1,132,096$979,00046921015721Seller's
VAArlington&Alexandria$2,179,000$1,835,00099332911Seller's VACharlottesville$1,399,000$992,49513731325Seller's
VAFairfaxCounty$2,095,000$1,475,0003351109913Seller's
VAArlington&Alexandria$2,250,000$1,850,0007732496Seller's VACharlottesville$1,300,000$1,019,00014422446Seller's VAFairfaxCounty$1,999,900$1,500,0003461131527Seller's
VAMcLean&Vienna$2,695,000$1,897,500164463414Balanced
VARichmond$799,950$799,950325811518Seller's
VAMcLean&Vienna$2,750,000$1,850,00014731616Seller's VARichmond$799,900$790,1532911101976Seller's
VASmithMountainLake$1,662,500$1,307,0502261418Seller's
WAKingCounty-GreaterSeattle$1,899,000$1,625,000107941043912Seller's
WASeattle$1,850,000$1,675,0002571041118Seller's
WASpokane$1,200,000$1,100,000103333611Seller's
VASmithMountainLake$1,750,000$1,325,00033984Seller's WAKingCounty-GreaterSeattle$1,970,000$1,695,00010145435386Seller's WASeattle$1,893,217$1,715,0002541401676Seller's WASpokane$1,150,000$987,50013562469Seller's
NYSuffolkCounty$1,900,000$1,185,00084518916835Balanced
Median prices represent properties priced above respective city benchmark prices. Prices shown for Canadian cites are shown in Canadian Dollars.
StateMarket Name Median
ABCalgary$799,900$761,000129443464Seller's
AZChandlerandGilbert
AZFlagstaff
AZMesa
AZParadiseValley
AZPhoenix
AZScottsdale$867,450$760,000228784248Balanced
AZTucson
BCMidVancouverIsland$877,000$799,0006016621Buyer's BCOkanaganValley
BCVancouver$1,980,000$1,677,50010773726611Buyer's BCVictoria$989,450$932,500118503626Seller's BCWhistler$2,499,000$2,719,0003913911Seller's CACentralCoast$1,185,000$1,257,50032151611Seller's
CAEastBay$1,190,000$1,100,00016910112516Seller's CAGreaterPalmSprings
CALakeTahoe$1,495,000$1,160,00063201690Seller's CALosAngelesBeachCities$1,895,000$1,750,000168725117Seller's CALosAngelesCity$1,695,000$1,400,0003771165520Buyer's CALosAngelesTheValley$799,000$787,000139535626Seller's CAMarinCounty$1,195,000$1,260,0003381314Seller's
CANapaCounty
CAOrangeCounty$1,200,000$1,024,99840516016624Seller's CAPlacerCounty
CASacramento
CASanDiego$1,185,000$1,051,60032914412618Seller's CASanFrancisco$2,695,000$2,400,000143292727Balanced CASanLuisObispoCounty
CASantaBarbara$1,615,000$1,477,500158811Seller's CASiliconValley$1,750,000$1,570,000125615914Seller's CASonomaCounty$985,000$712,800203341Balanced
CAVenturaCounty$750,000$742,500111374035Seller's COAspen$3,699,000$3,687,500353681Balanced
COBoulder$900,615$838,87771192249Seller's
COColoradoSprings$598,290$587,000488729Buyer's CODenver$975,000$779,500159493412Seller's CODouglasCounty$559,495$632,8511821317Seller's
Markets with dashes do not have a significant luxury market for this report. Median prices represent properties priced above respective city benchmark prices. Prices shown for Canadian cites are shown in Canadian Dollars.
CODurango$793,905$886,00026911100Seller's COSummitCounty$1,650,000$1,022,000316864Seller's COTelluride
COVail$3,900,000$2,650,00069151436Balanced CTCentralConnecticut
CTCoastalConnecticut$1,402,000$777,500186344025Seller's DCWashingtonD.C.$1,895,000$1,595,00025390516Balanced
DESussexCountyCoastal$950,000$975,000277115Seller's FLBocaRaton/DelrayBeach$932,000$830,000300875920Balanced FLCoastalPinellasCounty$1,299,500$1,175,000108312822Seller's FLGreaterFortLauderdale$844,500$727,50099024611646Buyer's FLJacksonvilleBeaches$1,199,000$887,50043151831Seller's FLLeeCounty$835,500$870,000194393934Balanced
FLMarcoIsland$1,669,900$1,625,000336795Seller's FLMiami$1,399,700$1,350,000133227411457Buyer's
FLNaples$2,296,250$2,100,000142322921Balanced
FLOrlando$567,000$553,000218586239Seller's
FLPalmBeachTowns$1,700,000$1,950,000241581358Buyer's FLSarasota&Beaches$1,695,000$1,385,000127313622Seller's FLSouthPinellasCounty$1,050,000$995,000189504023Seller's FLSouthWalton$1,573,400$1,450,000236371944Buyer's FLSpaceCoast$738,000$734,000145402717Balanced FLTampa$849,995$870,00020074713Seller's FLWeston
GAAtlanta$720,290$665,00048816212817Seller's GADuluth
HIIslandofHawaii$1,795,000$1,535,0005110730Buyer's
HIKauai$1,574,500$1,240,00020448Balanced
HIMaui$2,295,000$1,487,50061162070Seller's HIOahu$1,195,000$990,00042111411934Seller's IDAdaCounty$649,888$580,00063221160Balanced
IDNorthernIdaho
ILChicago$1,199,500$958,30485125111035Buyer's ILDuPageCounty$925,000$775,0001981314Seller's
ILLakeCounty
ILWillCounty
INHamiltonCounty
Markets with dashes do not have a significant luxury market for this report. Median prices represent properties priced above respective city benchmark prices. Prices shown for Canadian cites are shown in Canadian Dollars.
ONGTA-Durham$1,749,000$1,555,0002111364614Seller's ONGTA-York$2,375,000$1,880,00056332713713Seller's
ONHamilton$1,839,500$1,510,0002541212723Buyer's
ONMississauga$2,950,000$2,310,000137642618Balanced
ONOakville$2,514,900$2,400,000132823317Seller's
ONToronto$3,799,444$3,100,0004201785420Buyer's
MACapeCod$850,000$736,0002571067Seller's MAGreaterBoston$2,299,000$1,900,0003771125524Buyer's MASouthShore$899,000$999,9951541564Seller's MDAnneArundelCounty$569,990$551,00059262413Seller's MDFrederickCounty
MDHowardCounty$584,990$585,0002713246Seller's MDMontgomeryCounty$795,000$760,00096406710Seller's MDTalbotCounty
ONWaterlooRegion$1,474,000$1,300,0001661034912Seller's ORPortland$1,350,000$1,075,0006152482836Seller's QCMontreal$1,999,000$1,600,000363871639Buyer's SCHiltonHead$2,095,000$1,349,000243585512Seller's
MDWorcesterCounty$725,000$602,45066272611Seller's MILivingstonCounty
TNGreaterChattanooga$965,000$824,00018049434Seller's TNNashville$1,699,900$1,355,5006532462204Seller's TXAustin$1,098,222$995,00012425863549Seller's
MIMonroeCounty
MIOaklandCounty$645,467$624,10368211832Seller's MIWashtenawCounty$630,000$622,29056119100Balanced MIWayneCounty$665,186$607,5008015847Buyer's MNOlmstedCounty
MNTwinCities
MOKansasCity
MOSt.Louis
TXCollinCounty$749,000$717,786144568162711Seller's TXDallas$1,300,000$1,004,00145020918611Seller's TXDentonCounty$775,786$750,00011015084259Seller's TXElPaso$610,800$583,000154532915Balanced TXFortWorth$825,000$800,0009703934658Seller's TXGreaterTyler$737,500$611,50014877489Seller's TXHouston$979,000$880,00011494393339Seller's
TXLubbock$652,500$599,95088342850Seller's
NCAsheville$710,000$660,00040151021Seller's NCCharlotte$657,436$618,082197447415Seller's NCLakeNorman$585,754$570,00033658Balanced
NCRaleigh-Durham
TXSanAngelo$650,000$594,95051271668Seller's TXSanAntonio$799,070$717,51563626219116Seller's
TXTheWoodlands&Spring$809,000$741,0002131191627Seller's UTParkCity$4,250,000$3,075,00020257167Buyer's UTSaltLakeCity$1,132,096$979,00046921015721Seller's
NJBergenCounty$1,234,684$1,026,652136274224Seller's NJHudsonCounty$1,487,500$1,287,500104233240Seller's NJOceanCounty$849,000$717,0002913821Seller's NMTaos
NVLakeTahoe$1,250,000$1,250,0003063119Buyer's NVLasVegas
NVReno
VAArlington&Alexandria$2,250,000$1,850,0007732496Seller's VACharlottesville$1,300,000$1,019,00014422446Seller's VAFairfaxCounty$1,999,900$1,500,0003461131527Seller's
NYFingerLakes
NYNassauCounty$1,568,888$1,070,00081191923Seller's NYStatenIsland$619,950$640,000118352538Seller's NYSuffolkCounty$750,000$635,000151435729Seller's OHCincinnati$669,950$695,000122622Seller's OHClevelandSuburbs
VAMcLean&Vienna$2,750,000$1,850,00014731616Seller's VARichmond$799,900$790,1532911101976Seller's VASmithMountainLake$1,750,000$1,325,00033984Seller's WAKingCounty-GreaterSeattle$1,970,000$1,695,00010145435386Seller's WASeattle$1,893,217$1,715,0002541401676Seller's WASpokane$1,150,000$987,50013562469Seller's
NYSuffolkCounty$1,900,000$1,185,00084518916835Balanced
Markets with dashes do not have a significant luxury market for this report. Median prices represent properties priced above respective city benchmark prices. Prices shown for Canadian cites are shown in Canadian Dollars.
ONGTA-Durham$1,749,000$1,555,0002111364614Seller's ONGTA-York$2,375,000$1,880,00056332713713Seller's
ONGTA-York$799,000$777,0002581647919Seller's
ONHamilton$1,839,500$1,510,0002541212723Buyer's
ONHamilton$853,900$871,000311744Buyer's
ONMississauga$2,950,000$2,310,000137642618Balanced
ONMississauga$999,000$905,00098633517Seller's
ONOakville$2,514,900$2,400,000132823317Seller's
ONOakville$1,229,450$1,210,00044291041Seller's
ONToronto$3,799,444$3,100,0004201785420Buyer's
ONWaterlooRegion$1,474,000$1,300,0001661034912Seller's
ONToronto$1,249,900$1,100,00077546816617Seller's ONWaterlooRegion$789,900$750,000483316Buyer's
ORPortland$749,900$619,014257775619Seller's QCMontreal$1,161,149$1,230,5009221849Buyer's SCHiltonHead$1,045,000$935,0004311969Balanced
SCTheGrandStrand$549,900$482,4751571575458Seller's TNGreaterChattanooga
ORPortland$1,350,000$1,075,0006152482836Seller's QCMontreal$1,999,000$1,600,000363871639Buyer's SCHiltonHead$2,095,000$1,349,000243585512Seller's TNGreaterChattanooga$965,000$824,00018049434Seller's TNNashville$1,699,900$1,355,5006532462204Seller's TXAustin$1,098,222$995,00012425863549Seller's
TNNashville$709,950$727,00013037473Seller's TXAustin$839,500$762,500272824428Balanced
TXCollinCounty
TXDallas$799,000$629,000147483516Seller's
TXDentonCounty
TXElPaso
TXFortWorth
TXGreaterTyler
TXCollinCounty$749,000$717,786144568162711Seller's TXDallas$1,300,000$1,004,00145020918611Seller's TXDentonCounty$775,786$750,00011015084259Seller's TXElPaso$610,800$583,000154532915Balanced TXFortWorth$825,000$800,0009703934658Seller's TXGreaterTyler$737,500$611,50014877489Seller's TXHouston$979,000$880,00011494393339Seller's
TXHouston$622,500$597,000128433524Seller's
TXLubbock$652,500$599,95088342850Seller's
TXLubbock
TXSanAngelo
TXSanAngelo$650,000$594,95051271668Seller's TXSanAntonio$799,070$717,51563626219116Seller's
TXSanAntonio$800,000$560,000339779Seller's
TXTheWoodlands&Spring
UTParkCity$2,150,000$1,650,00081171962Seller's UTSaltLakeCity$569,950$575,650166454144Seller's
TXTheWoodlands&Spring$809,000$741,0002131191627Seller's UTParkCity$4,250,000$3,075,00020257167Buyer's UTSaltLakeCity$1,132,096$979,00046921015721Seller's
VAArlington&Alexandria$982,450$1,080,000122525415Seller's
VACharlottesville$774,900$533,704297130Seller's VAFairfaxCounty$769,900$700,0002078510515Seller's
VAArlington&Alexandria$2,250,000$1,850,0007732496Seller's VACharlottesville$1,300,000$1,019,00014422446Seller's VAFairfaxCounty$1,999,900$1,500,0003461131527Seller's
VAMcLean&Vienna$1,250,000$1,105,00037141223Seller's VARichmond
VAMcLean&Vienna$2,750,000$1,850,00014731616Seller's VARichmond$799,900$790,1532911101976Seller's
VASmithMountainLake
WAKingCounty-GreaterSeattle$1,100,000$980,000266758511Seller's WASeattle$1,296,500$1,324,000142342221Balanced WASpokane
VASmithMountainLake$1,750,000$1,325,00033984Seller's WAKingCounty-GreaterSeattle$1,970,000$1,695,00010145435386Seller's WASeattle$1,893,217$1,715,0002541401676Seller's WASpokane$1,150,000$987,50013562469Seller's
NYSuffolkCounty$1,900,000$1,185,00084518916835Balanced
Markets with dashes do not have a significant luxury market for this report. Median prices represent properties priced above respective city benchmark prices. Prices shown for Canadian cites are shown in Canadian Dollars.