FOWKES


LINDSEY
LUXURY MARKET REPORT TAMPA | OCTOBER 2022

Lindsey was born and raised in York Pennsylvania, so she’s had her fill of sleet and snow. Her father was a decorated golfer in the state, which sparked her interested in the environmental sciences from a young age. After graduating from West Virginia University in 2002 with a degree in Agronomy/Turfgrass Management, she was determined to start a new life close to sand and sun and escape the harsh winters. With a golf course background and no job in sight, she packed her car full of her belongings, put her car on the auto train, and headed south to the Sunshine State to pursue her dreams. She started a job bar-tending in Hyde Park Village and used that as an avenue to network with other local professionals. Her first full time position was selling landscape materials to residential and commercial developers across the state of FL while the real estate market was booming in 2004-2006. With the travel necessary for that position and pregnant with her first child, Lindsey began selling real estate just before the housing market crisis of 2007. Not only did she survive one of the most challenging markets, but her business soured to new levels. In order to maintain the worklife-balance she continues to strive for on a daily basis, being married and raising 2 little ladies, she began The Fowkes Group in 2012, bringing together a collection of skilled real estate professionals to better serve the city she loves.

Today, The Fowkes Group continues to grow and flourish and has been recognized year after year as one of the top producing Real Estate Teams across the Tampa Bay Area and throughout the nation. This special group is not only active with their clients, but in the community as well, with major volunteer and donation ties to Metropolitan Ministries of Tampa Bay. To Lindsey, this business is not only about personal and professional relationships, it’s about passion and community.
In 2021, Lindsey embarked on the next step on her professional journey, she began her own RE/MAX franchise servicing the Tampa Bay area, RE/MAX Collective, in order to scale her business and have a greater ability to collaborate with other top agents and change the face of real estate. “It’s simply time! After almost 14 years in the business, it’s time to not only continue toward mastery for myself and my amazing clients, but to be able to assist in the collective success of talented agents throughout our community.”
“RE/MAX Collective gives opportunity and space for collaboration among other like minded agents, innovation through marketing tactics and progressive ideas, empowerment through accountability and teamwork, gratitude for this beautiful life we live and for the opportunity to do what we’re passionate about, selling real estate and exceeding our clients expectations time and time again in Tampa Bay! Together, we’re ready to elevate and take Tampa Bay real estate to the next level. We’re ready to help homeowners flourish and navigate through the Bay market and provide our buyers and sellers the presence, digital know how, and profits they deserve!”

Lindsey and her husband Tony have two young daughters, Addison and Delaney, and a boxer baby named Mila, who keep them busy with sports and social activities, but are also community advocates and participate in many charitable organizations. In her time away from real estate, Lindsey, enjoys relaxing by the beach, boating on the turquois blue Florida retreats, and of course for anyone that knows her, fine wine.

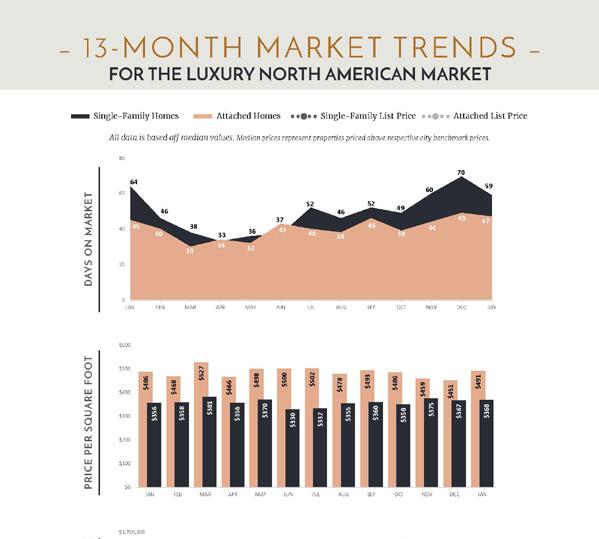

The Institute for Luxury Home Marketing has analyzed a number of metrics — including sales prices, sales volumes, number of sales, sales-price-to-list-price ratios, days on market and price-per-square-foot – to provide you a comprehensive North American Luxury Market report.
Additionally, we have further examined all of the individual luxury markets to provide both an overview and an in-depth analysis - including, where data is sufficient, a breakdown by luxury single-family homes and luxury attached homes.
It is our intention to include additional luxury markets on a continual basis. If your market is not featured, please contact us so we can implement the necessary qualification process. More in-depth reports on the luxury communities in your market are available as well.
Looking through this report, you will notice three distinct market statuses, Buyer's Market, Seller's Market, and Balanced Market. A Buyer's Market indicates that buyers have greater control over the price point. This market type is demonstrated by a substantial number of homes on the market and few sales, suggesting demand for residential properties is slow for that market and/or price point.
By contrast, a Seller's Market gives sellers greater control over the price point. Typically, this means there are few homes on the market and a generous demand, causing competition between buyers who ultimately drive sales prices higher.
A Balanced Market indicates that neither the buyers nor the sellers control the price point at which that property will sell and that there is neither a glut nor a lack of inventory. Typically, this type of market sees a stabilization of both the list and sold price, the length of time the property is on the market as well as the expectancy amongst homeowners in their respective communities – so long as their home is priced in accordance with the current market value.
REMAINING INVENTORY: The total number of homes available at the close of a month.
DAYS ON MARKET: Measures the number of days a home is available on the market before a purchase offer is accepted.
LUXURY BENCHMARK PRICE: The price point that marks the transition from traditional homes to luxury homes.
NEW LISTINGS: The number of homes that entered the market during the current month.
PRICE PER SQUARE FOOT: Measures the dollar amount of the home's price for an individual square foot.
SALES RATIO: Sales Ratio defines market speed and determines whether the market currently favors buyers or sellers. Buyer's Market = up to 14%; Balanced Market = 15 to 20%; Seller's Market = 21% plus. If >100%, sales from previous month exceed current inventory.
SP/LP RATIO: The Sales Price/List Price Ratio compares the value of the sold price to the value of the list price.
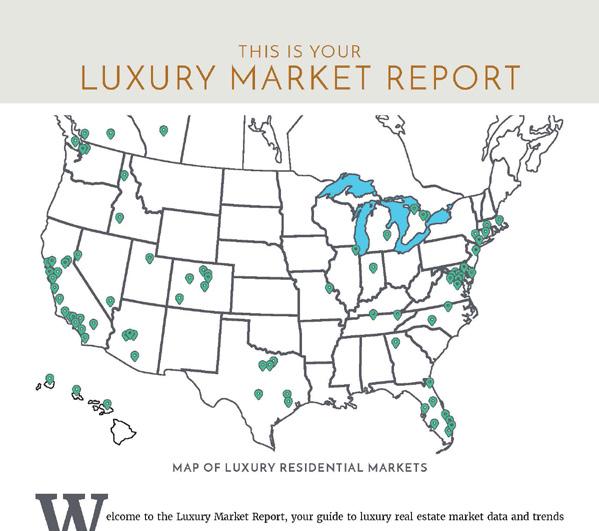
elcome to the Luxury Market Report, your guide to luxury real estate market data and trends for North America. Produced monthly by The Institute for Luxury Home Marketing, this report provides an in-depth look at the top residential markets across the United States and Canada. Within the individual markets, you will find established luxury benchmark prices and detailed survey of luxury active and sold properties designed to showcase current market status and recent trends. The national report illustrates a compilation of the top North American markets to review overall standards and trends.
Copyright © 2022 Institute for Luxury Home Marketing | www.luxuryhomemarketing.com | 214.485.3000
The Luxury Market Report is a monthly analysis provided by The Institute for Luxury Home Marketing. Luxury benchmark prices are determined by The Institute. This active and sold data has been provided by REAL Marketing, who has compiled the data through various sources, including local MLS boards, local tax records and Realtor.com. Data is deemed reliable to the best of our knowledge, but is not guaranteed.
It is hard to picture that less than 12 months ago, the luxury real estate market was on a strong upward trajectory, consistently seeing demand increase, prices soar, and inventory levels fall.
Even though we realized that this trend could not continue infinitely, the speed at which the market appeared to turn in May 2022 seemed almost as dramatic as the upswing in May 2020 at the start of the pandemic.
Although the tables changed earlier this summer, with the number of homes listed for sale climbing for the first time since the start of the pandemic, there was still a feeling that while there would be a transition, it would be more gradual, eventually settling into a traditionally paced market.
Instead, what we saw over the last few months was a turmoil of differing opinions about the current status, media hype of doom and gloom, and expert contradictions about the future of the luxury real estate market.
The simple truth is that both the economy and the real estate market are in a state of unpredictable flux, when even traditional methods, such as raising interest rates, are not achieving the desired results as inflation increases. In September, U.S. inflation rose to 6.6%; in Canada, it is currently 7%.
In some locations, we see the severe impact of this increase in interest rates on the number of sales, whereas, in others, the lack of inventory is still playing heavily in the seller’s favor. Some buyers are feeling the affordability squeeze because of the additional increase in the cost of borrowing. Yet, with very few sellers needing to put their homes on the market, inventory levels remain historically low, leaving even cash buyers without the negotiating power typically expected in a transitioning market.
The reality is the factors of how buyers and sellers are reacting combined with influences from outside the industry are creating conflicting messages that are resulting in strange times throughout the real estate market.
It may be a surprise to discover that our analysis for September shows that many markets remain favorable to sellers for both luxury single-family and attached properties.
Last month we reported that 106 of our 140 single-family markets were still favorable to sellers. While 16 have transitioned to balanced – where the market is equally favorable to sellers as it is to buyers – 90 remain seller’s markets.
In the attached market, of the 96 markets reported on by the Institute, 77 remain seller’s markets.
It seems that there are still plenty of buyers – indeed, a survey by Bank of America found that the young and wealthy prefer assets like cryptocurrency, real estate, and private equity over investing in the stock market.
“Individuals ages 21 to 42 with at least $3 million in assets have only a quarter of their portfolio in equities, compared with more than half for those who are older”, according to the study.
This is significant, especially for the future, as Baby Boomers are estimated to transfer over $84 trillion of their wealth to Generation X and millennials between now and 2045, according to market research by Cerulli Associates.
Coming back to the current status, it is important to realize that most luxury markets are starting or transitioning toward more favorable conditions for buyers as inventory levels steadily climb month over month.
As of September, the sales ratio, which measures the monthly sales against the remaining active listings at the end of the month for both single-family home and attached property markets, saw a further shift downwards towards the 21% threshold mark, which signifies a change from seller to a balanced market.

However, there is an anomaly in the claim that inventory levels are rising – the reality is that they are also increasing because homes are staying on the market longer. More choice has slowed the velocity of sales compared to 2021, but the lack of new inventory has equally slowed.
September’s increase in new inventory is typically one of the largest of the calendar year, escalated by individuals returning from the vacation season with new plans; it kicks off the second busiest season in real estate. While the actual number of properties for sale in September 2022 rose significantly compared to September 2021, an increase of just 6% from August 2022 is well under the traditional expected norms of a 12-18% increase between these two months.
But it would be unrealistic to expect the extraordinary results of 2021, where the number of sales was greater than the remaining inventory each month. Nor should we expect to see many sales closing over the asking price and even fewer multiple offers – all typifying a directional transition toward a more balanced market.
Given the time of year, the current economic influences, and the uncertainty surrounding real estate demand, it is still hard to predict when or even if the luxury market will fully become a buyer’s market.
September’s numbers indicate an overall shift. However, as we head towards the winter months when typically, less inventory enters the market, we may see that ratio climb back up, especially if current sellers whose properties have been on the market for some time start to drop their prices further and attract more sales.

Much might also depend on whether we enter a recession. Currently, interest rates being hiked, stock markets falling, and companies scaling back their workforce are causing homebuyers to put on the brakes.
But, if we do go into a recession, interest rate hikes will be less likely as governments will look for people to start spending again to drive the economy. This will mean the cost of borrowing money will either stall at its present rate or even fall, creating more favorable conditions for purchasing real estate again.
All this speculation translates into a disconnect within the market, especially where sellers are not ready to drop their prices and buyers are looking to negotiate. But while economists and real estate experts debate the future, it is obvious that the luxury real estate market has started to go through a correction, and its overall status has shifted direction.

Those looking for investment opportunities are focusing on the newer and second home markets, which saw some of the biggest price increases during the pandemic, as indications are that prices, although not lower than September 2021, have decreased in the last six months.
Contrary to this, other markets are seeing their sellers hold off, not wanting to trade their low mortgage rates for considerably higher ones, or realizing they have missed the peak, they are simply not putting their homes up for sale. This means that inventory levels are not increasing at the expected rate, which will slow the fall of home prices for these markets.
Equally, there is still a housing shortage in many luxury markets, albeit a highly varied one depending on the location and price point. However, in certain high-demand communities, there simply isn’t any inventory available because it was all snapped up during the last two years.
One thing is certain, now more than ever, it is important to work with a luxury property specialist to ascertain what is truly happening in your local marketplace. The art of selling and buying in this market needs a critical and analytical approach; understanding the realities and setting expectations accordingly will ensure that goals are achieved.
Median
Median
Median
Total Sales
100.00%
Median Price per Sq. Ft. $397
Total Inventory 33,154 54,616
New
11,720 18,310
Sold 17,368 15,035
on Market
Home Size 3,425 3,190
Median
Median
Median
100.00%
Total Sales Ratio 40.67% 24.80%
Median Price per Sq. Ft. $504
Total Inventory 12,400 16,143
New
Total
Median
on Market
4,779 5,876
5,043 4,004
Average Home Size 1,985 1,845
AB Calgary
$1,100,000 $960,000 557 264 142 24 Seller's
AZ Chandler and Gilbert $1,069,850 $970,000 269 87 82 48 Seller's
AZ Flagstaff
$1,397,000 $1,182,000 94 23 14 81 Buyer's
AZ Mesa $847,000 $830,000 236 71 70 42 Seller's
AZ Paradise Valley
$4,999,000 $3,600,000 133 31 15 44 Buyer's
AZ Phoenix $850,000 $775,000 935 317 275 45 Seller's
AZ Scottsdale
$1,850,000 $1,570,000 737 231 139 49 Balanced
AZ Tucson $699,900 $640,000 850 279 223 12 Seller's
BC Mid Vancouver Island $1,599,900 $1,440,000 199 69 15 22 Buyer's
BC Okanagan Valley $1,779,500 $1,587,500 928 243 65 41 Buyer's
BC Vancouver $4,480,000 $3,638,800 1187 312 59 17 Buyer's
BC Victoria $2,299,000 $2,067,000 136 67 27 49 Balanced
BC Whistler $4,500,000 $5,815,000 52 11 4 97 Buyer's
CA Central Coast $2,755,000 $2,600,000 245 80 72 13 Seller's
CA East Bay $2,195,000 $1,920,000 527 295 397 16 Seller's
CA Greater Palm Springs $1,895,000 $1,567,500 298 151 70 37 Seller's
CA Lake Tahoe $2,495,000 $1,697,500 194 30 38 28 Balanced
CA Los Angeles Beach Cities $5,997,000 $4,260,000 304 102 77 17 Seller's
CA Los Angeles City $4,995,000 $3,405,000 684 219 120 24 Balanced
CA Los Angeles The Valley $2,458,888 $2,100,000 507 213 140 24 Seller's
CA Marin County $3,895,000 $2,950,000 136 20 30 11 Seller's
CA Napa County
$4,750,000 $2,650,000 117 16 20 20 Balanced
CA Orange County $2,549,000 $2,212,500 1031 336 370 19 Seller's
CA Placer County $1,159,000 $1,082,500 274 86 88 23 Seller's
CA Sacramento $945,000 $905,000 711 284 255 18 Seller's
CA San Diego $2,099,000 $1,850,000 1144 439 303 19 Seller's
CA San Francisco $4,497,500 $3,182,500 166 66 48 14 Seller's
CA San Luis Obispo County $1,799,000 $1,395,000 161 50 72 37 Seller's
CA Santa Barbara $6,495,000 $3,537,500 127 44 40 16 Seller's
CA Silicon Valley $3,950,000 $3,350,000 526 266 245 12 Seller's
CA Sonoma County $2,500,000 $1,625,000 225 43 47 32 Balanced
CA Ventura County $2,074,000 $1,660,000 262 70 75 38 Seller's
CO Aspen $14,900,000 $7,750,000 95 5 3 87 Buyer's CO Boulder $2,185,000 $1,650,000 228 88 73 42 Seller's
CO Colorado Springs $900,000 $859,000 428 124 137 18 Seller's
State Market Name
Median List Price Median Sold Price Inventory
New Listings Sold Days on Market Market Status
AB Calgary $750,000 $720,000 145 44 29 46 Balanced
AZ Chandler and Gilbert
AZ Flagstaff
AZ Mesa
AZ Paradise Valley
AZ Phoenix
AZ Scottsdale
AZ Tucson
$872,500 $690,000 208 60 44 48 Seller's
BC Mid Vancouver Island $869,900 $822,722 67 36 10 46 Buyer's
BC Okanagan Valley
BC Vancouver $1,998,000 $1,787,500 1018 400 56 27 Buyer's
BC Victoria $971,950 $930,000 142 94 32 35 Seller's
BC Whistler $2,518,500 $1,917,500 40 15 2 56 Buyer's
CA Central Coast $1,249,000 $1,075,000 29 13 31 14 Seller's
CA East Bay $1,100,000 $1,072,500 155 86 102 17 Seller's
CA Greater Palm Springs
CA Lake Tahoe
$1,850,000 $1,846,289 29 8 8 26 Seller's
CA Los Angeles Beach Cities $1,850,000 $1,618,750 155 58 58 16 Seller's
CA Los Angeles City $1,649,000 $1,392,500 383 133 78 26 Balanced
CA Los Angeles The Valley $799,000 $785,000 144 54 64 23 Seller's CA Marin County $1,300,000 $977,500 32 2 10 13 Seller's
CA Napa County
CA Orange County
$1,180,000 $1,129,995 382 164 162 25 Seller's CA Placer County
CA Sacramento
CA San Diego
$1,124,000 $1,031,000 413 176 156 19 Seller's
CA San Francisco $2,750,000 $2,500,000 139 34 25 33 Balanced
CA San Luis Obispo County
CA Santa Barbara $1,695,000 $1,625,000 13 9 8 6 Seller's
CA Silicon Valley $1,684,444 $1,610,000 120 66 74 15 Seller's
CA Sonoma County $914,500 $744,750 20 5 10 32 Seller's
CA Ventura County $750,000 $747,000 118 50 64 25 Seller's
CO Aspen $3,649,000 $3,637,500 38 6 6 64 Balanced
CO Boulder $876,950 $955,000 74 37 40 48 Seller's
CO Colorado Springs $590,156 $602,500 44 10 18 13 Seller's

$3,000,000 - $3,999,999
$2,000,000 - $2,999,999
$1,500,000 - $1,999,999
$1,000,000 - $1,499,999
$900,000 - $999,999
$800,000 - $899,999
$750,000 - $799,999
$700,000 - $749,999
$650,000 - $699,999
$600,000 - $649,999
$580,000 - $599,999
$560,000 - $579,999
$540,000 - $559,999
$525,000 - $539,999
$2,000,000+
$1,750,000 - $1,999,999
$1,500,000 - $1,749,999
$1,350,000 - $1,499,999
$1,200,000 - $1,349,999
$1,050,000 - $1,199,999
$900,000 - $1,049,999
$800,000 - $899,999
$750,000 - $799,999
$700,000 - $749,999
$650,000 - $699,999
$600,000 - $649,999
$550,000 - $599,999
$525,000 - $549,999
$500,000 - $524,999
you for taking time to view this report.


more information about this report and the services I can offer you and your luxury property, please give me a call at 813.943.1392.