

KIM MELHUISH LUXURY MARKET REPORT O A KVILLE June 2024

KIM MELHUISH
Your success and experience are my top-priorities!
I have a background PhD and graduate levels statistics, along with a successful history in business, social networking and marketing. I enthusiastically combine all of these skills and experiences with my extensive list of advanced real estate designations in order to provide exemplary contribution to my clients. I feel that good is not good enough and that the “extra-mile” is required in every circumstance.
In addition to strong preparation, marketing and negotiation, I pride myself on my awareness of the market and trends, my integrity, my attention to detail and my exceptional work ethic. I have a large group of professionals and trades that I work with so that your experience can be as seamless and stress-free as possible.
You can rest assured that I am fully in your corner and that I am here to help you win.


Member of eXp Realty of Canada, Brokerage
Certified Negotiation Expert, GUILD CLHMS, NAR Green Home Designation, Certified Staging Design Professional, Rate-My-Agent Top Professional 416.804.9604 Kim@KMrealhomes.ca www.KMrealhomes.ca
REALTOR®,
Master
TABLE OF CONTENTS
PAGE 4 LUXURY REPORT EXPLAINED
PAGE 5 WELCOME MESSAGE
PAGE 6-9 NORTH AMERICAN LUXURY MARKET REVIEW
PAGE 10 13-MONTH MARKET TRENDS
PAGE 11 SINGLE-FAMILY HOMES MONTHLY OVERVIEW
PAGE 12 ATTACHED HOMES MONTHLY OVERVIEW
PAGE 13-16 MONTHLY STATISTICS BY CITY
PAGE 17 LOCAL LUXURY MARKET REVIEW
PAGE 18-19 SINGLE-FAMILY HOMES - Monthly Statistics
PAGE 20-21 ATTACHED HOMES - Monthly Statistics
PAGE 22 THANK YOU

– LUXURY REPORT EXPLAINED –
The Institute for Luxury Home Marketing has analyzed a number of metrics — including sales prices, sales volumes, number of sales, sales-price-to-list-price ratios, days on market and price-per-square-foot – to provide you a comprehensive North American Luxury Market report.
Additionally, we have further examined all of the individual luxury markets to provide both an overview and an in-depth analysis - including, where data is sufficient, a breakdown by luxury single-family homes and luxury attached homes.
It is our intention to include additional luxury markets on a continual basis. If your market is not featured, please contact us so we can implement the necessary qualification process. More in-depth reports on the luxury communities in your market are available as well.
Looking through this report, you will notice three distinct market statuses, Buyer's Market, Seller's Market, and Balanced Market. A Buyer's Market indicates that buyers have greater control over the price point. This market type is demonstrated by a substantial number of homes on the market and few sales, suggesting demand for residential properties is slow for that market and/or price point.
By contrast, a Seller's Market gives sellers greater control over the price point. Typically, this means there are few homes on the market and a generous demand, causing competition between buyers who ultimately drive sales prices higher.
A Balanced Market indicates that neither the buyers nor the sellers control the price point at which that property will sell and that there is neither a glut nor a lack of inventory. Typically, this type of market sees a stabilization of both the list and sold price, the length of time the property is on the market as well as the expectancy amongst homeowners in their respective communities – so long as their home is priced in accordance with the current market value.
REPORT GLOSSARY
DAYS ON MARKET: Measures the number of days a home is available on the market before a purchase offer is accepted.
LUXURY BENCHMARK PRICE: The price point that marks the transition from traditional homes to luxury homes.
NEW LISTINGS: The number of homes that entered the market during the current month.
PRICE PER SQUARE FOOT: Measures the dollar amount of the home's price for an individual square foot.
SALES RATIO: Sales Ratio defines market speed and determines whether the market currently favors buyers or sellers. A Buyer's Market has a Sales Ratio of less than 12%; a Balanced Market has a ratio of 12% up to 21%; a Seller's Market has a ratio of 21% or higher. A Sales Ratio greater than 100% indicates the number of sold listings exceeds the number of listings available at the end of the month.
SP/LP RATIO: The Sales Price/List Price Ratio compares the value of the sold price to the value of the list price.
REMAINING INVENTORY: The total number of homes available at the close of a month.
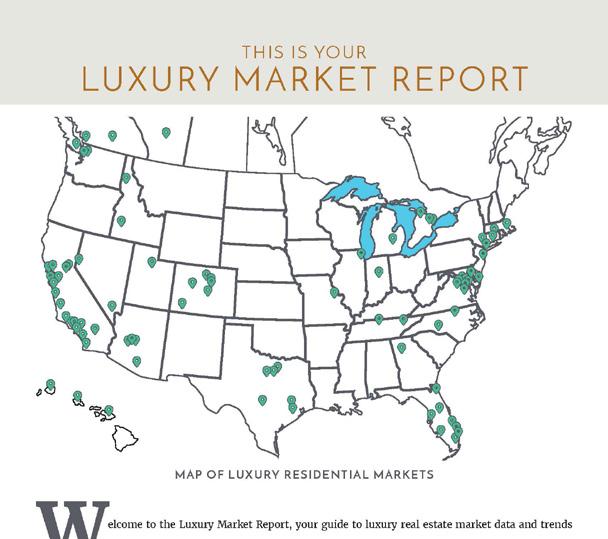
MAP OF LUXURY RESIDENTIAL MARKETS
elcome to the Luxury Market Report, your guide to luxury real estate market data and trends for North America. Produced monthly by The Institute for Luxury Home Marketing, this report provides an in-depth look at the top residential markets across the United States and Canada. Within the individual markets, you will find established luxury benchmark prices and detailed survey of luxury active and sold properties designed to showcase current market status and recent trends. The national report illustrates a compilation of the top North American markets to review overall standards and trends.
Copyright © 2023 Institute for Luxury Home Marketing | www.luxuryhomemarketing.com | 214.485.3000
The Luxury Market Report is a monthly analysis provided by The Institute for Luxury Home Marketing. Luxury benchmark prices are determined by The Institute. This active and sold data has been provided by REAL Marketing, who has compiled the data through various sources, including local MLS boards, local tax records and Realtor.com. Data is deemed reliable to the best of our knowledge, but is not guaranteed.
THIS IS YOUR LUXURY
MARKET REPORT W
NORTH AMERICAN LUXURY REVIEW
Luxury Trends for the Summer of 2024
As we head into summer, what trends are set to define this season’s must-haves, and are there any surprises?
Despite a turbulent couple of years, increased inflation, rising living costs, and geopolitical factors, the luxury market continues to show resilience, with data trends indicating a stronger year compared to 2023.
The number of luxury properties sold has risen month over month since the start of 2024 and compared to the same months in 2023. May’s figures for single-family homes have increased by 93.4% since January and by 15.1% compared to May 2023. Attached homes have risen by 90.7% since January and by 8.1% compared to May 2023.
This sales trend is greatly assisted by the increased level of new inventory entering the market, up by a staggering 226.5% since January and by 31.3% compared to May 2023 for single-family homes. Attached home inventory increased even more over the last five months, by 260.3%, and year over year, by 33.9%.
Interest rates are expected to continue impacting some affluent buyers, who remain both cautious and strategic about their purchasing decisions. However, given the constant uptick in inventory levels and sales, we remain optimistic for the summer of 2024, especially if both interest and mortgage rates remain relatively stable.
Overall, this summer should see high-net-worth individuals continue to invest in prime properties, both for personal use and as part of a diversified investment portfolio. Locations offering exclusive amenities, privacy, and premium views are particularly attractive, with coastal properties and urban penthouses among the most sought-after in this segment.
This summer, we expect lifestyle drivers to remain largely consistent, particularly with the growing preference for luxury amenities, smart home technology, privacy, wellness, and safe real estate
investments. While there may be slight shifts in spending emphasis as buyers look to enjoy the summer months, whether through purchasing new residences or upgrading existing amenities, the overall trends are expected to persist.
Locations in Demand
Luxury properties are sought after in various locations, but high-end buyers particularly value proximity to desirable amenities and stunning natural surroundings. Perennial favorites include waterfront residences, mountain retreats, and urban penthouses with panoramic city views. Additionally, properties in exclusive neighborhoods renowned for their prestige continue to command attention.
Waterfront properties, such as beachfront estates, lakeside retreats, private island escapes, and oceanview homes, are especially popular during the summer months. It is anticipated that demand and prices will be heightened in many locations as inventory levels remain low. Affluent buyers are drawn to these locations for the opportunity to enjoy ideal settings for summer escapes and leisure activities.
Summer is a prime time for family gatherings and vacations, a trend that has surged since the end of COVID-19, with “travel revenge” driving affluent buyers’ plans. As a result, luxury properties with ample space for multi-generational living, children’s play areas, and family-friendly amenities like home theaters, game rooms, and outdoor playgrounds are likely to see increased demand.
Luxury buyers are also expected to invest in vacation rentals and second homes in desirable destinations. These properties offer a retreat for personal use during the summer and potential rental income during the rest of the year.
With the rise of remote work, second homes in vacation destinations are expected to become more popular during the summer months. Buyers seek properties in scenic locations that can serve as both vacation spots and remote work environments, boosting markets in rural and coastal areas known for their natural beauty and recreational opportunities.
There is growing demand for eco-friendly and sustainable luxury retreats among environmentally conscious buyers. Properties that blend luxury with green features, such as solar panels, rainwater harvesting systems, and organic gardens, are particularly attractive this summer.
Amenities in Demand
Technological advancements, mindful practices, and the resurgence of timeless aesthetics are at the forefront of luxury home amenities in 2024, showcasing an exciting blend of old and new concepts and bringing forth a unique array of trends that redefine luxury living in the new era.
With warmer weather, luxury buyers seek properties with state-of-the-art outdoor entertainment features, such as landscaped gardens, poolside cabanas, outdoor theaters, fire pits, barbecue areas, and sports courts, sought after for hosting summer soirées and entertaining guests in style.
Luxury properties with resort-style amenities such as private beaches, tennis courts, golf courses, marinas, and spa facilities see increased demand during the summer season as buyers look for a vacation-like experience without leaving home.
Integration of smart home technology for summer comfort becomes increasingly important, with features like automated climate control, remote-controlled shades, outdoor misting systems, and smart irrigation systems to optimize energy efficiency and enhance the summer living experience. The affluent are increasingly prioritizing spaces that promote relaxation, rejuvenation, and a healthy lifestyle. The focus on wellness amenities reflects a growing desire for properties that offer personal retreats and support mental and physical health. Luxury buyers are prioritizing health and wellness features like infinity pools, outdoor yoga decks, meditation gardens, and spa-like bathrooms this summer.
Multifunctional spaces reflect the evolving needs of contemporary living. Buyers are looking for homes that can accommodate various activities under one roof, such as remote work, fitness, and entertainment, ensuring that their living spaces can meet evolving lifestyle needs.
These amenities are in demand because they align with the evolving priorities of luxury buyers, who are seeking homes that support a healthy lifestyle, environmental sustainability, flexible living arrangements, and family inclusivity.
Design Trends in Demand
Quiet luxury that transcends fleeting trends, focusing on timeless design principles that endure, and is expected to be the overall theme as we move into the summer months. Classic shapes, neutral tones, and enduring materials that create a foundation of simplicity and subtle elegance, transforming the ordinary into the extraordinary.
In 2024, there is a growing appreciation for craftsmanship and uniqueness in luxury home design. Artisan and custommade fixtures and furniture are increasingly sought after,
offering distinct touches that set high-end homes apart. From hand-blown light fixtures to bespoke furniture and tailor-made cabinetry, these elements are celebrated for their individuality and the personal connections they create.
Incorporating vintage and antique elements is an emerging trend in luxury home design, reflecting a broader cultural appreciation for history and heritage. Vintage furniture and antique decor are seamlessly integrated with contemporary design, creating a rich, eclectic aesthetic. This approach honors the past while maintaining modern comforts and styling, ensuring a timeless quality that appeals to nostalgia.
Raw materials, such as wood, imbue spaces with a sense of heritage while bridging indoor comfort and outdoor beauty. The rich warmth of oiled wooden furniture or the rustic charm of natural-toned poolside benches add texture and character to interior settings.
Playful patterns are a top summer interior design trend. Vibrant geometric shapes and whimsical floral prints add a cheerful, energetic vibe to spaces. Mixing and matching patterns create personalized, lively atmospheres both indoors and outdoors, capturing the essence of summer.
This vibrant trend focuses on creating joyful, uplifting spaces through bold colors, playful patterns, and eclectic furnishings. This design approach stimulates happiness and well-being by infusing rooms with elements that evoke positive emotions, encouraging creativity and self-expression, and transforming interiors into feel-good environments.
Biophilia, which integrates natural elements into interior spaces, continues to gain traction. Incorporating indoor plants, expansive windows, and organic textures breathes fresh air into homes. Expect to see the blurring of boundaries between indoor and outdoor spaces through large windows, sliding glass doors, and seamless transitions to patios, decks, or gardens enhance this trend. Lightweight fabrics like sheers, linen, and cotton are used outdoors for draperies on porches or in upholstery.
As summer approaches, buyers and homeowners alike are looking for opportunities to find, refresh, and create vibrant spaces that feel alive, welcoming, and reflective of the upcoming month’s natural beauty and playfulness.

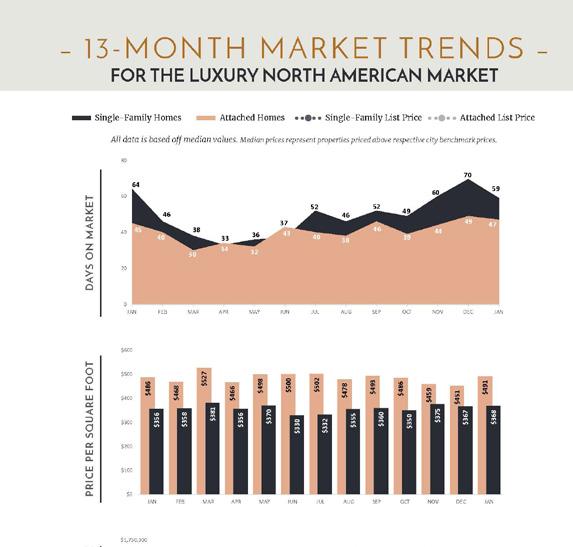
– 13 - MONTH MARKET TRENDS –
FOR THE LUXURY NORTH AMERICAN MARKET
Single-Family Homes Attached Homes Single-Family List Price Attached List Price
All data is based off median values. Median prices represent properties priced above respective city benchmark prices.
$1,900,000
$1,700,000
$1,500,000
$1,300,000
$1,100,000
$900,000
$700,000
$500,000
DAYS ON MARKET SALES
PRICE VS. LIST PRICE
0 5 10 15 20 25 30 35 40 45 MAY JUN JUL AUG SEP OCT NOV DEC JAN FEB MAR APR MAY SALES RATIO 0% 5% 10% 15% 20% 25% 30% 35% 40% 45% MAY JUN JUL AUG SEP OCT NOV DEC JAN FEB MAR APR MAY
MAY JUN JUL AUG SEP OCT NOV DEC JAN FEB MAR APR MAY 21% 12% Seller's Balanced Buyer's
– LUXURY MONTHLY MARKET REVIEW –
A Review of Key Market Differences Year over Year
May 2023 | May 2024
SINGLE-FAMILY HOMES
$5,000
6,621 Days on Market
Listings
4.66%
SINGLE-FAMILY HOMES MARKET SUMMARY | MAY 2024
• Official Market Type: Seller's Market with a 32.00% Sales Ratio.1
• Homes are selling for an average of 99.35% of list price.
• The median luxury threshold2 price is $925,000, and the median luxury home sales price is $1,305,000.
• Markets with the Highest Median Sales Price: Telluride ($5,192,500), Vail ($4,250,000), Los Angeles Beach Cities ($4,243,750), and Palm Beach Towns ($4,100,000).
• Markets with the Highest Sales Ratio: East Bay (126.7%), Howard County, MD (110.8%), Silicon Valley (84.6%), and Montgomery County, MD (82.3%).
1
Sales Ratio defines market speed and market type: Buyer's < 12%; Balanced >= 12 to < 21%; Seller's >= 21%. If >100%, sales from previous month exceeds current inventory. 2The luxury threshold price is set by The Institute for Luxury Home Marketing.
Median List Price $1,650,000 $1,582,225 Median Sale Price $1,300,000 $1,305,000 Median SP/LP Ratio 99.87% 99.35% Total Sales Ratio 36.66% 32.00% Median Price per Sq. Ft. $408 $400 Total Inventory 52,704 69,405 New Listings 21,139 27,760 Total Sold 19,319 22,212 Median Days on Market 14 16 Average Home Size 3,193 3,282
prices represent properties priced above respective city benchmark prices. May 2024 May 2023 May 2024 May 2023
Median
New
Total Sold
2,893 Med. Sale Price
2 Sales Ratio
– LUXURY MONTHLY MARKET REVIEW –
A Review of Key Market Differences Year over Year
May 2023 | May 2024
2,279 Total
459
ATTACHED HOMES MARKET SUMMARY | MAY 2024
• Official Market Type: Seller's Market with a 23.89% Sales Ratio. 1
• Attached homes are selling for an average of 99.87% of list price.
• The median luxury threshold2 price is $700,000, and the median attached luxury sale price is $879,900
• Markets with the Highest Median Sales Price: Vail ($4,525,000), Manhattan ($4,212,500), Island of Hawaii ($2,900,000), and Telluride ($2,752,500).
• Markets with the Highest Sales Ratio: Anne Arundel County (192.3%), Fairfax County, VA (164.6%), Howard County (134.1%), and East Bay (119.1%).
Median List Price $999,000 $950,000 Median Sale Price $899,500 $879,900 Median SP/LP Ratio 99.65% 99.87% Total Sales Ratio 31.40% 23.89% Median Price per Sq. Ft. $489 $516 Total Inventory 18,317 25,993 New Listings 6,733 9,012 Total Sold 5,751 6,210 Median Days on Market 18 20 Average Home Size 1,946 1,923
Median prices represent properties priced above respective city benchmark prices.
May 2024 May 2023 May 2024 May 2023
ATTACHED HOMES New
Listings
Sold
Med. Sale Price $19,600 Days on Market 2 Sales Ratio 7.51% 1Sales Ratio defines market speed and market type: Buyer's < 12%; Balanced >= 12 to < 21%; Seller's >= 21%. If >100%, sales from previous month exceeds current inventory. 2The luxury threshold price is set by The Institute for Luxury Home Marketing.
– LUXURY MONTHLY MARKET REVIEW –
Median prices represent properties priced above respective city benchmark prices. Prices shown for Canadian cites are shown in Canadian Dollars. SINGLE FAMILY HOMES ATTACHED HOMES State Market Name List Price Sold Price DOM Ratio Market List Price Sold Price DOM Ratio Market AB Calgary $1,100,000 $960,000 11 67.1% Seller's $798,000 $685,000 15 47.7% Seller's AZ Chandler and Gilbert $1,100,000 $990,000 37 41.2% Seller's - - - -AZ Flagstaff $1,589,950 $1,287,500 62 24.5% Seller's - - - -AZ Fountain Hills $2,772,500 $1,827,000 43 13.9% Balanced $695,000 $750,000 71 38.1% Seller's AZ Mesa $895,450 $839,200 42 46.4% Seller's - - - -AZ Paradise Valley $6,217,500 $4,000,000 74 17.7% Balanced - - - -AZ Phoenix $886,750 $840,000 42 38.9% Seller's - - - -AZ Scottsdale $2,199,000 $1,674,900 62 24.6% Seller's $925,000 $825,000 60 24.7% Seller's AZ Tucson $699,990 $672,500 16 31.7% Seller's - - - -BC Okanagan Valley $1,784,000 $1,538,500 52 4.8% Buyer's - - - -BC Vancouver $4,100,000 $3,245,000 11 8.2% Buyer's $1,888,000 $1,737,950 13 10.2% Buyer's BC Whistler $5,495,000 $3,575,000 28 5.6% Buyer's $2,524,000 $1,850,000 1 1.4% Buyer's CA Central Coast $2,999,000 $2,400,000 12 26.7% Seller's $1,295,000 $1,200,000 10 40.7% Seller's CA East Bay $2,250,000 $2,092,500 9 126.7% Seller's $1,049,888 $1,172,500 8 119.1% Seller's CA Greater Palm Springs $1,925,000 $1,675,000 47 24.9% Seller's - - - -CA Lake Tahoe $2,379,000 $1,821,250 32 15.2% Balanced $1,390,000 $1,500,000 113 23.5% Seller's CA Los Angeles Beach Cities $5,995,000 $4,243,750 28 20.8% Balanced $1,999,000 $1,650,000 24 30.9% Seller's CA Los Angeles City $4,895,000 $3,600,000 22 14.8% Balanced $1,699,990 $1,475,000 21 17.1% Balanced CA Los Angeles The Valley $2,699,000 $2,065,000 22 28.2% Seller's $799,995 $820,500 20 52.1% Seller's CA Marin County $3,497,500 $3,200,000 12 45.5% Seller's $1,288,000 $1,210,000 30 96.0% Seller's CA Napa County $3,500,000 $1,935,000 72 13.5% Balanced - - - -CA Orange County $3,398,944 $2,272,500 12 52.3% Seller's $1,317,590 $1,200,000 11 72.8% Seller's CA Placer County $1,200,000 $1,003,000 10 34.5% Seller's - - - -CA Sacramento $949,950 $885,000 9 46.9% Seller's - - - -CA San Diego $2,470,000 $1,850,000 8 41.0% Seller's $1,266,560 $1,077,000 8 50.9% Seller's CA San Francisco $4,772,500 $3,515,000 13 55.1% Seller's $2,990,000 $2,300,000 33 18.8% Balanced CA San Luis Obispo County $1,850,000 $1,500,000 30 24.7% Seller's - - - -CA Silicon Valley $4,296,500 $3,340,000 8 84.6% Seller's $1,675,000 $1,608,935 8 72.7% Seller's CA Sonoma County $2,450,000 $1,800,000 28 16.1% Balanced $776,000 $933,347 14 15.4% Balanced CA Ventura County $2,487,500 $1,670,000 48 29.5% Seller's $783,500 $750,000 41 45.1% Seller's CO Boulder $2,165,000 $1,575,000 42 27.6% Seller's $937,000 $849,950 38 15.3% Balanced CO Colorado Springs $975,000 $852,850 12 34.0% Seller's $595,000 $538,739 10 34.0% Seller's CO Denver $1,565,000 $1,390,000 10 32.0% Seller's $849,999 $845,640 14 25.7% Seller's CO Douglas County $1,298,654 $1,137,500 13 33.5% Seller's $589,900 $592,500 16 38.6% Seller's CO Summit County $2,975,000 $2,500,000 20 16.9% Balanced $1,222,500 $1,250,000 10 19.7% Balanced CO Telluride $6,900,000 $5,192,500 157 13.3% Balanced $3,395,000 $2,752,500 94 15.7% Balanced CO Vail $7,222,500 $4,250,000 13 12.8% Balanced $3,447,000 $4,525,000 89 16.7% Balanced CT Central Connecticut $695,000 $643,950 5 49.6% Seller's - - - - -
– LUXURY MONTHLY MARKET REVIEW –
Median prices represent properties priced above respective city benchmark prices. Prices shown for Canadian cites are shown in Canadian Dollars.
SINGLE FAMILY HOMES ATTACHED HOMES State Market Name List Price Sold Price DOM Ratio Market List Price Sold Price DOM Ratio Market CT Coastal Connecticut $2,200,000 $1,700,000 13 33.5% Seller's $996,757 $691,500 17 43.0% Seller's DC Washington D.C. $3,850,000 $2,975,000 7 42.1% Seller's $1,800,000 $1,650,000 8 25.7% Seller's DE Sussex County Coastal $1,525,000 $1,287,500 9 28.1% Seller's $949,990 $975,000 7 39.5% Seller's FL Boca Raton/Delray Beach $2,600,000 $2,378,500 71 19.9% Balanced $950,000 $777,500 47 19.9% Balanced FL Brevard County $825,000 $775,000 15 30.1% Seller's $715,000 $805,000 50 13.1% Balanced FL Broward County $1,750,000 $1,450,000 39 15.8% Balanced $699,000 $600,000 45 12.8% Balanced FL Coastal Pinellas County $2,125,000 $1,805,306 50 15.8% Balanced $1,196,000 $1,173,675 49 19.6% Balanced FL Ft. Lauderdale $5,350,000 $3,470,000 111 11.0% Buyer's $2,475,000 $2,300,000 81 6.6% Buyer's FL Jacksonville Beaches $1,322,500 $1,261,166 21 23.9% Seller's $942,000 $1,350,000 34 19.2% Balanced FL Lee County $1,395,000 $1,300,000 55 14.7% Balanced $867,530 $796,250 38 11.3% Buyer's FL Marco Island $2,790,000 $2,200,000 85 22.6% Seller's $1,695,000 $1,450,000 58 16.0% Balanced FL Miami $1,950,000 $1,500,000 62 12.6% Balanced $1,469,000 $1,350,000 87 9.2% Buyer's FL Naples $5,695,000 $3,625,000 37 11.3% Buyer's $2,399,000 $2,565,000 59 19.3% Balanced FL Orlando $1,259,000 $1,213,000 23 21.6% Seller's $559,900 $562,100 33 14.4% Balanced FL Palm Beach Towns $4,216,000 $4,100,000 143 11.2% Buyer's $1,898,000 $2,000,000 75 11.5% Buyer's FL Sarasota & Beaches $2,699,000 $1,725,000 72 15.6% Balanced $1,625,000 $1,190,000 69 15.8% Balanced FL South Pinellas County $1,475,000 $1,275,000 42 19.3% Balanced $999,700 $1,060,000 46 16.5% Balanced FL South Walton $2,495,000 $2,335,000 40 10.6% Buyer's $1,247,000 $2,694,219 17 19.3% Balanced FL Tampa $750,000 $703,500 23 32.6% Seller's $871,950 $760,000 17 26.3% Seller's GA Atlanta $1,553,660 $1,200,000 6 27.0% Seller's $724,950 $660,000 15 20.4% Balanced GA Duluth $1,670,000 $1,250,000 10 36.1% Seller's - - - -HI Island of Hawaii $2,200,000 $1,877,000 37 20.8% Balanced $1,712,500 $2,900,000 8 51.7% Seller's HI Kauai $3,295,000 $2,575,000 48 18.0% Balanced $1,449,000 $1,315,000 7 18.9% Balanced HI Maui $3,425,000 $2,036,500 67 11.8% Buyer's $1,890,000 $2,450,000 194 9.8% Buyer's HI Oahu $2,914,000 $2,478,750 34 16.5% Balanced $1,199,500 $920,000 22 15.5% Balanced IA Greater Des Moines $662,608 $590,000 18 22.1% Seller's - - - -ID Ada County $829,900 $772,500 9 48.3% Seller's $682,500 $622,000 34 39.3% Seller's ID Northern Idaho $1,650,000 $1,317,883 69 15.0% Balanced - - - -IL Chicago $1,749,000 $1,310,000 10 54.7% Seller's $1,268,500 $950,000 19 36.9% Seller's IL DuPage County $1,275,000 $890,000 6 55.3% Seller's $1,097,000 $618,000 6 90.9% Seller's IL Lake County $1,294,450 $965,000 11 45.8% Seller's - - - -IL Will County $649,950 $665,000 7 53.6% Seller's - - - -IN Hamilton County $850,000 $775,000 4 63.9% Seller's - - - -KS Johnson County $825,000 $830,000 4 37.8% Seller's $648,000 $597,875 8 25.2% Seller's MA Cape Cod $2,324,500 $1,700,000 30 15.0% Balanced $986,250 $892,500 20 26.9% Seller's MA Greater Boston $3,600,000 $2,450,000 21 29.3% Seller's $2,495,000 $1,895,000 20 18.6% Balanced MA South Shore $1,749,950 $1,502,000 18 48.0% Seller's $887,450 $810,000 30 34.4% Seller's MD Anne Arundel County $1,200,000 $900,000 5 74.9% Seller's $600,000 $574,930 4 192.3% Seller's
– LUXURY MONTHLY MARKET REVIEW –
Median prices represent properties priced above respective city benchmark prices. Prices shown for Canadian cites are shown in Canadian Dollars.
SINGLE FAMILY HOMES ATTACHED HOMES State Market Name List Price Sold Price DOM Ratio Market List Price Sold Price DOM Ratio Market MD Baltimore City $924,450 $737,000 4 53.6% Seller's $675,000 $625,000 10 31.5% Seller's MD Baltimore County $1,100,000 $916,000 6 48.8% Seller's $620,000 $540,000 5 51.5% Seller's MD Frederick County $935,490 $876,000 6 54.9% Seller's - - - -MD Howard County $1,204,990 $975,000 5 110.8% Seller's $600,000 $635,000 6 134.1% Seller's MD Montgomery County $2,099,000 $1,560,250 6 82.3% Seller's $839,900 $766,275 6 86.1% Seller's MD Talbot County $2,547,500 $1,772,500 24 25.8% Seller's - - - -MD Worcester County $967,500 $764,500 7 18.4% Balanced $682,475 $661,000 15 36.0% Seller's MI Grand Traverse $1,185,415 $940,000 31 18.6% Balanced - - - -MI Livingston County $725,000 $725,000 9 34.7% Seller's - - - -MI Monroe County $757,450 $592,000 17 21.4% Seller's - - - -MI Oakland County $849,450 $685,277 7 55.7% Seller's $679,000 $590,000 10 63.2% Seller's MI Washtenaw County $912,495 $786,500 32 44.9% Seller's $689,000 $686,248 31 41.5% Seller's MI Wayne County $730,000 $655,000 7 67.4% Seller's $719,000 $600,000 12 23.3% Seller's MN Olmsted County $860,000 $770,000 10 25.7% Seller's - - - -MN Twin Cities $1,250,000 $1,100,000 13 23.9% Seller's - - - -MO Kansas City $724,950 $675,000 5 40.5% Seller's - - - -MO St. Louis $774,950 $757,000 5 79.5% Seller's - - - -NC Asheville $1,099,000 $920,000 6 34.0% Seller's $630,000 $610,000 4 25.5% Seller's NC Charlotte $1,300,000 $1,032,000 3 59.9% Seller's $641,900 $644,325 12 39.0% Seller's NC Lake Norman $1,375,000 $1,100,000 12 46.4% Seller's $594,990 $628,550 4 32.7% Seller's NC Raleigh-Durham $1,200,000 $950,000 4 55.7% Seller's - - - -NH Rockingham County $1,400,000 $1,342,402 8 35.3% Seller's $886,400 $858,150 5 86.4% Seller's NJ Bergen County $2,499,500 $1,800,000 17 31.0% Seller's $1,299,000 $1,200,000 27 47.5% Seller's NJ Ocean County $995,000 $880,000 18 30.3% Seller's $924,900 $775,000 24 25.8% Seller's NM Taos $1,299,500 $1,600,000 112 3.3% Buyer's - - - -NV Lake Tahoe $3,093,944 $3,000,000 41 13.8% Balanced $1,269,000 $1,875,000 25 20.8% Balanced NV Las Vegas $1,875,000 $1,425,000 18 20.8% Balanced - - - -NV Reno $2,497,500 $1,640,000 47 22.3% Seller's - - - -NY Dutchess & Putnam Counties $990,000 $950,000 48 12.5% Balanced - - - -NY Manhattan - - - - - $4,650,000 $4,212,500 101 6.7% Buyer's NY Nassau County $1,888,000 $1,490,000 38 20.0% Balanced $1,450,000 $1,200,000 36 23.2% Seller's NY Rockland, Orange, & Ulster $1,275,000 $995,000 33 15.9% Balanced - - - -NY Staten Island $1,247,300 $975,000 50 12.0% Balanced $658,888 $610,000 44 28.4% Seller's NY Suffolk County $1,950,000 $1,260,000 33 15.8% Balanced $749,000 $625,000 23 35.1% Seller's NY Westchester County $2,099,500 $1,633,000 13 41.3% Seller's - - - -OH Cincinnati $899,450 $705,000 2 51.1% Seller's - - - -OH Cleveland Suburbs $725,000 $650,000 17 63.8% Seller's - - - -OH Columbus $850,000 $750,000 36 63.1% Seller's $700,000 $637,500 91 33.0% Seller's
– LUXURY MONTHLY MARKET REVIEW –
Median prices represent properties priced above respective city benchmark prices. Prices shown for Canadian cites are shown in Canadian Dollars.
SINGLE FAMILY HOMES ATTACHED HOMES State Market Name List Price Sold Price DOM Ratio Market List Price Sold Price DOM Ratio Market ON GTA - Durham $1,782,450 $1,600,000 13 18.6% Balanced $849,900 $835,000 14 29.4% Seller's ON GTA - York $2,448,500 $1,940,000 12 21.7% Seller's $807,331 $783,000 21 19.7% Balanced ON Hamilton $1,799,900 $1,705,000 12 12.4% Balanced $981,700 $879,900 8 17.5% Balanced ON Mississauga $2,949,900 $2,780,000 16 12.7% Balanced $971,000 $940,000 16 20.6% Balanced ON Oakville $2,995,000 $2,232,500 12 27.1% Seller's $1,299,000 $1,133,250 20 19.0% Balanced ON Toronto $3,880,000 $3,140,000 7 22.9% Seller's $1,234,000 $1,110,000 14 19.5% Balanced ON Waterloo Region $1,449,900 $1,262,500 11 33.3% Seller's $775,000 $762,500 22 14.0% Balanced OR Portland $1,295,000 $1,100,000 9 27.5% Seller's $659,995 $635,000 17 19.1% Balanced SC Charleston $1,895,000 $1,582,500 13 30.9% Seller's $1,299,999 $1,412,500 30 42.0% Seller's SC Hilton Head - - - - - - - - -TN Greater Chattanooga $899,000 $949,500 7 27.2% Seller's - - - -TN Knoxville $950,000 $900,000 3 46.2% Seller's - - - -TN Nashville $1,750,000 $1,400,000 8 32.9% Seller's $729,900 $683,137 16 20.2% Balanced TX Austin $2,295,000 $2,050,000 28 11.3% Buyer's $1,199,000 $1,000,000 36 10.8% Buyer's TX Collin County $749,900 $730,000 13 36.0% Seller's - - - -TX Dallas $1,384,750 $1,195,000 12 36.8% Seller's $695,000 $672,500 21 30.7% Seller's TX Denton County $824,900 $761,500 14 30.8% Seller's - - - -TX El Paso $672,450 $622,000 15 22.2% Seller's - - - -TX Fort Worth $879,950 $808,000 10 34.7% Seller's - - - -TX Greater Tyler $699,900 $696,500 44 14.3% Balanced - - - -TX Houston $979,450 $935,000 31 29.8% Seller's $624,900 $630,000 29 39.4% Seller's TX Lubbock $687,000 $680,000 60 17.4% Balanced - - - -TX San Angelo $642,500 $650,000 71 20.3% Balanced - - - -TX San Antonio $799,995 $773,000 33 22.6% Seller's $685,000 $729,000 55 6.2% Buyer's TX The Woodlands & Spring $849,000 $770,000 30 45.6% Seller's - - - -UT Park City $4,250,000 $3,487,500 81 10.8% Buyer's $1,950,000 $1,752,500 80 25.6% Seller's UT Salt Lake City $1,200,000 $1,035,000 23 32.6% Seller's $618,767 $585,000 32 37.3% Seller's UT Washington County $1,612,500 $1,336,350 26 19.6% Balanced - - - -VA Arlington & Alexandria $2,399,000 $1,850,000 6 54.6% Seller's $1,095,000 $1,080,000 5 102.5% Seller's VA Fairfax County $2,350,000 $1,427,250 5 76.4% Seller's $785,700 $712,500 5 164.6% Seller's VA McLean & Vienna $2,999,000 $1,880,000 5 42.5% Seller's $1,249,000 $1,145,000 10 74.1% Seller's VA Richmond $809,950 $820,000 7 60.2% Seller's $590,120 $580,573 14 37.1% Seller's VA Smith Mountain Lake $1,574,500 $1,250,000 9 28.8% Seller's - - - -WA King County $1,999,995 $1,750,000 5 76.7% Seller's $1,199,000 $963,656 7 45.8% Seller's WA Seattle $1,899,000 $1,631,000 6 62.8% Seller's $1,500,000 $1,189,250 14 19.8% Balanced
Spokane $1,100,000 $1,100,000 12 17.7% Balanced - - - - -
WA
OAKVILLE ONTARIO
2024 JUNE
$5,700,000
LUXURY INVENTORY VS. SALES | MAY 2024
$2,700,000 - $2,899,999
$2,500,000
$2,300,000
$2,200,000
$2,000,000 - $2,099,999
$1,900,000 - $1,999,999
$1,775,000 - $1,899,999
Beds3 -RangePrice -Median SoldDOM -Median SoldBaths -Median SoldSold -TotalInventory -TotalSales Ratio -Sold/Inventory0-1 Bedrooms NA NA NA 0 0 NA 2 Bedrooms NA NA NA 0 4 0% 3 Bedrooms $2,050,500 13 2 2 16 13% 4 Bedrooms $2,252,000 14 4 24 75 32% 5 Bedrooms $2,150,000 10 4 21 81 26% 6+ Bedrooms $2,500,000 18 5 7 23 30%
SINGLE - FAMILY HOMES 1 The luxury threshold price is set by The Institute for Luxury Home Marketing. 2Sales Ratio defines market speed and market type: Buyer's < 12%; Balanced >= 12 to < 21%; Seller's >= 21%. If >100% MLS® data reported previous month’s sales exceeded current inventory. 18 3 6 22 16 16 26 12 5 19 9 11 8 13 15 1 0 0 3 1 4 2 1 5 5 6 4 6 4 12
OAKVILLE
$6,500,000+
- $6,499,999 $5,000,000 - $5,699,999
$4,300,000 - $4,999,999 $3,700,000 - $4,299,999
$3,200,000 - $3,699,999
$2,900,000 - $3,199,999
-
$2,699,999
- $2,499,999
- $2,299,999
-
$2,100,000
$2,199,999
Inventory Sales
Seller's Market Total Inventory: 199 Total Sales: 54 Total Sales Ratio2 : 27% Luxury Benchmark Price 1: $1,775,000
13 - MONTH LUXURY MARKET TREND 4
MEDIAN DATA REVIEW | MAY
199 May 2023 May 2024
VARIANCE: 60 %
VARIANCE: N/A N/A N/A SALE PRICE PER SQFT. May 2023 May 2024
VARIANCE: - 2 % 98.95% 97.23% SALE TO LIST PRICE RATIO
$2.23m SALES PRICE VARIANCE: 100 % 6 12 DAYS ON MARKET
OAKVILLE MARKET SUMMARY | MAY 2024
• The single-family luxury market is a Seller's Market with a 27% Sales Ratio.
• Homes sold for a median of 97.23% of list price in May 2024.
• The most active price band is $2,500,000-$2,699,999, where the sales ratio is 100%
• The median luxury sales price for single-family homes is $2,232,500.
• The median days on market for May 2024 was 12 days, up from 6 in May 2023.
3Square foot table does not account for listings and solds where square foot data is not disclosed. 4Data reported includes Active and Sold properties and does not include Pending properties.
Solds Median Sales Price Inventory 124 136 161 157 210 205 166 95 102 135 146 159 199 70 62 43 35 34 25 23 28 26 51 54 58 54 $2,275,044 $2,337,500 $2,050,001 $2,440,000 $2,305,000 $2,200,000 $2,305,000 $2,841,944 $2,300,000 $2,365,000 $2,179,000 $2,297,500 $2,232,500 May-23 Jun-23 Jul-23 Aug-23 Sep-23 Oct-23 Nov-23 Dec-23 Jan-24 Feb-24 Mar-24 Apr-24 May-24
OAKVILLE
SINGLE - FAMILY HOMES
70 54 TOTAL
VARIANCE:
% $2.28m
124
TOTAL INVENTORY VARIANCE: - 23 %
SOLDS
- 2
May
May 2024 May 2023 May 2024 May 2023 May 2024 May 2023 May 2024 Luxury Benchmark Price 1: $1,775,000
2023
LUXURY INVENTORY VS. SALES | MAY 2024
$2,100,000 - $2,399,999
$1,900,000
$1,800,000
$1,100,000
$1,000,000
$920,000
HOMES Beds3 -RangePrice -Median SoldDOM -Median SoldBaths -Median SoldSold -TotalInventory -TotalSales Ratio -Sold/Inventory0-1 Bedrooms NA NA NA 0 2 0% 2 Bedrooms $1,215,750 27 2 4 30 13% 3 Bedrooms $1,009,250 10 4 4 10 40% 4 Bedrooms NA NA NA 0 0 NA 5 Bedrooms NA NA NA 0 0 NA 6+ Bedrooms NA NA NA 0 0 NA 5 0 0 1 1 0 2 2 2 6 1 2 7 7 6 1 0 0 0 0 0 0 0 0 1 0 1 2 1 2 $3,000,000+
OAKVILLE ATTACHED
$2,700,000 - $2,999,999
$2,400,000 - $2,699,999
$2,099,999
-
- $1,899,999 $1,700,000 - $1,799,999 $1,600,000 - $1,699,999 $1,500,000 - $1,599,999 $1,400,000 - $1,499,999 $1,300,000 - $1,399,999 $1,200,000 - $1,299,999
- $1,199,999
- $1,099,999
- $999,999
Inventory Sales Luxury Benchmark Price 1: $920,000 Balanced Market Total Inventory: 42 Total Sales: 8 Total Sales Ratio2 : 19% 1 The luxury threshold price is set by The Institute for Luxury Home Marketing. 2Sales Ratio defines market speed and market type: Buyer's < 12%; Balanced >= 12 to < 21%; Seller's >= 21%. If >100% MLS® data reported previous month’s sales exceeded current inventory.
13 - MONTH LUXURY MARKET TREND 4
Solds Median Sales Price Inventory
MEDIAN DATA REVIEW | MAY
MARKET SUMMARY | MAY 2024
• The attached luxury market is a Balanced Market with a 19% Sales Ratio.
• Homes sold for a median of 97.04% of list price in May 2024.
• The most active price band is $1,200,000-$1,299,999, where the sales ratio is 50%
• The median luxury sales price for attached homes is $1,133,250.
• The median days on market for May 2024 was 20 days, up from 19 in May 2023.
27 29 25 56 29 32 30 17 24 16 23 38 42 12 13 16 31 13 7 11 2 4 6 8 10 8 $1,027,500 $1,302,000 $1,282,500 $1,200,000 $1,275,000 $1,065,000 $1,770,000 $1,367,500 $1,152,500 $990,250 $1,188,750 $1,293,500 $1,133,250 May-23 Jun-23 Jul-23 Aug-23 Sep-23 Oct-23 Nov-23 Dec-23 Jan-24 Feb-24 Mar-24 Apr-24 May-24
VARIANCE: 56 % 27 42 VARIANCE: - 33 % 12 8 VARIANCE: 10 % $1.03m $1.13m SALES PRICE VARIANCE:
% 19
VARIANCE: - 1 % 97.84% 97.04% SALE TO LIST PRICE RATIO VARIANCE:
OAKVILLE
3Square foot table does not account for listings and solds where square foot data is not disclosed. 4Data reported includes Active and Sold properties and does not include Pending properties.
5
20 DAYS ON MARKET
N/A N/A N/A SALE PRICE PER SQFT. OAKVILLE
ATTACHED HOMES
May 2023 May 2024 May 2023 May 2024 May 2023 May 2024 May 2023 May 2024 May 2023 May 2024 May 2023 May 2024
TOTAL INVENTORY TOTAL SOLDS Luxury
$920,000
Benchmark Price 1:


KIM MELHUISH 416.804.9604 | Kim@KMrealhomes.ca | www.KMrealhomes.ca Thank you for taking time to view this report. For more information about this report and the services I can offer you and your luxury property, please give me a call at 416.804.9604.
