

KATHLEEN TILLMAN LUXURY MARKET REPORT NORTHERN IDAHO APRIL 202 3
KATHLEEN TILLMAN
Luxury Specialist
Coldwell Banker Schneidmiller Realty
Global Luxury Office – 101 N. 2nd Street Coeur d’Alene, ID
208.699.2210
Kathleen@KathleenTillman.com www.KathleenTillman.com
As a luxury specialist in Coeur d’Alene and the North Idaho Market, Kathleen Tillman offers over 21 years of full time experience and expertise. She has represented some of the most beautiful homes in the area, and relocated buyers from markets in California, Oregon, Washington, Texas and Colorado. Trust her high-level of service and knowledge from her years of experience.
Representing the best that North Idaho has to offer, Kathleen is committed to listening to her clients needs and utilizing her negotiating skills to ensure a successful transaction.
Raised in Southern California and the Bay Area, Kathleen attended UCLA and graduated from San Jose State University. After college, she served as a Police Officer on patrol for 9 years. After moving to beautiful North Idaho, she joined the real estate profession in 2000 at Coldwell Banker Schneidmiller Realty.

Over the past 21 years, Kathleen has become an esteemed Realtor, highly regarded by her clients and professionals in the field. A downtown Coeur d’Alene resident, she is well connected and actively involved in her community. Currently, she is involved with the Kootenai Humane Society, the Coeur d’Alene Chamber Leadership committee, Idaho Youth Ranch, Hospice of North Idaho and a member on the Professional Standards Committee of the CdA Association of Realtors. She is a past Parking Commissioner, EXCEL Board member, PTA President and graduate of the Chamber Leadership class of 2016.
Kathleen showcases her homes on a variety of websites and utilizes a team of professional service providers to assist with her clients buying and selling needs. She is communicative, thorough and detail-oriented – and she will be with you every step of the way.
TABLE OF CONTENTS
PAGE 4 LUXURY REPORT EXPLAINED
PAGE 5 WELCOME MESSAGE
PAGE 6-9 NORTH AMERICAN LUXURY MARKET REVIEW
PAGE 10 13-MONTH MARKET TRENDS
PAGE 11 SINGLE-FAMILY HOMES MONTHLY OVERVIEW
PAGE 12 ATTACHED HOMES MONTHLY OVERVIEW
PAGE 13-16 MONTHLY STATISTICS BY CITY - Single-Family Homes

PAGE 17-20 MONTHLY STATISTICS BY CITY - Attached Homes
PAGE 21 LOCAL LUXURY MARKET REVIEW
PAGE 22-23 SINGLE-FAMILY HOMES - Monthly Statistics
PAGE 24 THANK YOU
LUXURY REPORT EXPLAINED –
The Institute for Luxury Home Marketing has analyzed a number of metrics — including sales prices, sales volumes, number of sales, sales-price-to-list-price ratios, days on market and price-per-square-foot – to provide you a comprehensive North American Luxury Market report. Additionally, we have further examined all of the individual luxury markets to provide both an overview and an in-depth analysis - including, where data is sufficient, a breakdown by luxury single-family homes and luxury attached homes.
It is our intention to include additional luxury markets on a continual basis. If your market is not featured, please contact us so we can implement the necessary qualification process. More in-depth reports on the luxury communities in your market are available as well.
Looking through this report, you will notice three distinct market statuses, Buyer's Market, Seller's Market, and Balanced Market. A Buyer's Market indicates that buyers have greater control over the price point. This market type is demonstrated by a substantial number of homes on the market and few sales, suggesting demand for residential properties is slow for that market and/or price point.
By contrast, a Seller's Market gives sellers greater control over the price point. Typically, this means there are few homes on the market and a generous demand, causing competition between buyers who ultimately drive sales prices higher.
A Balanced Market indicates that neither the buyers nor the sellers control the price point at which that property will sell and that there is neither a glut nor a lack of inventory. Typically, this type of market sees a stabilization of both the list and sold price, the length of time the property is on the market as well as the expectancy amongst homeowners in their respective communities – so long as their home is priced in accordance with the current market value.
REPORT GLOSSARY
REMAINING INVENTORY: The total number of homes available at the close of a month.
DAYS ON MARKET: Measures the number of days a home is available on the market before a purchase offer is accepted.
LUXURY BENCHMARK PRICE: The price point that marks the transition from traditional homes to luxury homes.
NEW LISTINGS: The number of homes that entered the market during the current month.
PRICE PER SQUARE FOOT: Measures the dollar amount of the home's price for an individual square foot.
SALES RATIO: Sales Ratio defines market speed and determines whether the market currently favors buyers or sellers. Buyer's Market = up to 14%; Balanced Market = 15 to 20%; Seller's Market = 21% plus. If >100%, sales from previous month exceed current inventory.
SP/LP RATIO: The Sales Price/List Price Ratio compares the value of the sold price to the value of the list price.
–
LUXURY MARKET REPORT
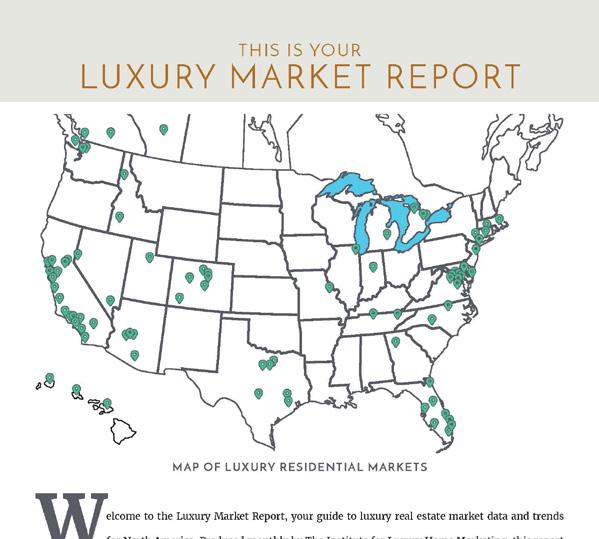
MAP OF LUXURY RESIDENTIAL MARKETS
Welcome to the Luxury Market Report, your guide to luxury real estate market data and trends for North America. Produced monthly by The Institute for Luxury Home Marketing, this report provides an in-depth look at the top residential markets across the United States and Canada. Within the individual markets, you will find established luxury benchmark prices and detailed survey of luxury active and sold properties designed to showcase current market status and recent trends. The national report illustrates a compilation of the top North American markets to review overall standards and trends.
Copyright © 2023 Institute for Luxury Home Marketing | www.luxuryhomemarketing.com | 214.485.3000
The Luxury Market Report is a monthly analysis provided by The Institute for Luxury Home Marketing. Luxury benchmark prices are determined by The Institute. This active and sold data has been provided by REAL Marketing, who has compiled the data through various sources, including local MLS boards, local tax records and Realtor.com. Data is deemed reliable to the best of our knowledge, but is not guaranteed.
THIS IS YOUR
NORTH AMERICAN LUXURY REVIEW
Demand for Luxury Properties Returns
The quiet optimism forecasted last month seems to be paying dividends, as there was a distinct increase in the number of luxury property sales in March. In fact, our findings show sales for single-family homes and attached properties have risen nearly 50% compared to February 2023.

The number of new listings entering the market has facilitated this increase in sales which rose over 32.9% for single-family homes and nearly 25.6% for attached properties in March, indicating that sellers are becoming more optimistic about selling again.
The median sold price for both markets remained stable, too, while still slightly below March 2022; prices have climbed against February 2023. The sold price to list price ratio (SP/LP%) also trended back up in March. It moved from 97.67% in February to 98.56% for single family homes and 98.37% to 98.89% for attached properties – indicating that sellers are seeing prices closer to their expectations once again.
By no means do these numbers imply that we are heading back to the overinflated demands of 2020 and 2021, but they do reflect growing confidence in the luxury market as we head further into spring.
Not All Things Are Equal
Overall, the market is still showing that it is favorable to sellers – but this is mostly due to increased sales and, despite increases in new listings, inventory levels remaining below the 10-year norm in many markets. However, significant differences between markets have arisen over the last few months, with some becoming increasingly more favorable for buyers, while others remain firmly in control of the sellers, and the remainder favorable to neither.
Equally confusing is that in some markets, home prices continue to increase, while in others, they are on a downward trajectory. Different price points within the same market also report differing results, and it’s not always the lower priced properties that are selling the fastest! Additionally, results seem to be inconsistent from month to month!
So how are buyers and sellers meant to understand whether it’s a good time to buy or sell?
Key Parameters to Understanding Your Market
One of the most important factors to consider is understanding inventory levels of similar properties on the market - not always an easy task in the luxury market where marketing homes is based on their differentiations.

Typically, the sales ratio, i.e., how fast the market is moving, measures the level of inventory remaining against the number of sold properties for that month. However, it is also important to review if there is a substantial amount of inventory in your price point, property type, or location, whether it has been on the market for a while or just unlikely to meet buyer expectations, as this can distort the true demand for your property.
The second indicator is how long properties are taking to sell; this becomes your next barometer for understanding demand. If most sold homes are selling within days and at close to asking price, then this typically indicates that demand is high (irrelevant of how much inventory remains on the market). Often, you will find a common denominator in these sold properties, such as move-in ready, location, or price point is driving demand.
Understanding these key parameters should help buyers and sellers manage their expectations, leverage opportunities, and appreciate their true negotiation power within their specific market.
Luxury Markets in Demand
As demand returns, we review several markets in the U.S. and Canada that experienced significant growth in March. Much has been written recently about the popularity of lower priced luxury markets, especially in the Midwest, so we wondered, with the uptick in sales during March, if this trend was still holding true…or if another shift is occurring.
East Bay, California
Taking the number one spot is not a Midwest market, but East Bay in California, where the median luxury sold price averaged close to $1.5 million during the first quarter of 2023. Not only did this market see a huge increase in demand during the pandemic, but once again it is drawing buyers to its highly diversified communities and seems set for a strong spring market.
The sales ratio rose from 36% in January to 50% in February and then saw a huge uptick to 123% in March – with the number of sales in March far outstripping the level of new inventory entering the market.
The average number of days these properties remained on the market fell from 22 days in January to 12 in February and down to just 9 in March. While the median sold price rose from $1 million in January to just under $2 million in March, this does not actually indicate that prices rose by 100%, but rather that there is a greater quantity of higher priced properties selling again.
Hamilton County, Indiana
Located just north of Indianapolis, Hamilton County routinely scores high marks when rated for its quality of lifestyle and has become one of the fastest-growing real estate markets in the U.S. Price certainly has been a factor for those looking to embrace a new luxury property at a more affordable rate, with the median price averaging around $750,000 for the last three months.
Like East Bay, Hamilton County has seen its sales ratio steadily climb from 34% in January, to 55% in February, and 98% in March, while the days on market for sold properties have declined from 14 days in January to 6 in March.
Oakville, Ontario
A suburban town located on the shores of Lake Ontario, Oakville is part of the Greater Toronto Area (GTA), with nearly 75% of its population aged between 20-54 years old. Even before the pandemic, Oakville saw a consistent increase in its population from those looking to enjoy its picturesque location, active lifestyle, and easy access to downtown Toronto.
Like much of the luxury real estate market, Oakville saw its transaction level stall during the last four months of 2022 into the start of 2023. However, demand has been on the uptick as expectations for Oakville’s

economic growth and diversity attract people from around the world.
Prices have risen month over month since January, from CAD$1,115,000 to CAD$2,332,000 in March – however, this is the result of an increase in the number of sales for higher priced properties. Still,
Oakville’s sales ratio rose from 25% in January to 37% in February and jumped to 76% in March, and the average days on market consistently fell from 79 in January down to 9 days in March, all indicators of a strong seller’s market.
St Louis, Missouri
Taking the final spot is St Louis, a Midwest market whose popularity has risen dramatically over the last few years and certainly has luxury properties that rival many of the more recognized luxury cities in the U.S. Indeed, just last month, St Louis saw a record-breaking sale of $13 million for a property located in the coveted Huntleigh neighborhood.
St Louis has become highly attractive for young professionals and families due to a significant urban revitalization, an influx of new businesses, and increased focus on expanding industries such as healthcare, biotechnology, and finance.
The average days on market for luxury properties has fallen over the last three months from 28 to 15 days, while prices have increased from $650,000 to $773,150 – again, this is more reflective of the increase in sales of higher priced properties, although the average sold price is still seeing modest increases.
Already significantly high in January with a sales ratio of 53%, this increased in February to 55% before jumping to 90% in March.
In conclusion, it seems that price in the luxury market is becoming less of a factor as the number of sales for higher priced properties is on the uptick, and markets seeing the greatest demand have something more to offer potential buyers than just lower-priced homes.
The art of selling and buying in this market needs a critical and analytical approach; understanding the realities and setting expectations accordingly will ensure that goals are achieved. For homeowners looking to buy or sell in today’s market, we recommend working with a Realtor who can capitalize on the preferences, trends, and demands in this dynamic and evolving environment.
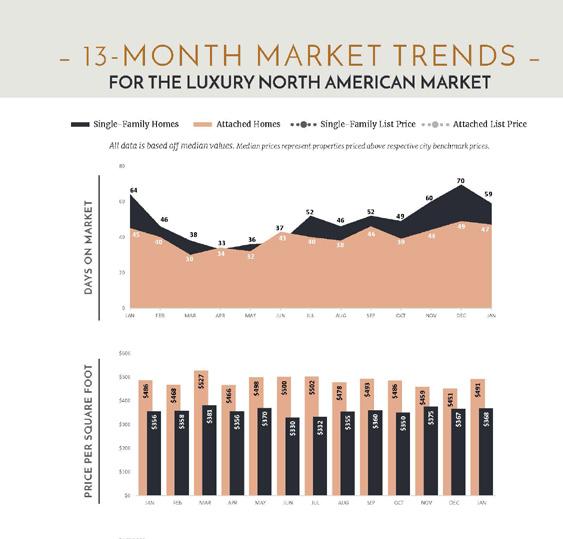
FOR THE LUXURY NORTH AMERICAN MARKET
Single-Family Homes Attached Homes Single-Family List Price Attached List Price DAYS ON MARKET
All data is based off median values. Median prices represent properties priced above respective city benchmark prices.
– 13 -
–
MONTH MARKET TRENDS
SALES PRICE VS. LIST PRICE
9 8 8 9 12 18 22 22 25 32 35 40 25 8 8 9 9 13 18 21 24 28 29 32 28 23 0 5 10 15 20 25 30 35 40 45 MAR APR MAY JUN JUL AUG SEP OCT NOV DEC JAN FEB MAR PRICE PER SQUARE FOOT $540 $524 $553 $563 $546 $527 $530 $521 $528 $519 $507 $509 $510 $421 $441 $437 $431 $432 $417 $426 $425 $415 $423 $399 $432 $413 $0 $100 $200 $300 $400 $500 $600 MAR APR MAY JUN JUL AUG SEP OCT NOV DEC JAN FEB MAR $500,000 $700,000 $900,000 $1,100,000 $1,300,000 $1,500,000 $1,700,000 $1,900,000 MAR APR MAY JUN JUL AUG SEP OCT NOV DEC JAN FEB MAR
LUXURY MONTHLY MARKET REVIEW –
A Review of Key Market Differences Year over Year
50.24%
SINGLE-FAMILY HOMES MARKET SUMMARY | MARCH 2023
• Official Market Type: Seller's with a 31.93% Sales Ratio.1
• Homes are selling for an average of 98.56% of list price.
• The median luxury threshold2 price is $937,500, and the median luxury home sales price is $1,378,000.
• Markets with the Highest Median Sales Price: Aspen ($16,931,154), Los Angeles City ($4,999,999), Telluride ($4,775,000), and Los Angeles Beach Cities ($4,300,000).
• Markets with the Highest Sales Ratio: East Bay, CA (123%), Hamilton County, IN (98%), St. Louis, MO (90%), and Oakville, ON (76%).
–
1Sales Ratio defines market speed and market type: Buyer's < 15.5%; Balanced >= 15.5 to < 20.5%; Seller's >= 20.5% plus. If >100%, sales from previous month exceeds current inventory. 2The luxury threshold price is set by The Institute for Luxury Home Marketing. SINGLE-FAMILY HOMES Median List Price $1,800,000 $1,694,500 Median Sale Price $1,362,500 $1,378,000 Median SP/LP Ratio 100.00% 98.56% Total Sales Ratio 82.17% 31.93% Median Price per Sq. Ft. $421 $413 Total Inventory 25,586 45,828 New Listings 13,691 17,532 Total Sold 21,024 14,633 Median Days on Market 9 25 Average Home Size 3,247 3,248
March 2022 | March 2023 Median prices represent properties priced above respective city benchmark prices. March 2023 March 2022 March 2023 March 2022
New Listings 3,841 Total Sold 6,391 Med. Sale Price
Days on Market
Sales
$15,500
16
Ratio
LUXURY MONTHLY MARKET REVIEW –
A Review of Key Market Differences Year over Year
49.56%
ATTACHED HOMES MARKET SUMMARY | MARCH 2023
• Official Market Type: Seller's Market with a 49.56% Sales Ratio 1
• Attached homes are selling for an average of 98.89% of list price.
• The median luxury threshold2 price is $700,000, and the median attached luxury sale price is $869,900
• Markets with the Highest Median Sales Price: Aspen ($4,125,000), Vail ($3,750,000), Lake Tahoe, NV ($2,525,000), and Park City ($2,270,000).
• Markets with the Highest Sales Ratio: Santa Barbara (500%), Howard County, MD (169%), Waterloo Regio, ON (133%), and East Bay, CA (133%).
1Sales Ratio defines market speed and market type: Buyer's < 15.5%; Balanced >= 15.5 to < 20.5%; Seller's >= 20.5% plus. If >100%, sales from previous month exceeds current inventory. 2The luxury threshold price is set by The Institute for Luxury Home Marketing. Median List Price $1,150,000 $999,888 Median Sale Price $900,000 $869,900 Median SP/LP Ratio 100.00% 98.89% Total Sales Ratio 79.69% 30.13% Median Price per Sq. Ft. $540 $510 Total Inventory 9,676 15,953 New Listings 5,540 6,154 Total Sold 7,711 4,807 Median Days on Market 8 23 Average Home Size 1,795 1,883 –
Median prices represent properties priced above respective city benchmark prices.
March 2022 | March 2023 March 2023 March 2022 March 2023 March 2022
HOMES New Listings 614 Total Sold 2,904 Med. Sale Price
Days on Market
Sales Ratio
ATTACHED
$30,100
15
LUXURY MONTHLY MARKET REVIEW –
SINGLE-FAMILY HOMES
Median prices represent properties priced above respective city benchmark prices. Prices shown for Canadian cites are shown in Canadian Dollars. –
State Market Name Median List Price Median Sold Price Inventory New Listings Sold Days on Market Market Status AB Calgary $1,100,000 $970,000 505 368 256 16 Seller's AZ Chandler and Gilbert $989,000 $1,018,430 149 53 66 53 Seller's AZ Flagstaff $1,990,000 $1,241,250 51 13 8 39 Balanced AZ Mesa $899,000 $829,500 142 55 60 54 Seller's AZ Paradise Valley $5,824,500 $3,650,000 154 37 25 39 Balanced AZ Phoenix $924,655 $851,000 680 220 253 46 Seller's AZ Scottsdale $2,128,930 $1,580,000 760 202 205 51 Seller's AZ Tucson $700,000 $650,000 792 254 293 14 Seller's BC Mid Vancouver Island $1,690,000 $1,500,000 136 65 29 26 Seller's BC Okanagan Valley $1,749,000 $1,507,444 750 292 74 36 Buyer's BC Vancouver $4,500,000 $3,412,500 898 308 98 19 Buyer's BC Victoria $2,349,500 $1,837,500 168 92 34 29 Balanced BC Whistler $5,695,000 $2,847,500 43 9 3 136 Buyer's CA Central Coast $2,944,500 $2,275,000 200 86 56 16 Seller's CA East Bay $2,349,000 $1,960,000 231 161 283 9 Seller's CA Greater Palm Springs $1,999,999 $1,700,000 421 168 112 39 Seller's CA Lake Tahoe $2,895,000 $2,243,500 103 11 22 55 Seller's CA Los Angeles Beach Cities $6,200,000 $4,300,000 329 118 79 21 Seller's CA Los Angeles City $5,950,000 $4,999,999 601 179 177 29 Seller's CA Los Angeles The Valley $2,750,000 $2,175,000 435 195 161 30 Seller's CA Marin County $3,822,500 $3,037,500 76 24 30 17 Seller's CA Napa County $3,972,500 $2,500,000 102 21 11 26 Buyer's CA Orange County $2,995,000 $2,184,000 747 278 326 27 Seller's CA Placer County $1,150,000 $1,130,000 221 87 87 20 Seller's CA Sacramento $1,098,000 $910,773 461 209 217 13 Seller's CA San Diego $2,897,500 $1,900,000 542 261 360 12 Seller's CA San Francisco $4,999,000 $3,453,000 123 35 40 13 Seller's CA San Luis Obispo County $1,750,000 $1,425,000 142 41 43 34 Seller's CA Santa Barbara $5,400,000 $3,655,000 104 45 36 11 Seller's CA Silicon Valley $4,188,888 $3,400,000 425 252 221 9 Seller's CA Sonoma County $2,285,000 $1,825,000 169 42 37 33 Seller's CA Ventura County $2,267,500 $1,825,000 202 69 68 48 Seller's CO Aspen $13,995,000 $16,931,154 71 8 9 205 Buyer's CO Boulder $2,400,000 $1,613,000 207 92 72 37 Seller's CO Colorado Springs $900,000 $875,000 324 121 111 26 Seller's CO Denver $1,750,000 $1,452,500 565 313 248 8 Seller's CO Douglas County $1,452,000 $1,225,000 274 122 101 13 Seller's
LUXURY MONTHLY MARKET REVIEW –SINGLE-FAMILY HOMES
–
Median prices represent properties priced above respective city benchmark prices. Prices shown for Canadian cites are shown in Canadian Dollars. State Market Name Median List Price Median Sold Price Inventory New Listings Sold Days on Market Market Status CO Durango $1,559,000 $1,155,000 63 19 16 77 Seller's CO Summit County $3,262,500 $2,448,500 60 18 6 98 Buyer's CO Telluride $7,700,000 $4,775,000 77 6 8 116 Buyer's CO Vail $5,950,000 $3,941,285 67 10 12 92 Balanced CT Central Connecticut $720,000 $619,900 273 66 90 15 Seller's CT Coastal Connecticut $2,450,000 $1,690,000 465 179 104 52 Seller's DC Washington D.C. $3,995,000 $2,770,000 41 19 9 5 Seller's DE Sussex County Coastal $1,429,450 $1,353,600 130 29 46 9 Seller's FL Boca Raton/Delray Beach $3,150,000 $1,700,000 472 135 80 31 Balanced FL Coastal Pinellas County $2,450,000 $1,620,000 113 36 20 88 Balanced FL Greater Fort Lauderdale $1,450,000 $1,075,000 1374 402 313 52 Seller's FL Jacksonville Beaches $1,474,625 $1,200,000 282 106 98 37 Seller's FL Lee County $1,399,900 $1,300,000 784 277 138 21 Balanced FL Marco Island $2,699,000 $2,095,000 161 33 24 70 Buyer's FL Miami $2,199,500 $1,500,000 1020 231 120 82 Buyer's FL Naples $5,637,500 $3,405,770 494 98 61 47 Buyer's FL Orlando $1,295,000 $1,100,000 660 226 198 21 Seller's FL Palm Beach Towns $4,575,000 $2,750,000 332 72 31 77 Buyer's FL Sarasota & Beaches $2,825,000 $1,998,500 464 131 70 25 Balanced FL South Pinellas County $1,680,000 $1,295,000 291 97 80 53 Seller's FL South Walton $2,400,000 $2,021,700 401 124 65 48 Balanced FL Space Coast $865,000 $735,000 287 97 113 22 Seller's FL Tampa $797,000 $710,000 1019 382 419 33 Seller's FL Weston $1,400,000 $935,000 97 40 36 40 Seller's GA Atlanta $1,700,000 $1,225,000 629 271 200 11 Seller's GA Duluth $1,694,500 $1,655,000 14 6 6 10 Seller's HI Island of Hawaii $2,317,500 $1,512,500 134 23 24 39 Balanced HI Kauai $2,987,000 $1,560,000 51 6 3 87 Buyer's HI Maui $3,672,500 $2,431,500 154 35 18 135 Buyer's HI Oahu $3,250,000 $2,357,500 175 41 38 35 Seller's ID Ada County $777,400 $775,000 552 281 240 16 Seller's ID Northern Idaho $1,799,000 $1,387,500 217 71 32 104 Buyer's IL Chicago $1,665,331 $1,252,500 472 210 206 18 Seller's IL DuPage County $1,299,000 $917,000 208 87 75 26 Seller's IL Lake County $1,298,000 $882,500 187 60 66 43 Seller's IL Will County $649,990 $622,950 179 67 96 14 Seller's IN Hamilton County $935,000 $769,433 127 61 124 6 Seller's
LUXURY MONTHLY MARKET REVIEW –SINGLE-FAMILY HOMES
–
Median prices represent properties priced above respective city benchmark prices. Prices shown for Canadian cites are shown in Canadian Dollars. State Market Name Median List Price Median Sold Price Inventory New Listings Sold Days on Market Market Status KS Johnson County $837,453 $832,281 427 63 104 5 Seller's MA Cape Cod $2,600,000 $2,300,000 119 36 21 14 Balanced MA Greater Boston $3,395,000 $2,720,000 152 81 21 19 Buyer's MA South Shore $1,932,500 $1,660,000 64 32 11 26 Balanced MD Anne Arundel County $1,009,523 $960,000 145 72 77 7 Seller's MD Frederick County $875,000 $836,483 55 23 16 7 Seller's MD Howard County $1,082,111 $1,080,017 70 30 34 6 Seller's MD Montgomery County $2,149,999 $1,625,000 144 74 67 7 Seller's MD Talbot County $2,874,000 $3,450,000 30 13 6 18 Balanced MD Worcester County $1,112,500 $812,500 44 14 11 55 Seller's MI Livingston County $785,000 $644,250 63 19 14 9 Seller's MI Monroe County $674,900 $585,000 10 2 3 83 Seller's MI Oakland County $839,850 $675,000 602 236 217 12 Seller's MI Washtenaw County $992,500 $775,000 126 43 41 11 Seller's MI Wayne County $729,000 $624,299 147 74 79 11 Seller's MN Olmsted County $879,450 $827,082 78 29 16 41 Balanced MN Twin Cities $1,200,000 $1,000,000 581 230 155 19 Seller's MO Kansas City $679,496 $651,400 1422 272 348 15 Seller's MO St. Louis $874,900 $773,150 67 32 60 15 Seller's NC Asheville $1,125,000 $815,000 185 64 45 29 Seller's NC Charlotte $1,200,000 $925,000 440 184 267 6 Seller's NC Lake Norman $1,149,000 $963,810 177 60 54 8 Seller's NC Raleigh-Durham $1,192,500 $962,500 466 180 184 1 Seller's NJ Bergen County $2,295,777 $1,850,000 241 86 44 47 Balanced NJ Hudson County $1,500,000 $1,460,000 23 10 4 37 Balanced NJ Morris County $1,744,000 $1,537,500 116 48 38 16 Seller's NJ Ocean County $949,950 $807,265 352 150 112 32 Seller's NM Taos $1,200,000 $1,212,500 47 13 6 131 Buyer's NV Lake Tahoe $4,397,500 $2,200,000 64 10 9 93 Buyer's NV Las Vegas $1,750,000 $1,378,000 613 186 117 25 Balanced NV Reno $1,700,000 $1,625,000 71 17 24 101 Seller's NY Finger Lakes $1,675,000 $1,400,000 20 9 5 43 Seller's NY Nassau County $1,854,000 $1,450,000 586 189 81 74 Buyer's NY Staten Island $1,249,999 $1,071,000 134 35 16 43 Buyer's NY Suffolk County $1,999,000 $1,325,000 678 170 97 67 Buyer's OH Cincinnati $874,900 $755,500 209 60 66 6 Seller's OH Cleveland Suburbs $849,000 $652,000 23 13 15 29 Seller's
LUXURY MONTHLY MARKET REVIEW –SINGLE-FAMILY HOMES
–
Median prices represent properties priced above respective city benchmark prices. Prices shown for Canadian cites are shown in Canadian Dollars. State Market Name Median List Price Median Sold Price Inventory New Listings Sold Days on Market Market Status ON GTA - Durham $1,799,450 $1,515,000 160 149 70 10 Seller's ON GTA - York $2,654,000 $1,920,000 376 324 231 9 Seller's ON Hamilton $1,949,950 $1,503,000 172 97 46 14 Seller's ON Mississauga $2,979,000 $2,425,000 107 64 25 15 Seller's ON Oakville $3,199,500 $2,332,000 88 73 67 9 Seller's ON Toronto $3,688,800 $3,180,000 327 228 101 9 Seller's ON Waterloo Region $1,549,900 $1,300,000 111 101 70 14 Seller's OR Portland $1,299,444 $1,150,000 470 183 140 14 Seller's QC Montreal - - - - - -SC Charleston $2,150,000 $1,435,000 347 131 149 40 Seller's SC Hilton Head $1,999,000 $1,600,000 228 55 53 48 Seller's SC The Grand Strand $850,000 $800,000 389 112 93 117 Seller's TN Greater Chattanooga $949,900 $842,500 163 62 44 12 Seller's TN Nashville $1,750,000 $1,400,000 626 234 225 7 Seller's TX Austin $1,200,000 $937,500 1070 514 242 23 Seller's TX Collin County $758,593 $710,000 959 466 517 26 Seller's TX Dallas $1,595,000 $1,059,500 407 205 130 15 Seller's TX Denton County $765,000 $720,000 777 381 345 26 Seller's TX El Paso $625,000 $600,000 167 42 21 7 Buyer's TX Fort Worth $850,000 $777,500 780 340 274 20 Seller's TX Greater Tyler $798,000 $637,500 199 64 34 35 Balanced TX Houston $1,025,000 $875,000 1013 439 325 15 Seller's TX Lubbock $618,500 $640,000 134 57 33 70 Seller's TX San Angelo $647,450 $635,000 60 16 10 143 Balanced TX San Antonio $799,250 $739,775 602 203 129 51 Seller's TX The Woodlands & Spring $950,000 $715,000 159 87 94 10 Seller's UT Park City $5,150,000 $4,000,000 143 22 19 38 Buyer's UT Salt Lake City $1,200,000 $999,950 307 133 146 52 Seller's VA Arlington & Alexandria $2,298,500 $1,748,220 88 38 28 16 Seller's VA Charlottesville $1,300,000 $1,119,000 131 37 28 14 Seller's VA Fairfax County $2,069,000 $1,631,250 299 143 130 6 Seller's VA McLean & Vienna $2,799,944 $2,010,000 134 58 58 11 Seller's VA Richmond $799,950 $797,865 271 103 129 8 Seller's VA Smith Mountain Lake $1,446,500 $1,150,000 20 7 8 5 Seller's WA King County - Greater Seattle $2,085,000 $1,687,000 687 414 410 8 Seller's WA Seattle $1,990,000 $1,686,000 163 96 110 6 Seller's WA Spokane $1,200,000 $967,500 74 37 18 10 Seller's
LUXURY MONTHLY MARKET REVIEW –ATTACHED HOMES
–
Markets with dashes do not have a significant luxury market for this report. Median prices represent properties priced above respective city benchmark prices. Prices shown for Canadian cites are shown in Canadian Dollars. State Market Name Median List Price Median Sold Price Inventory New Listings Sold Days on Market Market Status AB Calgary $779,050 $681,250 134 60 44 25 Seller's AZ Chandler and Gilbert - - - - - -AZ Flagstaff - - - - - -AZ Mesa - - - - - -AZ Paradise Valley - - - - - -AZ Phoenix - - - - - -AZ Scottsdale $895,000 $790,000 255 81 79 40 Seller's AZ Tucson - - - - - -BC Mid Vancouver Island $799,900 $869,900 54 33 15 35 Seller's BC Okanagan Valley - - - - - -BC Vancouver $1,950,000 $1,705,000 881 359 111 11 Buyer's BC Victoria $999,888 $925,000 129 88 47 21 Seller's BC Whistler $2,243,500 $1,990,000 38 14 5 3 Buyer's CA Central Coast $1,244,000 $1,153,000 26 12 17 11 Seller's CA East Bay $1,160,000 $1,072,500 83 60 110 10 Seller's CA Greater Palm Springs - - - - - -CA Lake Tahoe $1,949,000 $1,537,000 21 9 10 35 Seller's CA Los Angeles Beach Cities $1,837,500 $1,730,000 132 65 42 17 Seller's CA Los Angeles City $1,800,000 $1,640,000 319 102 99 25 Seller's CA Los Angeles The Valley $780,000 $802,375 107 58 67 24 Seller's CA Marin County $1,392,500 $1,281,000 14 6 11 17 Seller's CA Napa County - - - - - -CA Orange County $1,298,000 $1,142,000 271 133 203 24 Seller's CA Placer County - - - - - -CA Sacramento - - - - - -CA San Diego $1,295,000 $1,064,000 245 129 178 13 Seller's CA San Francisco $2,695,000 $2,270,000 117 27 20 10 Balanced CA San Luis Obispo County - - - - - -CA Santa Barbara $2,995,000 $1,475,000 3 5 15 14 Seller's CA Silicon Valley $1,666,500 $1,600,000 110 74 71 12 Seller's CA Sonoma County $825,000 $720,000 9 7 9 32 Seller's CA Ventura County $750,000 $770,000 88 42 39 50 Seller's CO Aspen $3,950,000 $4,125,000 59 10 5 86 Buyer's CO Boulder $965,000 $814,388 75 40 28 32 Seller's CO Colorado Springs $600,755 $557,495 53 11 12 22 Seller's CO Denver $885,000 $812,200 141 54 46 12 Seller's CO Douglas County $565,000 $583,000 19 12 13 11 Seller's
LUXURY MONTHLY MARKET REVIEW –ATTACHED HOMES
–
Markets with dashes do not have a significant luxury market for this report. Median prices represent properties priced above respective city benchmark prices. Prices shown for Canadian cites are shown in Canadian Dollars. State Market Name Median List Price Median Sold Price Inventory New Listings Sold Days on Market Market Status CO Durango $796,453 $750,000 22 5 5 44 Seller's CO Summit County $1,350,000 $1,475,000 26 7 6 21 Seller's CO Telluride $2,172,500 $2,025,000 36 7 6 85 Balanced CO Vail $3,895,000 $3,750,000 74 20 10 58 Buyer's CT Central Connecticut - - - - - -CT Coastal Connecticut $1,275,000 $745,000 155 43 61 23 Seller's DC Washington D.C. $2,000,000 $1,721,400 196 104 65 9 Seller's DE Sussex County Coastal $949,000 $766,750 19 5 6 10 Seller's FL Boca Raton/Delray Beach $1,199,000 $795,000 329 106 101 33 Seller's FL Coastal Pinellas County $1,250,000 $1,057,500 138 42 46 22 Seller's FL Greater Fort Lauderdale $849,450 $782,500 1056 290 178 40 Balanced FL Jacksonville Beaches $1,100,000 $969,000 37 13 23 43 Seller's FL Lee County $842,500 $930,000 447 137 92 15 Balanced FL Marco Island $1,624,500 $1,600,000 64 22 11 36 Balanced FL Miami $1,499,000 $1,305,000 1416 306 162 100 Buyer's FL Naples $2,347,000 $2,000,000 281 98 78 30 Seller's FL Orlando $564,000 $567,000 220 63 70 25 Seller's FL Palm Beach Towns $1,795,000 $2,050,000 293 77 58 55 Balanced FL Sarasota & Beaches $1,600,000 $1,325,000 244 89 62 9 Seller's FL South Pinellas County $1,000,000 $925,000 228 56 59 18 Seller's FL South Walton $1,591,800 $1,100,000 167 39 29 48 Balanced FL Space Coast $748,000 $691,175 167 43 29 34 Balanced FL Tampa $1,023,900 $782,500 180 76 70 24 Seller's FL Weston - - - - - -GA Atlanta $738,950 $665,000 472 158 136 15 Seller's GA Duluth - - - - - -HI Island of Hawaii $1,580,000 $1,198,000 67 16 17 5 Seller's HI Kauai $1,950,000 $1,329,100 39 5 17 43 Seller's HI Maui $2,149,000 $2,150,000 91 22 22 64 Seller's HI Oahu $1,200,000 $1,000,000 457 99 103 33 Seller's ID Ada County $599,900 $592,000 47 18 21 10 Seller's ID Northern Idaho - - - - - -IL Chicago $1,249,250 $1,021,413 724 281 148 89 Balanced IL DuPage County $692,450 $865,000 20 12 10 81 Seller's IL Lake County - - - - - -IL Will County - - - - - -IN Hamilton County - - - - - - -
LUXURY MONTHLY MARKET REVIEW –ATTACHED HOMES
–
Markets with dashes do not have a significant luxury market for this report. Median prices represent properties priced above respective city benchmark prices. Prices shown for Canadian cites are shown in Canadian Dollars. State Market Name Median List Price Median Sold Price Inventory New Listings Sold Days on Market Market Status KS Johnson County $594,950 $616,200 133 18 18 164 Buyer's MA Cape Cod $850,000 $842,500 23 9 4 21 Balanced MA Greater Boston $2,400,000 $2,100,000 363 152 56 39 Balanced MA South Shore $842,000 $862,500 16 4 4 36 Seller's MD Anne Arundel County $589,900 $578,500 61 42 44 5 Seller's MD Frederick County - - - - - -MD Howard County $625,990 $592,493 13 6 22 10 Seller's MD Montgomery County $835,758 $775,000 68 50 72 10 Seller's MD Talbot County - - - - - -MD Worcester County $669,450 $650,000 60 22 23 12 Seller's MI Livingston County - - - - - -MI Monroe County - - - - - -MI Oakland County $679,000 $635,000 61 24 19 5 Seller's MI Washtenaw County $620,000 $626,175 51 15 17 78 Seller's MI Wayne County $656,550 $640,000 66 23 13 4 Balanced MN Olmsted County - - - - - -MN Twin Cities - - - - - -MO Kansas City - - - - - -MO St. Louis - - - - - -NC Asheville $786,650 $640,000 38 8 18 23 Seller's NC Charlotte $648,845 $615,000 182 103 88 22 Seller's NC Lake Norman $643,300 $649,150 26 17 8 3 Seller's NC Raleigh-Durham - - - - - -NJ Bergen County $1,214,095 $1,085,407 131 53 26 59 Balanced NJ Hudson County $1,399,000 $1,200,000 93 40 27 15 Seller's NJ Morris County $669,000 $590,000 65 34 27 19 Seller's NJ Ocean County $1,099,000 $780,000 63 28 25 24 Seller's NM Taos - - - - - -NV Lake Tahoe $1,498,000 $2,525,000 13 2 2 136 Balanced NV Las Vegas - - - - - -NV Reno - - - - - -NY Finger Lakes - - - - - -NY Nassau County $1,412,500 $1,150,000 70 23 6 49 Buyer's NY Staten Island $621,450 $650,000 84 35 23 46 Seller's NY Suffolk County $757,500 $625,000 118 43 43 53 Seller's OH Cincinnati - - - - - -OH Cleveland Suburbs - - - - - - -
LUXURY MONTHLY MARKET REVIEW –ATTACHED HOMES
–
Markets with dashes do not have a significant luxury market for this report. Median prices represent properties priced above respective city benchmark prices. Prices shown for Canadian cites are shown in Canadian Dollars. State Market Name Median List Price Median Sold Price Inventory New Listings Sold Days on Market Market Status ON GTA - Durham $849,000 $812,500 23 20 18 9 Seller's ON GTA - York $828,000 $762,500 201 160 103 16 Seller's ON Hamilton $914,495 $878,090 22 22 16 12 Seller's ON Mississauga $963,500 $925,000 84 75 44 9 Seller's ON Oakville $1,399,900 $1,110,000 29 15 13 28 Seller's ON Toronto $1,296,500 $1,088,000 718 471 235 12 Seller's ON Waterloo Region $793,471 $740,000 15 18 20 9 Seller's OR Portland $750,000 $664,500 199 70 45 19 Seller's QC Montreal - - - - - -SC Charleston $1,150,000 $1,025,000 84 38 26 24 Seller's SC Hilton Head $1,150,000 $1,012,500 23 10 16 53 Seller's SC The Grand Strand $550,000 $527,450 148 51 76 69 Seller's TN Greater Chattanooga - - - - - -TN Nashville $779,900 $639,375 169 71 63 12 Seller's TX Austin $862,450 $820,000 314 135 56 27 Balanced TX Collin County - - - - - -TX Dallas $720,000 $669,500 111 59 54 30 Seller's TX Denton County - - - - - -TX El Paso - - - - - -TX Fort Worth - - - - - -TX Greater Tyler - - - - - -TX Houston $599,995 $610,000 101 53 38 23 Seller's TX Lubbock - - - - - -TX San Angelo - - - - - -TX San Antonio $895,000 $670,000 37 5 3 133 Buyer's TX The Woodlands & Spring - - - - - -UT Park City $2,250,000 $2,175,994 75 22 28 30 Seller's UT Salt Lake City $674,900 $557,500 97 44 62 23 Seller's VA Arlington & Alexandria $1,120,000 $942,500 69 43 58 22 Seller's VA Charlottesville $617,608 $583,335 37 22 12 0 Seller's VA Fairfax County $799,950 $710,000 108 76 130 5 Seller's VA McLean & Vienna $1,150,000 $986,350 23 10 16 6 Seller's VA Richmond - - - - - -VA Smith Mountain Lake - - - - - -WA King County - Greater Seattle $1,279,000 $1,060,000 245 114 68 19 Seller's WA Seattle $1,512,500 $1,050,000 128 49 25 23 Balanced WA Spokane - - - - - - -
NORTHERN IDAHO
2023 APRIL
14 2 2 3 10 13 7 16 20 21 27 22 32 22 6 1 0 0 0 0 0 3 3 0 3 2 4 6 7 3 $7,500,000+ $6,600,000 - $7,499,999 $5,800,000 - $6,599,999 $5,000,000 - $5,799,999 $4,200,000 - $4,999,999 $3,600,000 - $4,199,999 $3,000,000 - $3,599,999 $2,600,000 - $2,999,999 $2,200,000 - $2,599,999 $1,800,000 - $2,199,999 $1,600,000 - $1,799,999 $1,400,000 - $1,599,999 $1,200,000 - $1,399,999 $1,100,000 - $1,199,999 $1,000,000 - $1,099,999 Inventory Sales Square Feet3 -RangePrice -Median SoldBeds -Median SoldBaths -Median SoldSold -TotalInventory -TotalSales Ratio -Sold/Inventory0 - 1,999 $1,350,000 1 2 3 19 16% 2,000 - 2,999 $1,141,007 3 3 5 59 8% 3,000 - 3,999 $1,412,500 4 4 16 68 24% 4,000 - 4,999 $1,267,500 4 4 5 30 17% 5,000 - 5,999 $2,650,000 5 4 1 20 5% 6,000+ $6,000,000 4 5 2 21 10% NORTHERN IDAHO SINGLE - FAMILY HOMES
INVENTORY VS. SALES
Luxury Benchmark Price 1: $1,000,000 Balanced Market 217 Total Inventory: 32 Total Sales: 15% Total Sales Ratio2: 1 The luxury threshold price is set by The Institute for Luxury Home Marketing. 2Sales Ratio defines market speed and market type: Buyer's < 14.5%; Balanced >= 14.5 to < 20.5%; Seller's >= 20.5% plus. If >100% MLS® data reported previous month’s sales exceeded current inventory.
LUXURY
| MARCH 2023
NORTHERN IDAHO SINGLE - FAMILY HOMES
13 - MONTH LUXURY MARKET TREND 4
MEDIAN DATA REVIEW | MARCH
TOTAL INVENTORY
139 217 Mar. 2022 Mar. 2023
VARIANCE: 56 %
SALE PRICE PER SQFT.
TOTAL SOLDS
VARIANCE: - 29 % 45 32
SALE TO LIST PRICE RATIO
VARIANCE: - 6 % 99.23% 93.72%
SALES PRICE
VARIANCE: 2 % $1.36m $1.39m
DAYS ON MARKET
VARIANCE: 100 % 52 104
NORTHERN IDAHO MARKET SUMMARY | MARCH 2023
• The Northern Idaho single-family luxury market is a Balanced Market with a 15% Sales Ratio.
• Homes sold for a median of 93.72% of list price in March 2023.
• The most active price band is $1,000,000-$1,099,999, where the sales ratio is 50%
• The median luxury sales price for single-family homes is $1,387,500.
• The median days on market for March 2023 was 104 days, up from 52 in March 2022.
3Square foot table does not account for listings and solds where square foot data is not disclosed. 4Data reported includes Active and Sold properties and does not include Pending properties.
Solds Median Sales Price Inventory 139 209 320 390 503 515 436 401 329 232 232 257 217 45 69 52 51 53 58 71 59 48 32 29 15 32 $1,355,000 $1,400,000 $1,375,000 $1,410,000 $1,308,000 $1,325,000 $1,402,000 $1,350,000 $1,350,700 $1,300,000 $1,325,000 $1,400,000 $1,387,500 Mar-22 Apr-22 May-22 Jun-22 Jul-22 Aug-22 Sep-22 Oct-22 Nov-22 Dec-22 Jan-23 Feb-23 Mar-23
VARIANCE: - 11 % $491 $436 Mar. 2022 Mar. 2023 Mar. 2022 Mar. 2023 Mar. 2022 Mar. 2023 Mar. 2022 Mar. 2023 Mar. 2022 Mar. 2023
- Kathleen Tillman


KATHLEEN TILLMAN 208.699.2210 | Kathleen@KathleenTillman.com| www.KathleenTillman.com Thank you for taking time to view this report. For more information about this report and the services I can offer you and your luxury property, please give me a call at 208.699.2210.