
FRANCO MARTINEZ LUXURY MARKET REPORT LA V ALLEY & LA BEA CHES M ARCH 202 4

FRANCO MARTINEZ
Real Estate Professional
DRE# 02195656
310.846.1117
franco.martinez@exprealty.com
www.francomartinez.realtor
Meet Franco Martinez, your premier luxury new construction home real estate expert proudly serving the community of San Pedro. With a wealth of knowledge and expertise, Franco’s steadfast commitment and service truly sets him apart in the competitive real estate market.
Franco has earned the esteemed Green Designation from the National Association of REALTORS®. This prestigious certification underlines his ability to guide home buyers in creating a healthier, greener home. It provides sellers with strategic solutions to enhance the energy-efficiency of their homes, ultimately increasing their market value.
He offers valuable insights into new luxury homes, particularly within gated communities. Franco’s professional affiliations are a testament to his dedication and competence in the real estate field. As a member of the Institute for Luxury Home Marketing and the Residential Real Estate Council, he is committed to the highest standards of professionalism. Furthermore, as a real estate professional with exp realty, he specializes in new home construction, further expanding his comprehensive suite of services.
Holding certifications as a Green Real Estate Professional, Pricing Strategy Advisor, New Home Construction Specialist, and Certified Luxury Home Expert, Franco is more than equipped to help you navigate the complex process of buying or selling a home. With Franco, you can be confident that you receive the best service where luxury meets sustainability.

TABLE OF CONTENTS
PAGE 4 LUXURY REPORT EXPLAINED
PAGE 5 WELCOME MESSAGE
PAGE 6-9 NORTH AMERICAN LUXURY MARKET REVIEW
PAGE 10 13-MONTH MARKET TRENDS
PAGE 11 SINGLE-FAMILY HOMES MONTHLY OVERVIEW
PAGE 12 ATTACHED HOMES MONTHLY OVERVIEW
PAGE 13-16 MONTHLY STATISTICS BY CITY
PAGE 18 LOS ANGELES VALLEY LUXURY MARKET REVIEW
PAGE 23 LOS ANGELES BEACHES LUXURY MARKET REVIEW
PAGE 28
THANK YOU

LUXURY REPORT EXPLAINED
The Institute for Luxury Home Marketing has analyzed a number of metrics — including sales prices, sales volumes, number of sales, sales-price-to-list-price ratios, days on market and price-per-square-foot – to provide you a comprehensive North American Luxury Market report.
Additionally, we have further examined all of the individual luxury markets to provide both an overview and an in-depth analysis - including, where data is sufficient, a breakdown by luxury single-family homes and luxury attached homes.
It is our intention to include additional luxury markets on a continual basis. If your market is not featured, please contact us so we can implement the necessary qualification process. More in-depth reports on the luxury communities in your market are available as well.
Looking through this report, you will notice three distinct market statuses, Buyer's Market, Seller's Market, and Balanced Market. A Buyer's Market indicates that buyers have greater control over the price point. This market type is demonstrated by a substantial number of homes on the market and few sales, suggesting demand for residential properties is slow for that market and/or price point.
By contrast, a Seller's Market gives sellers greater control over the price point. Typically, this means there are few homes on the market and a generous demand, causing competition between buyers who ultimately drive sales prices higher.
A Balanced Market indicates that neither the buyers nor the sellers control the price point at which that property will sell and that there is neither a glut nor a lack of inventory. Typically, this type of market sees a stabilization of both the list and sold price, the length of time the property is on the market as well as the expectancy amongst homeowners in their respective communities – so long as their home is priced in accordance with the current market value.
REPORT GLOSSARY
REMAINING INVENTORY: The total number of homes available at the close of a month.
DAYS ON MARKET: Measures the number of days a home is available on the market before a purchase offer is accepted.
LUXURY BENCHMARK PRICE: The price point that marks the transition from traditional homes to luxury homes.
NEW LISTINGS: The number of homes that entered the market during the current month.
PRICE PER SQUARE FOOT: Measures the dollar amount of the home's price for an individual square foot.
SALES RATIO: Sales Ratio defines market speed and determines whether the market currently favors buyers or sellers. A Buyer's Market has a Sales Ratio of less than 12%; a Balanced Market has a ratio of 12% up to 21%; a Seller's Market has a ratio of 21% or higher. A Sales Ratio greater than 100% indicates the number of sold listings exceeds the number of listings available at the end of the month.
SP/LP RATIO: The Sales Price/List Price Ratio compares the value of the sold price to the value of the list price.
–
–
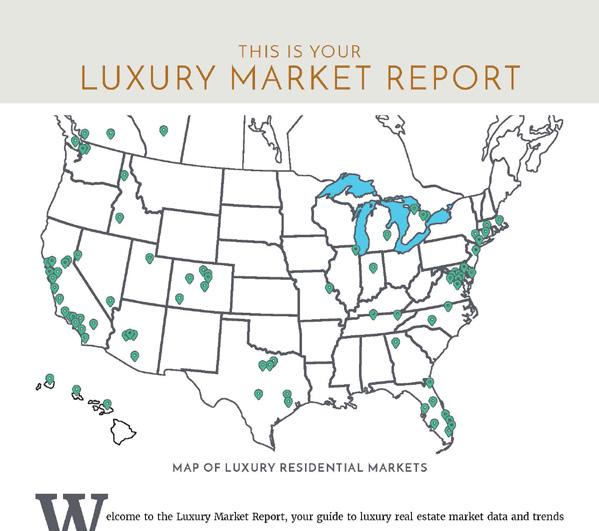
THIS IS YOUR
LUXURY MARKET REPORT
MAP OF LUXURY RESIDENTIAL MARKETS
Welcome to the Luxury Market Report, your guide to luxury real estate market data and trends for North America. Produced monthly by The Institute for Luxury Home Marketing, this report provides an in-depth look at the top residential markets across the United States and Canada. Within the individual markets, you will find established luxury benchmark prices and detailed survey of luxury active and sold properties designed to showcase current market status and recent trends. The national report illustrates a compilation of the top North American markets to review overall standards and trends.
Copyright © 2023 Institute for Luxury Home Marketing | www.luxuryhomemarketing.com | 214.485.3000
The Luxury Market Report is a monthly analysis provided by The Institute for Luxury Home Marketing. Luxury benchmark prices are determined by The Institute. This active and sold data has been provided by REAL Marketing, who has compiled the data through various sources, including local MLS boards, local tax records and Realtor.com. Data is deemed reliable to the best of our knowledge, but is not guaranteed.
NORTH AMERICAN LUXURY REVIEW
Demand for Luxury Real Estate on the Uptick
The last four months have seen a subtle change in the luxury real estate market.
While the affluent tend to be less impacted by outside influences, concerns over the financial market and economic variables did see buyers take a long pause and the market stagnate during most of 2023. Falling inventory, especially new listings entering the market and, even more specifically, a lack of home types in high demand, also resulted in a decline in the volume of sales.
In recent months, there has been a quiet optimism building as the increase in new inventory entering the market has opened more opportunities for buyers. In turn, this has resulted in an uptick in sales.
The data for February 2024 indicates there is positive movement with respect to sales. Compared to February 2023, the number of new listings entering the market increased by 41.4% for single-family homes and 46.4% for attached homes, but of more significance is that the number of sales also increased in both markets by 23.5% and 18.5%, respectively.
The reality is that except for the locations where the buying frenzy caused both price increases and continued sales growth to become unsustainable, luxury home purchases are once again seeing higher transaction levels across many markets.
The continuation of this upward trend is one that heralds the return of seller confidence and buyer demand as we enter the spring market.
Drivers of Demand
In addition to the opportunity for buyers’ pent-up demand to be released, as more inventory becomes available, we are seeing other drivers start to play a significant role.
More competitive rates for mortgages and other loan types are now being offered to affluent buyers (as their wealth makes them considerably less risky to lenders), which is likely to help ignite more sales from those looking for a spring purchase.
Equally, markets that still offer more affordability or potential price growth are expected to see an uptick in demand. The growth of demand for the luxury sector in these markets is heavily driven by millennials, particularly those who can work from home.
This generation is not living in their parents’ basements anymore; they are buying multimilliondollar homes and is the generation expected to change the high-end housing market as their preferences are driven by technology and environmental requirements.
According to Coldwell Banker Global Luxury’s recent Trend Report 2024, there is a new demographic about to enter the arena called ‘HENRY’s” (High Earners, Not Yet Rich), whose influence could be equally as significant as that of millennials on the luxury property market. They expect HENRYs to become first-time luxury homebuyers as their wealth becomes more solidified and their lifestyle requirements change due to settling down, family, or aspirations matching their new financial status. Expectations are that we will see many fluctuations in demand, prices, and sales over the next few months. There will be a lack of consistency between markets and within markets themselves, where certain price points will see high demand and others will see very little interest.
Specific property types, as well as locations, are very much on the table when it comes to buyers’ preferences too. Demand for 'move-in-ready’ as well as the need to find a property that not only fulfills aspirational lifestyle choices but is amenity-rich too will be equally important for buyers in 2024.
Locations in Demand
Location has always been important to the affluent, and there is very little expectation for this to change, except perhaps in the diversity of new locations that will come to the forefront of demand this year.
The migration of high-power companies to new locations away from major metropolitan cities throughout North America during COVID is still very much a factor in attracting new affluent buyers. According to Sotheby’s International Realty report, the rise of tech hubs in cities such as Houston, Miami, Phoenix, San Diego, Charlotte, Boston, and Tampa saw double-digit growth in salaries over the past year, which will certainly remain a strong enticement.
Old favorites such as key metropolises will continue to attract those whose businesses lie within, especially as more and more companies are demanding the return of not just their workforce but their senior executives too.
However, it is the continuing demand for multiple ownership of properties in rural, waterfront, and mountain locations, especially those that are less affected by climate change, that could see the most growth in 2024.
Property Types in Demand
Demand for very specific property types will also bring change to the luxury market, as the wealthy not only seek the right location but also homes with amenities that equally meet their practical needs and “must-have” requirements.
One trend that was on the uptick prior to the arrival of the pandemic was the demand for hotelstyle living in private residences, and according to Coldwell Banker Global Luxury’s Trend Report 2024, we should expect to see the demand for branded residences return.
They predict that these residences will dominate the high-end home market as the affluent seek not just the best white-glove service but also the opportunity to enjoy ‘experiences'—and they are willing to pay top dollar.
Expect to see growth in the multi-generational home. New builds are being designed to cater to extended families, whether it be multiple master suites, separate living spaces, or even additional homes on the property.
That is not to say the trend is all about bigger. As people recognize they are happy to return to smaller footprints, particularly those heading towards metropolitan lifestyles, health and wellness are still top of mind. Instead, it is the use of space to promote physical and mental well-being that has become appreciated in an entirely new way.
Amenities in Demand
While the obvious, such as access to amenities like gyms, yoga studios, and spas, is important, it is the demand for sustainability and smart homes that is truly on the rise. Luxury homes, apartment buildings, and townhouse complexes are turning towards sustainable living options. This is not just for new builds, as many properties have gone through extensive renovations to provide for this demand.
Using smart home technology has helped to facilitate changing these environments with fully automated systems that control not just entertainment and security systems but lighting, temperature, air quality, and water conservation.
Privacy and security also remain highly important to the affluent, and there has been a notable increase in advanced security systems being implemented, as well as demand for properties that offer privacy and seclusion, whether branded residences or private homesteads.
Overall, the biggest demands in luxury real estate are often characterized by a combination of luxury lifestyle features, exclusivity, and investment potential. However, it's essential to note that these demands can vary significantly depending on regional preferences and market dynamics.
The art of selling and buying in this market needs a critical and analytical approach; understanding the realities and setting expectations accordingly will ensure that goals are achieved. For homeowners looking to buy or sell in today’s market, we recommend working with a realtor who can capitalize on the preferences, trends, and demands in this dynamic and evolving environment.
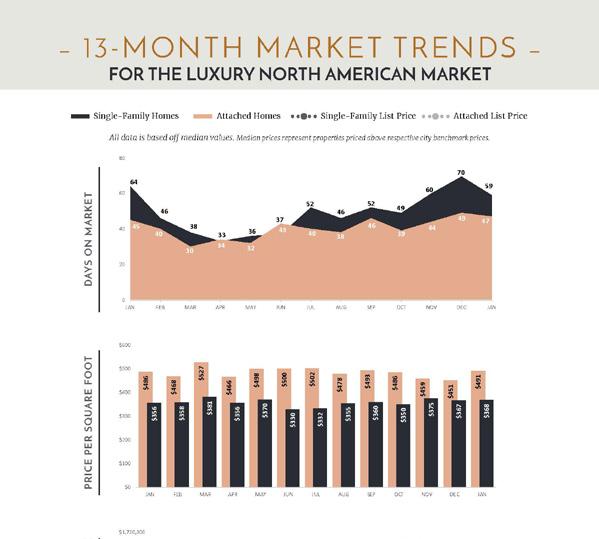
FOR THE LUXURY NORTH AMERICAN MARKET
Single-Family Homes Attached Homes Single-Family List Price Attached List Price
All data is based off median values. Median prices represent properties priced above respective city benchmark prices.
– 13 -
MONTH MARKET TRENDS –
DAYS ON MARKET SALES PRICE VS. LIST PRICE
0 5 10 15 20 25 30 35 40 45 FEB MAR APR MAY JUN JUL AUG SEP OCT NOV DEC JAN FEB SALES RATIO 0% 5% 10% 15% 20% 25% 30% 35% 40% 45% FEB MAR APR MAY JUN JUL AUG SEP OCT NOV DEC JAN FEB $500,000 $700,000 $900,000 $1,100,000 $1,300,000 $1,500,000 $1,700,000 $1,900,000 FEB MAR APR MAY JUN JUL AUG SEP OCT NOV DEC JAN FEB 21% 12% Seller's Balanced Buyer's
• Official Market Type: Seller's Market with a 22.07% Sales Ratio.1
• Homes are selling for an average of 98.11% of list price.
• The median luxury threshold2 price is $925,000, and the median luxury home sales price is $1,325,000.
• Markets with the Highest Median Sales Price: Telluride ($5,710,000), Vail ($5,000,000), Park City ($4,375,000), and Naples ($4,175,000).
• Markets with the Highest Sales Ratio: East Bay (105.1%), St. Louis (71.2%), Seattle (66.0%), and Calgary (63.7%).
1Sales Ratio defines market speed and market type: Buyer's < 12%; Balanced >= 12 to < 21%; Seller's >= 21%. If >100%, sales from previous month exceeds current inventory. 2The luxury threshold price is set by The Institute for Luxury Home Marketing.
–
LUXURY MONTHLY MARKET REVIEW –
SINGLE-FAMILY HOMES Median List Price $1,650,000 $1,637,500 Median Sale Price $1,312,500 $1,325,000 Median SP/LP Ratio 97.77% 98.11% Total Sales Ratio 22.27% 22.07% Median Price per Sq. Ft. $405 $403 Total Inventory 43,183 53,795 New Listings 13,297 18,805 Total Sold 9,616 11,872 Median Days on Market 40 36 Average Home Size 3,319 3,213
Key
A Review of
Market Differences Year over Year
Median prices represent properties priced above respective city benchmark prices. February 2024 February 2023 February 2024 February 2023 SINGLE-FAMILY HOMES MARKET SUMMARY | FEBRUARY 2024 New Listings Total Sold 2,256 Med. Sale Price $12,500 5,508 Days on Market 4 Sales Ratio .20%
February 2023 | February 2024
– LUXURY MONTHLY MARKET REVIEW –
A Review of Key Market Differences Year over Year
February 2023 | February 2024
• Official Market Type: Balanced Market with a 17.55% Sales Ratio. 1
• Attached homes are selling for an average of 98.77% of list price.
• The median luxury threshold2 price is $700,000, and the median attached luxury sale price is $989,250
• Markets with the Highest Median Sales Price: Vail ($3,685,000), Manhattan ($3,625,000), Naples ($2,400,000), and San Francisco ($2,375,000).
• Markets with the Highest Sales Ratio: Howard County, MD (207.7%), Arlington & Alexandria (108.5%), Fairfax County, VA (108.0%), and Montgomery County, MD (88.1%).
1Sales Ratio defines market speed and market type: Buyer's < 15.5%; Balanced >= 15.5 to < 20.5%; Seller's >= 20.5% plus. If >100%, sales from previous month exceeds current inventory. 2The luxury threshold price is set by The Institute for Luxury Home Marketing.
Median List Price $929,320 $989,250 Median Sale Price $862,500 $862,500 Median SP/LP Ratio 98.38% 98.77% Total Sales Ratio 20.24% 17.55% Median Price per Sq. Ft. $498 $505 Total Inventory 16,359 22,351 New Listings 5,044 7,382 Total Sold 3,311 3,922 Median Days on Market 29 32 Average Home Size 1,914 1,904
Median prices represent properties priced above respective city benchmark prices.
February 2024 February 2023 February 2024 February 2023 ATTACHED HOMES MARKET SUMMARY
FEBRUARY 2024 ATTACHED HOMES New Listings 2,338 Total Sold 611 Med. Sale Price $0 Days on Market 3 Sales Ratio 2.69%
|
Median prices represent properties priced above respective city benchmark prices. Prices shown for Canadian cites are shown in Canadian Dollars. SINGLE FAMILY HOMES ATTACHED HOMES State Market Name List Price Sold Price DOM Ratio Market List Price Sold Price DOM Ratio Market AB Calgary $1,175,000 $938,500 14 63.7% Seller's $749,999 $667,000 14 34.7% Seller's AZ Chandler and Gilbert $1,099,500 $1,072,500 43 31.1% Seller's - - - -AZ Flagstaff $1,637,500 $1,230,000 122 19.7% Balanced - - - -AZ Mesa $899,000 $865,000 52 32.6% Seller's - - - -AZ Paradise Valley $5,990,000 $3,171,242 31 8.7% Buyer's - - - -AZ Phoenix $931,750 $819,750 47 29.3% Seller's - - - -AZ Scottsdale $2,200,000 $1,640,000 50 18.8% Balanced $899,990 $774,350 51 21.8% Seller's AZ Tucson $725,000 $650,000 27 23.7% Seller's - - - -BC Okanagan Valley $1,788,000 $1,420,000 89 3.4% Buyer's - - - -BC Vancouver $4,300,000 $3,287,500 14 7.4% Buyer's $1,899,000 $1,671,500 14 11.2% Buyer's BC Victoria $2,500,000 $1,950,000 25 15.9% Balanced $979,000 $926,500 20 31.4% Seller's BC Whistler $5,599,000 $3,050,000 58 3.4% Buyer's $2,472,500 $2,325,000 39 13.0% Balanced CA Central Coast $2,950,000 $2,550,000 38 12.7% Balanced $1,400,000 $1,165,000 11 35.1% Seller's CA East Bay $2,299,000 $1,959,500 9 105.1% Seller's $1,098,000 $1,144,000 7 85.3% Seller's CA Greater Palm Springs $1,988,800 $1,702,500 39 25.5% Seller's - - - -CA Lake Tahoe $2,999,000 $1,922,000 67 16.8% Balanced $1,675,000 $1,690,000 78 13.5% Balanced CA Los Angeles Beach Cities $5,995,000 $3,975,000 39 12.2% Balanced $1,995,000 $1,664,194 28 24.2% Seller's CA Los Angeles City $4,950,000 $3,425,000 24 12.4% Balanced $1,775,000 $1,399,000 31 12.1% Balanced CA Los Angeles The Valley $2,937,500 $2,112,500 38 25.1% Seller's $808,000 $800,000 24 49.6% Seller's CA Marin County $3,972,500 $2,887,500 38 21.6% Seller's $1,125,000 $940,000 94 4.8% Buyer's CA Napa County $3,450,000 $2,237,500 63 12.9% Balanced - - - -CA Orange County $3,375,000 $2,200,000 22 39.3% Seller's $1,299,050 $1,150,000 18 82.8% Seller's CA Placer County $1,270,000 $997,500 17 30.0% Seller's - - - -CA Sacramento $999,000 $925,000 16 40.5% Seller's - - - -CA San Diego $2,595,000 $1,960,000 11 45.7% Seller's $1,283,206 $1,100,000 10 56.8% Seller's CA San Francisco $4,546,500 $3,525,000 13 32.0% Seller's $2,800,000 $2,375,000 8 13.6% Balanced CA San Luis Obispo County $1,799,000 $1,450,000 44 31.4% Seller's - - - -CA Silicon Valley $4,491,500 $3,410,000 8 48.3% Seller's $1,700,000 $1,590,000 9 48.1% Seller's CA Sonoma County $2,592,500 $1,850,000 60 17.9% Balanced $807,390 $870,000 36 38.5% Seller's CA Ventura County $2,595,000 $1,775,000 45 23.8% Seller's $754,900 $754,500 46 36.0% Seller's CO Boulder $2,250,000 $1,604,048 46 25.4% Seller's $1,099,000 $819,000 36 24.7% Seller's CO Colorado Springs $969,999 $849,500 76 23.2% Seller's $584,500 $535,000 7 25.0% Seller's CO Denver $1,699,000 $1,357,500 24 25.9% Seller's $850,000 $790,000 9 26.5% Seller's CO Douglas County $1,299,999 $1,120,000 39 23.9% Seller's $602,500 $561,000 16 41.7% Seller's CO Durango $1,550,000 $1,485,000 184 6.4% Buyer's $839,000 $727,500 122 23.1% Seller's CO Summit County $3,237,500 $2,750,000 110 13.0% Balanced $1,164,000 $1,209,000 16 23.5% Seller's CO Telluride $7,400,000 $5,710,000 109 9.4% Buyer's $2,400,000 $1,545,000 80 29.3% Seller's CO Vail $7,450,000 $5,000,000 94 9.3% Buyer's $3,895,000 $3,685,000 25 25.3% Seller's
LUXURY MONTHLY MARKET
–
REVIEW –
Median prices represent properties priced above respective city benchmark prices. Prices shown for Canadian cites are shown in Canadian Dollars.
SINGLE FAMILY HOMES ATTACHED HOMES State Market Name List Price Sold Price DOM Ratio Market List Price Sold Price DOM Ratio Market CT Central Connecticut $689,900 $632,500 28 35.8% Seller's - - - -CT Coastal Connecticut $2,475,000 $1,840,000 40 16.6% Balanced $1,180,000 $680,000 50 29.5% Seller's DC Washington D.C. $4,500,000 $3,200,000 71 25.6% Seller's $1,900,000 $1,647,500 17 18.4% Balanced DE Sussex County Coastal $1,595,000 $1,397,500 30 21.1% Seller's $1,012,500 $815,000 44 15.4% Balanced FL Boca Raton/Delray Beach $2,895,000 $1,950,000 58 10.7% Buyer's $1,050,000 $855,000 64 11.4% Buyer's FL Brevard County $829,900 $783,372 24 18.5% Balanced $715,000 $690,000 120 10.4% Buyer's FL Broward County $1,750,000 $1,500,000 60 10.0% Buyer's $699,700 $575,000 37 7.2% Buyer's FL Coastal Pinellas County West $2,097,000 $1,975,000 66 10.6% Buyer's $1,199,999 $1,192,500 30 15.5% Balanced FL Ft. Lauderdale $5,495,000 $3,275,000 109 5.5% Buyer's $2,495,000 $2,087,500 96 6.6% Buyer's FL Jacksonville Beaches $1,300,000 $1,185,000 34 18.1% Balanced $1,015,000 $963,500 15 16.4% Balanced FL Lee County $1,406,000 $1,300,000 54 7.9% Buyer's $849,000 $760,000 42 7.6% Buyer's FL Marco Island $2,900,000 $2,650,000 111 8.2% Buyer's $1,699,000 $1,600,000 69 10.9% Buyer's FL Miami $2,100,000 $1,394,000 82 8.5% Buyer's $1,539,900 $1,250,000 110 5.0% Buyer's FL Naples $5,300,000 $4,175,000 66 5.9% Buyer's $2,399,000 $2,400,000 41 6.9% Buyer's FL Orlando $1,290,000 $1,200,000 33 14.6% Balanced $565,000 $565,000 36 12.9% Balanced FL Palm Beach Towns $4,497,000 $2,750,000 65 7.3% Buyer's $2,125,000 $1,400,000 46 6.1% Buyer's FL Sarasota & Beaches $2,550,000 $2,100,000 41 6.7% Buyer's $1,687,000 $1,650,000 13 7.8% Buyer's FL South Pinellas County $1,549,999 $1,300,000 45 12.7% Balanced $1,000,000 $938,000 40 15.9% Balanced FL South Walton $2,562,500 $2,073,350 41 8.3% Buyer's $1,295,000 $1,143,750 29 7.5% Buyer's FL Tampa $750,000 $695,500 41 25.3% Seller's $899,500 $660,000 23 17.7% Balanced GA Atlanta $1,650,000 $1,275,000 19 16.8% Balanced $720,000 $670,000 32 19.3% Balanced GA Duluth $1,579,000 $1,178,250 6 13.3% Balanced - - - -HI Island of Hawaii $1,999,500 $1,738,500 34 18.4% Balanced $1,717,500 $1,597,500 8 30.8% Seller's HI Kauai $3,175,000 $3,200,000 14 15.8% Balanced $1,584,500 $1,400,000 33 25.0% Seller's HI Maui $3,882,000 $2,049,608 108 13.1% Balanced $1,995,000 $1,595,000 63 8.7% Buyer's HI Oahu $3,100,000 $2,470,000 19 15.1% Balanced $1,225,000 $969,000 24 13.7% Balanced IA Greater Des Moines $650,000 $639,288 79 10.5% Buyer's - - - -ID Ada County $796,950 $739,900 26 36.7% Seller's $599,900 $650,000 85 8.3% Buyer's ID Northern Idaho $1,750,000 $1,493,000 141 9.8% Buyer's - - - -IL Chicago $1,679,000 $1,270,000 50 25.0% Seller's $1,264,000 $910,000 67 14.4% Balanced IL DuPage County $1,305,338 $937,500 39 23.7% Seller's $750,000 $1,042,500 68 19.0% Balanced IL Lake County $1,339,041 $1,049,000 36 31.1% Seller's - - - -IL Will County $695,950 $631,575 48 31.5% Seller's - - - -IN Hamilton County $850,000 $700,000 8 50.3% Seller's - - - -KS Johnson County $829,250 $800,000 10 17.0% Balanced $634,720 $701,478 105 8.6% Buyer's MA Cape Cod $2,399,000 $1,590,000 47 13.4% Balanced $999,500 $821,000 73 7.3% Buyer's MA Greater Boston $3,869,000 $2,787,000 47 14.9% Balanced $2,597,000 $1,989,900 43 9.9% Buyer's MA South Shore $1,936,650 $1,275,000 28 16.4% Balanced $840,000 $811,250 34 26.1% Seller's
– LUXURY MONTHLY MARKET REVIEW –
Median prices represent properties priced above respective city benchmark prices. Prices shown for Canadian cites are shown in Canadian Dollars.
SINGLE FAMILY HOMES ATTACHED HOMES State Market Name List Price Sold Price DOM Ratio Market List Price Sold Price DOM Ratio Market MD Anne Arundel County $1,150,000 $974,000 19 51.3% Seller's $606,190 $554,090 6 72.7% Seller's MD Baltimore City $949,000 $1,050,000 45 23.8% Seller's $689,500 $575,000 41 20.6% Balanced MD Baltimore County $1,189,999 $885,000 13 20.7% Balanced $607,985 $556,310 5 36.0% Seller's MD Frederick County $898,999 $835,000 10 34.3% Seller's - - - -MD Howard County $1,199,995 $1,075,000 5 39.1% Seller's $739,990 $620,000 5 207.7% Seller's MD Montgomery County $2,097,500 $1,652,500 7 35.0% Seller's $973,743 $810,000 6 88.1% Seller's MD Talbot County $3,045,000 $1,580,000 17 12.5% Balanced - - - -MD Worcester County $950,000 $755,000 9 17.6% Balanced $634,250 $640,000 54 14.7% Balanced MI Grand Traverse $1,275,000 $1,520,000 17 13.4% Balanced - - - -MI Livingston County $735,000 $689,000 19 17.5% Balanced - - - -MI Monroe County $699,500 $500,000 63 13.6% Balanced - - - -MI Oakland County $849,999 $635,500 17 35.6% Seller's $689,000 $569,000 34 22.2% Seller's MI Washtenaw County $930,000 $750,000 35 20.0% Balanced $672,000 $762,000 68 6.5% Buyer's MI Wayne County $762,000 $593,750 14 33.3% Seller's $712,500 $650,000 25 15.7% Balanced MN Olmsted County $962,500 $815,000 60 15.3% Balanced - - - -MN Twin Cities $1,250,000 $999,999 38 13.8% Balanced - - - -MO Kansas City $699,950 $665,750 33 19.6% Balanced - - - -MO St. Louis $725,000 $705,000 16 71.2% Seller's - - - -NC Asheville $1,085,000 $801,000 44 20.3% Balanced $720,000 $660,000 29 18.8% Balanced NC Charlotte $1,350,000 $930,500 6 50.7% Seller's $656,950 $622,333 33 46.2% Seller's NC Lake Norman $1,349,000 $1,057,500 28 28.7% Seller's $599,900 $577,400 86 57.9% Seller's NC Raleigh-Durham $1,325,000 $950,000 2 31.5% Seller's - - - -NH Rockingham County $1,399,000 $1,300,000 6 28.8% Seller's $887,950 $1,107,000 7 35.0% Seller's NJ Bergen County $2,614,000 $1,887,500 42 15.2% Balanced $1,257,965 $1,126,409 40 20.5% Balanced NJ Morris County $1,768,000 $1,350,000 16 22.1% Seller's $782,000 $660,000 15 44.6% Seller's NJ Ocean County $1,125,000 $859,950 44 19.9% Balanced $975,000 $729,900 71 18.6% Balanced NM Taos $1,412,500 $1,132,500 128 6.5% Buyer's - - - -NV Lake Tahoe $5,598,000 $3,475,000 248 14.3% Balanced $1,207,500 $1,207,500 128 12.5% Balanced NV Las Vegas $1,836,900 $1,405,000 44 21.1% Seller's - - - -NV Reno $2,610,000 $1,732,500 122 25.0% Seller's - - - -NY Finger Lakes - - - - - - - - -NY Manhattan - - - - - $4,895,000 $3,625,000 92 5.8% Buyer's NY Nassau County $1,888,000 $1,510,000 41 17.9% Balanced $1,565,000 $1,312,500 48 11.1% Buyer's NY Staten Island $1,162,500 $1,276,500 53 12.7% Balanced $645,000 $620,000 51 15.7% Balanced NY Suffolk County $1,995,000 $1,200,000 62 12.3% Balanced $755,000 $680,000 46 24.6% Seller's NY Westchester County $2,249,000 $1,525,180 26 24.5% Seller's - - - -OH Cincinnati $884,950 $705,000 12 23.8% Seller's - - - -OH Cleveland Suburbs $899,900 $653,850 32 20.0% Balanced - - - - -
– LUXURY MONTHLY MARKET REVIEW –
–LUXURY MONTHLY MARKET REVIEW –
Median prices represent properties priced above respective city benchmark prices. Prices shown for Canadian cites are shown in Canadian Dollars.
SINGLE FAMILY HOMES ATTACHED HOMES State Market Name List Price Sold Price DOM Ratio Market List Price Sold Price DOM Ratio Market OH Columbus $874,900 $722,611 15 33.6% Seller's $690,000 $645,318 96 21.1% Seller's ON GTA - Durham $1,905,900 $1,516,000 12 26.8% Seller's $849,950 $833,400 24 36.7% Seller's ON GTA - York $2,636,500 $1,875,000 10 45.7% Seller's $809,000 $797,500 23 32.6% Seller's ON Hamilton $1,891,950 $1,737,500 31 9.4% Buyer's $954,900 $875,500 12 29.7% Seller's ON Mississauga $3,188,944 $2,255,000 8 15.7% Balanced $999,990 $932,500 11 35.7% Seller's ON Oakville $3,250,000 $2,365,000 17 37.8% Seller's $1,249,500 $990,250 27 37.5% Seller's ON Toronto $3,895,000 $3,097,500 8 21.5% Seller's $1,235,000 $1,150,000 16 21.5% Seller's ON Waterloo Region $1,449,444 $1,294,950 21 28.7% Seller's $850,000 $700,000 23 20.0% Balanced OR Portland $1,380,000 $1,137,500 27 18.9% Balanced $695,000 $657,000 31 12.7% Balanced SC Charleston $1,850,000 $1,350,000 27 25.0% Seller's $1,225,000 $877,000 26 29.9% Seller's SC Hilton Head $2,100,000 $1,675,000 32 18.7% Balanced $1,175,000 $900,000 14 53.8% Seller's TN Greater Chattanooga $910,000 $1,002,500 8 13.7% Balanced - - - -TN Knoxville $909,900 $851,500 24 38.0% Seller's - - - -TN Nashville $1,850,000 $1,442,000 11 20.8% Balanced $724,900 $699,900 53 17.7% Balanced TX Austin $1,299,000 $970,000 63 17.5% Balanced $839,000 $799,362 73 10.0% Buyer's TX Collin County $739,990 $700,000 32 32.6% Seller's - - - -TX Dallas $1,398,000 $1,115,000 20 28.7% Seller's $715,000 $645,000 18 17.4% Balanced TX Denton County $798,880 $758,000 46 24.0% Seller's - - - -TX El Paso $625,000 $575,914 43 16.7% Balanced - - - -TX Fort Worth $850,000 $822,500 48 24.0% Seller's - - - -TX Greater Tyler $679,900 $659,000 67 7.1% Buyer's - - - -TX Houston $989,000 $900,000 30 20.2% Balanced $617,500 $609,500 26 17.3% Balanced TX Lubbock $700,000 $605,000 147 24.6% Seller's - - - -TX San Angelo $624,950 $642,735 87 13.2% Balanced - - - -TX San Antonio $799,000 $750,000 76 12.6% Balanced $694,900 $750,000 72 5.9% Buyer's TX The Woodlands & Spring $847,000 $707,500 30 28.6% Seller's - - - -UT Park City $4,900,000 $4,375,000 148 15.4% Balanced $2,175,000 $2,285,700 46 19.0% Balanced UT Salt Lake City $1,319,900 $965,000 54 30.9% Seller's $617,000 $587,500 41 23.9% Seller's UT Washington County $1,499,950 $1,333,750 42 8.8% Buyer's - - - -VA Arlington & Alexandria $2,285,000 $1,820,000 7 35.4% Seller's $1,100,000 $990,000 6 108.5% Seller's VA Fairfax County $2,299,900 $1,530,000 6 33.7% Seller's $788,637 $725,000 5 108.0% Seller's VA McLean & Vienna $2,999,950 $1,925,000 14 22.0% Seller's $1,399,999 $920,012 3 84.6% Seller's VA Richmond $799,963 $799,990 11 32.7% Seller's $592,380 $557,143 14 31.8% Seller's VA Smith Mountain Lake $1,500,000 $1,325,000 57 17.1% Balanced - - - -WA King County $2,179,900 $1,692,500 6 61.8% Seller's $1,250,000 $1,125,000 12 44.2% Seller's WA Seattle $2,196,500 $1,650,000 6 66.0% Seller's $1,495,000 $1,329,000 18 28.2% Seller's WA Spokane $1,124,848 $1,010,000 88 7.6% Buyer's - - - - -
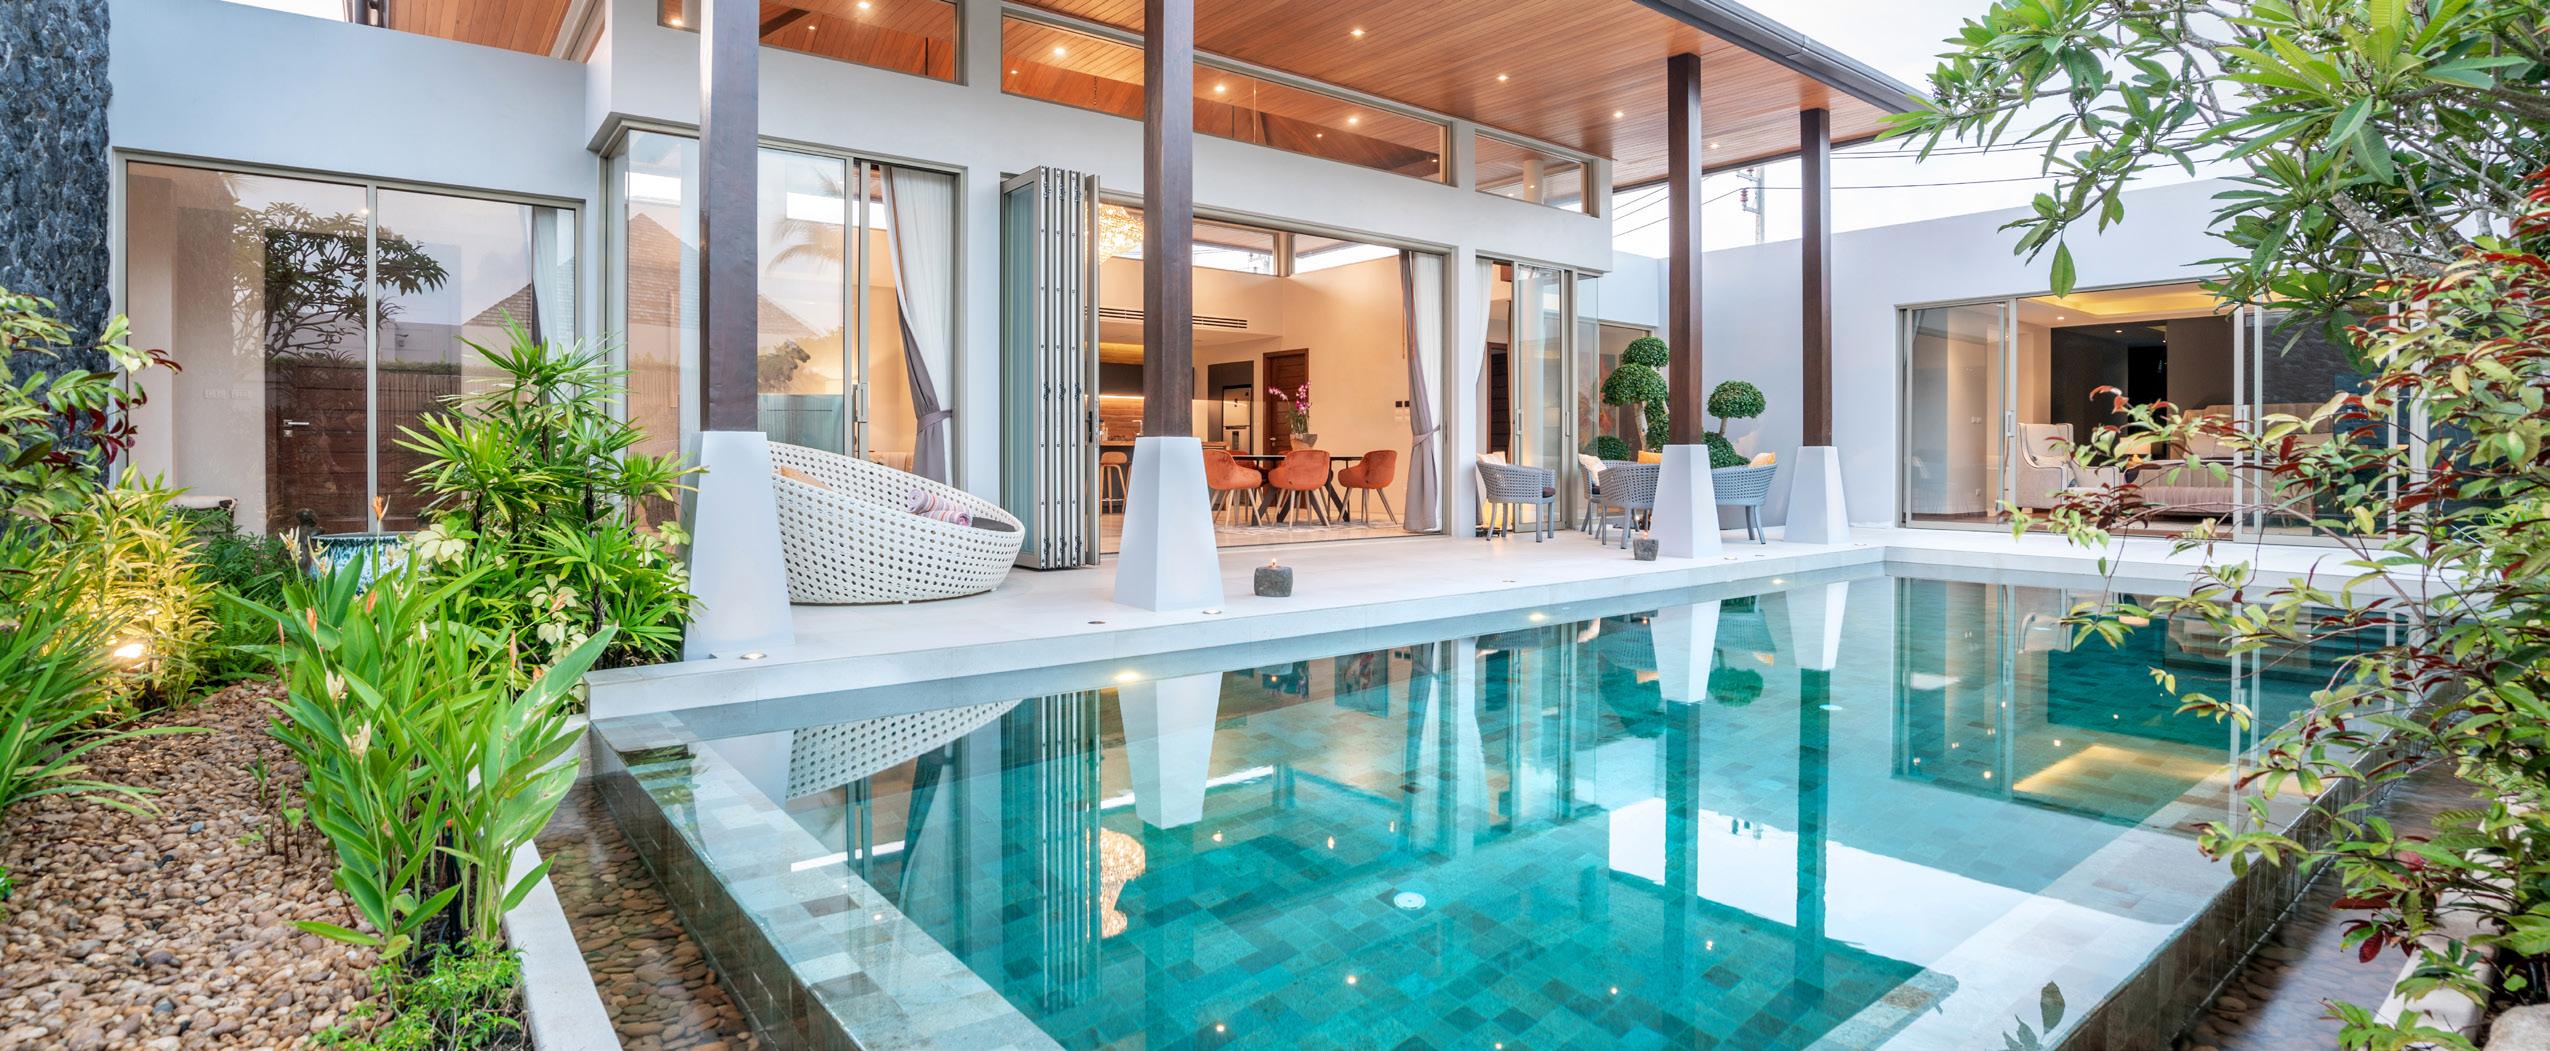
Luxury is in each detail.
Hubert de Givenchy
LOS ANGELES THE VALLEY CALIFORNIA
2024 MARCH
Square Feet3 -RangePrice -Median SoldBeds -Median SoldBaths -Median SoldSold -TotalInventory -TotalSales Ratio -Sold/Inventory0 - 2,999 $1,760,000 4 3 59 138 43% 3,000 - 3,999 $2,275,000 5 4 39 138 28% 4,000 - 4,999 $2,692,500 5 5 20 94 21% 5,000 - 5,999 $3,175,000 5 6 5 68 7% 6,000 - 6,999 $4,300,000 5 6 8 31 26% 7,000+ $5,925,000 6 7 7 79 9% LA - THE VALLEY SINGLE - FAMILY HOMES 1 The luxury threshold price is set by The Institute for Luxury Home Marketing. 2Sales Ratio defines market speed and market type: Buyer's < 12%; Balanced >= 12 to < 21%; Seller's >= 21%. If >100% MLS® data reported previous month’s sales exceeded current inventory. 6 8 14 23 24 33 52 48 47 80 93 55 25 25 17 1 0 0 1 1 4 7 5 17 14 25 17 12 16 18 $20,000,000+ $15,000,000 - $19,999,999 $10,000,000 - $14,999,999 $7,000,000 - $9,999,999 $6,000,000 - $6,999,999 $5,000,000 - $5,999,999 $4,000,000 - $4,999,999 $3,500,000 - $3,999,999 $3,000,000 - $3,499,999 $2,500,000 - $2,999,999 $2,000,000 - $2,499,999 $1,800,000 - $1,999,999 $1,700,000 - $1,799,999
- $1,699,999
- $1,599,999 Inventory Sales
INVENTORY VS. SALES | FEBRUARY 2024
Market Total Inventory: 550 Total Sales: 138 Total Sales Ratio2 : 25% Luxury Benchmark Price 1: $1,550,000
$1,600,000
$1,550,000
LUXURY
Seller's
•
•
•
•
3
4
in February 2023.
MEDIAN DATA REVIEW | FEBRUARY 13 - MONTH LUXURY MARKET TREND 4 Solds Median Sales Price Inventory 459 435 507 534 585 614 592 612 676 630 476 564 550 89 161 146 204 209 168 184 150 140 135 115 128 138 $2,300,000 $2,175,000 $2,082,500 $1,989,500 $2,200,000 $2,050,000 $2,075,000 $2,134,940 $2,302,500 $2,110,000 $2,100,000 $2,037,500 $2,112,500 Feb-23 Mar-23 Apr-23 May-23 Jun-23 Jul-23 Aug-23 Sep-23 Oct-23 Nov-23 Dec-23 Jan-24 Feb-24
Square foot table does not account for listings and solds where square foot data is not disclosed.
Data reported includes Active and Sold properties and does not include Pending properties.
The single-family luxury market is a Seller's Market with a 25% Sales Ratio.
Homes sold for a median of 98.78% of list price in February 2024.
•
The most active price band is $1,550,000-$1,599,999, where the sales ratio is 106%
The median luxury sales price for single-family homes is $2,112,500.
The median days on market for February 2024 was 38 days, down from 40
-
SINGLE - FAMILY HOMES LA - THE VALLEY MARKET SUMMARY | FEBRUARY 2024 VARIANCE: 20 % 459 550 Feb. 2023 Feb. 2024 TOTAL INVENTORY VARIANCE: 55 % 89 138 TOTAL SOLDS VARIANCE: - 8 % $2.30m $2.11m SALES PRICE VARIANCE: - 5 % 40 38 DAYS ON MARKET VARIANCE: 1 % 97.37% 98.78% SALE TO LIST PRICE RATIO VARIANCE: 4 % $717 $748 SALE PRICE PER SQFT. Feb. 2023 Feb. 2024 Feb. 2023 Feb. 2024 Feb. 2023 Feb. 2024 Feb. 2023 Feb. 2024 Feb. 2023 Feb. 2024 Luxury Benchmark Price 1: $1,550,000
LA
THE VALLEY
$710,000
$700,000
- THE VALLEY
Square Feet3 -RangePrice -Median SoldBeds -Median SoldBaths -Median SoldSold -TotalInventory -TotalSales Ratio -Sold/Inventory0 - 1,499 $770,500 2 2 32 38 84% 1,500 - 1,749 $800,000 3 3 19 42 45% 1,750 - 1,999 $1,025,000 3 3 7 34 21% 2,000 - 2,249 $865,000 2 2 5 12 42% 2,250 - 2,499 $775,000 3 3 1 3 33% 2,500+ $1,175,000 3 3 3 6 50% 14 8 4 8 6 12 13 3 11 11 27 5 5 5 3 4 1 2 5 5 6 6 7 6 6 6 4 3 5 1 $1,150,000+ $1,080,000 - $1,149,999 $1,020,000 - $1,079,999 $960,000 - $1,019,999 $900,000 - $959,999 $860,000 - $899,999 $820,000 - $859,999 $800,000 - $819,999 $780,000 - $799,999 $760,000 - $779,999 $740,000 - $759,999 $730,000 - $739,999
- $729,999
LA
ATTACHED HOMES
$720,000
- $719,999
- $709,999 LUXURY INVENTORY VS. SALES | FEBRUARY 2024 Inventory Sales Luxury Benchmark Price 1: $700,000 Seller's Market Total Inventory: 135 Total Sales: 67 Total Sales Ratio2 : 50% 1 The luxury threshold price is set by The Institute for Luxury Home Marketing. 2Sales Ratio defines market speed and market type: Buyer's < 12%; Balanced >= 12 to < 21%; Seller's >= 21%. If >100% MLS® data reported previous month’s sales exceeded current inventory.
96 107 90 92 82 100 126 117 137 109 86 116 135 53 67 72 89 92 88 72 71 68 53 53 53 67 $786,000 $802,375 $806,000 $800,000 $790,500 $786,694 $810,000 $820,000 $807,500 $830,000 $800,000 $790,000 $800,000 Feb-23 Mar-23 Apr-23 May-23 Jun-23 Jul-23 Aug-23 Sep-23 Oct-23 Nov-23 Dec-23 Jan-24 Feb-24 3Square foot table does not account for listings and solds where square foot data is not disclosed. 4Data reported includes Active and Sold properties and does not include Pending properties. VARIANCE: 41 % 96 135 VARIANCE: 26 % 53 67 VARIANCE: 2 % $786k $800k SALES PRICE VARIANCE: - 8 % 26 24 DAYS ON MARKET VARIANCE: 0 % 100.00% 100.14% SALE TO LIST PRICE RATIO VARIANCE: 14 % $486 $553 SALE PRICE PER SQFT. LA - THE VALLEY MARKET SUMMARY | FEBRUARY 2024 LA - THE VALLEY ATTACHED HOMES • The attached luxury market is a Seller's Market with a 50% Sales Ratio. • Homes sold for a median of 100.14% of list price in February 2024. • The most active price band is $800,000-$819,999, where the sales ratio is 233% • The median luxury sales price for attached homes is $800,000. • The median days on market for February 2024 was 24 days, down from 26 in February 2023. Feb. 2023 Feb. 2024 Feb. 2023 Feb. 2024 Feb. 2023 Feb. 2024 Feb. 2023 Feb. 2024 Feb. 2023 Feb. 2024 Feb. 2023 Feb. 2024 MEDIAN DATA REVIEW | FEBRUARY TOTAL INVENTORY TOTAL SOLDS Luxury Benchmark Price 1: $700,000 13 - MONTH LUXURY MARKET TREND 4 Solds Median Sales Price Inventory
LOS ANGELES BEACH CITIES CALIFORNIA
2024 MARCH
Square Feet3 -RangePrice -Median SoldBeds -Median SoldBaths -Median SoldSold -TotalInventory -TotalSales Ratio -Sold/Inventory0 - 1,999 $3,168,250 3 2 10 45 22% 2,000 - 2,999 $3,214,913 4 3 12 59 20% 3,000 - 3,999 $4,335,000 5 4 12 101 12% 4,000 - 4,999 $5,000,000 5 5 7 63 11% 5,000 - 5,999 $7,550,000 5 6 1 30 3% 6,000+ $8,750,000 6 7 2 77 3% LA - BEACH CITIES SINGLE - FAMILY HOMES 1 The luxury threshold price is set by The Institute for Luxury Home Marketing. 2Sales Ratio defines market speed and market type: Buyer's < 12%; Balanced >= 12 to < 21%; Seller's >= 21%. If >100% MLS® data reported previous month’s sales exceeded current inventory. 6 14 23 14 10 13 14 38 21 31 37 57 34 41 33 0 0 0 1 1 2 0 1 3 1 7 7 6 8 10 $50,000,000+ $30,000,000 - $49,999,999 $20,000,000 - $29,999,999 $16,000,000 - $19,999,999 $14,000,000 - $15,999,999 $12,000,000 - $13,999,999 $10,000,000 - $11,999,999 $8,000,000 - $9,999,999 $7,000,000 - $7,999,999 $6,000,000 - $6,999,999 $5,000,000 - $5,999,999 $4,000,000 - $4,999,999 $3,500,000 - $3,999,999
- $3,499,999
$2,999,999 Inventory Sales
INVENTORY
Balanced Market Total Inventory: 386 Total Sales: 47 Total Sales Ratio2 : 12% Luxury Benchmark Price 1: $2,500,000
$3,000,000
$2,500,000 -
LUXURY
VS. SALES | FEBRUARY 2024
MEDIAN DATA REVIEW | FEBRUARY 13 - MONTH LUXURY MARKET TREND 4 Solds Median Sales Price Inventory 309 329 346 363 365 395 382 400 422 399 295 345 386 40 79 66 59 79 65 78 73 57 55 48 46 47 $5,902,500 $4,300,000 $4,263,250 $4,184,700 $3,635,000 $3,550,000 $4,608,500 $3,915,000 $3,900,000 $4,200,000 $3,850,500 $4,325,000 $3,975,000 Feb-23 Mar-23 Apr-23 May-23 Jun-23 Jul-23 Aug-23 Sep-23 Oct-23 Nov-23 Dec-23 Jan-24 Feb-24
Square foot table does not account for listings and solds where square foot data is not disclosed.
Data reported includes Active and Sold properties and does not include Pending properties.
The single-family luxury market is a Balanced Market with a 12% Sales Ratio.
Homes sold for a median of 96.49% of list price in February 2024.
The most active price band is $2,500,000-$2,999,999, where the sales ratio is 30%
The median luxury sales price for single-family homes is $3,975,000.
The median days on market for February 2024 was 39 days, up from 20 in February 2023. LA - BEACH CITIES SINGLE - FAMILY HOMES LA - BEACH CITIES MARKET SUMMARY | FEBRUARY 2024 VARIANCE: 25 % 309 386 Feb. 2023 Feb. 2024 TOTAL INVENTORY VARIANCE: 18 % 40 47 TOTAL SOLDS VARIANCE: - 33 % $5.90m $3.98m SALES PRICE VARIANCE: 95 % 20 39 DAYS ON MARKET VARIANCE: - 1 % 97.02% 96.49% SALE TO LIST PRICE RATIO VARIANCE: 1 % $1,373 $1,389 SALE PRICE PER SQFT. Feb. 2023 Feb. 2024 Feb. 2023 Feb. 2024 Feb. 2023 Feb. 2024 Feb. 2023 Feb. 2024 Feb. 2023 Feb. 2024 Luxury Benchmark Price 1: $2,500,000
3
4
•
•
•
•
•
- BEACH CITIES
HOMES Square Feet3 -RangePrice -Median SoldBeds -Median SoldBaths -Median SoldSold -TotalInventory -TotalSales Ratio -Sold/Inventory0 - 999 $1,300,000 1 1 1 3 33% 1,000 - 1,499 $1,500,000 2 3 10 35 29% 1,500 - 1,999 $1,699,000 3 3 11 54 20% 2,000 - 2,499 $1,700,000 3 3 15 36 42% 2,500 - 2,999 $2,517,500 4 4 2 21 10% 3,000+ $3,200,000 5 6 1 15 7% 11 14 12 9 9 21 15 24 13 9 10 3 5 3 7 0 0 3 1 1 3 3 6 6 0 5 3 2 4 3 $4,550,000+ $3,750,000 - $4,549,999 $3,150,000 - $3,749,999 $2,750,000 - $3,149,999 $2,350,000 - $2,749,999 $2,150,000 - $2,349,999 $1,950,000 - $2,149,999 $1,750,000 - $1,949,999 $1,650,000 - $1,749,999 $1,550,000 - $1,649,999 $1,450,000 - $1,549,999 $1,400,000 - $1,449,999 $1,350,000 - $1,399,999 $1,300,000 - $1,349,999 $1,260,000 - $1,299,999 LUXURY INVENTORY VS. SALES | FEBRUARY 2024 Inventory Sales Luxury Benchmark Price 1: $1,260,000 Seller's Market Total Inventory: 165 Total Sales: 40 Total Sales Ratio2 : 24% 1 The luxury threshold price is set by The Institute for Luxury Home Marketing. 2Sales Ratio defines market speed and market type: Buyer's < 12%; Balanced >= 12 to < 21%; Seller's >= 21%. If >100% MLS® data reported previous month’s sales exceeded current inventory.
LA
ATTACHED
122 132 124 122 136 157 141 169 175 153 115 146 165 37 42 41 75 59 43 70 47 53 49 40 34 40 $1,500,680 $1,730,000 $1,735,000 $1,610,000 $1,700,000 $1,650,000 $1,605,000 $1,600,000 $1,599,000 $1,665,000 $1,576,000 $1,700,000 $1,664,194 Feb-23 Mar-23 Apr-23 May-23 Jun-23 Jul-23 Aug-23 Sep-23 Oct-23 Nov-23 Dec-23 Jan-24 Feb-24 3Square foot table does not account for listings and solds where square foot data is not disclosed. 4Data reported includes Active and Sold properties and does not include Pending properties. VARIANCE: 35 % 122 165 VARIANCE: 8 % 37 40 VARIANCE: 11 % $1.50m $1.66m SALES PRICE VARIANCE: - 20 % 35 28 DAYS ON MARKET VARIANCE: 0 % 98.66% 98.96% SALE TO LIST PRICE RATIO VARIANCE: 1 % $890 $895 SALE PRICE PER SQFT. LA - BEACH CITIES MARKET SUMMARY | FEBRUARY 2024 LA - BEACH CITIES ATTACHED HOMES • The attached luxury market is a Seller's Market with a 24% Sales Ratio. • Homes sold for a median of 98.96% of list price in February 2024. • The most active price band is $1,300,000-$1,349,999, where the sales ratio is 133% • The median luxury sales price for attached homes is $1,664,194. • The median days on market for February 2024 was 28 days, down from 35 in February 2023. Feb. 2023 Feb. 2024 Feb. 2023 Feb. 2024 Feb. 2023 Feb. 2024 Feb. 2023 Feb. 2024 Feb. 2023 Feb. 2024 Feb. 2023 Feb. 2024 MEDIAN DATA REVIEW | FEBRUARY TOTAL INVENTORY TOTAL SOLDS Luxury Benchmark Price 1: $1,260,000 13 - MONTH LUXURY MARKET TREND 4 Solds Median Sales Price Inventory
- Franco Martinez
FRANCO MARTINEZ 310.846.1117 | franco.martinez@exprealty.com | www.francomartinez.realtor
you
For more information
and the services
your luxury property, please give
at 310.846.1117.
Thank
for taking time to view this report.
about this report
I can offer you and
me a call