
FRANCO MARTINEZ LUXURY MARKET REPORT LA V ALLEY & LA BEA CHES APRIL 202 4

FRANCO MARTINEZ
Real Estate Professional
DRE# 02195656
310.846.1117
franco.martinez@exprealty.com
www.francomartinez.realtor
Meet Franco Martinez, your premier luxury new construction home real estate expert proudly serving the community of San Pedro. With a wealth of knowledge and expertise, Franco’s steadfast commitment and service truly sets him apart in the competitive real estate market.
Franco has earned the esteemed Green Designation from the National Association of REALTORS®. This prestigious certification underlines his ability to guide home buyers in creating a healthier, greener home. It provides sellers with strategic solutions to enhance the energy-efficiency of their homes, ultimately increasing their market value.
He offers valuable insights into new luxury homes, particularly within gated communities. Franco’s professional affiliations are a testament to his dedication and competence in the real estate field. As a member of the Institute for Luxury Home Marketing and the Residential Real Estate Council, he is committed to the highest standards of professionalism. Furthermore, as a real estate professional with exp realty, he specializes in new home construction, further expanding his comprehensive suite of services.
Holding certifications as a Green Real Estate Professional, Pricing Strategy Advisor, New Home Construction Specialist, and Certified Luxury Home Expert, Franco is more than equipped to help you navigate the complex process of buying or selling a home. With Franco, you can be confident that you receive the best service where luxury meets sustainability.


TABLE OF CONTENTS
PAGE 4 LUXURY REPORT EXPLAINED
PAGE 5 WELCOME MESSAGE
PAGE 6-9 NORTH AMERICAN LUXURY MARKET REVIEW
PAGE 10 13-MONTH MARKET TRENDS
PAGE 11 SINGLE-FAMILY HOMES MONTHLY OVERVIEW
PAGE 12 ATTACHED HOMES MONTHLY OVERVIEW
PAGE 13-16 MONTHLY STATISTICS BY CITY
PAGE 18 LOS ANGELES VALLEY LUXURY MARKET REVIEW
PAGE 23 LOS ANGELES BEACHES LUXURY MARKET REVIEW
PAGE 28 THANK YOU


LUXURY REPORT EXPLAINED –
The Institute for Luxury Home Marketing has analyzed a number of metrics — including sales prices, sales volumes, number of sales, sales-price-to-list-price ratios, days on market and price-per-square-foot – to provide you a comprehensive North American Luxury Market report.
Additionally, we have further examined all of the individual luxury markets to provide both an overview and an in-depth analysis - including, where data is sufficient, a breakdown by luxury single-family homes and luxury attached homes.
It is our intention to include additional luxury markets on a continual basis. If your market is not featured, please contact us so we can implement the necessary qualification process. More in-depth reports on the luxury communities in your market are available as well.
Looking through this report, you will notice three distinct market statuses, Buyer's Market, Seller's Market, and Balanced Market. A Buyer's Market indicates that buyers have greater control over the price point. This market type is demonstrated by a substantial number of homes on the market and few sales, suggesting demand for residential properties is slow for that market and/or price point.
By contrast, a Seller's Market gives sellers greater control over the price point. Typically, this means there are few homes on the market and a generous demand, causing competition between buyers who ultimately drive sales prices higher.
A Balanced Market indicates that neither the buyers nor the sellers control the price point at which that property will sell and that there is neither a glut nor a lack of inventory. Typically, this type of market sees a stabilization of both the list and sold price, the length of time the property is on the market as well as the expectancy amongst homeowners in their respective communities – so long as their home is priced in accordance with the current market value.
REPORT
GLOSSARY
REMAINING INVENTORY: The total number of homes available at the close of a month.
DAYS ON MARKET: Measures the number of days a home is available on the market before a purchase offer is accepted.
LUXURY BENCHMARK PRICE: The price point that marks the transition from traditional homes to luxury homes.
NEW LISTINGS: The number of homes that entered the market during the current month.
PRICE PER SQUARE FOOT: Measures the dollar amount of the home's price for an individual square foot.
SALES RATIO: Sales Ratio defines market speed and determines whether the market currently favors buyers or sellers. A Buyer's Market has a Sales Ratio of less than 12%; a Balanced Market has a ratio of 12% up to 21%; a Seller's Market has a ratio of 21% or higher. A Sales Ratio greater than 100% indicates the number of sold listings exceeds the number of listings available at the end of the month.
SP/LP RATIO: The Sales Price/List Price Ratio compares the value of the sold price to the value of the list price.
–
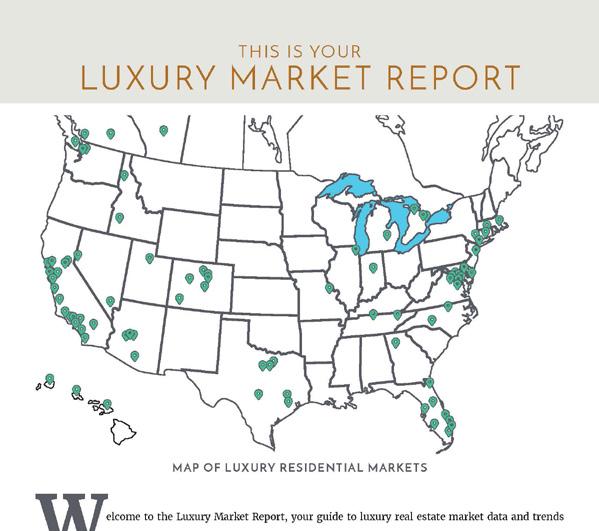
THIS IS YOUR LUXURY MARKET REPORT
MAP OF LUXURY RESIDENTIAL MARKETS
Welcome to the Luxury Market Report, your guide to luxury real estate market data and trends for North America. Produced monthly by The Institute for Luxury Home Marketing, this report provides an in-depth look at the top residential markets across the United States and Canada. Within the individual markets, you will find established luxury benchmark prices and detailed survey of luxury active and sold properties designed to showcase current market status and recent trends. The national report illustrates a compilation of the top North American markets to review overall standards and trends.
Copyright © 2023 Institute for Luxury Home Marketing | www.luxuryhomemarketing.com | 214.485.3000
The Luxury Market Report is a monthly analysis provided by The Institute for Luxury Home Marketing. Luxury benchmark prices are determined by The Institute. This active and sold data has been provided by REAL Marketing, who has compiled the data through various sources, including local MLS boards, local tax records and Realtor.com. Data is deemed reliable to the best of our knowledge, but is not guaranteed.
NORTH AMERICAN LUXURY REVIEW
A Stronger but Variable Spring Market
March, often heralded as the commencement of the spring market, not only marks the awakening of nature but also provides insights into the trajectory of the real estate landscape for the ensuing months.
After six months of steadily increasing levels of inventory and sales, March’s statistics also tell a story of continued strength. Positive seller sentiment is reflected in the uptick of new properties entering the market, which in turn, is fueling the opportunity for buyers to fulfill their new home expectations.
In the luxury single-family market, inventory levels grew by 24.1% compared to March 2023, and by 5.8% compared to February 2024. New inventory entering the market also comparatively increased by 18.7% and 9.4%, respectively.
In the luxury attached property, market inventory levels grew by 37.7% compared to March 2023, although fell by 5.1% compared to February 2024. Comparatively, new inventory entering the market increased by 20.8% but fell by 3.8%, respectively.
Although inventory has increased annually for both single-family and attached properties, it still needs to be recognized that active listings remain approximately 40% lower than pre-pandemic levels.
Sales, on the other hand, have increased both year-over-year and month-over-month. Sales of luxury single-family homes grew by 7.5% compared to March 2023, but more significantly by 31.1% compared to February 2024. Sales of luxury attached properties grew by 6.3% compared to March 2023, but again more significantly by 25.7% compared to February 2024.
This higher demand for luxury properties also saw homes close quicker during March, selling nine days faster than in February 2024 for single-family homes and ten days faster for attached properties.
Overall, the market is showing that it has become more favorable to sellers, with the sales ratio for
single-family homes at 27.4% and 23.2% for attached properties. This is a change from the last few months, which saw the trend move towards a more balanced market.
Typically, the sales ratio, i.e., how fast the market is moving, is a great way to measure the status (i.e., buyer, seller or balanced markets), as it compares the level of inventory remaining against the number of sold properties for that month.
Market Dynamics: Not All Markets are Equal.
March’s trend back to a seller’s market is mostly due to the significant increase in sales that, despite considerable increases in new listings, still saw the overall inventory level remain below the 10-year norm.
However, this is not true at the local level, where significant differences between markets have continued to increase over the last few months. Some markets have become more favorable for buyers, while others remain firmly in control of the sellers, and the remainder are favorable to neither.
For instance, East Bay saw a sales ratio of 138.1%, indicating that there were more sales than new listings entering the market during March. Greater Seattle saw 86.2 out of every 100 homes sell, i.e., an 86.2% sales ratio, and St. Louis saw 82 out of every 100 homes sell during March.
At the other end of the spectrum, Whistler in Canada saw very few sales, with a 1.4% sales ratio for its luxury homes. Fountain Hills in Arizona reported only 4.8 luxury homes sold out of 100 i.e., a 4.8% sales ratio, while South Walton in Florida fared slightly better with a 6.7% sales ratio.

On the balanced side, three Florida markets: Coastal Pinellas, Marco Island, and Broward County all reported sales ratios trending downward into the 12 percentiles, thereby leaning towards a buyer’s market. Whereas Toronto, Kauai, and Sonoma County in California trended upwards into the 20 percentiles, towards a seller’s market.
Equally confusing is that in some markets, home prices continue to increase, while in others, they are on a downward trajectory. Different price bands within the same market also report differing results, and it’s not always the lower-priced properties that are selling the fastest!
Additionally, results can seem to be inconsistent from month to month, especially in smaller luxury markets where the sales volume is traditionally low, and prices cover a very broad range!
So how are buyers and sellers meant to understand whether it’s a good time to buy or sell?

Interpreting Statistical Data
Statistical data at the macro level not only provides us with an insight into the overall sentiment of buyers and sellers but also an objective overview of market trends, as it’s based on empirical evidence and quantitative analysis.
At the local level, statistical data is even more important because it is less prone to bias and subjectivity, unlike anecdotal evidence or personal opinions. By examining various metrics, including property prices, sales volumes, local economic influences, and demographic trends, buyers and sellers will be able to gain clearer insights.
Drilling down even further, one of the most important parameters to consider is the level of available inventory for similar properties within the buyer’s or seller’s local market - not always an easy task in the luxury segment, where homes often have a list of unique attributes.
This needs to be taken in conjunction with reviewing the availability of properties in the same price point, property type, or specific neighborhood. By comparing this data to historical performance, it can identify long-term trends, cyclical patterns, and seasonal variations, all of which allow the buyer or seller to make an informed decision about the potential risk and/or return.
In addition, understanding whether currently listed properties have been on the market for a while or if any are unlikely to meet buyer expectations is important, as these factors can often distort the true demand for a specific property.
Recognizing Qualitative Research
While statistical data gives deeper insights into market dynamics and helps identify underlying trends, it needs to be appreciated that real estate decisions are also influenced by subjective factors such as personal preferences, lifestyle choices, and emotional attachments.
Equally, current and future community influences must be considered by both sellers and buyers. Markets are influenced by complex interconnected drivers such as economic conditions, regulatory policies, and demographic trends, as well as local factors such as culture, community dynamics, neighborhood characteristics, and urban development trends.
Qualitative research can be particularly useful for identifying emerging trends, preferences, and market shifts that can uncover emerging patterns of behavior, changing buyer requirements, and local market nuances.
Understanding these key parameters during this spring market will help buyers and sellers manage their expectations, leverage opportunities, and appreciate their true negotiation power within their specific market.
The art of selling and buying in this market needs a critical and analytical approach; understanding the realities and setting expectations accordingly will ensure that goals are achieved. For homeowners looking to buy or sell in today’s market, we recommend working with a realtor who can capitalize on the preferences, trends, and demands in this dynamic and evolving environment.

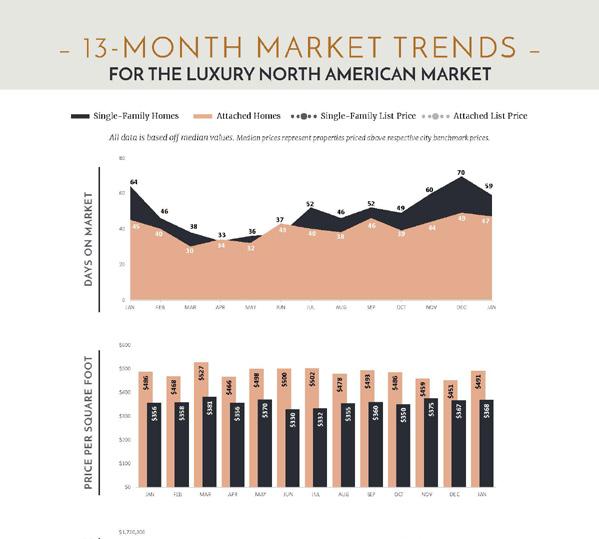
FOR THE LUXURY NORTH AMERICAN MARKET
All data is based off median values. Median prices represent properties priced above respective city benchmark prices.
– 13 -
–Single-Family Homes
Homes Single-Family List Price Attached List Price
MONTH MARKET TRENDS
Attached
DAYS ON MARKET SALES PRICE VS. LIST PRICE
0 5 10 15 20 25 30 35 40 45 MAR APR MAY JUN JUL AUG SEP OCT NOV DEC JAN FEB MAR SALES RATIO 0% 5% 10% 15% 20% 25% 30% 35% 40% 45% MAR APR MAY JUN JUL AUG SEP OCT NOV DEC JAN FEB MAR $500,000 $700,000 $900,000 $1,100,000 $1,300,000 $1,500,000 $1,700,000 $1,900,000 MAR APR MAY JUN JUL AUG SEP OCT NOV DEC JAN FEB MAR 21% 12% Seller's Balanced Buyer's
– LUXURY MONTHLY MARKET REVIEW –
A Review of Key Market Differences Year over Year
March 2023 | March 2024
SINGLE-FAMILY HOMES
• Official Market Type: Seller's Market with a 27.34% Sales Ratio.1
• Homes are selling for an average of 98.99% of list price.
• The median luxury threshold2 price is $912,500, and the median luxury home sales price is $1,300,000.
• Markets with the Highest Median Sales Price: Whistler ($12,000,000), Ft. Lauderdale ($4,200,000), Telluride ($4,000,000), and Naples ($3,960,000).
• Markets with the Highest Sales Ratio: East Bay (138.1%), King County (86.2%), St. Louis (81.6%), and Silicon Valley (76.0%).
1Sales Ratio defines market speed and market type: Buyer's < 12%; Balanced >= 12 to < 21%; Seller's >= 21%. If >100%, sales from previous month exceeds current inventory. 2The luxury threshold price is set by The Institute for Luxury Home Marketing.
Median List Price $1,694,500 $1,650,000 Median Sale Price $1,300,000 $1,300,000 Median SP/LP Ratio 98.80% 98.99% Total Sales Ratio 31.59% 27.34% Median Price per Sq. Ft. $395 $402 Total Inventory 45,872 56,970 New Listings 17,347 20,578 Total Sold 14,492 15,574 Median Days on Market 22 27 Average Home Size 3,308 3,162
Median prices represent properties priced above respective city benchmark prices. March 2024 March 2023 March 2024 March 2023 SINGLE-FAMILY HOMES MARKET SUMMARY | MARCH 2024 New Listings Total Sold 1,082 Med. Sale Price $0 3,231 Days on Market 5 Sales Ratio 4.25%
– LUXURY MONTHLY MARKET REVIEW –
A Review of Key Market Differences Year over Year
• Official Market Type: Balanced Market with a 21.81% Sales Ratio. 1
• Attached homes are selling for an average of 99.29% of list price.
• The median luxury threshold2 price is $700,000, and the median attached luxury sale price is $875,000
• Markets with the Highest Median Sales Price: Manhattan ($3,826,000), Vail ($3,372,500), Park City ($2,975,000), and Whistler ($2,750,000).
• Markets with the Highest Sales Ratio: Fairfax County, VA (147.1%), Howard County, MD (135.3%), Baltimore County, MD (126.7%), and East Bay (118.1%).
Median List Price $964,250 $997,707 Median Sale Price $863,750 $875,000 Median SP/LP Ratio 99.01% 99.29% Total Sales Ratio 28.44% 21.81% Median Price per Sq. Ft. $497 $518 Total Inventory 17,065 23,407 New Listings 6,199 7,253 Total Sold 4,854 5,106 Median Days on Market 23 22 Average Home Size 1,963 1,892
Median prices represent properties priced above respective city benchmark prices.
March 2024 March 2023 March 2024 March 2023
SUMMARY | MARCH 2024
New Listings 1,054 Total Sold 252 Med. Sale Price $11,250 Days on Market 1 Sales Ratio 6.63% 1Sales Ratio defines market speed and market type: Buyer's < 12%; Balanced >= 12 to < 21%; Seller's >= 21%. If >100%, sales from previous month exceeds current inventory. 2The luxury threshold price is set by The Institute for Luxury Home Marketing.
March 2023 | March 2024
ATTACHED HOMES MARKET
ATTACHED HOMES
– LUXURY MONTHLY MARKET REVIEW –
Median prices represent properties priced above respective city benchmark prices. Prices shown for Canadian cites are shown in Canadian Dollars.
SINGLE FAMILY HOMES ATTACHED HOMES State Market Name List Price Sold Price DOM Ratio Market List Price Sold Price DOM Ratio Market AB Calgary - - - - - - - - -AZ Chandler and Gilbert $1,100,000 $1,072,500 49 37.1% Seller's - - - -AZ Flagstaff $1,542,500 $1,625,500 54 22.9% Seller's - - - -AZ Fountain Hills $2,439,498 $3,250,000 33 4.8% Buyer's $676,950 $747,500 26 18.8% Balanced AZ Mesa $899,900 $829,500 45 46.0% Seller's - - - -AZ Paradise Valley $6,375,000 $3,607,500 58 12.6% Balanced - - - -AZ Phoenix $925,000 $810,000 39 40.5% Seller's - - - -AZ Scottsdale $2,199,000 $1,800,000 53 19.8% Balanced $904,000 $800,000 51 28.3% Seller's AZ Tucson $714,595 $684,490 17 27.7% Seller's - - - -BC Okanagan Valley $1,739,000 $1,618,500 51 3.1% Buyer's - - - -BC Vancouver $4,290,000 $3,275,000 18 7.3% Buyer's $1,889,400 $1,749,900 12 10.7% Buyer's BC Victoria - - - - - - - - -BC Whistler $5,594,500 $12,000,000 209 1.4% Buyer's $2,499,000 $2,750,000 20 11.9% Buyer's CA Central Coast $2,999,500 $2,500,000 20 24.5% Seller's $1,372,500 $1,169,000 9 35.0% Seller's CA East Bay $2,486,500 $1,980,000 8 138.1% Seller's $1,091,500 $1,175,000 8 118.1% Seller's CA Greater Palm Springs $1,995,000 $1,739,500 46 25.5% Seller's - - - -CA Lake Tahoe $2,972,500 $1,920,000 49 28.7% Seller's $1,450,000 $1,100,000 10 7.7% Buyer's CA Los Angeles Beach Cities $5,995,000 $3,850,000 35 14.9% Balanced $1,997,500 $1,700,500 17 30.8% Seller's CA Los Angeles City $4,950,000 $3,486,362 22 14.4% Balanced $1,749,000 $1,485,000 21 19.5% Balanced CA Los Angeles The Valley $2,870,000 $2,255,000 21 28.9% Seller's $779,000 $810,000 22 67.2% Seller's CA Marin County $3,675,000 $3,225,000 12 37.3% Seller's $1,510,405 $1,355,000 14 43.3% Seller's CA Napa County $3,325,000 $2,025,000 66 8.2% Buyer's - - - -CA Orange County $3,520,000 $2,200,000 15 54.0% Seller's $1,299,000 $1,187,500 12 98.1% Seller's CA Placer County $1,199,000 $1,137,961 25 36.0% Seller's - - - -CA Sacramento $975,000 $925,000 14 41.0% Seller's - - - -CA San Diego $2,649,000 $1,850,000 9 47.0% Seller's $1,312,414 $1,000,000 8 57.9% Seller's CA San Francisco $4,840,000 $3,680,000 10 38.5% Seller's $2,900,000 $2,500,000 14 19.3% Balanced CA San Luis Obispo County $1,795,000 $1,442,500 30 32.8% Seller's - - - -CA Silicon Valley $4,500,000 $3,476,500 8 76.0% Seller's $1,738,000 $1,660,000 8 63.0% Seller's CA Sonoma County $2,637,500 $1,890,000 29 20.9% Balanced $793,293 $731,500 19 50.0% Seller's CA Ventura County $2,487,500 $1,600,000 41 27.0% Seller's $797,000 $787,500 39 54.5% Seller's CO Boulder $2,295,000 $1,450,000 35 21.4% Seller's $964,500 $900,000 44 22.1% Seller's CO Colorado Springs $945,000 $842,000 40 24.1% Seller's $550,000 $628,500 32 17.8% Balanced CO Denver $1,650,000 $1,399,450 11 39.1% Seller's $850,000 $790,000 8 31.1% Seller's CO Douglas County $1,325,000 $1,157,000 28 33.3% Seller's $614,990 $598,950 12 58.8% Seller's CO Durango - - - - - - - - -CO Summit County $3,400,000 $2,400,000 29 26.5% Seller's $1,257,500 $1,337,500 18 21.7% Seller's CO Telluride $7,200,000 $4,000,000 84 6.8% Buyer's $3,150,000 $1,962,500 140 16.7% Balanced CO Vail $7,900,000 $2,692,500 47 18.4% Balanced $3,800,000 $3,372,500 84 21.7% Seller's
SINGLE FAMILY HOMES ATTACHED HOMES State Market Name List Price Sold Price DOM Ratio Market List Price Sold Price DOM Ratio Market CT Central Connecticut $700,000 $636,250 47 46.2% Seller's - - - -CT Coastal Connecticut $2,495,000 $1,825,000 77 23.5% Seller's $995,513 $875,000 55 46.2% Seller's DC Washington D.C. $3,950,000 $3,005,000 11 26.9% Seller's $1,897,475 $1,587,500 8 24.8% Seller's DE Sussex County Coastal $1,599,990 $1,520,908 37 16.1% Balanced $1,150,000 $875,000 6 52.0% Seller's FL Boca Raton/Delray Beach $2,992,500 $1,867,000 61 18.0% Balanced $1,022,500 $846,439 43 19.4% Balanced FL Brevard County $825,000 $777,500 12 25.8% Seller's $715,000 $705,000 43 10.3% Buyer's FL Broward County $1,749,000 $1,450,000 59 12.3% Balanced $698,850 $630,000 41 12.1% Balanced FL Coastal Pinellas County $2,000,000 $1,721,350 47 12.1% Balanced $1,200,000 $1,127,000 38 14.5% Balanced FL Ft. Lauderdale $5,499,500 $4,200,000 141 11.4% Buyer's $2,495,000 $2,525,000 83 6.8% Buyer's FL Jacksonville Beaches $1,350,000 $1,150,000 14 18.9% Balanced $1,015,000 $1,065,000 38 17.7% Balanced FL Lee County $1,442,500 $1,266,000 56 11.9% Buyer's $849,000 $720,000 40 13.0% Balanced FL Marco Island $2,800,000 $2,122,500 75 12.2% Balanced $1,699,000 $1,987,500 31 17.5% Balanced FL Miami $2,097,500 $1,326,000 66 11.3% Buyer's $1,495,000 $1,325,000 106 7.5% Buyer's FL Naples $5,525,000 $3,960,000 68 9.0% Buyer's $2,380,000 $2,350,000 76 12.4% Balanced FL Orlando $1,290,000 $1,160,000 30 20.2% Balanced $560,000 $580,000 22 11.2% Buyer's FL Palm Beach Towns $4,875,000 $3,025,000 122 12.0% Buyer's $2,164,500 $1,875,000 99 8.2% Buyer's FL Sarasota & Beaches $2,594,990 $2,285,000 34 9.2% Buyer's $1,600,000 $1,370,000 44 18.5% Balanced FL South Pinellas County $1,495,000 $1,336,966 28 18.4% Balanced $1,050,000 $1,000,000 43 15.1% Balanced FL South Walton $2,599,000 $1,850,000 61 6.7% Buyer's $1,272,500 $1,307,500 37 10.3% Buyer's FL Tampa $750,000 $727,500 30 29.2% Seller's $871,950 $645,000 45 20.1% Balanced GA Atlanta $1,700,000 $1,169,500 6 28.7% Seller's $709,900 $646,500 19 28.0% Seller's GA Duluth $1,477,500 $1,291,000 10 29.2% Seller's - - - -HI Island of Hawaii $1,988,000 $1,762,500 37 16.7% Balanced $1,850,000 $1,650,000 6 37.5% Seller's HI Kauai $3,180,000 $2,200,000 58 20.8% Balanced $1,450,000 $1,265,000 49 25.5% Seller's HI Maui $3,800,000 $2,700,000 106 13.3% Balanced $2,000,000 $1,950,000 109 21.4% Seller's HI Oahu $2,991,500 $2,100,000 17 19.1% Balanced $1,248,000 $895,000 36 12.8% Balanced IA Greater Des Moines $655,900 $595,000 80 16.1% Balanced - - - -ID Ada County $799,948 $750,000 26 48.8% Seller's $617,000 $578,500 15 37.7% Seller's ID Northern Idaho $1,712,500 $1,182,500 74 7.5% Buyer's - - - -IL Chicago $1,695,000 $1,300,000 14 43.4% Seller's $1,250,000 $916,500 39 23.1% Seller's IL DuPage County $1,299,998 $905,000 15 41.5% Seller's $750,000 $633,261 33 90.5% Seller's IL Lake County $1,339,000 $945,000 13 36.5% Seller's - - - -IL Will County $700,000 $650,000 9 50.7% Seller's - - - -IN Hamilton County $862,495 $727,728 5 64.9% Seller's - - - -KS Johnson County $825,961 $831,820 32 22.4% Seller's $638,500 $594,000 38 14.5% Balanced MA Cape Cod $2,529,500 $1,970,120 24 13.3% Balanced $1,095,000 $852,000 19 13.6% Balanced MA Greater Boston $3,844,000 $2,587,500 16 14.3% Balanced $2,497,000 $1,865,000 22 17.1% Balanced MA South Shore $1,999,000 $1,375,980 34 19.0% Balanced $875,000 $852,500 15 40.0% Seller's MD Anne Arundel County $1,129,390 $950,000 6 63.0% Seller's $607,495 $554,178 5 111.5% Seller's
Median prices represent properties priced above respective city benchmark prices. Prices shown for Canadian cites are shown in Canadian Dollars. – LUXURY MONTHLY MARKET REVIEW –
Median
respective
in Canadian Dollars.
SINGLE FAMILY HOMES ATTACHED HOMES State Market Name List Price Sold Price DOM Ratio Market List Price Sold Price DOM Ratio Market MD Baltimore City $949,472 $809,250 5 40.0% Seller's $695,000 $632,380 8 26.2% Seller's MD Baltimore County $1,132,000 $950,000 9 31.5% Seller's $626,985 $635,000 7 126.7% Seller's MD Frederick County $889,995 $855,000 7 23.0% Seller's - - - -MD Howard County $1,199,995 $1,070,000 5 69.6% Seller's $719,990 $650,000 4 135.3% Seller's MD Montgomery County $2,055,823 $1,575,000 7 48.9% Seller's $869,900 $742,018 8 105.3% Seller's MD Talbot County $3,295,000 $1,080,000 27 15.9% Balanced - - - -MD Worcester County $1,099,000 $825,500 16 21.8% Seller's $675,000 $622,500 15 30.0% Seller's MI Grand Traverse $1,175,829 $892,000 57 15.9% Balanced - - - -MI Livingston County $749,999 $650,000 13 25.9% Seller's - - - -MI Monroe County $755,000 $582,500 66 11.8% Buyer's - - - -MI Oakland County $865,680 $670,000 11 49.2% Seller's $689,250 $620,000 19 52.1% Seller's MI Washtenaw County $959,500 $699,900 29 33.0% Seller's $699,990 $620,575 43 30.2% Seller's MI Wayne County $739,900 $614,500 8 46.9% Seller's $713,309 $680,000 38 11.1% Buyer's MN Olmsted County $899,450 $899,900 71 19.8% Balanced - - - -MN Twin Cities $1,252,450 $1,075,000 16 19.1% Balanced - - - -MO Kansas City $729,950 $659,500 19 27.9% Seller's - - - -MO St. Louis $748,052 $625,278 6 81.6% Seller's - - - -NC Asheville $1,172,500 $918,500 25 26.5% Seller's $679,900 $742,000 29 28.6% Seller's NC Charlotte $1,335,000 $957,500 4 59.2% Seller's $650,000 $624,342 11 51.9% Seller's NC Lake Norman $1,349,000 $1,050,000 9 38.2% Seller's $585,000 $599,900 55 84.0% Seller's NC Raleigh-Durham $1,295,000 $940,000 3 50.1% Seller's - - - -NH Rockingham County $1,549,500 $1,325,000 4 32.1% Seller's $890,400 $872,950 6 40.9% Seller's NJ Bergen County $2,695,000 $1,795,000 34 18.7% Balanced $1,265,080 $1,210,000 39 31.6% Seller's NJ Morris County $1,899,000 $1,350,500 26 38.8% Seller's $789,000 $718,000 13 53.3% Seller's NJ Ocean County $999,999 $810,000 31 26.2% Seller's $999,900 $727,450 41 23.2% Seller's NM Taos $1,395,000 $975,000 83 8.8% Buyer's - - - -NV Lake Tahoe $5,249,000 $2,450,000 146 24.6% Seller's $1,350,000 $1,200,000 207 20.0% Balanced NV Las Vegas $1,839,900 $1,380,000 24 19.4% Balanced - - - -NV Reno $2,437,500 $1,650,000 73 16.7% Balanced - - - -NY Dutchess & Putnam Counties $1,100,000 $930,000 64 11.8% Buyer's - - - -NY Manhattan - - - - - $4,800,000 $3,826,000 119 8.1% Buyer's NY Nassau County $1,906,650 $1,500,000 53 18.3% Balanced $1,599,000 $1,475,000 116 13.5% Balanced NY Rockland, Orange, & Ulster $1,250,000 $995,000 48 14.4% Balanced - - - -NY Staten Island $1,188,000 $982,500 105 7.6% Buyer's $645,000 $590,000 47 23.5% Seller's NY Suffolk County $1,995,000 $1,300,000 76 10.9% Buyer's $749,990 $610,000 25 31.3% Seller's NY Westchester County $2,291,375 $1,700,000 34 20.4% Balanced - - - -OH Cincinnati $860,900 $690,000 3 29.3% Seller's - - - -OH Cleveland Suburbs $899,900 $600,000 33 42.9% Seller's - - - -OH Columbus $877,450 $744,405 6 51.7% Seller's $684,900 $616,875 38 24.3% Seller's
prices represent properties priced above
city benchmark prices. Prices shown for Canadian cites are shown
– LUXURY MONTHLY MARKET REVIEW –
SINGLE FAMILY HOMES ATTACHED HOMES State Market Name List Price Sold Price DOM Ratio Market List Price Sold Price DOM Ratio Market ON GTA - Durham $1,800,000 $1,500,000 9 27.6% Seller's $849,999 $845,000 27 59.4% Seller's ON GTA - York $2,580,000 $1,877,500 10 34.6% Seller's $799,000 $786,250 16 20.5% Balanced ON Hamilton $1,850,000 $1,650,000 27 14.2% Balanced $999,900 $875,000 20 28.2% Seller's ON Mississauga $3,099,925 $2,627,500 20 15.2% Balanced $982,900 $913,750 14 47.2% Seller's ON Oakville $3,049,450 $2,179,000 10 37.0% Seller's $1,349,000 $1,188,750 36 34.8% Seller's ON Toronto $3,888,000 $3,100,000 13 20.6% Balanced $1,239,000 $1,115,000 16 17.7% Balanced ON Waterloo Region $1,499,000 $1,300,000 14 33.3% Seller's $768,650 $745,500 12 25.7% Seller's OR Portland $1,395,000 $1,120,000 19 23.2% Seller's $675,000 $625,000 20 20.7% Balanced SC Charleston $1,780,000 $1,475,000 16 32.0% Seller's $1,223,000 $1,250,000 9 31.3% Seller's SC Hilton Head $1,995,000 $1,596,970 34 24.1% Seller's $1,195,000 $1,150,000 15 32.5% Seller's TN Greater Chattanooga $900,000 $950,000 6 17.6% Balanced - - - -TN Knoxville $908,500 $853,067 52 43.2% Seller's - - - -TN Nashville $1,827,735 $1,366,895 10 29.3% Seller's $769,000 $784,500 13 16.8% Balanced TX Austin $1,295,000 $1,015,000 20 22.0% Seller's $859,000 $775,000 32 10.3% Buyer's TX Collin County $750,000 $730,000 17 36.4% Seller's - - - -TX Dallas $1,400,000 $1,275,000 16 33.1% Seller's $695,800 $663,435 12 19.6% Balanced TX Denton County $810,000 $751,000 25 34.0% Seller's - - - -TX El Paso $639,000 $635,000 52 14.0% Balanced - - - -TX Fort Worth $860,950 $823,295 18 29.6% Seller's - - - -TX Greater Tyler $679,900 $587,000 19 10.1% Buyer's - - - -TX Houston $989,900 $920,000 30 28.1% Seller's $624,995 $618,000 30 25.0% Seller's TX Lubbock $699,975 $625,000 105 20.4% Balanced - - - -TX San Angelo $627,750 $624,000 85 7.9% Buyer's - - - -TX San Antonio $796,735 $754,500 64 18.9% Balanced $675,000 $1,000,000 34 7.6% Buyer's TX The Woodlands & Spring $890,000 $750,000 27 38.4% Seller's - - - -UT Park City $4,837,000 $3,313,500 38 14.1% Balanced $2,272,500 $2,975,000 22 18.0% Balanced UT Salt Lake City $1,297,000 $957,888 35 37.6% Seller's $606,011 $567,000 29 38.3% Seller's UT Washington County $1,495,000 $1,299,950 32 16.6% Balanced - - - -VA Arlington & Alexandria $2,599,875 $1,716,110 6 37.5% Seller's $1,167,500 $1,096,000 7 105.4% Seller's VA Fairfax County $2,341,515 $1,480,000 5 46.6% Seller's $820,775 $720,000 5 147.1% Seller's VA McLean & Vienna $3,149,975 $1,813,000 7 34.3% Seller's $1,425,000 $1,020,000 6 68.8% Seller's VA Richmond $800,000 $798,273 8 39.3% Seller's $577,815 $571,781 23 26.9% Seller's VA Smith Mountain Lake $1,748,750 $1,150,000 124 25.0% Seller's - - - -WA King County $2,150,000 $1,750,000 5 86.2% Seller's $1,200,794 $1,075,250 8 50.4% Seller's WA Seattle $1,995,000 $1,650,000 6 64.6% Seller's $1,495,000 $1,325,000 11 38.4% Seller's WA Spokane $1,139,950 $937,500 2 8.8% Buyer's - - - - -
Median prices represent properties priced above respective city benchmark prices. Prices shown for Canadian cites are shown in Canadian Dollars. – LUXURY MONTHLY MARKET REVIEW –
Luxury is in each detail.
Hubert de Givenchy
LOS ANGELES THE VALLEY CALIFORNIA
2024 APRIL
LUXURY INVENTORY VS. SALES | MARCH 2024
$1,700,000 - $1,799,999
$1,600,000 - $1,699,999
$1,550,000 - $1,599,999
Square Feet3 -RangePrice -Median SoldBeds -Median SoldBaths -Median SoldSold -TotalInventory -TotalSales Ratio -Sold/Inventory0 - 2,999 $1,799,000 4 3 61 162 38% 3,000 - 3,999 $2,050,000 4 4 41 138 30% 4,000 - 4,999 $2,900,000 5 5 37 109 34% 5,000 - 5,999 $3,762,500 5 5 14 68 21% 6,000 - 6,999 $4,999,500 6 7 10 30 33% 7,000+ $6,500,000 6 8 9 85 11%
SINGLE - FAMILY HOMES 1 The luxury threshold price is set by The Institute for Luxury Home Marketing. 2Sales Ratio defines market speed and market type: Buyer's < 12%; Balanced >= 12 to < 21%; Seller's >= 21%. If >100% MLS® data reported previous month’s sales exceeded current inventory. 7 10 15 28 21 32 55 43 56 86 90 67 25 30 31 0 0 1 2 7 4 15 5 17 22 28 30 17 19 5 $20,000,000+ $15,000,000 - $19,999,999 $10,000,000 - $14,999,999 $7,000,000 - $9,999,999
- $6,999,999
- $5,999,999
- $4,999,999
$3,999,999
LA - THE VALLEY
$6,000,000
$5,000,000
$4,000,000
$3,500,000 -
$3,000,000 - $3,499,999 $2,500,000 - $2,999,999 $2,000,000 - $2,499,999
$1,800,000 - $1,999,999
Inventory Sales
Market Total Inventory: 596 Total Sales: 172 Total Sales Ratio2 : 29% Luxury Benchmark Price 1: $1,550,000
Seller's
LA - THE VALLEY SINGLE - FAMILY HOMES
• The single-family luxury market is a Seller's Market with a 29% Sales Ratio.
• Homes sold for a median of 98.74% of list price in March 2024.
• The most active price band is $1,700,000-$1,799,999, where the sales ratio is 68%
• The median luxury sales price for single-family homes is $2,255,000.
• The median days on market for March 2024 was 21 days, down from 30 in March 2023.
MARCH 13 - MONTH LUXURY MARKET TREND 4 Solds Median Sales Price Inventory 435 507 534 585 614 592 612 676 630 476 564 550 596 161 146 204 209 168 184 150 140 135 115 128 138 172 $2,175,000 $2,082,500 $1,989,500 $2,200,000 $2,050,000 $2,075,000 $2,134,940 $2,302,500 $2,110,000 $2,100,000 $2,037,500 $2,112,500 $2,255,000 Mar-23Apr-23May-23 Jun-23Jul-23 Aug-23Sep-23Oct-23 Nov-23 Dec-23Jan-24 Feb-24 Mar-24
foot
MEDIAN DATA REVIEW |
3Square foot table does not account for listings and solds where square
data is not disclosed. 4Data reported includes Active and Sold properties and does not include Pending properties.
THE VALLEY
MARCH
VARIANCE: 37 % 435596 Mar. 2023Mar. 2024 TOTAL INVENTORY VARIANCE: 7 % 161172 TOTAL SOLDS VARIANCE: 4 % $2.18m $2.26m SALES PRICE VARIANCE: - 30 % 3021 DAYS ON MARKET VARIANCE: 1 % 98.19% 98.74% SALE TO LIST PRICE RATIO VARIANCE: - 1 % $736 $729 SALE PRICE PER SQFT. Mar. 2023Mar. 2024 Mar. 2023Mar. 2024 Mar. 2023Mar. 2024 Mar. 2023Mar. 2024 Mar. 2023Mar. 2024 Luxury Benchmark Price 1: $1,550,000
LA -
MARKET SUMMARY |
2024
LA - THE VALLEY
Square Feet3 -RangePrice -Median SoldBeds -Median SoldBaths -Median SoldSold -TotalInventory -TotalSales Ratio -Sold/Inventory0 - 1,499 $748,500 2 3 32 51 63% 1,500 - 1,749 $818,000 3 3 23 34 68% 1,750 - 1,999 $820,000 3 3 18 34 53% 2,000 - 2,249 $832,500 3 3 14 7 200% 2,250 - 2,499 $1,185,000 3 3 3 5 60% 2,500+ $1,280,000 4 3 2 6 33% 11 3 4 5 8 8 9 8 11 16 31 4 9 7 3 7 3 2 3 7 5 16 9 6 6 5 2 9 7 5 $1,150,000+ $1,080,000 - $1,149,999 $1,020,000 - $1,079,999 $960,000 - $1,019,999 $900,000 - $959,999 $860,000 - $899,999 $820,000 - $859,999 $800,000 - $819,999 $780,000 - $799,999 $760,000 - $779,999 $740,000 - $759,999 $730,000 - $739,999
- $729,999
- $719,999
- $709,999
Inventory Sales Luxury Benchmark Price 1: $700,000 Seller's Market Total Inventory: 137 Total Sales: 92 Total Sales Ratio2 : 67% 1 The luxury threshold price is set by The Institute for Luxury Home Marketing. 2Sales Ratio defines market speed and market type: Buyer's < 12%; Balanced >= 12 to < 21%; Seller's >= 21%. If >100% MLS® data reported previous month’s sales exceeded current inventory.
ATTACHED HOMES
$720,000
$710,000
$700,000
LUXURY INVENTORY VS. SALES | MARCH 2024
• The attached luxury market is a Seller's Market with a 67% Sales Ratio.
• Homes sold for a median of 100.52% of list price in March 2024.
• The most active price band is $820,000-$859,999, where the sales ratio is 178%
• The median luxury sales price for attached homes is $810,000.
• The median days on market for March 2024 was 22 days, down from 24 in March 2023.
107 90 92 82 100 126 117 137 109 86 116 135 137 67 72 89 92 88 72 71 68 53 53 53 67 92 $802,375 $806,000 $800,000 $790,500 $786,694 $810,000 $820,000 $807,500 $830,000 $800,000 $790,000 $800,000 $810,000 Mar-23Apr-23May-23 Jun-23Jul-23 Aug-23Sep-23Oct-23 Nov-23 Dec-23Jan-24 Feb-24 Mar-24 3Square foot table does not account for listings and solds where square foot data is not disclosed. 4Data reported includes Active and Sold properties and does not include Pending properties. VARIANCE: 28 % 107137 VARIANCE: 37 % 6792 VARIANCE: 1 % $802k $810k SALES PRICE VARIANCE: - 8 % 2422 DAYS ON MARKET VARIANCE: 1 % 100.00% 100.52% SALE TO LIST PRICE RATIO VARIANCE: 0 % $519 $517 SALE PRICE PER SQFT. LA - THE VALLEY MARKET SUMMARY | MARCH 2024
THE VALLEY ATTACHED HOMES
LA -
Mar. 2023Mar. 2024 Mar. 2023Mar. 2024 Mar. 2023Mar. 2024 Mar. 2023Mar. 2024 Mar. 2023Mar. 2024 Mar. 2023Mar. 2024
TOTAL INVENTORY TOTAL SOLDS Luxury Benchmark Price 1: $700,000
Solds Median Sales Price Inventory
MEDIAN DATA REVIEW | MARCH
13 - MONTH LUXURY MARKET TREND 4
LOS ANGELES BEACH CITIES CALIFORNIA
2024 APRIL
Square Feet3 -RangePrice -Median SoldBeds -Median SoldBaths -Median SoldSold -TotalInventory -TotalSales Ratio -Sold/Inventory0 - 1,999 $2,832,500 3 3 10 44 23% 2,000 - 2,999 $3,506,250 4 3 14 53 26% 3,000 - 3,999 $4,012,500 5 5 16 92 17% 4,000 - 4,999 $4,795,000 4 5 7 68 10% 5,000 - 5,999 $6,400,000 6 7 5 31 16% 6,000+ $9,600,000 6 6 2 79 3%
SINGLE - FAMILY HOMES 1 The luxury threshold price is set by The Institute for Luxury Home Marketing. 2Sales Ratio defines market speed and market type: Buyer's < 12%; Balanced >= 12 to < 21%; Seller's >= 21%. If >100% MLS® data reported previous month’s sales exceeded current inventory. 7 16 26 19 7 17 12 35 23 26 45 50 33 35 31 0 1 0 0 1 1 1 1 2 2 5 14 10 11 8 $50,000,000+ $30,000,000 - $49,999,999 $20,000,000 - $29,999,999 $16,000,000 - $19,999,999 $14,000,000 - $15,999,999 $12,000,000 - $13,999,999 $10,000,000 - $11,999,999 $8,000,000 - $9,999,999 $7,000,000 - $7,999,999 $6,000,000 - $6,999,999 $5,000,000 - $5,999,999
- $4,999,999
- $3,999,999
- $3,499,999
- $2,999,999 Inventory Sales
Balanced Market Total Inventory: 382 Total Sales: 57 Total Sales Ratio2 : 15% Luxury Benchmark Price 1: $2,500,000
LA - BEACH CITIES
$4,000,000
$3,500,000
$3,000,000
$2,500,000
LUXURY INVENTORY VS. SALES | MARCH 2024
LA - BEACH CITIES SINGLE - FAMILY HOMES
MEDIAN DATA REVIEW | MARCH
LA - BEACH CITIES MARKET SUMMARY | MARCH 2024
• The single-family luxury market is a Balanced Market with a 15% Sales Ratio.
• Homes sold for a median of 98.72% of list price in March 2024.
• The most active price band is $3,000,000-$3,499,999, where the sales ratio is 31%
• The median luxury sales price for single-family homes is $3,850,000.
• The median days on market for March 2024 was 35 days, up from 21 in March 2023.
4 Solds Median Sales Price Inventory 329 346 363 365 395 382 400 422 399 295 345 386 382 79 66 59 79 65 78 73 57 55 48 46 47 57 $4,300,000 $4,263,250 $4,184,700 $3,635,000 $3,550,000 $4,608,500 $3,915,000 $3,900,000 $4,200,000 $3,850,500 $4,325,000 $3,975,000 $3,850,000 Mar-23 Apr-23 May-23 Jun-23 Jul-23 Aug-23 Sep-23 Oct-23 Nov-23 Dec-23 Jan-24 Feb-24 Mar-24 3Square foot table
where square foot data
not
13 - MONTH LUXURY MARKET TREND
does not account for listings and solds
is
disclosed. 4Data reported includes Active and Sold properties and does not include Pending properties.
VARIANCE: 16 % 329 382 Mar. 2023 Mar. 2024 TOTAL INVENTORY VARIANCE: - 28 % 79 57 TOTAL SOLDS VARIANCE: - 10 % $4.30m $3.85m SALES PRICE VARIANCE: 67 % 21 35 DAYS ON MARKET VARIANCE: 2 % 97.25% 98.72% SALE TO LIST PRICE RATIO VARIANCE: - 7 % $1,409 $1,317 SALE PRICE PER SQFT. Mar. 2023 Mar. 2024 Mar. 2023 Mar. 2024 Mar. 2023 Mar. 2024 Mar. 2023 Mar. 2024 Mar. 2023 Mar. 2024 Luxury Benchmark Price 1: $2,500,000
LA - BEACH CITIES
ATTACHED HOMES
Square Feet3 -RangePrice -Median SoldBeds -Median SoldBaths -Median SoldSold -TotalInventory -TotalSales Ratio -Sold/Inventory0 - 999 NA NA NA 0 3 0% 1,000 - 1,499 $1,400,000 2 2 11 35 31% 1,500 - 1,999 $1,575,500 3 3 20 53 38% 2,000 - 2,499 $1,711,000 4 3 11 33 33% 2,500 - 2,999 $2,903,500 4 3 4 16 25% 3,000+ $2,827,500 5 4 2 13 15% 8 14 14 9 9 22 10 22 11 7 8 5 9 2 6 1 0 3 0 5 1 4 8 4 2 4 3 8 5 0 $4,550,000+ $3,750,000 - $4,549,999 $3,150,000 - $3,749,999 $2,750,000 - $3,149,999 $2,350,000 - $2,749,999 $2,150,000 - $2,349,999 $1,950,000 - $2,149,999 $1,750,000 - $1,949,999 $1,650,000 - $1,749,999 $1,550,000 - $1,649,999 $1,450,000 - $1,549,999 $1,400,000 - $1,449,999 $1,350,000 - $1,399,999 $1,300,000 - $1,349,999 $1,260,000 - $1,299,999 LUXURY
Inventory Sales Luxury Benchmark Price 1: $1,260,000 Seller's Market Total Inventory: 156 Total Sales: 48 Total Sales Ratio2 : 31% 1 The luxury threshold price is set by The Institute for Luxury Home Marketing. 2Sales Ratio defines market speed and market type: Buyer's < 12%; Balanced >= 12 to < 21%; Seller's >= 21%. If >100% MLS® data reported previous month’s sales exceeded current inventory.
INVENTORY VS. SALES | MARCH 2024
LA - BEACH CITIES ATTACHED HOMES
MARKET TREND
MEDIAN DATA REVIEW | MARCH
LA - BEACH CITIES MARKET SUMMARY | MARCH 2024
• The attached luxury market is a Seller's Market with a 31% Sales Ratio.
• Homes sold for a median of 100.00% of list price in March 2024.
• The most active price band is $1,300,000-$1,349,999, where the sales ratio is 250%
• The median luxury sales price for attached homes is $1,700,500.
• The median days on market for March 2024 was 17 days, remaining the same from March 2023.
132 124 122 136 157 141 169 175 153 115 146 165 156 42 41 75 59 43 70 47 53 49 40 34 40 48 $1,730,000 $1,735,000 $1,610,000 $1,700,000 $1,650,000 $1,605,000 $1,600,000 $1,599,000 $1,665,000 $1,576,000 $1,700,000 $1,664,194 $1,700,500 Mar-23 Apr-23 May-23 Jun-23 Jul-23 Aug-23 Sep-23 Oct-23 Nov-23 Dec-23 Jan-24 Feb-24 Mar-24 3Square foot table does not account for listings and solds where square foot data is not disclosed. 4Data reported
Active and Sold properties and does not include Pending properties. VARIANCE: 18 % 132 156 VARIANCE: 14 % 42 48 VARIANCE: - 2 % $1.73m $1.70m SALES PRICE VARIANCE: 0 % 17 17 DAYS ON MARKET VARIANCE: 0 % 100.00% 100.00% SALE TO LIST PRICE RATIO VARIANCE: - 3 % $1,016 $984 SALE PRICE PER SQFT.
includes
Mar. 2023 Mar. 2024 Mar. 2023 Mar. 2024 Mar. 2023 Mar. 2024 Mar. 2023 Mar. 2024 Mar. 2023 Mar. 2024 Mar. 2023 Mar. 2024
TOTAL INVENTORY TOTAL SOLDS Luxury Benchmark Price 1: $1,260,000
13 - MONTH LUXURY
4 Solds Median Sales Price Inventory
Thank you for taking time to view this report. For more information about this report and the services I can offer you and your luxury property, please give me a call at 310.846.1117.
- Franco Martinez
FRANCO MARTINEZ
| franco.martinez@exprealty.com | www.francomartinez.realtor
310.846.1117