LUXURY REPORT EXPLAINED –
The Institute for Luxury Home Marketing has analyzed a number of metrics — including sales prices, sales volumes, number of sales, sales-price-to-list-price ratios, days on market and price-per-square-foot – to provide you a comprehensive North American Luxury Market report.
Additionally, we have further examined all of the individual luxury markets to provide both an overview and an in-depth analysis - including, where data is sufficient, a breakdown by luxury single-family homes and luxury attached homes.
It is our intention to include additional luxury markets on a continual basis. If your market is not featured, please contact us so we can implement the necessary qualification process. More in-depth reports on the luxury communities in your market are available as well.
Looking through this report, you will notice three distinct market statuses, Buyer's Market, Seller's Market, and Balanced Market. A Buyer's Market indicates that buyers have greater control over the price point. This market type is demonstrated by a substantial number of homes on the market and few sales, suggesting demand for residential properties is slow for that market and/or price point.
By contrast, a Seller's Market gives sellers greater control over the price point. Typically, this means there are few homes on the market and a generous demand, causing competition between buyers who ultimately drive sales prices higher.
A Balanced Market indicates that neither the buyers nor the sellers control the price point at which that property will sell and that there is neither a glut nor a lack of inventory. Typically, this type of market sees a stabilization of both the list and sold price, the length of time the property is on the market as well as the expectancy amongst homeowners in their respective communities – so long as their home is priced in accordance with the current market value.
REPORT
GLOSSARY
REMAINING INVENTORY: The total number of homes available at the close of a month.
DAYS ON MARKET: Measures the number of days a home is available on the market before a purchase offer is accepted.
LUXURY BENCHMARK PRICE: The price point that marks the transition from traditional homes to luxury homes.
NEW LISTINGS: The number of homes that entered the market during the current month.
PRICE PER SQUARE FOOT: Measures the dollar amount of the home's price for an individual square foot.
SALES RATIO: Sales Ratio defines market speed and determines whether the market currently favors buyers or sellers. A Buyer's Market has a Sales Ratio of less than 12%; a Balanced Market has a ratio of 12% up to 21%; a Seller's Market has a ratio of 21% or higher. A Sales Ratio greater than 100% indicates the number of sold listings exceeds the number of listings available at the end of the month.
SP/LP RATIO: The Sales Price/List Price Ratio compares the value of the sold price to the value of the list price.
–
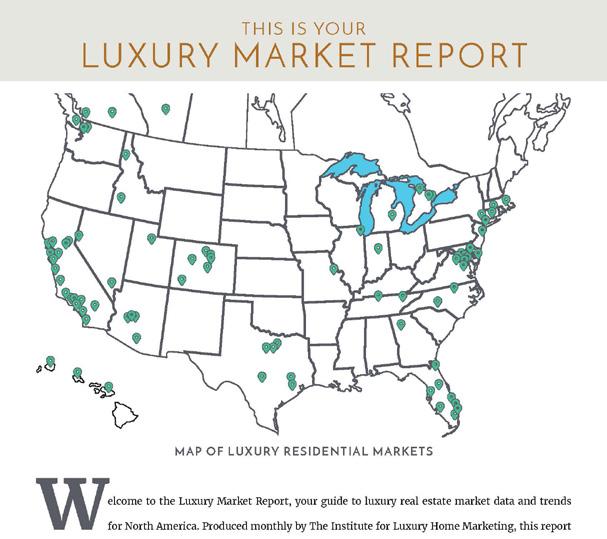
THIS IS YOUR LUXURY MARKET REPORT
MAP OF LUXURY RESIDENTIAL MARKETS
Welcome to the Luxury Market Report, your guide to luxury real estate market data and trends for North America. Produced monthly by The Institute for Luxury Home Marketing, this report provides an in-depth look at the top residential markets across the United States and Canada. Within the individual markets, you will find established luxury benchmark prices and detailed survey of luxury active and sold properties designed to showcase current market status and recent trends. The national report illustrates a compilation of the top North American markets to review overall standards and trends.
Copyright © 2023 Institute for Luxury Home Marketing | www.luxuryhomemarketing.com | 214.485.3000
The Luxury Market Report is a monthly analysis provided by The Institute for Luxury Home Marketing. Luxury benchmark prices are determined by The Institute. This active and sold data has been provided by REAL Marketing, who has compiled the data through various sources, including local MLS boards, local tax records and Realtor.com. Data is deemed reliable to the best of our knowledge, but is not guaranteed.
NORTH AMERICAN LUXURY REVIEW
A Stronger but Variable Spring Market
March, often heralded as the commencement of the spring market, not only marks the awakening of nature but also provides insights into the trajectory of the real estate landscape for the ensuing months.
After six months of steadily increasing levels of inventory and sales, March’s statistics also tell a story of continued strength. Positive seller sentiment is reflected in the uptick of new properties entering the market, which in turn, is fueling the opportunity for buyers to fulfill their new home expectations.
In the luxury single-family market, inventory levels grew by 24.1% compared to March 2023, and by 5.8% compared to February 2024. New inventory entering the market also comparatively increased by 18.7% and 9.4%, respectively.
In the luxury attached property, market inventory levels grew by 37.7% compared to March 2023, although fell by 5.1% compared to February 2024. Comparatively, new inventory entering the market increased by 20.8% but fell by 3.8%, respectively.
Although inventory has increased annually for both single-family and attached properties, it still needs to be recognized that active listings remain approximately 40% lower than pre-pandemic levels.
Sales, on the other hand, have increased both year-over-year and month-over-month. Sales of luxury single-family homes grew by 7.5% compared to March 2023, but more significantly by 31.1% compared to February 2024. Sales of luxury attached properties grew by 6.3% compared to March 2023, but again more significantly by 25.7% compared to February 2024.
This higher demand for luxury properties also saw homes close quicker during March, selling nine days faster than in February 2024 for single-family homes and ten days faster for attached properties.
Overall, the market is showing that it has become more favorable to sellers, with the sales ratio for
single-family homes at 27.4% and 23.2% for attached properties. This is a change from the last few months, which saw the trend move towards a more balanced market.
Typically, the sales ratio, i.e., how fast the market is moving, is a great way to measure the status (i.e., buyer, seller or balanced markets), as it compares the level of inventory remaining against the number of sold properties for that month.
Market Dynamics: Not All Markets are Equal.
March’s trend back to a seller’s market is mostly due to the significant increase in sales that, despite considerable increases in new listings, still saw the overall inventory level remain below the 10-year norm.
However, this is not true at the local level, where significant differences between markets have continued to increase over the last few months. Some markets have become more favorable for buyers, while others remain firmly in control of the sellers, and the remainder are favorable to neither.
For instance, East Bay saw a sales ratio of 138.1%, indicating that there were more sales than new listings entering the market during March. Greater Seattle saw 86.2 out of every 100 homes sell, i.e., an 86.2% sales ratio, and St. Louis saw 82 out of every 100 homes sell during March.
At the other end of the spectrum, Whistler in Canada saw very few sales, with a 1.4% sales ratio for its luxury homes. Fountain Hills in Arizona reported only 4.8 luxury homes sold out of 100 i.e., a 4.8% sales ratio, while South Walton in Florida fared slightly better with a 6.7% sales ratio.

On the balanced side, three Florida markets: Coastal Pinellas, Marco Island, and Broward County all reported sales ratios trending downward into the 12 percentiles, thereby leaning towards a buyer’s market. Whereas Toronto, Kauai, and Sonoma County in California trended upwards into the 20 percentiles, towards a seller’s market.
Equally confusing is that in some markets, home prices continue to increase, while in others, they are on a downward trajectory. Different price bands within the same market also report differing results, and it’s not always the lower-priced properties that are selling the fastest!
Additionally, results can seem to be inconsistent from month to month, especially in smaller luxury markets where the sales volume is traditionally low, and prices cover a very broad range!
So how are buyers and sellers meant to understand whether it’s a good time to buy or sell?

Interpreting Statistical Data
Statistical data at the macro level not only provides us with an insight into the overall sentiment of buyers and sellers but also an objective overview of market trends, as it’s based on empirical evidence and quantitative analysis.
At the local level, statistical data is even more important because it is less prone to bias and subjectivity, unlike anecdotal evidence or personal opinions. By examining various metrics, including property prices, sales volumes, local economic influences, and demographic trends, buyers and sellers will be able to gain clearer insights.
Drilling down even further, one of the most important parameters to consider is the level of available inventory for similar properties within the buyer’s or seller’s local market - not always an easy task in the luxury segment, where homes often have a list of unique attributes.
This needs to be taken in conjunction with reviewing the availability of properties in the same price point, property type, or specific neighborhood. By comparing this data to historical performance, it can identify long-term trends, cyclical patterns, and seasonal variations, all of which allow the buyer or seller to make an informed decision about the potential risk and/or return.
In addition, understanding whether currently listed properties have been on the market for a while or if any are unlikely to meet buyer expectations is important, as these factors can often distort the true demand for a specific property.
– LUXURY MONTHLY MARKET REVIEW –
Median prices represent properties priced above respective city benchmark prices. Prices shown for Canadian cites are shown in Canadian Dollars.
SINGLE FAMILY HOMES ATTACHED HOMES State Market Name List Price Sold Price DOM Ratio Market List Price Sold Price DOM Ratio Market AB Calgary - - - - - - - - -AZ Chandler and Gilbert $1,100,000 $1,072,500 49 37.1% Seller's - - - -AZ Flagstaff $1,542,500 $1,625,500 54 22.9% Seller's - - - -AZ Fountain Hills $2,439,498 $3,250,000 33 4.8% Buyer's $676,950 $747,500 26 18.8% Balanced AZ Mesa $899,900 $829,500 45 46.0% Seller's - - - -AZ Paradise Valley $6,375,000 $3,607,500 58 12.6% Balanced - - - -AZ Phoenix $925,000 $810,000 39 40.5% Seller's - - - -AZ Scottsdale $2,199,000 $1,800,000 53 19.8% Balanced $904,000 $800,000 51 28.3% Seller's AZ Tucson $714,595 $684,490 17 27.7% Seller's - - - -BC Okanagan Valley $1,739,000 $1,618,500 51 3.1% Buyer's - - - -BC Vancouver $4,290,000 $3,275,000 18 7.3% Buyer's $1,889,400 $1,749,900 12 10.7% Buyer's BC Victoria - - - - - - - - -BC Whistler $5,594,500 $12,000,000 209 1.4% Buyer's $2,499,000 $2,750,000 20 11.9% Buyer's CA Central Coast $2,999,500 $2,500,000 20 24.5% Seller's $1,372,500 $1,169,000 9 35.0% Seller's CA East Bay $2,486,500 $1,980,000 8 138.1% Seller's $1,091,500 $1,175,000 8 118.1% Seller's CA Greater Palm Springs $1,995,000 $1,739,500 46 25.5% Seller's - - - -CA Lake Tahoe $2,972,500 $1,920,000 49 28.7% Seller's $1,450,000 $1,100,000 10 7.7% Buyer's CA Los Angeles Beach Cities $5,995,000 $3,850,000 35 14.9% Balanced $1,997,500 $1,700,500 17 30.8% Seller's CA Los Angeles City $4,950,000 $3,486,362 22 14.4% Balanced $1,749,000 $1,485,000 21 19.5% Balanced CA Los Angeles The Valley $2,870,000 $2,255,000 21 28.9% Seller's $779,000 $810,000 22 67.2% Seller's CA Marin County $3,675,000 $3,225,000 12 37.3% Seller's $1,510,405 $1,355,000 14 43.3% Seller's CA Napa County $3,325,000 $2,025,000 66 8.2% Buyer's - - - -CA Orange County $3,520,000 $2,200,000 15 54.0% Seller's $1,299,000 $1,187,500 12 98.1% Seller's CA Placer County $1,199,000 $1,137,961 25 36.0% Seller's - - - -CA Sacramento $975,000 $925,000 14 41.0% Seller's - - - -CA San Diego $2,649,000 $1,850,000 9 47.0% Seller's $1,312,414 $1,000,000 8 57.9% Seller's CA San Francisco $4,840,000 $3,680,000 10 38.5% Seller's $2,900,000 $2,500,000 14 19.3% Balanced CA San Luis Obispo County $1,795,000 $1,442,500 30 32.8% Seller's - - - -CA Silicon Valley $4,500,000 $3,476,500 8 76.0% Seller's $1,738,000 $1,660,000 8 63.0% Seller's CA Sonoma County $2,637,500 $1,890,000 29 20.9% Balanced $793,293 $731,500 19 50.0% Seller's CA Ventura County $2,487,500 $1,600,000 41 27.0% Seller's $797,000 $787,500 39 54.5% Seller's CO Boulder $2,295,000 $1,450,000 35 21.4% Seller's $964,500 $900,000 44 22.1% Seller's CO Colorado Springs $945,000 $842,000 40 24.1% Seller's $550,000 $628,500 32 17.8% Balanced CO Denver $1,650,000 $1,399,450 11 39.1% Seller's $850,000 $790,000 8 31.1% Seller's CO Douglas County $1,325,000 $1,157,000 28 33.3% Seller's $614,990 $598,950 12 58.8% Seller's CO Durango - - - - - - - - -CO Summit County $3,400,000 $2,400,000 29 26.5% Seller's $1,257,500 $1,337,500 18 21.7% Seller's CO Telluride $7,200,000 $4,000,000 84 6.8% Buyer's $3,150,000 $1,962,500 140 16.7% Balanced CO Vail $7,900,000 $2,692,500 47 18.4% Balanced $3,800,000 $3,372,500 84 21.7% Seller's
SINGLE FAMILY HOMES ATTACHED HOMES State Market Name List Price Sold Price DOM Ratio Market List Price Sold Price DOM Ratio Market CT Central Connecticut $700,000 $636,250 47 46.2% Seller's - - - -CT Coastal Connecticut $2,495,000 $1,825,000 77 23.5% Seller's $995,513 $875,000 55 46.2% Seller's DC Washington D.C. $3,950,000 $3,005,000 11 26.9% Seller's $1,897,475 $1,587,500 8 24.8% Seller's DE Sussex County Coastal $1,599,990 $1,520,908 37 16.1% Balanced $1,150,000 $875,000 6 52.0% Seller's FL Boca Raton/Delray Beach $2,992,500 $1,867,000 61 18.0% Balanced $1,022,500 $846,439 43 19.4% Balanced FL Brevard County $825,000 $777,500 12 25.8% Seller's $715,000 $705,000 43 10.3% Buyer's FL Broward County $1,749,000 $1,450,000 59 12.3% Balanced $698,850 $630,000 41 12.1% Balanced FL Coastal Pinellas County $2,000,000 $1,721,350 47 12.1% Balanced $1,200,000 $1,127,000 38 14.5% Balanced FL Ft. Lauderdale $5,499,500 $4,200,000 141 11.4% Buyer's $2,495,000 $2,525,000 83 6.8% Buyer's FL Jacksonville Beaches $1,350,000 $1,150,000 14 18.9% Balanced $1,015,000 $1,065,000 38 17.7% Balanced FL Lee County $1,442,500 $1,266,000 56 11.9% Buyer's $849,000 $720,000 40 13.0% Balanced FL Marco Island $2,800,000 $2,122,500 75 12.2% Balanced $1,699,000 $1,987,500 31 17.5% Balanced FL Miami $2,097,500 $1,326,000 66 11.3% Buyer's $1,495,000 $1,325,000 106 7.5% Buyer's FL Naples $5,525,000 $3,960,000 68 9.0% Buyer's $2,380,000 $2,350,000 76 12.4% Balanced FL Orlando $1,290,000 $1,160,000 30 20.2% Balanced $560,000 $580,000 22 11.2% Buyer's FL Palm Beach Towns $4,875,000 $3,025,000 122 12.0% Buyer's $2,164,500 $1,875,000 99 8.2% Buyer's FL Sarasota & Beaches $2,594,990 $2,285,000 34 9.2% Buyer's $1,600,000 $1,370,000 44 18.5% Balanced FL South Pinellas County $1,495,000 $1,336,966 28 18.4% Balanced $1,050,000 $1,000,000 43 15.1% Balanced FL South Walton $2,599,000 $1,850,000 61 6.7% Buyer's $1,272,500 $1,307,500 37 10.3% Buyer's FL Tampa $750,000 $727,500 30 29.2% Seller's $871,950 $645,000 45 20.1% Balanced GA Atlanta $1,700,000 $1,169,500 6 28.7% Seller's $709,900 $646,500 19 28.0% Seller's GA Duluth $1,477,500 $1,291,000 10 29.2% Seller's - - - -HI Island of Hawaii $1,988,000 $1,762,500 37 16.7% Balanced $1,850,000 $1,650,000 6 37.5% Seller's HI Kauai $3,180,000 $2,200,000 58 20.8% Balanced $1,450,000 $1,265,000 49 25.5% Seller's HI Maui $3,800,000 $2,700,000 106 13.3% Balanced $2,000,000 $1,950,000 109 21.4% Seller's HI Oahu $2,991,500 $2,100,000 17 19.1% Balanced $1,248,000 $895,000 36 12.8% Balanced IA Greater Des Moines $655,900 $595,000 80 16.1% Balanced - - - -ID Ada County $799,948 $750,000 26 48.8% Seller's $617,000 $578,500 15 37.7% Seller's ID Northern Idaho $1,712,500 $1,182,500 74 7.5% Buyer's - - - -IL Chicago $1,695,000 $1,300,000 14 43.4% Seller's $1,250,000 $916,500 39 23.1% Seller's IL DuPage County $1,299,998 $905,000 15 41.5% Seller's $750,000 $633,261 33 90.5% Seller's IL Lake County $1,339,000 $945,000 13 36.5% Seller's - - - -IL Will County $700,000 $650,000 9 50.7% Seller's - - - -IN Hamilton County $862,495 $727,728 5 64.9% Seller's - - - -KS Johnson County $825,961 $831,820 32 22.4% Seller's $638,500 $594,000 38 14.5% Balanced MA Cape Cod $2,529,500 $1,970,120 24 13.3% Balanced $1,095,000 $852,000 19 13.6% Balanced MA Greater Boston $3,844,000 $2,587,500 16 14.3% Balanced $2,497,000 $1,865,000 22 17.1% Balanced MA South Shore $1,999,000 $1,375,980 34 19.0% Balanced $875,000 $852,500 15 40.0% Seller's MD Anne Arundel County $1,129,390 $950,000 6 63.0% Seller's $607,495 $554,178 5 111.5% Seller's
Median prices represent properties priced above respective city benchmark prices. Prices shown for Canadian cites are shown in Canadian Dollars. – LUXURY MONTHLY MARKET REVIEW –
Median
respective
in Canadian Dollars.
SINGLE FAMILY HOMES ATTACHED HOMES State Market Name List Price Sold Price DOM Ratio Market List Price Sold Price DOM Ratio Market MD Baltimore City $949,472 $809,250 5 40.0% Seller's $695,000 $632,380 8 26.2% Seller's MD Baltimore County $1,132,000 $950,000 9 31.5% Seller's $626,985 $635,000 7 126.7% Seller's MD Frederick County $889,995 $855,000 7 23.0% Seller's - - - -MD Howard County $1,199,995 $1,070,000 5 69.6% Seller's $719,990 $650,000 4 135.3% Seller's MD Montgomery County $2,055,823 $1,575,000 7 48.9% Seller's $869,900 $742,018 8 105.3% Seller's MD Talbot County $3,295,000 $1,080,000 27 15.9% Balanced - - - -MD Worcester County $1,099,000 $825,500 16 21.8% Seller's $675,000 $622,500 15 30.0% Seller's MI Grand Traverse $1,175,829 $892,000 57 15.9% Balanced - - - -MI Livingston County $749,999 $650,000 13 25.9% Seller's - - - -MI Monroe County $755,000 $582,500 66 11.8% Buyer's - - - -MI Oakland County $865,680 $670,000 11 49.2% Seller's $689,250 $620,000 19 52.1% Seller's MI Washtenaw County $959,500 $699,900 29 33.0% Seller's $699,990 $620,575 43 30.2% Seller's MI Wayne County $739,900 $614,500 8 46.9% Seller's $713,309 $680,000 38 11.1% Buyer's MN Olmsted County $899,450 $899,900 71 19.8% Balanced - - - -MN Twin Cities $1,252,450 $1,075,000 16 19.1% Balanced - - - -MO Kansas City $729,950 $659,500 19 27.9% Seller's - - - -MO St. Louis $748,052 $625,278 6 81.6% Seller's - - - -NC Asheville $1,172,500 $918,500 25 26.5% Seller's $679,900 $742,000 29 28.6% Seller's NC Charlotte $1,335,000 $957,500 4 59.2% Seller's $650,000 $624,342 11 51.9% Seller's NC Lake Norman $1,349,000 $1,050,000 9 38.2% Seller's $585,000 $599,900 55 84.0% Seller's NC Raleigh-Durham $1,295,000 $940,000 3 50.1% Seller's - - - -NH Rockingham County $1,549,500 $1,325,000 4 32.1% Seller's $890,400 $872,950 6 40.9% Seller's NJ Bergen County $2,695,000 $1,795,000 34 18.7% Balanced $1,265,080 $1,210,000 39 31.6% Seller's NJ Morris County $1,899,000 $1,350,500 26 38.8% Seller's $789,000 $718,000 13 53.3% Seller's NJ Ocean County $999,999 $810,000 31 26.2% Seller's $999,900 $727,450 41 23.2% Seller's NM Taos $1,395,000 $975,000 83 8.8% Buyer's - - - -NV Lake Tahoe $5,249,000 $2,450,000 146 24.6% Seller's $1,350,000 $1,200,000 207 20.0% Balanced NV Las Vegas $1,839,900 $1,380,000 24 19.4% Balanced - - - -NV Reno $2,437,500 $1,650,000 73 16.7% Balanced - - - -NY Dutchess & Putnam Counties $1,100,000 $930,000 64 11.8% Buyer's - - - -NY Manhattan - - - - - $4,800,000 $3,826,000 119 8.1% Buyer's NY Nassau County $1,906,650 $1,500,000 53 18.3% Balanced $1,599,000 $1,475,000 116 13.5% Balanced NY Rockland, Orange, & Ulster $1,250,000 $995,000 48 14.4% Balanced - - - -NY Staten Island $1,188,000 $982,500 105 7.6% Buyer's $645,000 $590,000 47 23.5% Seller's NY Suffolk County $1,995,000 $1,300,000 76 10.9% Buyer's $749,990 $610,000 25 31.3% Seller's NY Westchester County $2,291,375 $1,700,000 34 20.4% Balanced - - - -OH Cincinnati $860,900 $690,000 3 29.3% Seller's - - - -OH Cleveland Suburbs $899,900 $600,000 33 42.9% Seller's - - - -OH Columbus $877,450 $744,405 6 51.7% Seller's $684,900 $616,875 38 24.3% Seller's
prices represent properties priced above
city benchmark prices. Prices shown for Canadian cites are shown
– LUXURY MONTHLY MARKET REVIEW –
SINGLE FAMILY HOMES ATTACHED HOMES State Market Name List Price Sold Price DOM Ratio Market List Price Sold Price DOM Ratio Market ON GTA - Durham $1,800,000 $1,500,000 9 27.6% Seller's $849,999 $845,000 27 59.4% Seller's ON GTA - York $2,580,000 $1,877,500 10 34.6% Seller's $799,000 $786,250 16 20.5% Balanced ON Hamilton $1,850,000 $1,650,000 27 14.2% Balanced $999,900 $875,000 20 28.2% Seller's ON Mississauga $3,099,925 $2,627,500 20 15.2% Balanced $982,900 $913,750 14 47.2% Seller's ON Oakville $3,049,450 $2,179,000 10 37.0% Seller's $1,349,000 $1,188,750 36 34.8% Seller's ON Toronto $3,888,000 $3,100,000 13 20.6% Balanced $1,239,000 $1,115,000 16 17.7% Balanced ON Waterloo Region $1,499,000 $1,300,000 14 33.3% Seller's $768,650 $745,500 12 25.7% Seller's OR Portland $1,395,000 $1,120,000 19 23.2% Seller's $675,000 $625,000 20 20.7% Balanced SC Charleston $1,780,000 $1,475,000 16 32.0% Seller's $1,223,000 $1,250,000 9 31.3% Seller's SC Hilton Head $1,995,000 $1,596,970 34 24.1% Seller's $1,195,000 $1,150,000 15 32.5% Seller's TN Greater Chattanooga $900,000 $950,000 6 17.6% Balanced - - - -TN Knoxville $908,500 $853,067 52 43.2% Seller's - - - -TN Nashville $1,827,735 $1,366,895 10 29.3% Seller's $769,000 $784,500 13 16.8% Balanced TX Austin $1,295,000 $1,015,000 20 22.0% Seller's $859,000 $775,000 32 10.3% Buyer's TX Collin County $750,000 $730,000 17 36.4% Seller's - - - -TX Dallas $1,400,000 $1,275,000 16 33.1% Seller's $695,800 $663,435 12 19.6% Balanced TX Denton County $810,000 $751,000 25 34.0% Seller's - - - -TX El Paso $639,000 $635,000 52 14.0% Balanced - - - -TX Fort Worth $860,950 $823,295 18 29.6% Seller's - - - -TX Greater Tyler $679,900 $587,000 19 10.1% Buyer's - - - -TX Houston $989,900 $920,000 30 28.1% Seller's $624,995 $618,000 30 25.0% Seller's TX Lubbock $699,975 $625,000 105 20.4% Balanced - - - -TX San Angelo $627,750 $624,000 85 7.9% Buyer's - - - -TX San Antonio $796,735 $754,500 64 18.9% Balanced $675,000 $1,000,000 34 7.6% Buyer's TX The Woodlands & Spring $890,000 $750,000 27 38.4% Seller's - - - -UT Park City $4,837,000 $3,313,500 38 14.1% Balanced $2,272,500 $2,975,000 22 18.0% Balanced UT Salt Lake City $1,297,000 $957,888 35 37.6% Seller's $606,011 $567,000 29 38.3% Seller's UT Washington County $1,495,000 $1,299,950 32 16.6% Balanced - - - -VA Arlington & Alexandria $2,599,875 $1,716,110 6 37.5% Seller's $1,167,500 $1,096,000 7 105.4% Seller's VA Fairfax County $2,341,515 $1,480,000 5 46.6% Seller's $820,775 $720,000 5 147.1% Seller's VA McLean & Vienna $3,149,975 $1,813,000 7 34.3% Seller's $1,425,000 $1,020,000 6 68.8% Seller's VA Richmond $800,000 $798,273 8 39.3% Seller's $577,815 $571,781 23 26.9% Seller's VA Smith Mountain Lake $1,748,750 $1,150,000 124 25.0% Seller's - - - -WA King County $2,150,000 $1,750,000 5 86.2% Seller's $1,200,794 $1,075,250 8 50.4% Seller's WA Seattle $1,995,000 $1,650,000 6 64.6% Seller's $1,495,000 $1,325,000 11 38.4% Seller's WA Spokane $1,139,950 $937,500 2 8.8% Buyer's - - - - -
Median prices represent properties priced above respective city benchmark prices. Prices shown for Canadian cites are shown in Canadian Dollars. – LUXURY MONTHLY MARKET REVIEW –
DALLAS TEXAS
2024 APRIL
LUXURY INVENTORY VS. SALES | MARCH 2024
Square Feet3 -RangePrice -Median SoldBeds -Median SoldBaths -Median SoldSold -TotalInventory -TotalSales Ratio -Sold/Inventory0 - 1,999 $837,000 3 2 13 18 72% 2,000 - 2,999 $850,000 4 3 38 109 35% 3,000 - 3,999 $1,200,000 4 4 64 173 37% 4,000 - 4,999 $1,575,000 5 5 48 121 40% 5,000 - 5,999 $2,325,000 5 6 15 60 25% 6,000+ $4,247,500 5 8 4 69 6%
SINGLE - FAMILY HOMES 1 The luxury threshold price is set by The Institute for Luxury Home Marketing. 2Sales Ratio defines market speed and market type: Buyer's < 12%; Balanced >= 12 to < 21%; Seller's >= 21%. If >100% MLS® data reported previous month’s sales exceeded current inventory. 12 5 3 12 13 15 28 54 48 86 60 61 49 64 40 0 0 0 2 0 2 1 13 14 38 34 15 15 31 17 $7,600,000+ $6,600,000 - $7,599,999 $5,600,000 - $6,599,999 $4,800,000 - $5,599,999 $4,000,000 - $4,799,999
- $3,999,999
- $3,399,999
- $2,799,999
- $2,199,999
- $1,799,999
- $1,399,999
- $1,199,999
Inventory
DALLAS
$3,400,000
$2,800,000
$2,200,000
$1,800,000
$1,400,000
$1,200,000
$1,000,000
$900,000 - $999,999 $800,000 - $899,999 $750,000 - $799,999
Sales
Seller's Market Total Inventory: 550 Total Sales: 182 Total Sales Ratio2 : 33% Luxury Benchmark Price 1: $750,000
DALLAS MARKET SUMMARY | MARCH 2024
• The single-family luxury market is a Seller's Market with a 33% Sales Ratio.
• Homes sold for a median of 98.75% of list price in March 2024.
• The most active price band is $1,200,000-$1,399,999, where the sales ratio is 57%
• The median luxury sales price for single-family homes is $1,275,000.
• The median days on market for March 2024 was 16 days, up from 15 in March 2023.
reported includes Active and Sold properties and does not include Pending properties.
MARCH 13 - MONTH LUXURY MARKET TREND 4 Solds Median Sales Price Inventory 407 436 434 476 482 511 555 596 568 381 414 485 550 130 169 210 219 190 167 142 165 152 117 102 139 182 $1,059,500 $1,087,000 $1,052,500 $1,090,000 $1,003,000 $1,075,000 $1,223,304 $1,181,460 $1,150,000 $1,265,000 $1,200,000 $1,115,000 $1,275,000 $1,275,000 Mar-23Apr-23May-23 Jun-23Jul-23 Aug-23Sep-23Oct-23 Nov-23 Dec-23Jan-24 Feb-24 Mar-24
foot data
MEDIAN DATA REVIEW |
3Square foot table does not account for listings and solds where square
is not disclosed. 4Data
SINGLE - FAMILY HOMES
VARIANCE: 35 % 407550 Mar. 2023Mar. 2024 TOTAL
VARIANCE: 40 % 130182 TOTAL SOLDS VARIANCE: 20 % $1.06m $1.28m SALES PRICE VARIANCE: 7 % 1516 DAYS ON MARKET VARIANCE: - 1 % 99.58% 98.75% SALE TO LIST PRICE RATIO VARIANCE: 3 % $355 $365 SALE PRICE PER SQFT. Mar. 2023Mar. 2024 Mar. 2023Mar. 2024 Mar. 2023Mar. 2024 Mar. 2023Mar. 2024 Mar. 2023Mar. 2024 Luxury Benchmark Price 1: $750,000
DALLAS
INVENTORY
Square Feet3 -RangePrice -Median SoldBeds -Median SoldBaths -Median SoldSold -TotalInventory -TotalSales Ratio -Sold/Inventory0 - 1,999 $600,000 2 3 14 91 15% 2,000 - 2,499 $693,740 3 3 20 67 30% 2,500 - 2,999 $699,900 3 4 9 36 25% 3,000 - 3,499 $2,950,000 3 5 1 15 7% 3,500 - 3,999 $1,637,250 4 4 2 11 18% 4,000+ NA NA NA 0 15 0% 43 3 5 4 6 5 2 3 6 9 11 15 31 35 57 2 0 2 0 0 1 1 0 1 3 3 6 7 8 12 $1,500,000+ $1,400,000 - $1,499,999 $1,300,000 - $1,399,999 $1,200,000 - $1,299,999 $1,100,000 - $1,199,999 $1,000,000 - $1,099,999 $950,000 - $999,999 $900,000 - $949,999 $850,000 - $899,999
- $849,999
$799,999
| MARCH 2024 Inventory Sales Luxury Benchmark Price 1: $530,000 Balanced Market Total Inventory: 235 Total Sales: 46 Total Sales Ratio2 : 20% 1 The luxury threshold price is set by The Institute for Luxury Home Marketing. 2Sales Ratio defines market speed and market type: Buyer's < 12%; Balanced >= 12 to < 21%; Seller's >= 21%. If >100% MLS® data reported previous month’s sales exceeded current inventory.
DALLAS ATTACHED HOMES
$800,000
$750,000 -
$700,000 - $749,999 $650,000 - $699,999 $600,000 - $649,999 $530,000 - $599,999 LUXURY INVENTORY VS. SALES
• The attached luxury market is a Balanced Market with a 20% Sales Ratio.
• Homes sold for a median of 100.00% of list price in March 2024.
• The most active price band is $950,000-$999,999, where the sales ratio is 50%
• The median luxury sales price for attached homes is $663,435.
• The median days on market for March 2024 was 12 days, down from 30 in March 2023.
111 131 161 165 184 173 200 222 234 173 208 213 235 54 38 59 55 40 42 43 43 29 34 38 37 46 $669,500 $672,450 $650,000 $660,000 $645,000 $750,000 $645,000 $655,000 $635,000 $695,000 $647,500 $645,000 $663,435 Mar-23Apr-23May-23 Jun-23Jul-23 Aug-23Sep-23Oct-23 Nov-23 Dec-23Jan-24 Feb-24 Mar-24 3Square foot table does not account for listings and solds where square foot data is not disclosed. 4Data reported includes Active and Sold properties and does not include Pending properties. VARIANCE: 112 % 111235 VARIANCE: - 15 % 5446 VARIANCE: - 1 % $670k $663k SALES PRICE VARIANCE: - 60 % 3012 DAYS ON MARKET VARIANCE: 0 % 100.00% 100.00% SALE TO LIST PRICE RATIO VARIANCE: 6 % $309 $327 SALE PRICE PER SQFT. DALLAS MARKET SUMMARY | MARCH 2024 DALLAS ATTACHED HOMES
Mar. 2023Mar. 2024 Mar. 2023Mar. 2024 Mar. 2023Mar. 2024 Mar. 2023Mar. 2024 Mar. 2023Mar. 2024 Mar. 2023Mar. 2024
| MARCH TOTAL INVENTORY TOTAL SOLDS Luxury Benchmark Price 1: $530,000 13 - MONTH LUXURY MARKET TREND 4 Solds Median Sales Price Inventory
MEDIAN DATA REVIEW
DENTON COUNTY TEXAS
2024 APRIL
$850,000 - $949,999
$800,000 - $849,999
$750,000 - $799,999
$700,000 - $749,999
$650,000 - $699,999
$600,000 - $649,999
$575,000 - $599,999
Square Feet3 -RangePrice -Median SoldBeds -Median SoldBaths -Median SoldSold -TotalInventory -TotalSales Ratio -Sold/Inventory0 - 2,999 $645,500 4 3 100 291 34% 3,000 - 3,999 $753,000 4 4 185 512 36% 4,000 - 4,999 $1,058,500 5 5 56 173 32% 5,000 - 5,999 $1,300,000 5 5 17 50 34% 6,000 - 6,999 $2,710,000 5 6 6 20 30% 7,000+ $2,565,000 7 8 1 25 4% DENTON COUNTY SINGLE - FAMILY HOMES 1 The luxury threshold price is set by The Institute for Luxury Home Marketing. 2Sales Ratio defines market speed and market type: Buyer's < 12%; Balanced >= 12 to < 21%; Seller's >= 21%. If >100% MLS® data reported previous month’s sales exceeded current inventory. 61 15 30 65 47 42 51 62 113 64 81 95 127 111 108 4 5 5 9 22 12 19 29 35 17 30 32 51 60 35 $2,700,000+ $2,250,000 - $2,699,999 $1,850,000 - $2,249,999 $1,450,000 - $1,849,999
- $1,449,999
- $1,249,999
$1,149,999
$1,250,000
$1,150,000
$1,050,000 -
$950,000 - $1,049,999
Inventory Sales
Seller's Market Total Inventory: 1,072 Total Sales: 365 Total Sales Ratio2 : 34% Luxury Benchmark Price 1: $575,000
LUXURY INVENTORY VS. SALES | MARCH 2024
DENTON
MARKET SUMMARY | MARCH 2024
• The single-family luxury market is a Seller's Market with a 34% Sales Ratio.
• Homes sold for a median of 98.49% of list price in March 2024.
• The most active price band is $600,000-$649,999, where the sales ratio is 54%
• The median luxury sales price for single-family homes is $751,000.
• The median days on market for March 2024 was 25 days, down from 26 in March 2023.
13 - MONTH LUXURY MARKET TREND 4 Solds Median Sales Price Inventory 777 780 931 1,127 1,210 1,174 1,109 1,157 1,131 887 905 961 1,072 345 361 435 459 404 423 354 279 251 274 220 231 365 $720,000 $723,000 $739,018 $750,000 $755,000 $735,000 $750,000 $745,000 $705,000 $735,906 $738,250 $758,000 $751,000 $735,000 Mar-23 Apr-23 May-23 Jun-23 Jul-23 Aug-23 Sep-23 Oct-23 Nov-23 Dec-23 Jan-24 Feb-24 Mar-24 3Square foot table does not account for listings and solds where square foot data is not disclosed.
Active and Sold properties and does not
MEDIAN DATA REVIEW | MARCH
4Data reported includes
include Pending properties.
- FAMILY HOMES
DENTON COUNTY SINGLE
VARIANCE: 38 % 777 1,072 Mar. 2023 Mar. 2024 TOTAL INVENTORY VARIANCE: 6 % 345 365 TOTAL SOLDS VARIANCE: 4 % $720k $751k SALES PRICE VARIANCE: - 4 % 26 25 DAYS ON MARKET VARIANCE: 0 % 98.80% 98.49% SALE TO LIST PRICE RATIO VARIANCE: 4 % $226 $235 SALE PRICE PER SQFT. Mar. 2023 Mar. 2024 Mar. 2023 Mar. 2024 Mar. 2023 Mar. 2024 Mar. 2023 Mar. 2024 Mar. 2023 Mar. 2024 Luxury Benchmark Price 1: $575,000
COUNTY
COLLIN COUNTY TEXAS
2024 APRIL
Square Feet3 -RangePrice -Median SoldBeds -Median SoldBaths -Median SoldSold -TotalInventory -TotalSales Ratio -Sold/Inventory0 - 2,999 $617,000 4 3 151 433 35% 3,000 - 3,999 $750,000 4 4 228 579 39% 4,000 - 4,999 $1,015,000 5 5 67 206 33% 5,000 - 5,999 $1,527,500 5 5 26 59 44% 6,000 - 6,999 $2,525,000 5 6 8 28 29% 7,000+ $2,150,000 6 8 3 23 13% COLLIN COUNTY SINGLE - FAMILY HOMES 1 The luxury threshold price is set by The Institute for Luxury Home Marketing. 2Sales Ratio defines market speed and market type: Buyer's < 12%; Balanced >= 12 to < 21%; Seller's >= 21%. If >100% MLS® data reported previous month’s sales exceeded current inventory. 13 14 40 14 19 40 61 95 105 143 123 112 168 191 190 0 5 8 3 9 15 12 36 28 64 46 49 50 69 89 $4,000,000+ $3,000,000 - $3,999,999 $2,000,000 - $2,999,999 $1,800,000 - $1,999,999 $1,600,000 - $1,799,999 $1,400,000 - $1,599,999
- $1,399,999
- $1,199,999
- $999,999
- $899,999
- $799,999
- $749,999
- $699,999
- $649,999
- $599,999 Inventory Sales
Seller's Market Total Inventory: 1,328 Total Sales: 483 Total Sales Ratio2 : 36% Luxury Benchmark Price 1: $550,000
$1,200,000
$1,000,000
$900,000
$800,000
$750,000
$700,000
$650,000
$600,000
$550,000
LUXURY INVENTORY VS. SALES | MARCH 2024
COLLIN COUNTY MARKET SUMMARY | MARCH 2024
• The single-family luxury market is a Seller's Market with a 36% Sales Ratio.
• Homes sold for a median of 99.30% of list price in March 2024.
• The most active price band is $550,000-$599,999, where the sales ratio is 47%
• The median luxury sales price for single-family homes is $730,000.
• The median days on market for March 2024 was 17 days, down from 26 in March 2023.
13 - MONTH
MARKET
4 Solds Median Sales Price Inventory 959 976 1,091 1,223 1,342 1,392 1,308 1,344 1,275 1,033 1,049 1,167 1,328 517 523 645 695 576 589 452 427 351 409 305 381 483 $710,000 $709,208 $700,000 $725,000 $712,200 $718,683 $700,000 $709,990 $702,969 $720,000 $699,000 $700,000 $730,000 Mar-23 Apr-23 May-23 Jun-23 Jul-23 Aug-23 Sep-23 Oct-23 Nov-23 Dec-23 Jan-24 Feb-24 Mar-24 3Square foot table
for listings and solds where square foot data is not disclosed.
Active
MEDIAN DATA REVIEW | MARCH
LUXURY
TREND
does not account
4Data reported includes
and Sold properties and does not include Pending properties.
- FAMILY HOMES
COLLIN COUNTY SINGLE
VARIANCE: 38 % 959 1,328 Mar. 2023 Mar. 2024 TOTAL
VARIANCE: - 7 % 517 483 TOTAL SOLDS VARIANCE: 3 % $710k $730k SALES PRICE VARIANCE: - 35 % 26 17 DAYS ON MARKET VARIANCE: 1 % 98.51% 99.30% SALE TO LIST PRICE RATIO VARIANCE: 5 % $220 $230 SALE PRICE PER SQFT. Mar. 2023 Mar. 2024 Mar. 2023 Mar. 2024 Mar. 2023 Mar. 2024 Mar. 2023 Mar. 2024 Mar. 2023 Mar. 2024 Luxury Benchmark Price 1: $550,000
INVENTORY
Thank you for taking time to view this report. For more information about this report and the services I can offer you and your luxury property, please give me a call at 972.849.4424.
- Ed Thomas


ED THOMAS
| etjrealtor@gmail.com | edwardthomas.exprealty.com
972.849.4424