– LUXURY MONTHLY MARKET REVIEW – A Review of Key Market Differences Year over Year August 2020 | August 2021
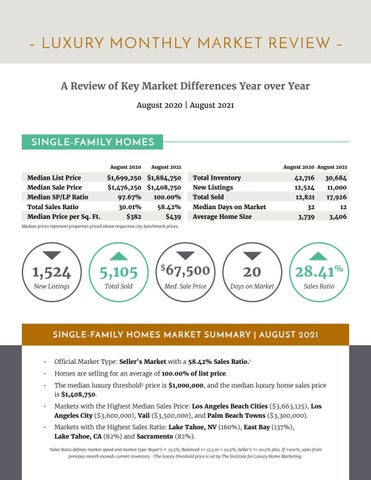
SINGLE-FAMILY HOMES August 2020
August 2021
August 2020 August 2021
Median List Price
$1,699,250 $1,884,750
Total Inventory
42,716
30,684
Median Sale Price
$1,476,250 $1,408,750
New Listings
12,524
11,000
Total Sold
12,821
17,926
32
12
3,739
3,406
Median SP/LP Ratio
97.67%
100.00%
Total Sales Ratio
30.01%
58.42%
$382
$439
Median Price per Sq. Ft.
Median Days on Market Average Home Size
Median prices represent properties priced above respective city benchmark prices.
1,524
5,105
New Listings
Total Sold
20
28.41%
Med. Sale Price
Days on Market
Sales Ratio
67,500
$
SINGLE-FAMILY HOMES MARKET SUMMARY | AUGUST 2021 •
Official Market Type: Seller's Market with a 58.42% Sales Ratio.1
•
Homes are selling for an average of 100.00% of list price.
•
The median luxury threshold2 price is $1,000,000, and the median luxury home sales price is $1,408,750.
•
Markets with the Highest Median Sales Price: Los Angeles Beach Cities ($3,663,125), Los Angeles City ($3,600,000), Vail ($3,500,000), and Palm Beach Towns ($3,300,000).
•
Markets with the Highest Sales Ratio: Lake Tahoe, NV (160%), East Bay (137%), Lake Tahoe, CA (82%) and Sacramento (82%). 1
Sales Ratio defines market speed and market type: Buyer's < 15.5%; Balanced >= 15.5 to < 20.5%; Seller's >= 20.5% plus. If >100%, sales from previous month exceeds current inventory. 2The luxury threshold price is set by The Institute for Luxury Home Marketing.


