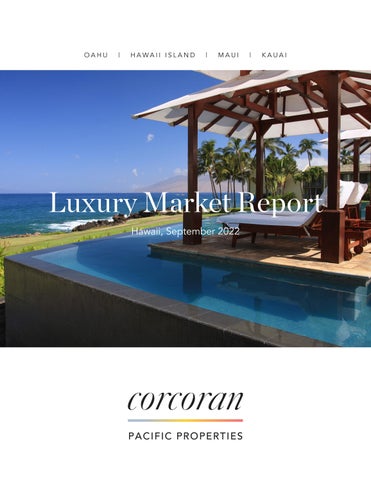
Luxury Market Report

Hawaii, September 2022
 OAHU | HAWAII ISLAND | MAUI | KAUAI
Hawaii, September 2022
OAHU | HAWAII ISLAND | MAUI | KAUAI

Corcoran Pacific Properties, the exclusive Hawaii franchisee of The Corcoran Group, is a locally owned and operated company, founded in 2005 with a simple philosophy: treating every client as a friend, and every transaction as if it was our own.
Over the past 17+ years, honoring this philosophy, we established a culture of service and efficiency fueled by high-tech, smart investments in agents, and the tools they need to deliver world-class service while helping clients achieve their real estate goals.
By choosing only the most successful, experienced real estate professionals and dedicating every resource to support their success, we’ve grown to be the brokerage of choice serving Kauai, Oahu, Maui and Hawaii Island.
With our clients at the heart of our business, Corcoran Pacific Properties is dedicated to excellence, innovation and to continuously raising the bar when it comes to impeccable service, expert insight and a relationship-first approach.
 ©2020 Corcoran Pacific Properties. All rights reserved. Corcoran® and the Corcoran Logo are registered service marks owned by Corcoran Group LLC. Corcoran Pacific Properties fully supports the principles ofthe Fair Housing Act and the Equal Opportunity Act. Each franchise is independently owned and operated.
Princeville

Page 5
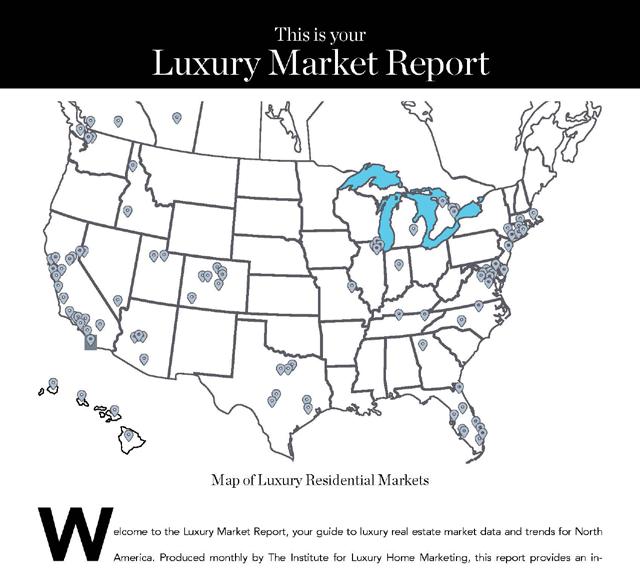
Luxury Report Explained
Page 6 Welcome Message
Page 7 Hawaii Luxury Market Review

Page 8-13 Oahu Market Review
Page 14-19 Island of Hawaii Market Review
Page 20-25 Maui Market Review
Page 26-31 Kauai Market Review
Page 33-36 North American Luxury Market Review
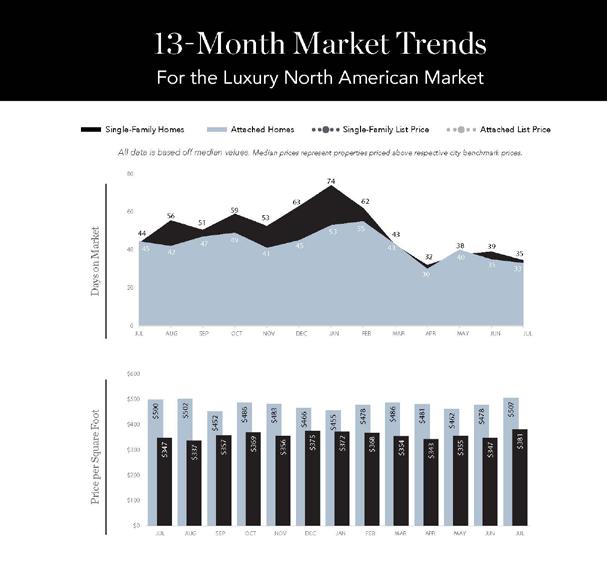
Page 37 13-Month Market Trends
Page 38 Single-Family Homes Monthly Overview
Page 39 Attached Homes Monthly Overview
Page 48 Thank You!
The Institute for Luxury Home Marketing has analyzed a number of metrics — including sales prices, sales volumes, number of sales, sales-price-to-list-price ratios, days on market and price-per-squarefoot – to provide you a comprehensive North American Luxury Market report.
Additionally, we have further examined all of the individual luxury markets to provide both an overview and an in-depth analysis - including, where data is sufficient, a breakdown by luxury single-family homes and luxury attached homes.
It is our intention to include additional luxury markets on a continual basis. If your market is not featured, please contact us so we can implement the necessary qualification process. More indepth reports on the luxury communities in your market are available as well.
Looking through this report, you will notice three distinct market statuses, Buyer's Market, Seller's Market, and Balanced Market. A Buyer's Market indicates that buyers have greater control over the price point. This market type is demonstrated by a substantial number of homes on the market and few sales, suggesting demand for residential properties is slow for that market and/ or price point.
By contrast, a Seller's Market gives sellers greater control over the price point. Typically, this means there are few homes on the market and a generous demand, causing competition between buyers who ultimately drive sales prices higher.
A Balanced Market indicates that neither the buyers nor the sellers control the price point at which that property will sell and that there is neither a glut nor a lack of inventory. Typically, this type of market sees a stabilization of both the list and sold price, the length of time the property is on the market as well as the expectancy amongst homeowners in their respective communities – so long as their home is priced in accordance with the current market value.
REMAINING INVENTORY: The total number of homes available at the close of a month.
DAYS ON MARKET: Measures the number of days a home is available on the market before a purchase offer is accepted.
LUXURY BENCHMARK PRICE: The price point that marks the transition from traditional homes to luxury homes.
NEW LISTINGS: The number of homes that entered the market during the current month.
PRICE PER SQUARE FOOT: Measures the dollar amount of the home's price for an individual square foot.
SALES RATIO: Sales Ratio defines market speed and determines whether the market currently favors buyers or sellers. Buyer's Market = up to 14%; Balanced Market = 15 to 20%; Seller's Market = 21% plus. If >100%, sales from previous month exceed current inventory.
SP/LP RATIO: The Sales Price/List Price Ratio compares the value of the sold price to the value of the list price.
Welcome to the Luxury Market Report, your guide to luxury real estate market data and trends for North America. Produced monthly by The Institute for Luxury Home Marketing, this report provides an in-depth look at the top residential markets across the United States and Canada. Within the individual markets, you will find established luxury benchmark prices and detailed survey of luxury active and sold properties designed to showcase current market status and recent trends. The national report illustrates a compilation of the top North American markets to review overall standards and trends.
Copyright © 2020 Institute for Luxury Home Marketing | www.luxuryhomemarketing.com | 214.485.3000
The Luxury Market Report is a monthly analysis provided by The Institute for Luxury Home Marketing. Luxury benchmark prices are determined by The Institute. This active and sold data has been compiled by various sources, including local MLS boards, local tax records and Realtor.com. Data is deemed reliable to the best of our knowledge, but is not guaranteed.
Corcoran Pacific Properties is pleased to present a closer look at the luxury real estate market in Hawaii, which includes detailed statistical analysis of Oahu, the Island of Hawaii, Maui and Kauai for August 2022.

Similar to trends reported in the North American luxury market report article on page 33, the current market data for the state of Hawaii also reflects the luxury market is transitioning.
A review of market activity for the month of August suggests that the Hawaii real estate market continues to experience a gradual softening to the pace of buyer demand combined with longer days on market. Of the major islands, the luxury single-family market in Oahu remains the most favorable to sellers, while Maui and the island of Hawaii moved toward more balanced market conditions. Kauai experienced its first indication of a move toward a buyer’s market in over 18 months. In the attached luxury property market, all islands still remain favorable to sellers.
While the pace of the luxury market is slowing here, as well as on the mainland, there are two important factors that moderate the transition as it relates to Hawaii. Firstly, home prices have continued to rise, albeit at a slower rate. Secondly, compared to pre-pandemic levels, the number of sales for the single-family market is 73% higher (104 sales in August of 2022 compared to 60 in August of 2019), and are nearly double for the attached property market (144 sales in August 2022 compared to 73 in August 2019).
Upon review of the most recent trends, it is best to bear in mind that homes typically go under contract a month or more before closing, therefore August data, in most cases, reflects decisions made in early spring/summer when market conditions were different. It is also best to recognize that gradual drops in demand tend to reduce buyer competition and home-price growth correspondingly. As market conditions continue to evolve, Hawaii may be poised to a return to pre-pandemic market conditions and seasonal adjustments to the pace of, and demand for, real estate in the islands. It is also important to bear in mind that visits to Hawaii from parts of Asia that were largely closed due to the pandemic are just beginning to reopen to a segment of the market that has yet to reveal a level of renewed interest in Hawaii.
As always, a real estate expert familiar with local trends is the best resource for navigating the specific and varied real estate markets within the islands of Hawaii, particularly during times of transition. If you have questions or wish further information, please contact your Corcoran Pacific real estate specialist for answers and guidance.

$9,500,000+
$8,500,000 $9,499,999
$7,500,000 $8,499,999
$6,500,000 $7,499,999
$5,500,000 $6,499,999
$4,700,000 $5,499,999
$4,100,000 $4,699,999
$3,500,000 $4,099,999
$3,100,000 $3,499,999
$2,700,000 $3,099,999
$2,300,000 $2,699,999
$2,100,000 $2,299,999
$1,900,000 $2,099,999
$1,800,000 $1,899,999
$1,750,000 $1,799,999
$7,000,000+
$6,000,000 $6,999,999
$5,200,000 $5,999,999
$4,400,000 $5,199,999
$3,800,000 $4,399,999
$3,200,000 $3,799,999
$2,600,000 $3,199,999
$2,200,000 $2,599,999
$1,800,000 $2,199,999
$1,500,000 $1,799,999
$1,200,000 $1,499,999
$1,000,000 $1,199,999
$900,000 - $999,999
$800,000 - $899,999
$750,000 - $799,999
Metric Year $1-2 Million $2-3 Million $3-5 Million $5 Million+ $800K$1 Million $1 Million+
2016 657 96 36 16 240 333
2017 732 108 50 13 318 660
2018 794 86 46 27 282 352
Closed Sales
2019 775 94 37 21 261 309
2020 931 115 57 27 183 188
2021 1,170 302 132 47 464 497
2022 YTD 1,304 171 88 42 393 416
2016 $1,250,000 $2,300,000 $3,625,000 $6,744,844 $870,000 $1,712,800
2017 $1,250,000 $2,377,500 $3,525,000 $6,388,000 $875,000 $1,777,500
2018 $1,255,000 $2,372,500 $3,662,500 $7,200,000 $888,000 $1,550,000
Median Sales Price (in millions)
2019 $1,250,000 $2,300,000 $3,688,000 $5,800,000 $890,000 $1,495,000
2020 $1,265,000 $2,325,000 $3,500,000 $6,800,000 $878,000 $1,325,000
2021 $1,270,000 $2,450,000 $3,600,000 $6,700,000 $875,000 $1,350,000
2022 YTD $1,300,000 $2,375,000 $3,536,200 $6,962,500 $868,000 $1,364,000
2016 5.0 10.2 21.1 27.5 5.8 10.1
2017 4.7 9.8 13.3 40.2 5.1 5.9
2018 5.6 12.1 14.8 21.6 6.8 5.9
2019 5.6 12.9 18.6 36.0 8.3 11.6
2020 3.6 8.2 11.8 26.7 7.2 20.4
2021 1.9 3.2 4.9 13.2 2.8 6.0
2022 YTD 2.2 3.4 5.0 26.0 5.7 9.8

$9,000,000+
$7,800,000 $8,999,999
$6,800,000 $7,799,999
$5,800,000 $6,799,999
$5,000,000 $5,799,999
$4,200,000 $4,999,999
$3,400,000 $4,199,999
$2,800,000 $3,399,999
$2,400,000 $2,799,999
$2,000,000 $2,399,999
$1,700,000 $1,999,999
$1,400,000 $1,699,999
$1,300,000 $1,399,999
$1,200,000 $1,299,999
$1,100,000 $1,199,999
$4,500,000+
$4,000,000 $4,499,999
$3,500,000 $3,999,999
$3,100,000 $3,499,999
$2,700,000 $3,099,999
$2,400,000 $2,699,999 $2,100,000 $2,399,999
$1,800,000 $2,099,999
$1,600,000 $1,799,999
$1,400,000 $1,599,999
$1,300,000 $1,399,999
$1,200,000 $1,299,999
$1,100,000 $1,199,999
$1,000,000 $1,099,999
$950,000 - $999,999
Metric Year $1-2 Million $2-3 Million $3-5 Million $5 Million+ $800K$1 Million $1 Million+
2016 75 18 8 30 32 53
2017 95 24 11 29 42 89
2018 104 17 17 15 41 88
Closed Sales
2019 131 21 7 27 48 79
2020 182 31 26 33 53 126
2021 247 59 45 70 125 236
2022 YTD 178 43 24 27 58 148
2016 $1,395,000 $2,485,000 $4,175,000 $7,187,500 $916,000 $1,800,000
2017 $1,374,000 $2,424,000 $4,100,000 $7,950,000 $899,500 $1,600,000
2018 $1,349,000 $2,495,005 $3,950,000 $7,500,000 $880,000 $1,945,000
Median Sales Price (in millions)
2019 $1,295,000 $2,500,000 $3,100,000 $7,725,000 $900,000 $1,450,000
2020 $1,295,000 $2,600,000 $3,999,500 $6,950,000 $905,000 $1,700,000
2021 $1,399,000 $2,450,000 $3,950,000 $8,450,000 $877,000 $1,592,500
2022 YTD $1,300,000 $2,300,000 $3,600,000 $9,500,000 $897,000 $1,824,500
2016 16.6 23.5 29.9 22.9 15.7 22.6
2017 15.8 19.9 21.3 20.7 13.5 20.4
2018 14.8 17.5 20.2 19.9 9.6 12.9
Months Supply of Inventory
2019 14.2 18.6 23.9 17.0 11.7 14.1
2020 9.8 13.5 14.0 15.2 5.1 7.1
2021 5.1 8.3 9.1 8.6 2.7 5.1
2022 YTD 5.1 25.0 17.0 4.0 2.3 4.0

$12,000,000+
$9,900,000 $11,999,999
$7,900,000 - $9,899,999
$5,900,000 - $7,899,999
$4,900,000 - $5,899,999
$3,900,000 - $4,899,999
$3,400,000 - $3,899,999
$2,900,000 - $3,399,999
$2,400,000 - $2,899,999
$2,200,000 - $2,399,999
$2,000,000 - $2,199,999
$1,800,000 - $1,999,999
$1,700,000 - $1,799,999
$1,600,000 - $1,699,999
$1,500,000 - $1,599,999
$4,500,000+
$3,600,000 $4,499,999
$3,100,000 $3,599,999
$2,600,000 $3,099,999
$2,400,000 $2,599,999
$2,200,000 $2,399,999
$2,000,000 $2,199,999
$1,900,000 $1,999,999
$1,800,000 $1,899,999
$1,700,000 $1,799,999
$1,600,000 $1,699,999
$1,500,000 $1,599,999
$1,400,000 $1,499,999
$1,300,000 $1,399,999
$1,200,000 $1,299,999
Metric Year $1-2 Million $2-3 Million $3-5 Million $5 Million+
$800K$1 Million $1 Million+
2016 143 31 25 20 66 168
2017 168 39 32 15 99 192
2018 190 31 30 13 120 285
Closed Sales
2019 215 47 25 13 118 247
2020 218 51 34 11 140 273
2021 404 126 79 68 292 583
2022 YTD 304 77 43 33 181 382
2016 $1,265,850 $2,300,000 $3,700,000 $6,510,000 $899,500 $1,500,000
2017 $1,265,000 $2,400,000 $3,600,000 $8,025,444 $900,000 $1,700,000
2018 $1,328,000 $2,285,000 $3,625,000 $9,250,000 $887,450 $1,440,000
Median Sales Price (in millions)
2019 $1,270,000 $2,400,000 $3,270,000 $6,500,000 $864,875 $1,495,000
2020 $1,312,500 $2,390,000 $3,575,000 $6,400,000 $862,500 $1,685,000
2021 $1,300,000 $2,467,500 $3,800,000 $7,625,000 $880,000 $1,620,000
2022 YTD $1,300,000 $2,300,000 $3,700,000 $8,000,000 $895,000 $1,526,250
2016 11.8 19.1 18.3 17.2 14.6 16.2
2017 12.9 15.8 19.5 19.9 14.2 21.4
2018 13.8 16.4 16.5 21.7 14.4 24.9
Months Supply of Inventory
2019 12.3 16.5 19.3 24.9 13.6 25.8
2020 10.4 13.5 14.8 20.4 11.8 23.4
2021 5.4 7.5 8.8 14.2 7.3 14.2
2022 YTD 3.0 7.9 9.0 14.0 1.6 2.4

$6,000,000+
$5,400,000 $5,999,999
$4,900,000 $5,399,999
$4,400,000 $4,899,999
$3,900,000 $4,399,999
$3,400,000 $3,899,999
$3,000,000 $3,399,999
$2,600,000 $2,999,999
$2,200,000 $2,599,999
$1,800,000 $2,199,999
$1,600,000 $1,799,999
$1,500,000 $1,599,999
$1,400,000 $1,499,999
$1,300,000 $1,399,999
$1,200,000 $1,299,999
$3,500,000+
$3,000,000 $3,499,999
$2,500,000 $2,999,999
$2,000,000 $2,499,999
$1,900,000 $1,999,999
$1,800,000 $1,899,999
$1,700,000 $1,799,999
$1,600,000 $1,699,999
$1,500,000 $1,599,999
$1,400,000 $1,499,999
$1,300,000 $1,399,999
$1,200,000 $1,299,999
$1,100,000 $1,199,999
$1,000,000 $1,099,999
$950,000 - $999,999
Metric Year $1-2 Million $2-3 Million $3-5 Million $5
Closed Sales
Median Sales Price (in millions)
Months Supply of Inventory
-
$1
2016 52 14 5 7 17 39
2017 61 13 6 3 34 40
2018 66 17 7 17 51 55
2019 57 15 10 4 68 51
2020 85 17 11 12 59 41
2021 140 59 30 31 103 175
2022 YTD 94 38 27 20 44 85
2016 $1,271,695 $2,387,500 $3,300,000 $11,400,000 $900,000 $1,350,000
2017 $1,285,000 $2,450,000 $3,800,000 $11,000,000 $868,758 $1,250,000
2018 $1,262,500 $2,500,000 $3,700,000 $8,702,400 $864,988 $1,500,000
2019 $1,395,000 $2,550,000 $3,650,000 $5,900,000 $897,129 $1,380,000
2020 $1,300,000 $2,300,000 $3,820,000 $7,700,000 $857,000 $1,350,000
2021 $1,471,500 $2,450,000 $3,500,000 $8,500,000 $895,000 $1,395,000
2022 YTD $ 1,350,000 $2,261,000 $3,495,000 $8,200,000 $900,000 $1,355,000
2016 15.6 21.3 20.6 26.2 18.5 20.0
2017 12.6 19.9 24.8 23.9 10.5 16.0
2018 11.6 18.0 23.9 21.9 9.9 16.5
2019 10.7 16.1 16.5 21.6 9.0 17.2
2020 7.0 13.4 12.7 19.5 7.4 13.2
2021 4.8 9.3 6.7 12.4 4.9 6.6
2022 YTD 5.3 4.8 7.5 14.0 1.7 4.6
Over the last few months, the luxury real estate market has experienced the return of a more normal pace for those looking to buy and sell their homes. Recent trends also continue to show a considerable moderation in the number of sales and the rate of price increases, which has certainly taken the pressure off the market.
While it is contended that we are moving towards a buyer’s market, the current data for August 2022 shows that conditions in most luxury markets are still favorable to sellers – of the 140 single-family markets showcased in our report, 106 remain seller markets. However, the sales ratio percentage, which measures the rate of sales against available inventory each month, is trending downwards in most markets month over month, in comparison to 2021 levels.
Whether the overall luxury real estate market moves towards a balanced or buyer’s market will likely depend on changes in inventory levels and whether the available homes match buyers' demand. Even at the height of the buyer frenzy in spring 2021, homes that were considerably over-priced or needed extensive renovations or repairs often remained unsold.
Demand for move-in-ready properties remains a top priority for affluent buyers who have little time or desire to embark on any more than simple updating projects. As we highlighted last month, properties that are fully furnished, down to kitchen utensils, dishware, and all the soft furnishings, are highly prized, often seeing some of the shortest days on the market.
The level of inventory may have risen since May 2022, and now approximately 50% higher for single family homes and 18% for attached properties compared to August 2021, but of greater significance is that the number of new listings entering the market has continued to drop since June 2022. Expectations are that these numbers will rise as we enter the fall season, but it seems that some luxury sellers are hesitant to enter the current market.
The drop in new listings might be explained as, traditionally, summer months do see fewer homes enter the market as families take time to vacation. However, according to Danielle Halle, Chief Economist at Realtor.com, “even though home prices are near record highs and home equity has soared, homeowners appear to be less eager to list homes for sale compared to last year. Recent survey data shows that while home sellers are in a good position, typically getting their list price and still generally satisfied with the price and other aspects of their home sale, some of their (seller) markers have shifted over the last year.”
Sellers are facing several problems, including appraisals not matching the value of their asking price and the return of contract contingencies such as requests for repairs or compensation. In the last year especially, these were not included in buyer contracts because multiple offers and cash buyers mitigated these sorts of requests.
It seems that some sellers are not quite ready to contend with the return of negotiating terms or, depending on their level of wealth, simply do not need to sell, so they are ready to wait until the market becomes more favorable.
Equally, after two long years of unrest and upheaval, many affluent are content with their purchases and now looking for more stability and continuity. So, expectations are that they might not be ready to sell any time soon. If these affluent purchased using a ‘fixed-term’ low-interest rate mortgage, it is also unlikely that they would trade in these favorable terms if they do not have to sell or move unless a life-changing event occurs.
If we are returning to a more traditional real estate cycle, then over the next couple of months, inventory levels should start to increase again, and we may see more luxury markets become balanced or buyer’s markets.
As we move into the fall season, we review both new opportunities and trends that homeowners and investors should consider during their property search.
An increasing number of buyers are starting to return to the larger metropolitan cities for multiple reasons, including simply missing the lifestyle or looking for a potential investment opportunity.

This door may close soon, as also in the mix are foreign investors (now that travel restrictions are easing) and first-time buyers heading to urban markets looking for the opportunity to purchase a property. Experts predict that city markets may see stronger returns on investment than their suburban counterparts.
While cities are starting to experience an influx of new and returning buyers, some of the best deals may be found in emerging neighborhoods. Before the pandemic, many of these inner, mid-city communities and industrial areas had been on trend for gentrification.
Cities from Vancouver and Toronto in Canada to Atlanta, Austin, Chicago, and San Francisco in the US saw their emerging neighborhoods stall in 2020 as people chose to purchase away from the more crowded metropolitan communities.
Today, emerging neighborhoods not only afford buyers better values but have the potential to create greater equity returns. These are ideal for buyers ready to invest in a property for the longer term, understanding that they are buying early and will need to wait for the neighborhood to evolve and mature.
As we enter the latter part of 2022, mainly due to the historic rise in property values over the last 24 months, many affluent are now starting to reprioritize with a keen eye on market stability and potential returns.

Which trends will see better investment return; larger estate-sized homes, properties with views, those located on expansive land, or smaller homes closer to amenities, are questions being asked of our luxury real estate professionals.
The answer may lie in reviewing the sales data for the last six months, which reveals that luxury mid-sized homes ranging from 3,000 to 3,500 sq ft are proving to be in the greatest demand for single family homes and 1,500 to 2,000 sq ft for attached properties.
While people want extra space, they do not want to be overwhelmed with larger debt, especially as interest rates continue to rise. Equally, land and privacy are still important, but as things return to normal, the shift back to living closer to amenities and locations closer to work are becoming the main priority once more.
Now that remote working is mainstream, there is still an increased focus on investing in real estate that aligns with people’s lifestyle choices.
Vacation and second home properties are expected to continue to increase in popularity, especially for those who need escape options from their primary property. The affluent are continuing to seek diversity in their lifestyle, and owning multiple properties, whether in the city, mountains, or beach locations, is an important facet in meeting that requirement.
The art of selling and buying in this market needs a critical and analytical approach; understanding the realities and setting expectations accordingly will ensure that goals are achieved. For homeowners looking to buy or sell in today’s market, we recommend working with a Realtor who can capitalize on the preferences, trends, and demands in this dynamic and evolving environment.
Median List Price $1,680,750 $1,595,000
Median Sale Price $1,360,697 $1,299,000
Median SP/LP Ratio 100.00% 99.17%
Total Sales Ratio 56.05% 34.84%
Median Price per Sq. Ft. $392 $418
Median prices represent properties priced above respective city benchmark prices.
Total Inventory 33,805 51,674
New Listings 11,760 16,673
Total Sold 18,947 18,001
Median Days on Market 13 18
Average Home Size 3,528 3,185
•
Official Market Type: Seller's Market with a 34.84% Sales Ratio.1
• Homes are selling for an average of 99.17% of list price
• The median luxury threshold2 price is $925,000, and the median luxury home sales price is $1,299,000.
• Markets with the Highest Median Sales Price: Aspen ($11,500,000), Whistler ($5,550,000), Vail ($4,550,000), and Naples ($4,200,000).
• Markets with the Highest Sales Ratio: Cleveland Suburbs (131%), Hamilton County (95%), St. Louis (91%) and Howard County (79%).
1Sales Ratio defines market speed and market type: Buyer's < 15.5%; Balanced >= 15.5 to < 20.5%; Seller's >= 20.5% plus. If >100%, sales from previous month exceeds current inventory. 2The luxury threshold price is set by The Institute for Luxury Home Marketing.
Median List Price $998,585 $942,225
Median Sale Price $830,000 $876,250
Median SP/LP Ratio 100.00% 98.92%
Total Sales Ratio 41.52% 30.34%
Median Price per Sq. Ft. $489 $527
Median prices represent properties priced above respective city benchmark prices.
Total Inventory 12,341 14,665
New Listings 4,137 4,841
Total Sold 5,124 4,449
Median Days on Market 16 18
Average Home Size 1,960 1,843
• Official Market Type: Seller's Market with a 30.34% Sales Ratio
• Attached homes are selling for an average of 98.92% of list price
• The median luxury threshold2 price is $700,000, and the median attached luxury sale price is $876,250
• Markets with the Highest Median Sales Price: Aspen ($4,125,000), Vail ($3,250,000), Whistler ($2,342,500), and San Francisco ($2,275,000).
• Markets with the Highest Sales Ratio: Santa Barbara (127%), Howard County (122%), Anne Arundel County (91%) and Sussex County Coastal (84%).
1Sales Ratio defines market speed and market type: Buyer's < 15.5%; Balanced >= 15.5 to < 20.5%; Seller's >= 20.5% plus. If >100%, sales from previous month exceeds current inventory.
2The luxury threshold price is set by The Institute for Luxury Home Marketing.
AB Calgary $1,099,999 $930,000 537 238 147 23 Seller's
AZ Chandler and Gilbert $1,075,000 $1,000,000 265 89 72 41 Seller's
AZ Flagstaff $1,462,250 $1,272,500 84 24 24 50 Seller's
AZ Mesa $847,000 $835,000 216 87 69 33 Seller's
AZ Paradise Valley $4,995,000 $3,025,000 110 27 21 74 Balanced
AZ Phoenix $849,900 $787,000 873 286 272 41 Seller's
AZ Scottsdale $1,850,000 $1,755,000 630 185 153 48 Seller's
AZ Tucson $718,000 $655,000 723 237 261 15 Seller's
BC Mid Vancouver Island $1,650,000 $1,465,000 231 86 24 22 Buyer's
BC Okanagan Valley $1,790,000 $1,530,000 917 276 65 47 Buyer's
BC Vancouver $4,500,000 $3,259,000 1144 272 66 25 Buyer's
BC Victoria $2,499,000 $1,950,000 139 55 23 17 Balanced
BC Whistler $4,500,000 $5,550,000 55 10 4 41 Buyer's
CA Central Coast $2,850,000 $2,150,000 240 82 71 20 Seller's
CA East Bay $2,198,775 $1,869,500 534 272 412 16 Seller's
CA Greater Palm Springs $1,849,000 $1,599,000 213 67 78 33 Seller's
CA Lake Tahoe
$2,250,000 $1,885,000 218 51 40 20 Balanced
CA Los Angeles Beach Cities $5,899,000 $3,915,000 297 88 71 12 Seller's
CA Los Angeles City $4,999,000 $3,500,000 646 187 119 18 Balanced
CA Los Angeles The Valley $2,495,000 $2,025,500 468 187 190 20 Seller's
CA Marin County $4,122,500 $2,900,000 118 25 47 17 Seller's
CA Napa County $4,309,000 $2,300,000 52 7 22 26 Seller's
CA Orange County $2,689,000 $2,274,000 1012 335 383 15 Seller's
CA Placer County $1,195,000 $1,149,000 256 95 101 21 Seller's
CA Sacramento $949,000 $915,000 668 253 339 19 Seller's
CA San Diego $2,215,000 $1,868,500 933 366 354 15 Seller's
CA San Francisco $4,495,000 $3,425,000 119 42 55 17 Seller's
CA San Luis Obispo County $1,875,000 $1,447,500 183 61 74 40 Seller's
CA Santa Barbara $5,750,000 $3,500,000 123 48 57 11 Seller's
CA Silicon Valley
$3,798,000 $3,287,500 486 224 268 15 Seller's
CA Sonoma County $2,274,500 $1,750,000 214 35 65 36 Seller's
CA Ventura County $1,992,500 $1,775,000 262 82 103 28 Seller's
CO Aspen $14,900,000 $11,500,000 105 13 7 76 Buyer's
CO Boulder $2,295,000 $1,600,000 201 74 81 49 Seller's
CO Colorado Springs $935,000 $844,500 471 146 146 13 Seller's
Median prices represent properties priced above respective city benchmark prices. Prices shown for Canadian cites are shown in Canadian Dollars.
AB Calgary $750,000 $695,000 153 41 25 39 Balanced
AZ Chandler and Gilbert
AZ Flagstaff
AZ Mesa
AZ Paradise Valley
AZ Phoenix
AZ Scottsdale $875,000 $790,000 193 63 47 34 Seller's
AZ Tucson
BC Mid Vancouver Island $848,950 $802,500 62 21 10 39 Balanced
BC Okanagan Valley
BC Vancouver $1,988,500 $1,769,000 906 265 80 27 Buyer's
BC Victoria $999,000 $892,500 124 72 42 16 Seller's
BC Whistler $2,635,250 $2,342,500 36 9 2 62 Buyer's
CA Central Coast $1,275,000 $1,025,000 25 10 21 14 Seller's
CA East Bay $999,970 $1,072,500 166 90 134 14 Seller's
CA Greater Palm Springs
CA Lake Tahoe $1,625,000 $880,000 25 6 3 48 Buyer's
CA Los Angeles Beach Cities $1,897,000 $1,775,000 156 52 71 18 Seller's
CA Los Angeles City $1,699,500 $1,434,000 338 122 86 24 Seller's
CA Los Angeles The Valley $789,000 $825,000 153 76 83 17 Seller's
CA Marin County $1,297,500 $1,150,000 34 9 19 24 Seller's
CA Napa County
CA Orange County $1,200,000 $1,160,000 368 158 220 15 Seller's
CA Placer County
CA Sacramento
CA San Diego $1,100,000 $1,043,500 345 163 212 12 Seller's
CA San Francisco $2,750,000 $2,275,000 75 16 9 35 Buyer's
CA San Luis Obispo County
CA Santa Barbara $1,399,000 $1,625,000 11 6 14 26 Seller's
CA Silicon Valley $1,699,999 $1,590,000 113 64 71 14 Seller's
CA Sonoma County $834,000 $751,785 18 6 7 40 Seller's
CA Ventura County $750,000 $785,000 113 53 50 16 Seller's
CO Aspen $3,674,000 $4,125,000 42 11 5 67 Buyer's
CO Boulder $871,470 $1,127,500 63 28 40 67 Seller's
CO Colorado Springs
Markets with dashes do not have a significant luxury market for this report. Median prices represent properties priced above respective city benchmark prices. Prices shown for Canadian cites are shown in Canadian Dollars.
©2020 Corcoran Pacific Properties. All rights reserved. Corcoran® and the Corcoran Logo are registered service marks owned by Corcoran Group LLC. Corcoran Pacific Properties fully supports the principles of the Fair Housing Act and the Equal Opportunity Act. Each franchise is independently owned and operated.