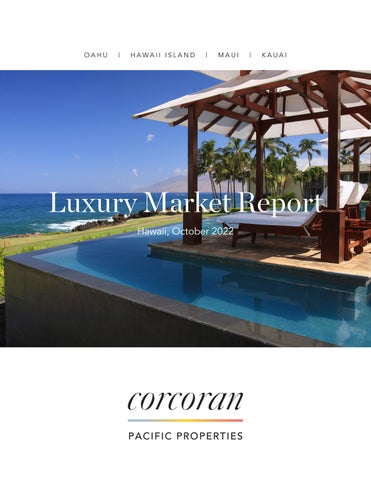
Luxury Market Report

October 2022
Hawaii,
OAHU
| HAWAII ISLAND | MAUI | KAUAI
October 2022

Corcoran Pacific Properties, the exclusive Hawaii franchisee of The Corcoran Group, is a locally owned and operated company, founded in 2005 with a simple philosophy: treating every client as a friend, and every transaction as if it was our own.
Over the past 17+ years, honoring this philosophy, we established a culture of service and efficiency fueled by high-tech, smart investments in agents, and the tools they need to deliver world-class service while helping clients achieve their real estate goals.
By choosing only the most successful, experienced real estate professionals and dedicating every resource to support their success, we’ve grown to be the brokerage of choice serving Kauai, Oahu, Maui and Hawaii Island.
With our clients at the heart of our business, Corcoran Pacific Properties is dedicated to excellence, innovation and to continuously raising the bar when it comes to impeccable service, expert insight and a relationship-first approach.
 ©2020 Corcoran Pacific Properties. All rights reserved. Corcoran® and the Corcoran Logo are registered service marks owned by Corcoran Group LLC. Corcoran Pacific Properties fully supports the principles ofthe Fair Housing Act and the Equal Opportunity Act. Each franchise is independently owned and operated.
At Corcoran Pacific Properties, we dream big. We know that luxury is not a price point, but an experience. Through our commitment to providing first-class support for our 200+ award-winning real estate professionals, we deliver a distinctive and authentic experience to our agents, employees and clients, helping people find the lifestyle they seek.
Gregg Antonsen SVP, Luxury Sales gregg.antonsen@corcoranpacific.com
Kahala Office 4211 Waialae Ave. Suite 106 Honolulu, HI 96816 (800) 315-3898
Wailea Office 34 Wailea Gateway Pl. Suite A-204 Kihei, HI 96753 (800) 315-3898
Kailua Office 419-B Kuulei Rd. Kailua, HI 96816 (800) 315-3898
Mililani Office 95-1249 Meheula Parkway, Suite No. A-5 Mililani, HI 96789 (808) 589-2040
Lahaina Office 75 Kupuohi St. Suite 203 Lahaina, HI 96761 (800) 315-3898
Hilo Office 64 Keawe St. Suite 203 Hilo, HI 96720 (800) 315-3898
Kona Office Walua Professional Bldg. 75-5905 Walua Rd. Suite 9 Kailua-Kona, HI 96740 (800) 315-3898
Koloa Office 3417 Poipu Rd. Suite 110B Koloa, HI 96756 (800) 315-3898
North Shore Office 66-590 Kamehameha Hwy, Unit 1 Haleiwa, HI 96712 (808) 589-2040
Princeville Office 5-4280 Kuhio Hwy. Suite B-103 Princeville, HI 96722 (800) 315-3898
Mauna Lani Portfolio Mauna Lani Auberge Resort 68-1400 Mauna Lani Dr, Suite 108 Waimea, HI 96743 (800) 315-3898
Waimea Office 65-1291 Kawaihae Rd. Suite 101 C Kamuela, HI 96743 (800) 315-3898


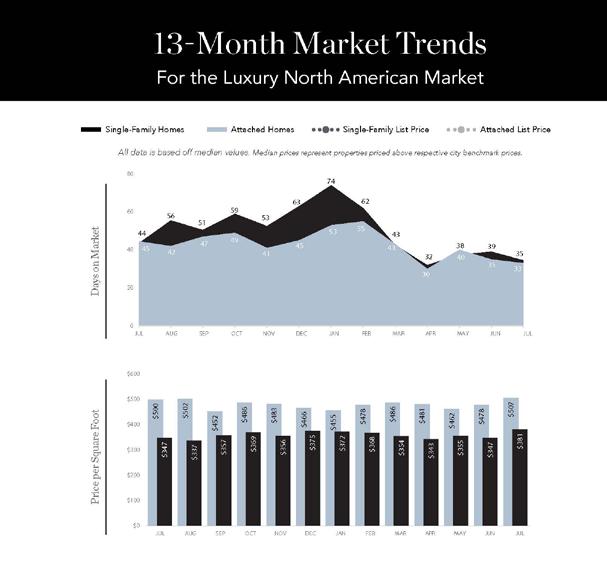
The Institute for Luxury Home Marketing has analyzed a number of metrics — including sales prices, sales volumes, number of sales, sales-price-to-list-price ratios, days on market and price-per-squarefoot – to provide you a comprehensive North American Luxury Market report.
Additionally, we have further examined all of the individual luxury markets to provide both an overview and an in-depth analysis - including, where data is sufficient, a breakdown by luxury single-family homes and luxury attached homes.
It is our intention to include additional luxury markets on a continual basis. If your market is not featured, please contact us so we can implement the necessary qualification process. More indepth reports on the luxury communities in your market are available as well.
Looking through this report, you will notice three distinct market statuses, Buyer's Market, Seller's Market, and Balanced Market. A Buyer's Market indicates that buyers have greater control over the price point. This market type is demonstrated by a substantial number of homes on the market and few sales, suggesting demand for residential properties is slow for that market and/ or price point.
By contrast, a Seller's Market gives sellers greater control over the price point. Typically, this means there are few homes on the market and a generous demand, causing competition between buyers who ultimately drive sales prices higher.
A Balanced Market indicates that neither the buyers nor the sellers control the price point at which that property will sell and that there is neither a glut nor a lack of inventory. Typically, this type of market sees a stabilization of both the list and sold price, the length of time the property is on the market as well as the expectancy amongst homeowners in their respective communities – so long as their home is priced in accordance with the current market value.
REMAINING INVENTORY: The total number of homes available at the close of a month.
DAYS ON MARKET: Measures the number of days a home is available on the market before a purchase offer is accepted.
LUXURY BENCHMARK PRICE: The price point that marks the transition from traditional homes to luxury homes.
NEW LISTINGS: The number of homes that entered the market during the current month.
PRICE PER SQUARE FOOT: Measures the dollar amount of the home's price for an individual square foot.
SALES RATIO: Sales Ratio defines market speed and determines whether the market currently favors buyers or sellers. Buyer's Market = up to 14%; Balanced Market = 15 to 20%; Seller's Market = 21% plus. If >100%, sales from previous month exceed current inventory.
SP/LP RATIO: The Sales Price/List Price Ratio compares the value of the sold price to the value of the list price.
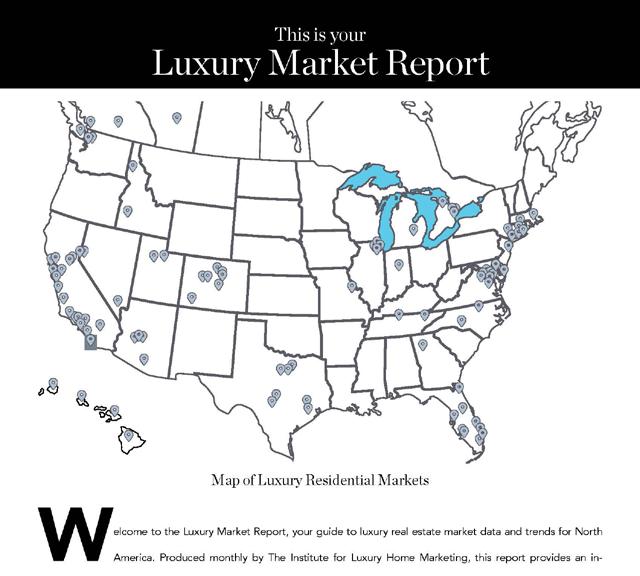
Welcome to the Luxury Market Report, your guide to luxury real estate market data and trends for North America. Produced monthly by The Institute for Luxury Home Marketing, this report provides an in-depth look at the top residential markets across the United States and Canada. Within the individual markets, you will find established luxury benchmark prices and detailed survey of luxury active and sold properties designed to showcase current market status and recent trends. The national report illustrates a compilation of the top North American markets to review overall standards and trends.
Copyright
The Luxury Market Report is a monthly
by The
Luxury benchmark prices are determined by The Institute. This active and sold data has been compiled by various sources, including local MLS boards, local tax
and Realtor.com. Data is deemed reliable to the best of our knowledge, but is not guaranteed.
Corcoran Pacific Properties is pleased to present a closer look at the luxury real estate market in Hawaii, which includes detailed statistical analysis of Oahu, the Island of Hawaii, Maui and Kauai for September 2022.


In line with many of the luxury real estate markets across the U.S. the data for Hawaii shows there is a transition occurring, but equally there are contradictions to expected norms creating some unpredictability.
Statistically, the single-family markets of Maui and Kauai became more favorable to buyers, while the Island of Hawaii and Oahu both transitioned into balanced markets during the month of September. Interestingly, all the islands are reporting that their attached property markets are still more favorable to sellers in the luxury market.
Inventory levels, compared to the September 2021, show an increase of 29% (384 to 497) for single-family homes and 27% (431 to 548) for attached properties, but dig a little deeper and inventory levels have remained static since June 2022. This is due to fewer quantities of new listings entering the market – and contrary to results typically seen in the transition to a buyer’s market.
The cause of this quandary is that homeowners are more hesitant to put their homes on the market. Many not only chose to purchase their dream Hawaiian escape during the pandemic, but they leveraged the opportunity of low interest rates. So, despite economic uncertainty, the majority have very little reason to sell.
This lack of new inventory is certainly one of the main contributors in the decline in luxury sales in the singlefamily market which dropped 25.9% from 104 in August to 77 in September. While many participants in the upper end of the market still tend to be “cash buyers”, if they cannot find a desirable home, they will either wait or move in a different direction.
Sales in the attached market increased slightly from 144 in August to 153 in September, led by Oahu that saw a 6% increase (100 to 106) in sales compared to September 2021.
“The general volume of activity in the high-end market throughout the islands appears to be experiencing a pause,” stated Gregg Antonsen, SVP Luxury Sales for Corcoran Pacific Properties. “Prospective buyers and sellers have adopted a wait-and-see attitude until they reach a clearer understanding of developing economic conditions, as we approach the final quarter of 2022.”
As always, a real estate expert familiar with local trends is the best resource to navigate the specific and varied markets found within the Hawaiian Islands.

$9,500,000+
$8,500,000 $9,499,999
$7,500,000 $8,499,999
$6,500,000 $7,499,999
$5,500,000 $6,499,999
$4,700,000 $5,499,999
$4,100,000 $4,699,999
$3,500,000 $4,099,999
$3,100,000 $3,499,999
$2,700,000 $3,099,999
$2,300,000 $2,699,999
$2,100,000 $2,299,999
$1,900,000 $2,099,999
$1,800,000 $1,899,999
$1,750,000 $1,799,999
$7,000,000+
$6,000,000 $6,999,999
$5,200,000 $5,999,999
$4,400,000 $5,199,999
$3,800,000 $4,399,999
$3,200,000 $3,799,999
$2,600,000 $3,199,999
$2,200,000 $2,599,999
$1,800,000 $2,199,999
$1,500,000 $1,799,999
$1,200,000 $1,499,999
$1,000,000 $1,199,999
$900,000 - $999,999
$800,000 - $899,999
$750,000 - $799,999
Metric Year
Closed Sales
1,170
1,449
$1,250,000 $2,300,000 $3,625,000 $6,744,844 $870,000 $1,712,800
$1,250,000 $2,377,500 $3,525,000 $6,388,000 $875,000 $1,777,500
$1,255,000 $2,372,500 $3,662,500 $7,200,000 $888,000 $1,550,000
$1,250,000 $2,300,000 $3,688,000 $5,800,000 $890,000 $1,495,000 2020 $1,265,000 $2,325,000 $3,500,000 $6,800,000 $878,000 $1,325,000
$1,270,000 $2,450,000 $3,600,000 $6,700,000 $875,000 $1,350,000
YTD $1,300,000 $2,375,000 $3,560,500 $6,962,500 $865,000 $1,350,000

$7,800,000 $8,999,999
$6,800,000 $7,799,999
$5,800,000 $6,799,999
$5,000,000 $5,799,999
$4,200,000 $4,999,999
$3,400,000 $4,199,999
$2,800,000 $3,399,999
$2,400,000 $2,799,999
$2,000,000 $2,399,999
$1,700,000 $1,999,999
$1,400,000 $1,699,999
$1,300,000 $1,399,999
$1,200,000 $1,299,999
$1,100,000 $1,199,999
$4,500,000+
$4,000,000 $4,499,999
$3,500,000 $3,999,999
$3,100,000 $3,499,999
$2,700,000 $3,099,999
$2,400,000 $2,699,999
$2,100,000 $2,399,999
$1,800,000 $2,099,999
$1,600,000 $1,799,999
$1,400,000 $1,599,999
$1,300,000 $1,399,999
$1,200,000 $1,299,999
$1,100,000 $1,199,999
$1,000,000 $1,099,999
- $999,999
Metric Year
Closed Sales
Median Sales Price (in millions)
$1,395,000 $2,485,000 $4,175,000 $7,187,500 $916,000 $1,800,000
$1,374,000 $2,424,000 $4,100,000 $7,950,000 $899,500 $1,600,000
$1,349,000 $2,495,005 $3,950,000 $7,500,000 $880,000 $1,945,000
$1,295,000 $2,500,000 $3,100,000 $7,725,000 $900,000 $1,450,000
$1,295,000 $2,600,000 $3,999,500 $6,950,000 $905,000 $1,700,000
$1,399,000 $2,450,000 $3,950,000 $8,450,000 $877,000 $1,592,500
YTD $1,300,000 $2,275,000 $3,525,000 $9,673,750 $890,000 $1,730,000

$9,900,000 $11,999,999
$7,900,000 - $9,899,999
$5,900,000 - $7,899,999
$4,900,000 - $5,899,999
$3,900,000 - $4,899,999
$3,400,000 - $3,899,999
$2,900,000 - $3,399,999
$2,400,000 - $2,899,999
$2,200,000 - $2,399,999
$2,000,000 - $2,199,999
$1,800,000 - $1,999,999
$1,700,000 - $1,799,999
$1,600,000 - $1,699,999
$1,500,000 - $1,599,999
$4,500,000+
$3,600,000 $4,499,999
$3,100,000 $3,599,999
$2,600,000 $3,099,999
$2,400,000 $2,599,999
$2,200,000 $2,399,999
$2,000,000 $2,199,999
$1,900,000 $1,999,999
$1,800,000 $1,899,999
$1,700,000 $1,799,999
$1,600,000 $1,699,999
$1,500,000 $1,599,999
$1,400,000 $1,499,999
$1,300,000 $1,399,999
$1,200,000 $1,299,999
Metric Year
Closed Sales
Median Sales Price (in millions)
2016 $1,265,850 $2,300,000 $3,700,000 $6,510,000 $899,500 $1,500,000 2017 $1,265,000 $2,400,000 $3,600,000 $8,025,444 $900,000 $1,700,000 2018 $1,328,000 $2,285,000 $3,625,000 $9,250,000 $887,450 $1,440,000 2019 $1,270,000 $2,400,000 $3,270,000 $6,500,000 $864,875 $1,495,000 2020 $1,312,500 $2,390,000 $3,575,000 $6,400,000 $862,500 $1,685,000
$1,300,000 $2,467,500 $3,800,000 $7,625,000 $880,000 $1,620,000 2022 YTD $1,300,000 $2,300,000 $3,697,500 $7,900,000 $890,500 $1,525,000

$6,000,000+
$5,400,000 $5,999,999
$4,900,000 $5,399,999
$4,400,000 $4,899,999
$3,900,000 $4,399,999
$3,400,000 $3,899,999
$3,000,000 $3,399,999
$2,600,000 $2,999,999
$2,200,000 $2,599,999
$1,800,000 $2,199,999
$1,600,000 $1,799,999
$1,500,000 $1,599,999
$1,400,000 $1,499,999
$1,300,000 $1,399,999
$1,200,000 $1,299,999
$3,500,000+
$3,000,000 $3,499,999
$2,500,000 $2,999,999
$2,000,000 $2,499,999
$1,900,000 $1,999,999
$1,800,000 $1,899,999
$1,700,000 $1,799,999
$1,600,000 $1,699,999
$1,500,000 $1,599,999
$1,400,000 $1,499,999
$1,300,000 $1,399,999
$1,200,000 $1,299,999
$1,100,000 $1,199,999
$1,000,000 $1,099,999
$950,000 - $999,999
Metric Year
Closed Sales
Median Sales Price (in millions)
2016 $1,271,695 $2,387,500 $3,300,000 $11,400,000 $900,000 $1,350,000
$1,285,000 $2,450,000 $3,800,000 $11,000,000 $868,758 $1,250,000
$1,262,500 $2,500,000 $3,700,000 $8,702,400 $864,988 $1,500,000
$1,395,000 $2,550,000 $3,650,000 $5,900,000 $897,129 $1,380,000
$1,300,000 $2,300,000 $3,820,000 $7,700,000 $857,000 $1,350,000
$1,471,500 $2,450,000 $3,500,000 $8,500,000 $895,000 $1,395,000
YTD $ 1,366,000 $2,261,000 $3,500,000 $8,000,000 $900,000 $1,354,750
It is hard to picture that less than 12 months ago, the luxury real estate market was on a strong upward trajectory, consistently seeing demand increase, prices soar, and inventory levels fall.
Even though we realized that this trend could not continue infinitely, the speed at which the market appeared to turn in May 2022 seemed almost as dramatic as the upswing in May 2020 at the start of the pandemic.
Although the tables changed earlier this summer, with the number of homes listed for sale climbing for the first time since the start of the pandemic, there was still a feeling that while there would be a transition, it would be more gradual, eventually settling into a traditionally paced market.
Instead, what we saw over the last few months was a turmoil of differing opinions about the current status, media hype of doom and gloom, and expert contradictions about the future of the luxury real estate market.
The simple truth is that both the economy and the real estate market are in a state of unpredictable flux, when even traditional methods, such as raising interest rates, are not achieving the desired results as inflation increases. In September, U.S. inflation rose to 6.6%; in Canada, it is currently 7%.
In some locations, we see the severe impact of this increase in interest rates on the number of sales, whereas, in others, the lack of inventory is still playing heavily in the seller’s favor. Some buyers are feeling the affordability squeeze because of the additional increase in the cost of borrowing. Yet, with very few sellers needing to put their homes on the market, inventory levels remain historically low, leaving even cash buyers without the negotiating power typically expected in a transitioning market.
The reality is the factors of how buyers and sellers are reacting combined with influences from outside the industry are creating conflicting messages that are resulting in strange times throughout the real estate market.
It may be a surprise to discover that our analysis for September shows that many markets remain favorable to sellers for both luxury single-family and attached properties.
Last month we reported that 106 of our 140 single-family markets were still favorable to sellers. While 16 have transitioned to balanced – where the market is equally favorable to sellers as it is to buyers – 90 remain seller’s markets.
In the attached market, of the 96 markets reported on by the Institute, 77 remain seller’s markets.
It seems that there are still plenty of buyers – indeed, a survey by Bank of America found that the young and wealthy prefer assets like cryptocurrency, real estate, and private equity over investing in the stock market.
“Individuals ages 21 to 42 with at least $3 million in assets have only a quarter of their portfolio in equities, compared with more than half for those who are older”, according to the study.
This is significant, especially for the future, as Baby Boomers are estimated to transfer over $84 trillion of their wealth to Generation X and millennials between now and 2045, according to market research by Cerulli Associates.
Coming back to the current status, it is important to realize that most luxury markets are starting or transitioning toward more favorable conditions for buyers as inventory levels steadily climb month over month.

As of September, the sales ratio, which measures the monthly sales against the remaining active listings at the end of the month for both single-family home and attached property markets, saw a further shift downwards towards the 21% threshold mark, which signifies a change from seller to a balanced market.
However, there is an anomaly in the claim that inventory levels are rising – the reality is that they are also increasing because homes are staying on the market longer. More choice has slowed the velocity of sales compared to 2021, but the lack of new inventory has equally slowed.
September’s increase in new inventory is typically one of the largest of the calendar year, escalated by individuals returning from the vacation season with new plans; it kicks off the second busiest season in real estate. While the actual number of properties for sale in September 2022 rose significantly compared to September 2021, an increase of just 6% from August 2022 is well under the traditional expected norms of a 12-18% increase between these two months.
But it would be unrealistic to expect the extraordinary results of 2021, where the number of sales was greater than the remaining inventory each month. Nor should we expect to see many sales closing over the asking price and even fewer multiple offers – all typifying a directional transition toward a more balanced market.
Given the time of year, the current economic influences, and the uncertainty surrounding real estate demand, it is still hard to predict when or even if the luxury market will fully become a buyer’s market.
September’s numbers indicate an overall shift. However, as we head towards the winter months when typically, less inventory enters the market, we may see that ratio climb back up, especially if current sellers whose properties have been on the market for some time start to drop their prices further and attract more sales.
Much might also depend on whether we enter a recession. Currently, interest rates being hiked, stock markets falling, and companies scaling back their workforce are causing homebuyers to put on the brakes.
But, if we do go into a recession, interest rate hikes will be less likely as governments will look for people to start spending again to drive the economy. This will mean the cost of borrowing money will either stall at its present rate or even fall, creating more favorable conditions for purchasing real estate again.
All this speculation translates into a disconnect within the market, especially where sellers are not ready to drop their prices and buyers are looking to negotiate. But while economists and real estate experts debate the future, it is obvious that the luxury real estate market has started to go through a correction, and its overall status has shifted direction.
Those looking for investment opportunities are focusing on the newer and second home markets, which saw some of the biggest price increases during the pandemic, as indications are that prices, although not lower than September 2021, have decreased in the last six months.
Contrary to this, other markets are seeing their sellers hold off, not wanting to trade their low mortgage rates for considerably higher ones, or realizing they have missed the peak, they are simply not putting their homes up for sale. This means that inventory levels are not increasing at the expected rate, which will slow the fall of home prices for these markets.
Equally, there is still a housing shortage in many luxury markets, albeit a highly varied one depending on the location and price point. However, in certain high-demand communities, there simply isn’t any inventory available because it was all snapped up during the last two years.
One thing is certain, now more than ever, it is important to work with a luxury property specialist to ascertain what is truly happening in your local marketplace. The art of selling and buying in this market needs a critical and analytical approach; understanding the realities and setting expectations accordingly will ensure that goals are achieved.

Median List Price $1,668,750 $1,599,000
Median Sale Price $1,362,500 $1,275,000
Median SP/LP Ratio 100.00% 98.43%
Total Sales Ratio 52.39% 27.53%
Median Price per Sq. Ft. $397 $430
Total Inventory 33,154 54,616
New Listings 11,720 18,310
Total Sold 17,368 15,035
Median Days on Market 15 22
Average Home Size 3,425 3,190
Market Type:
• Homes are selling for an
of 98.43%
• The median luxury threshold2 price is $925,000, and the median luxury home sales price is $1,275,000.
• Markets with the Highest Median Sales Price: Aspen ($7,750,000), Whistler ($5,815,000), Vail ($4,500,000), and Los Angeles Beach Cities ($4,260,000).
• Markets with the Highest Sales Ratio: Cleveland Suburbs (94%), East Bay (75%), St. Louis (62%) and
County (62%).
1Sales Ratio defines market speed and
type:
Median
State Market Name
Median List Price Median Sold Price Inventory
$1,100,000 $960,000 557 264 142 24 Seller's AZ Chandler and Gilbert $1,069,850 $970,000 269 87 82 48 Seller's AZ Flagstaff $1,397,000 $1,182,000 94 23 14 81 Buyer's AZ Mesa $847,000 $830,000 236 71 70 42 Seller's AZ Paradise Valley $4,999,000 $3,600,000 133 31 15 44 Buyer's AZ Phoenix $850,000 $775,000 935 317 275 45 Seller's AZ Scottsdale $1,850,000 $1,570,000 737 231 139 49 Balanced
AB Calgary
AZ Tucson $699,900 $640,000 850 279 223 12 Seller's
BC Mid Vancouver Island $1,599,900 $1,440,000 199 69 15 22 Buyer's BC Okanagan Valley $1,779,500 $1,587,500 928 243 65 41 Buyer's BC Vancouver $4,480,000 $3,638,800 1187 312 59 17 Buyer's
BC Victoria $2,299,000 $2,067,000 136 67 27 49 Balanced
BC Whistler $4,500,000 $5,815,000 52 11 4 97 Buyer's
CA Central Coast $2,755,000 $2,600,000 245 80 72 13 Seller's CA East Bay $2,195,000 $1,920,000 527 295 397 16 Seller's CA Greater Palm Springs $1,895,000 $1,567,500 298 151 70 37 Seller's CA Lake Tahoe $2,495,000 $1,697,500 194 30 38 28 Balanced
CA Los Angeles Beach Cities $5,997,000 $4,260,000 304 102 77 17 Seller's CA Los Angeles City $4,995,000 $3,405,000 684 219 120 24 Balanced
CA Los Angeles The Valley $2,458,888 $2,100,000 507 213 140 24 Seller's CA Marin County $3,895,000 $2,950,000 136 20 30 11 Seller's CA Napa County $4,750,000 $2,650,000 117 16 20 20 Balanced
CA Orange County $2,549,000 $2,212,500 1031 336 370 19 Seller's CA Placer County $1,159,000 $1,082,500 274 86 88 23 Seller's CA Sacramento $945,000 $905,000 711 284 255 18 Seller's CA San Diego $2,099,000 $1,850,000 1144 439 303 19 Seller's CA San Francisco $4,497,500 $3,182,500 166 66 48 14 Seller's CA San Luis Obispo County $1,799,000 $1,395,000 161 50 72 37 Seller's CA Santa Barbara $6,495,000 $3,537,500 127 44 40 16 Seller's CA Silicon Valley $3,950,000 $3,350,000 526 266 245 12 Seller's CA Sonoma County $2,500,000 $1,625,000 225 43 47 32 Balanced
CA Ventura County $2,074,000 $1,660,000 262
38 Seller's CO Aspen $14,900,000 $7,750,000 95 5 3
Buyer's CO Boulder $2,185,000 $1,650,000 228 88 73 42 Seller's CO Colorado Springs $900,000 $859,000 428
Seller's
State Market Name
Median List Price Median Sold Price
Inventory
CO Denver 286 CO Douglas County CO Durango 27 Seller's CO Summit County 90 11 Buyer's CO Telluride 82 6 Buyer's CO Vail 81 10
ON GTA - Durham $1,749,000 $1,555,000 211 136 46 14 Seller's ON GTA - York $2,375,000 $1,880,000 563 327 137 13 Seller's ON Hamilton $1,839,500 $1,510,000 254 121 27 23 Buyer's ON Mississauga $2,950,000 $2,310,000 137 64 26 18 Balanced ON Oakville $2,514,900 $2,400,000 132 82 33 17 Seller's ON Toronto $3,799,444 $3,100,000 420 178 54 20 Buyer's ON Waterloo Region $1,474,000 $1,300,000 166 103 49 12 Seller's OR Portland $1,350,000 $1,075,000 615 248 283 6 Seller's QC Montreal $1,999,000 $1,600,000 363 87 16 39 Buyer's SC Hilton Head $2,095,000 $1,349,000 243 58 55 12 Seller's TN Greater Chattanooga $965,000 $824,000 180 49 43 4 Seller's TN Nashville $1,699,900 $1,355,500 653 246 220 4 Seller's TX Austin $1,098,222 $995,000 1242 586 354 9 Seller's TX Collin County $749,000 $717,786 1445 681 627 11 Seller's TX Dallas $1,300,000 $1,004,001 450 209 186 11 Seller's
TX Denton County $775,786 $750,000 1101 508 425 9 Seller's TX El Paso $610,800 $583,000 154 53 29 15
Balanced
TX Fort Worth $825,000 $800,000 970 393 465 8 Seller's
CT Central Connecticut $699,000 $625,000 185 7 CT Coastal Connecticut 37 DC Washington D.C. 51 Balanced DE Sussex County Coastal FL Boca Raton/Delray Beach $2,590,000 $2,125,000 112 20 Buyer's FL Coastal Pinellas County 88 13 12 28 Buyer's FL Greater Fort Lauderdale $1,050,000 27 Balanced FL Jacksonville Beaches $1,472,125 $1,150,000 306 96 61 26 Balanced FL Lee County 83 68 33 Buyer's FL Marco Island $2,762,500 $2,761,500 100 18 10 85 Buyer's FL Miami $1,999,450 $1,450,000 180 Buyer's FL Naples $4,900,000 $3,600,000 44 18 27 Buyer's FL Orlando $1,250,000 $1,120,000 176 136 22 Balanced
FL Palm Beach Towns $3,450,000 $2,010,300 235 48 26 39 Buyer's FL & Beaches $2,872,500 $1,895,000 252 Balanced
FL South Pinellas County $1,599,000 $1,225,000 251
FL South Walton $2,300,000 $2,100,000
38 Buyer's FL Space Coast
Tampa $749,000 $684,000
Seller's FL Weston
Atlanta
Duluth
HI Island of Hawaii
Balanced
Kauai
Buyer's
TX Greater Tyler $737,500 $611,500 148 77 48 9 Seller's TX Houston $979,000 $880,000 1149 439 333 9 Seller's TX Lubbock $652,500 $599,950 88 34 28 50 Seller's TX San Angelo $650,000 $594,950 51 27 16 68 Seller's TX San Antonio $799,070 $717,515 636 262 191 16 Seller's TX The Woodlands & Spring $809,000 $741,000 213 119 162 7 Seller's UT Park City $4,250,000 $3,075,000 202 57 16 7 Buyer's UT Salt Lake City $1,132,096 $979,000 469 210 157 21 Seller's VA Arlington & Alexandria $2,250,000 $1,850,000 77 32 49 6 Seller's VA Charlottesville $1,300,000 $1,019,000 144 22 44 6 Seller's VA Fairfax County $1,999,900 $1,500,000 346 113 152 7 Seller's VA McLean & Vienna $2,750,000 $1,850,000 147 31 61 6 Seller's VA Richmond $799,900 $790,153 291 110 197 6 Seller's
Buyer's HI Maui $2,997,000 $2,558,000
Oahu
ID Ada County $786,900 $799,990
Northern Idaho
VA Smith Mountain Lake $1,750,000 $1,325,000 33 9 8 4 Seller's WA King County - Greater Seattle $1,970,000 $1,695,000 1014 543 538 6 Seller's WA Seattle $1,893,217 $1,715,000 254 140 167 6 Seller's WA Spokane $1,150,000 $987,500 135 62 46 9 Seller's
Chicago $1,275,000
DuPage County $1,173,000 $863,750
Median prices represent properties priced above respective city benchmark prices. Prices shown for Canadian cites are shown in Canadian Dollars.
State Market Name
Median List Price Median Sold Price
Inventory
IL Lake County $912,500
Will County $649,900 $615,000
IN Hamilton County $839,998 $750,000 78
Seller's
ON GTA - Durham $1,749,000 $1,555,000 211 136 46 14 Seller's ON GTA - York $2,375,000 $1,880,000 563 327 137 13 Seller's ON Hamilton $1,839,500 $1,510,000 254 121 27 23 Buyer's ON Mississauga $2,950,000 $2,310,000 137 64 26 18 Balanced
Seller's MA Cape Cod
Johnson County $824,385 $822,639
ON Oakville $2,514,900 $2,400,000 132 82 33 17 Seller's ON Toronto $3,799,444 $3,100,000 420 178 54 20 Buyer's
MA Greater Boston 73 Seller's MA South Shore 72 29
MD Anne Arundel County $964,500 $869,000 78
Frederick County $875,000 $865,170 61
Seller's MD Howard County
MD Montgomery County $1,850,000 $1,505,000
MD Talbot County 40 9 11
ON Waterloo Region $1,474,000 $1,300,000 166 103 49 12 Seller's OR Portland $1,350,000 $1,075,000 615 248 283 6 Seller's QC Montreal $1,999,000 $1,600,000 363 87 16 39 Buyer's SC Hilton Head $2,095,000 $1,349,000 243 58 55 12 Seller's TN Greater Chattanooga $965,000 $824,000 180 49 43 4 Seller's TN Nashville $1,699,900 $1,355,500 653 246 220 4 Seller's
TX Austin $1,098,222 $995,000 1242 586 354 9 Seller's TX Collin County $749,000 $717,786 1445 681 627 11 Seller's TX Dallas $1,300,000 $1,004,001 450 209 186 11 Seller's
Worcester County 56 18 13
Livingston County 104 31 20 20 Balanced
Monroe County $650,000 $547,000 13 4 4
TX Denton County $775,786 $750,000 1101 508 425 9 Seller's TX El Paso $610,800 $583,000 154 53 29 15
Oakland County 975 20
Balanced TX Fort Worth $825,000 $800,000 970 393 465 8 Seller's
Washtenaw County
Seller's MI Wayne County
16
Olmsted County 83
Twin Cities $1,199,000 $1,042,500
Kansas City
St. Louis
Asheville $1,150,000
Charlotte $1,100,000
Lake Norman Seller's
Raleigh-Durham
Ocean County $900,000 $820,000
Taos $984,500
Lake Tahoe
Las Vegas
Reno $1,925,000 $1,900,000
Buyer's
Buyer's
Buyer's
TX Greater Tyler $737,500 $611,500 148 77 48 9 Seller's TX Houston $979,000 $880,000 1149 439 333 9 Seller's TX Lubbock $652,500 $599,950 88 34 28 50 Seller's TX San Angelo $650,000 $594,950 51 27 16 68 Seller's TX San Antonio $799,070 $717,515 636 262 191 16 Seller's TX The Woodlands & Spring $809,000 $741,000 213 119 162 7 Seller's UT Park City $4,250,000 $3,075,000 202 57 16 7 Buyer's UT Salt Lake City $1,132,096 $979,000 469 210 157 21 Seller's VA Arlington & Alexandria $2,250,000 $1,850,000 77 32 49 6 Seller's VA Charlottesville $1,300,000 $1,019,000 144 22 44 6 Seller's VA Fairfax County $1,999,900 $1,500,000 346 113 152 7 Seller's VA McLean & Vienna $2,750,000 $1,850,000 147 31 61 6 Seller's VA Richmond $799,900 $790,153 291 110 197 6 Seller's
Finger Lakes $866,000
Nassau County
VA Smith Mountain Lake $1,750,000 $1,325,000 33 9 8 4 Seller's WA King County - Greater Seattle $1,970,000 $1,695,000 1014 543 538 6 Seller's WA Seattle $1,893,217 $1,715,000 254 140
Staten Island $999,000
Suffolk County $1,185,000
Cincinnati $849,900 $770,000
Median prices represent properties priced above respective city benchmark prices. Prices shown for Canadian cites are shown in Canadian Dollars.
Seller's
Seller's WA Spokane $1,150,000 $987,500 135
State Market Name
Median List Price Median Sold Price
Inventory
OH Cleveland Suburbs $699,900 $689,000 31 13 Durham 57
ON GTA - Durham $1,749,000 $1,555,000 211 136 46 14 Seller's ON GTA - York $2,375,000 $1,880,000 563 327 137 13 Seller's ON Hamilton $1,839,500 $1,510,000 254 121 27 23 Buyer's ON Mississauga $2,950,000 $2,310,000 137 64 26 18 Balanced
ON Oakville $2,514,900 $2,400,000 132 82 33 17 Seller's ON Toronto $3,799,444 $3,100,000 420 178 54 20 Buyer's
GTA - York 127 11 Seller's Hamilton 119 Buyer's Mississauga Buyer's Oakville 71 Seller's Toronto 8 Balanced ON Waterloo Region 82 2 54 Buyer's OR Portland 225 201 Seller's QC Montreal 159 Buyer's SC Hilton Head $2,065,000 $1,672,500 20
ON Waterloo Region $1,474,000 $1,300,000 166 103 49 12 Seller's OR Portland $1,350,000 $1,075,000 615 248 283 6 Seller's QC Montreal $1,999,000 $1,600,000 363 87 16 39 Buyer's SC Hilton Head $2,095,000 $1,349,000 243 58 55 12 Seller's TN Greater Chattanooga $965,000 $824,000 180 49 43 4 Seller's TN Nashville $1,699,900 $1,355,500 653 246 220 4 Seller's
TX Austin $1,098,222 $995,000 1242 586 354 9 Seller's TX Collin County $749,000 $717,786 1445 681 627 11 Seller's TX Dallas $1,300,000 $1,004,001 450 209 186 11 Seller's
TX Denton County $775,786 $750,000 1101 508 425 9 Seller's TX El Paso $610,800 $583,000 154 53 29 15
Balanced
Greater Chattanooga $984,060 50 53 22 TN Nashville $1,345,000 662 11 Austin $1,095,000 32 Collin County $749,900 $699,599 1421 22 Dallas $1,299,000 $1,135,925 435 22 Denton County 1129 375 327 Seller's El Paso 51 33 25 Balanced Fort Worth 343 354 20 Greater Tyler 198 69 44 22 Houston 1156 446 264 Lubbock 103 San Angelo 53 16 11 Balanced San Antonio 33
TX Fort Worth $825,000 $800,000 970 393 465 8 Seller's TX Greater Tyler $737,500 $611,500 148 77 48 9 Seller's TX Houston $979,000 $880,000 1149 439 333 9 Seller's TX Lubbock $652,500 $599,950 88 34 28 50 Seller's TX San Angelo $650,000 $594,950 51 27 16 68 Seller's TX San Antonio $799,070 $717,515 636 262 191 16 Seller's TX The Woodlands & Spring $809,000 $741,000 213 119 162 7 Seller's UT Park City $4,250,000 $3,075,000 202 57 16 7 Buyer's UT Salt Lake City $1,132,096 $979,000 469 210 157 21 Seller's VA Arlington & Alexandria $2,250,000 $1,850,000 77 32 49 6 Seller's VA Charlottesville $1,300,000 $1,019,000 144 22 44 6 Seller's VA Fairfax County $1,999,900 $1,500,000 346 113 152 7 Seller's VA McLean & Vienna $2,750,000 $1,850,000 147 31 61 6 Seller's VA Richmond $799,900 $790,153 291 110 197 6 Seller's
TX The Woodlands & Spring $799,945 $737,313 122 13 Seller's Park City $3,882,725 27 28 Balanced UT Salt Lake City 491 188 144 36 Arlington & Alexandria 89 Balanced Charlottesville 38 29 Balanced Fairfax County 134 18 McLean & Vienna $2,773,975 $1,829,943 54 30 20 Balanced Richmond $799,450 $770,833 336 119
VA Smith Mountain Lake $1,750,000 $1,325,000 33 9 8 4 Seller's WA King County - Greater Seattle $1,970,000 $1,695,000 1014 543 538 6 Seller's WA Seattle $1,893,217 $1,715,000 254 140 167 6 Seller's WA Spokane $1,150,000 $987,500 135 62 46 9 Seller's
VA Smith Mountain Lake 21 6 12 21 King County - Greater Seattle 1143
Seattle $1,700,000 178 143 14 WA Spokane $1,095,000 $1,010,000 148 72
14 Seller's
Median prices represent properties priced above respective city benchmark prices. Prices shown for Canadian cites are shown in Canadian Dollars.
State Market Name
Median List Price Median Sold Price
AB Calgary $750,000 $720,000 145 44 29 46 Balanced
AZ Chandler and Gilbert
AZ Flagstaff
AZ Mesa
AZ Paradise Valley AZ Phoenix
AZ Scottsdale $872,500 $690,000 208 60 44 48 Seller's AZ Tucson
BC Mid Vancouver Island $869,900 $822,722 67 36 10 46 Buyer's BC Okanagan Valley
BC Vancouver $1,998,000 $1,787,500 1018 400 56 27 Buyer's
BC Victoria $971,950 $930,000 142 94 32 35 Seller's BC Whistler $2,518,500 $1,917,500 40 15 2 56 Buyer's
CA Central Coast $1,249,000 $1,075,000 29 13 31 14 Seller's CA East Bay $1,100,000 $1,072,500 155 86 102 17 Seller's CA Greater Palm Springs
CA Lake Tahoe
$1,850,000 $1,846,289 29 8 8 26 Seller's CA Los Angeles Beach Cities $1,850,000 $1,618,750 155 58 58 16 Seller's
CA Los Angeles City $1,649,000 $1,392,500 383 133 78 26 Balanced
CA Los Angeles The Valley $799,000 $785,000 144 54 64 23 Seller's CA Marin County $1,300,000 $977,500 32 2 10 13 Seller's CA Napa County
CA Orange County $1,180,000 $1,129,995 382 164 162 25 Seller's CA Placer County CA Sacramento
CA San Diego $1,124,000 $1,031,000 413 176 156 19 Seller's CA San Francisco $2,750,000 $2,500,000 139 34 25 33 Balanced
CA San Luis Obispo County
CA Santa Barbara $1,695,000 $1,625,000 13 9 8 6 Seller's
CA Silicon Valley $1,684,444 $1,610,000 120 66 74 15 Seller's CA Sonoma County $914,500 $744,750 20 5 10 32 Seller's CA Ventura County $750,000 $747,000 118 50 64 25 Seller's CO Aspen $3,649,000 $3,637,500 38 6 6 64 Balanced CO Boulder $876,950 $955,000 74 37 40 48 Seller's CO Colorado Springs $590,156 $602,500 44 10 18 13 Seller's
State Market Name
CO Denver $998,500 $795,000 51
CO Douglas County $570,000 $560,000 26 8 10
ON GTA - Durham $1,749,000 $1,555,000 211 136 46 14 Seller's ON GTA - York $2,375,000 $1,880,000 563 327 137 13 Seller's ON Hamilton $1,839,500 $1,510,000 254 121 27 23 Buyer's ON Mississauga $2,950,000 $2,310,000 137 64 26 18 Balanced
CO Durango $793,905 $720,000 21 3 7 Seller's CO Summit County 33 8 Seller's CO Telluride
CO Vail 64 11 1 Seller's CT Central Connecticut
CT Coastal Connecticut $795,000 44 59 28 DC Washington D.C. 127 Balanced
DE Sussex County Coastal $949,450 $889,000 26 11 FL Boca Raton/Delray Beach 14
FL Coastal Pinellas County $988,150 29 24 25 FL Greater Fort Lauderdale $849,000 888 33 Balanced FL Jacksonville Beaches $1,197,000 34 6 8 47
FL Lee County $850,000 $795,000 53 37 29 Balanced
ON Oakville $2,514,900 $2,400,000 132 82 33 17 Seller's ON Toronto $3,799,444 $3,100,000 420 178 54 20 Buyer's ON Waterloo Region $1,474,000 $1,300,000 166 103 49 12 Seller's OR Portland $1,350,000 $1,075,000 615 248 283 6 Seller's QC Montreal $1,999,000 $1,600,000 363 87 16 39 Buyer's SC Hilton Head $2,095,000 $1,349,000 243 58 55 12 Seller's TN Greater Chattanooga $965,000 $824,000 180 49 43 4 Seller's TN Nashville $1,699,900 $1,355,500 653 246 220 4 Seller's TX Austin $1,098,222 $995,000 1242 586 354 9 Seller's TX Collin County $749,000 $717,786 1445 681 627 11 Seller's TX Dallas $1,300,000 $1,004,001 450 209 186 11 Seller's
TX Denton County $775,786 $750,000 1101 508 425 9 Seller's TX El Paso $610,800 $583,000 154 53 29 15 Balanced
FL Marco Island $1,697,000 $1,225,000 34 6 4 16 Buyer's FL Miami $1,399,250 $1,250,000 1280 250 111 Buyer's FL Naples $2,300,000 $2,100,000 42 29 11 Balanced FL Orlando
FL Palm Beach Towns
$1,750,000 $1,650,000 224 71 24 21 Buyer's FL & Beaches $1,700,000 $1,360,000 125
FL South Pinellas County $1,077,500 178 Balanced FL South Walton $1,543,800 $1,150,000
50
Space Coast 27 29 28
Tampa $829,000 $675,000
Seller's FL Weston
Atlanta $715,000 $649,500
TX Fort Worth $825,000 $800,000 970 393 465 8 Seller's TX Greater Tyler $737,500 $611,500 148 77 48 9 Seller's TX Houston $979,000 $880,000 1149 439 333 9 Seller's TX Lubbock $652,500 $599,950 88 34 28 50 Seller's TX San Angelo $650,000 $594,950 51 27 16 68 Seller's TX San Antonio $799,070 $717,515 636 262 191 16 Seller's TX The Woodlands & Spring $809,000 $741,000 213 119 162 7 Seller's UT Park City $4,250,000 $3,075,000 202 57 16 7 Buyer's UT Salt Lake City $1,132,096 $979,000 469 210 157 21 Seller's VA Arlington & Alexandria $2,250,000 $1,850,000 77 32 49 6 Seller's VA Charlottesville $1,300,000 $1,019,000 144 22 44 6 Seller's
Duluth
HI Island of Hawaii
HI Kauai
HI Maui $2,195,000 $1,900,000
Oahu $900,000
ID Ada County $650,000 $660,000
Northern Idaho
VA Fairfax County $1,999,900 $1,500,000 346 113 152 7 Seller's VA McLean & Vienna $2,750,000 $1,850,000 147 31 61 6 Seller's VA Richmond $799,900 $790,153 291 110 197 6 Seller's VA Smith Mountain Lake $1,750,000 $1,325,000 33 9 8 4 Seller's WA King County - Greater Seattle $1,970,000 $1,695,000 1014 543 538 6 Seller's WA Seattle $1,893,217 $1,715,000 254 140 167 6 Seller's WA Spokane $1,150,000 $987,500 135 62 46 9 Seller's
Chicago
DuPage County $925,000 $775,000
Markets with dashes do not have a
are shown in
for
priced above
prices. Prices shown for
State Market Name
IL Lake County
ON GTA - Durham
Will County
IN Hamilton County
KS Johnson County
Cape Cod
Greater Boston
$594,610 $598,520
MA South Shore $830,000 $810,000
MD Anne Arundel County $580,000 $555,740
Frederick County
Howard County $599,990 $582,500
Montgomery County
Talbot County
$1,749,000 $1,555,000 211 136 46 14 Seller's ON GTA - York $2,375,000 $1,880,000 563 327 137 13 Seller's ON Hamilton $1,839,500 $1,510,000 254 121 27 23 Buyer's ON Mississauga $2,950,000 $2,310,000 137 64 26 18 Balanced ON Oakville $2,514,900 $2,400,000 132 82 33 17 Seller's ON Toronto $3,799,444 $3,100,000 420 178 54 20 Buyer's ON Waterloo Region $1,474,000 $1,300,000 166 103 49 12 Seller's OR Portland $1,350,000 $1,075,000 615 248 283 6 Seller's QC Montreal $1,999,000 $1,600,000 363 87 16 39 Buyer's SC Hilton Head $2,095,000 $1,349,000 243 58 55 12 Seller's TN Greater Chattanooga $965,000 $824,000 180 49 43 4 Seller's TN Nashville $1,699,900 $1,355,500 653 246 220 4 Seller's TX Austin $1,098,222 $995,000 1242 586 354 9 Seller's
Worcester County $699,500
Livingston County
Monroe County
Oakland County
Washtenaw County
Wayne County
Olmsted County
Twin Cities
Kansas City
St. Louis
Asheville
Charlotte
Lake Norman
Raleigh-Durham
Ocean County
TX Collin County $749,000 $717,786 1445 681 627 11 Seller's TX Dallas $1,300,000 $1,004,001 450 209 186 11 Seller's TX Denton County $775,786 $750,000 1101 508 425 9 Seller's TX El Paso $610,800 $583,000 154 53 29 15 Balanced TX Fort Worth $825,000 $800,000 970 393 465 8 Seller's TX Greater Tyler $737,500 $611,500 148 77 48 9 Seller's TX Houston $979,000 $880,000 1149 439 333 9 Seller's TX Lubbock $652,500 $599,950 88 34 28 50 Seller's TX San Angelo $650,000 $594,950 51 27 16 68 Seller's TX San Antonio $799,070 $717,515 636 262 191 16 Seller's TX The Woodlands & Spring $809,000 $741,000 213 119 162 7 Seller's UT Park City $4,250,000 $3,075,000 202 57 16 7 Buyer's UT Salt Lake City $1,132,096 $979,000 469 210 157 21 Seller's VA Arlington & Alexandria $2,250,000 $1,850,000 77 32 49 6 Seller's VA Charlottesville $1,300,000 $1,019,000 144 22 44
Taos
Seller's VA Fairfax County $1,999,900 $1,500,000 346 113 152
Lake Tahoe
Seller's VA McLean & Vienna $2,750,000 $1,850,000 147 31 61
Las Vegas
Reno
Seller's
Seller's VA Richmond $799,900 $790,153 291 110 197
Smith Mountain Lake $1,750,000 $1,325,000 33
Finger Lakes
Seller's
WA King County - Greater Seattle $1,970,000 $1,695,000 1014
Nassau County
Staten Island
WA Seattle $1,893,217 $1,715,000
WA Spokane $1,150,000 $987,500
Suffolk County
Cincinnati
State Market Name
Median List Price Median Sold Price Inventory
ON GTA - Durham
Durham
$847,900 $825,000 35 28
Buyer's GTA - York $799,000 $782,500 Seller's Hamilton $887,400 $925,000 22
Mississauga $972,500 $918,000
Oakville 32 20 8 Seller's Toronto 190
ON Waterloo Region $799,950 $735,000 48 36
Buyer's OR Portland $719,000 $620,000
Seller's QC Montreal
Buyer's SC Hilton Head $1,045,000
Greater Chattanooga TN Nashville $749,750
$1,749,000 $1,555,000 211 136 46 14 Seller's ON GTA - York $2,375,000 $1,880,000 563 327 137 13 Seller's ON Hamilton $1,839,500 $1,510,000 254 121 27 23 Buyer's ON Mississauga $2,950,000 $2,310,000 137 64 26 18 Balanced ON Oakville $2,514,900 $2,400,000 132 82 33 17 Seller's ON Toronto $3,799,444 $3,100,000 420 178 54 20 Buyer's ON Waterloo Region $1,474,000 $1,300,000 166 103 49 12 Seller's OR Portland $1,350,000 $1,075,000 615 248 283 6 Seller's QC Montreal $1,999,000 $1,600,000 363 87 16 39 Buyer's SC Hilton Head $2,095,000 $1,349,000 243 58 55 12 Seller's TN Greater Chattanooga $965,000 $824,000 180 49 43 4 Seller's TN Nashville $1,699,900 $1,355,500 653 246 220 4 Seller's TX Austin $1,098,222 $995,000 1242 586 354 9 Seller's
Austin
Collin County
Dallas
Denton County El Paso
Fort Worth
Greater Tyler Houston
Lubbock San Angelo
San Antonio
Buyer's TX The Woodlands & Spring Park City $2,100,000
UT Salt Lake City $594,780 $559,900
Arlington & Alexandria $949,950 $980,000
Charlottesville $774,900 $686,700
Fairfax County $775,000 $705,000
McLean & Vienna $1,192,975
TX Collin County $749,000 $717,786 1445 681 627 11 Seller's TX Dallas $1,300,000 $1,004,001 450 209 186 11 Seller's TX Denton County $775,786 $750,000 1101 508 425 9 Seller's TX El Paso $610,800 $583,000 154 53 29 15 Balanced TX Fort Worth $825,000 $800,000 970 393 465 8 Seller's TX Greater Tyler $737,500 $611,500 148 77 48 9 Seller's TX Houston $979,000 $880,000 1149 439 333 9 Seller's TX Lubbock $652,500 $599,950 88 34 28 50 Seller's TX San Angelo $650,000 $594,950 51 27 16 68 Seller's TX San Antonio $799,070 $717,515 636 262 191 16 Seller's TX The Woodlands & Spring $809,000 $741,000 213 119 162 7 Seller's UT Park City $4,250,000 $3,075,000 202 57 16 7 Buyer's UT Salt Lake City $1,132,096 $979,000 469 210 157 21 Seller's VA Arlington & Alexandria $2,250,000 $1,850,000 77 32 49 6 Seller's VA Charlottesville $1,300,000 $1,019,000 144 22 44 6 Seller's VA Fairfax County $1,999,900 $1,500,000 346 113 152 7 Seller's VA McLean & Vienna $2,750,000 $1,850,000 147 31 61 6 Seller's VA Richmond $799,900 $790,153 291 110 197 6 Seller's VA Smith Mountain Lake $1,750,000 $1,325,000 33 9 8 4 Seller's
Richmond
VA Smith Mountain Lake
WA King County - Greater Seattle $1,970,000 $1,695,000 1014 543 538 6 Seller's WA Seattle $1,893,217 $1,715,000 254 140
King County - Greater Seattle $975,000
Seattle $1,472,500
WA Spokane
Markets with dashes
Seller's
Seller's WA Spokane $1,150,000 $987,500
©2020 Corcoran Pacific Properties. All rights reserved. Corcoran® and the Corcoran Logo are registered service marks owned by Corcoran Group LLC. Corcoran Pacific Properties fully supports the principles of the Fair Housing Act and the Equal Opportunity Act. Each franchise is independently owned and operated.