ANSWER KEY
e
Forms and Sources of Energy
In the United States we use a variety of resources to meet our energy needs. Use the information below to analyze how each energy source is stored and delivered.
1
Using the information from the Forms of Energy chart and the graphic below, determine how energy is stored or delivered in each of the sources of energy. Remember, if the source of energy must be burned, the energy is stored as chemical energy.
NONRENEWABLE
2
RENEWABLE
Petroleum
CHEMICAL
Biomass
CHEMICAL
Coal
CHEMICAL
Hydropower MOTION
Natural Gas
CHEMICAL
Wind
MOTION
Uranium
NUCLEAR
Solar
RADIANT
Propane
CHEMICAL
Geothermal THERMAL
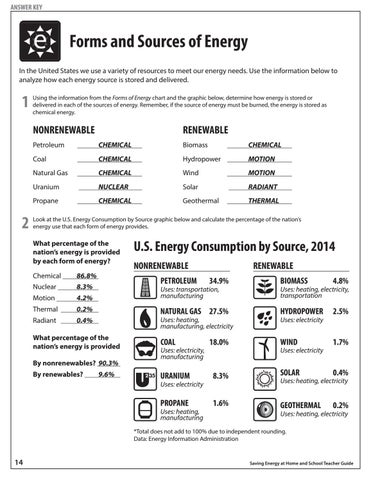
Look at the U.S. Energy Consumption by Source graphic below and calculate the percentage of the nation’s energy use that each form of energy provides.
What percentage of the nation’s energy is provided by each form of energy? Chemical 86.8% Nuclear 8.3%
U.S. Energy Consumption by Source, 2014 NONRENEWABLE PETROLEUM
RENEWABLE 34.9%
BIOMASS
4.8%
Uses: heating, electricity, transportation
Motion 4.2%
Uses: transportation, manufacturing
Thermal 0.2%
NATURAL GAS 27.5%
HYDROPOWER
2.5%
COAL
18.0%
WIND
1.7%
URANIUM
8.3%
SOLAR
0.4%
PROPANE
1.6%
GEOTHERMAL
0.2%
Radiant 0.4% What percentage of the nation’s energy is provided By nonrenewables? 90.3% By renewables? 9.6%
Uses: heating, manufacturing, electricity Uses: electricity, manufacturing
Uses: electricity
Uses: heating, manufacturing
Uses: electricity
Uses: electricity
Uses: heating, electricity
Uses: heating, electricity
*Total does not add to 100% due to independent rounding. Data: Energy Information Administration
14
Saving Energy at Home and School Teacher Guide