Essential components of crypto charts | Hello crypto
Cryptocurrency charts serve as valuable tools for traders and investors to analyze market trends and make informed decisions. In this guide, we’ll walk you through the essential components of crypto charts and provide insights into interpreting them effectively.

Types of Crypto Charts
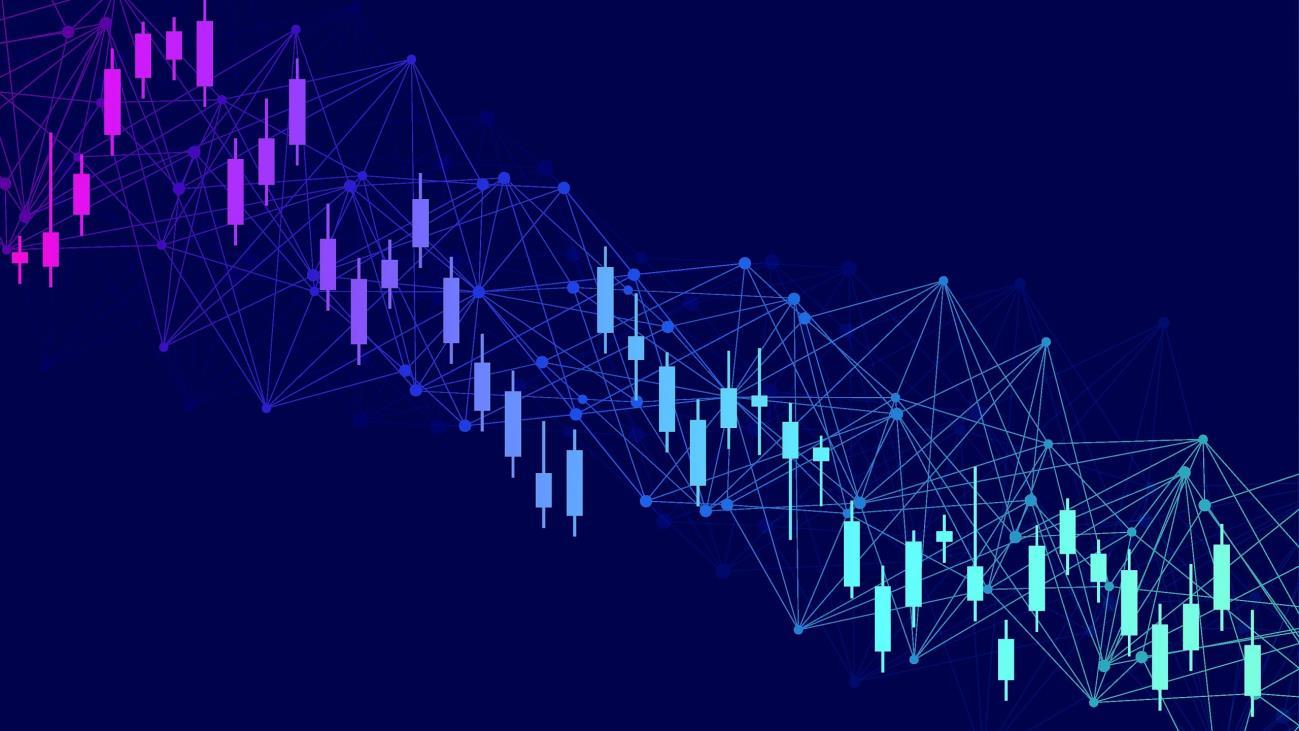
There are several types of charts used in crypto trading, with the most common ones being line charts, bar charts, and candlestick charts. Candlestick charts are particularly popular due to their ability to convey a wealth of information in a single visual. Understanding how to read crypto charts is crucial for successful crypto trading.
Key Elements of a Crypto Chart
Reading Crypto charts typically display price data on the y-axis and time intervals on the x-axis. Each data point represents the closing price of an asset within a specific time frame. The most critical components of a crypto chart include candlesticks, wicks, and bodies. Understanding these elements is fundamental to chart analysis.
Common Chart Patterns and Their Interpretation
Here are common chart patterns and interpretations:
1. Head and Shoulders: This pattern suggests a reversal from bullish to bearish trends or vice versa. The “head” is the highest point, flanked by two “shoulders.” A neckline connects the lows of the two shoulders.
2. Double/Triple Tops or Bottoms: These patterns indicate potential trend reversals. Double tops/bottoms consist of two prominent peaks or troughs, while triple tops/bottoms involve three.
3. Ascending/Descending Triangles: These indicate potential breakout scenarios. Ascending triangles show a flat top and rising bottom while descending triangles have a flat bottom and declining top.
Using Technical Indicators
Technical indicators, such as Moving Averages (MA) and Relative Strength Index (RSI), provide insights into market trends and momentum. MAs smooth out price data over a specific period, aiding in trend identification. RSI measures the speed and change of price movements, helping traders identify overbought or oversold conditions.
Interpreting Volume and Time Frames
Volume refers to the number of assets traded within a specified period. High volume during price movements can indicate the strength of a trend. Different time frames (e.g., hourly, daily, weekly) provide varying insights. Short-term traders might focus on hourly charts, while long-term investors might analyze weekly or monthly charts.
Conclusion
Mastering the art of reading crypto charts is a skill that takes time to develop. By understanding different chart types, patterns, technical indicators, and time frames, you can gain insights into market trends and make more informed trading decisions. Remember that successful chart analysis requires a blend of knowledge, experience, and a keen eye for detail. Keep practicing and refining your skills to become a proficient crypto chart reader.
FAQs about Reading Crypto Charts
Q1: Do I need to be a technical expert to read crypto charts effectively?
No, while some technical knowledge can be helpful, many resources and tools simplify chart analysis for beginners.
Q2: Can crypto charts predict future prices accurately?
Charts provide historical data and patterns, aiding in making informed predictions, but they’re not foolproof indicators of future prices.
Q3: How do I identify a trend using crypto charts?
Trends can be identified by observing higher highs and higher lows (uptrend) or lower highs and lower lows (downtrend) over a period.
Q4: What’s the significance of support and resistance levels?
Support levels indicate where prices often stop falling and might reverse, while resistance levels mark where prices often stop rising.
Q5: Are there mobile apps for crypto chart analysis?
Yes, many trading platforms offer mobile apps with charting tools, allowing you to analyze charts on the go. Follow

