This report is prepared pursuant to T.C.A. § 49-4-708(e), which instructs the Tennessee Higher Education Commission (THEC) and Tennessee Student Assistance Corporation (TSAC) to:
“…provide assistance to the general assembly by researching and analyzing data concerning [Tennessee Promise], including, but not limited to, student success and scholarship retention. TSAC and the Tennessee Higher Education Commission shall publish its findings annually in the report required by § 49-4-903(b).”
In pursuit of its mission to increase the number of Tennesseans with a postsecondary credential, THEC and TSAC have implemented various programs and initiatives to encourage Tennesseans to engage with higher education and support students through completion. Among the most prominent and highly publicized of these programs (and the focus of this report) is the Tennessee Promise, signed into law by the Tennessee General Assembly in 2014.
Mr. Mike Ragsdale | Vice Chair | Dandridge | East Tennessee
Mr. Vernon Stafford, Jr. | Vice Chair | Collierville | West Tennessee
Ms. Whitney Allmon | Secretary | Dyersburg | West Tennessee
Mr. Jimmy Matlock | Lenoir City | East Tennessee
Mr. Will Perry | Memphis | West Tennessee
Mr. John Rader | Nashville | Middle Tennessee
Mr. Charles Wood | Chattanooga | East Tennessee
Mr. Tre Hargett | Secretary of State
Mr. David H. Lillard, Jr. | State Treasurer
Mr. Jason E. Mumpower | State Comptroller
Dr. Sara Heyburn Morrison | Executive Director, State Board of Education
Tennessee Student Assistance Corporation
2024-25 Board of Directors
Governor Bill Lee | Chairman | Governor of Tennessee
Dr. Flora Tydings | Vice-Chairman | Chancellor, Tennessee Board of Regents
Mr. David H. Lillard, Jr. | Treasurer | State Treasurer
Dr. Cameron Conn | Secretary | Tennessee Independent Colleges and Universities Association
Mr. Randy Boyd| President, University of Tennessee
Mr. Jim Bryson | Commissioner, Tennessee Department of Finance and Administration
Ms. Maya Leon | Student Representative
Mr. Jason E. Mumpower | State Comptroller
Ms. Lizzette Reynolds | Commissioner, Tennessee Department of Education
Ms. Samantha Sullivan | President, Tennessee Association of Student Financial Aid Administrators
Mr. Cyrus Vatandoost| President, Tennessee Proprietary Business School Association
Executive Summary
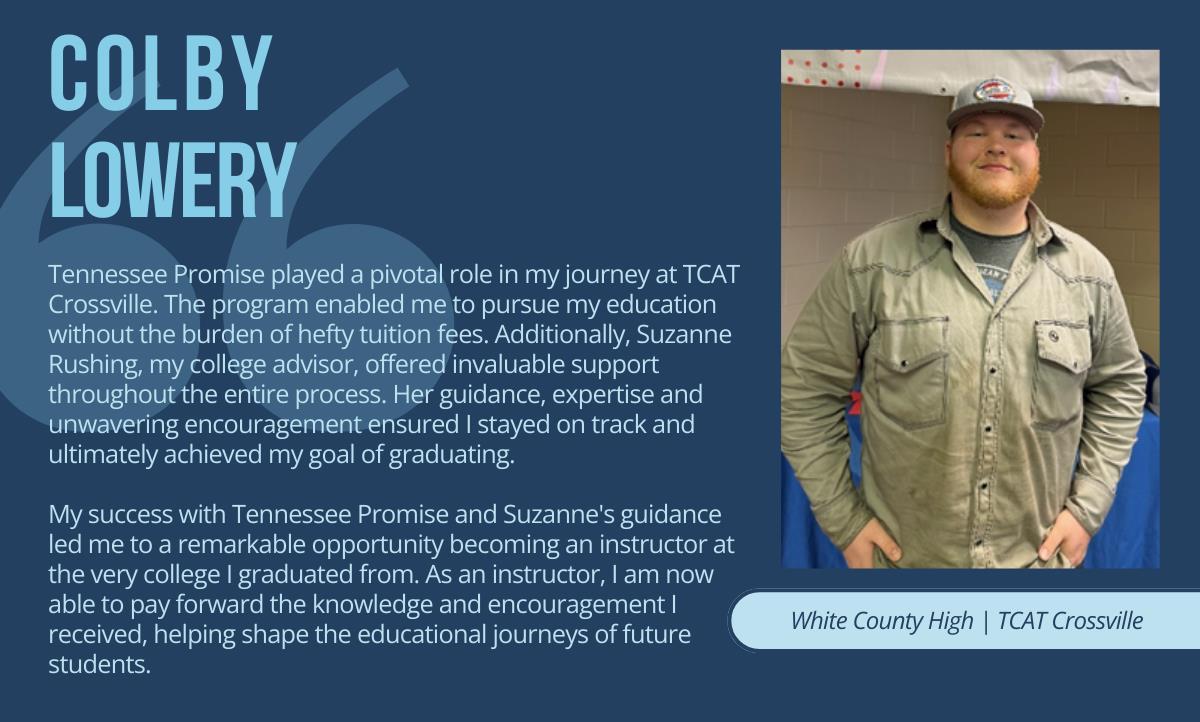
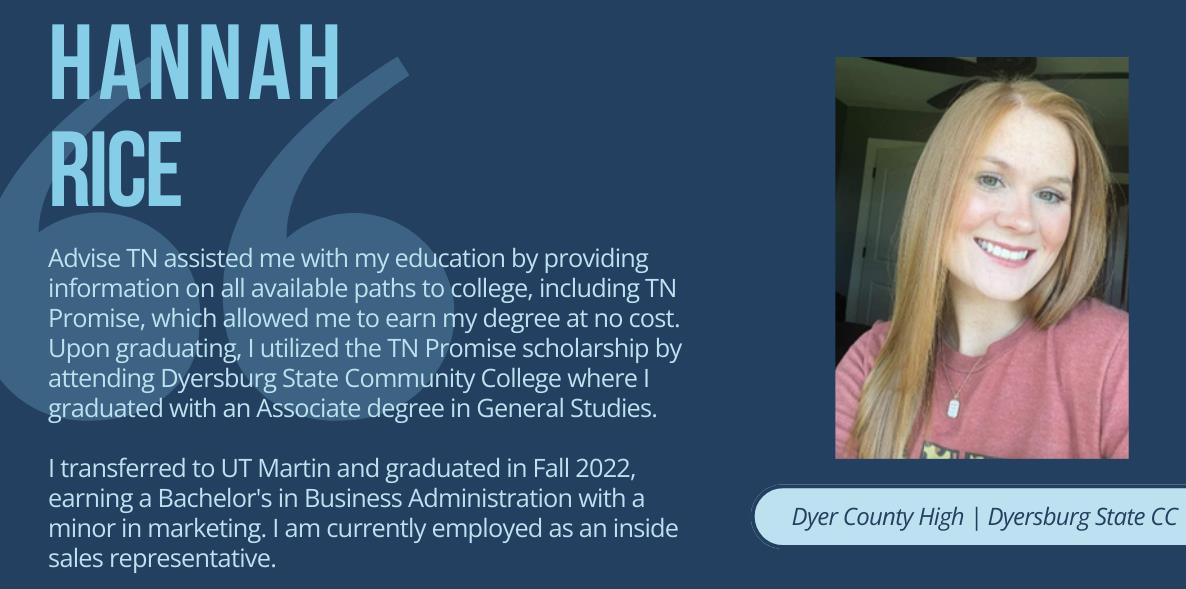
The Tennessee Higher Education Commission (THEC) is proud to celebrate the 10-year anniversary of the Tennessee Promise program in 2024, a milestone in the state's ongoing commitment to increasing access to higher education. Tennessee was the first state in the country to implement a college promise program providing tuition- and fee-free community and technical college to high school graduates. Since 2014, $231 million has supported the enrollment of more than 140,000 students in their pursuit of college, creating a more skilled and competitive workforce in Tennessee. Stories of some of these students are highlighted throughout this report.
The 2024 Tennessee Promise Annual Report presents descriptive data on Tennessee Promise applicants and students, student outcomes, student transfer behavior, and program finances. As of this report, ten cohorts of Tennessee Promise students have matriculated into eligible public and private institutions, including the 2024-25 cohort of Tennessee Promise students. The 2024-25 cohort is excluded from the analyses in this report because they are enrolled in their first or second semester of college at the time of report release.
Key findings from each section of the report are summarized below.
Applicants
• 64,548 high school seniors applied for Tennessee Promise to enroll in college in the 2023-24 academic year. Of those applicants:
• 55,894 (86.6%) filed the Free Application for Federal Student Aid (FAFSA) on-time,
• 30,393 (47.1%) completed the community service requirements necessary to receive Tennessee Promise,
• 15,812 (24.5%) were eligible to receive Tennessee Promise, and
• 13,904 (21.5%) were certified and enrolled at an eligible public institution in the 2023-24 academic year.1
• The share of Tennessee Promise applicants who enrolled as Tennessee Promise students in the 202324 cohort (21.5%) remained consistent with the 2022-23 cohort (21.7%), both of which were slightly lower than the 2021-22 cohort (22.2%). All three recent cohorts continue to trail the 2020-21 cohort enrollment rate (26.4%) (Table 3).
Students
• Disparities persist in who converts from being a Tennessee Promise applicant into a Tennessee Promise student. In the 2023-24 cohort, 19.8% of Tennessee Promise applicants are Black, while only 13.2% of Tennessee Promise students are Black. This represents a narrowing of the gap by 1.5 percentage points compared to the previous cohort. Applicants are 49.5% male, while students are 47.5% male. Finally, Tennessee Promise students have higher adjusted gross incomes (AGIs) and expected family contributions (EFCs) than applicants (Table 4).
1 Certified and enrolled students are those who have 1) a certified payment record of Tennessee Promise scholarship dollars in THEC’s financial aid database and 2) a record of enrollment at an eligible public institution. For more information about how THEC defines a student who is certified and enrolled at an eligible institution, see the Methods section of this report, beginning on page 10
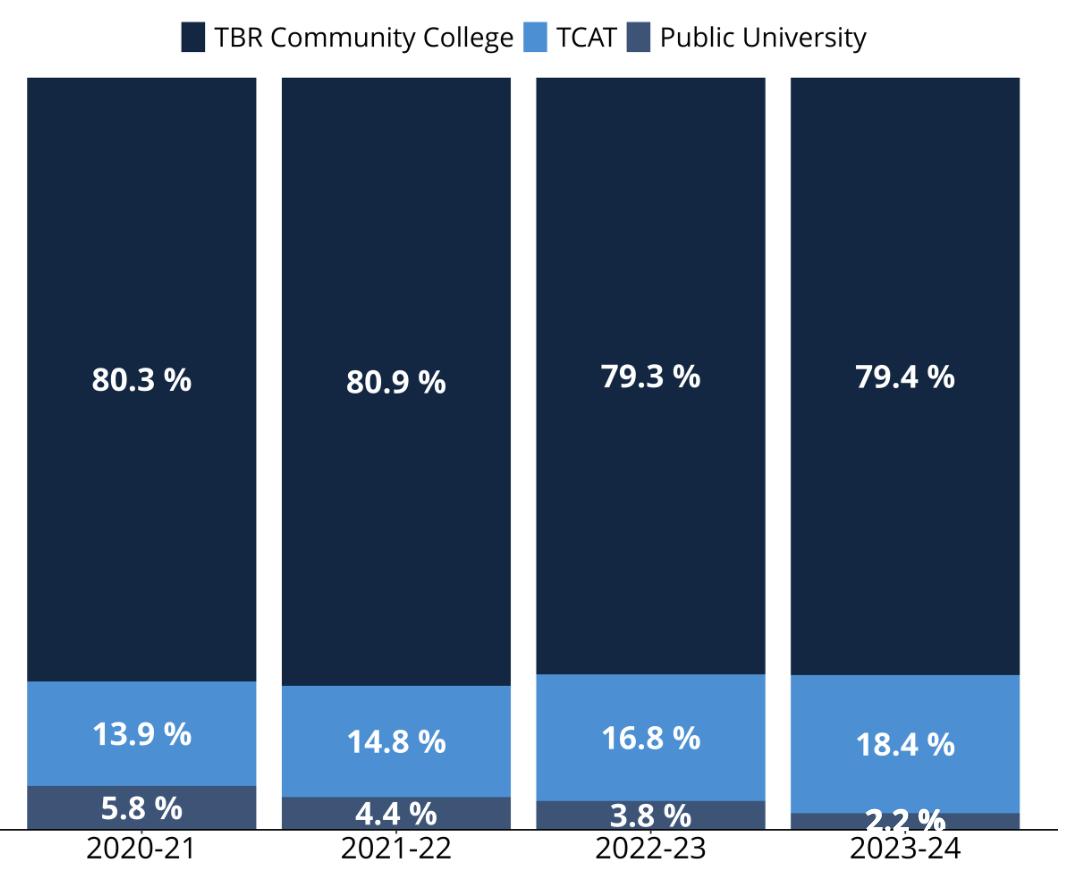
• An increasing share of Tennessee Promise students are enrolling at Tennessee Colleges of Applied Technology (TCATs), though the vast majority (approximately 80%) enroll at community colleges. In the 2023-24 cohort, 18.4% of Tennessee Promise students first enrolled at a TCAT, the largest share of any Tennessee Promise student cohort (Figure 4).
Outcomes
• Tennessee Promise students in the 2023-24 cohort attempted 13.8 credit hours on average in their first semester, and they earned 10.2 of those credit hours, on average (Figure 6 and Figure 7). Some students, for various reasons, earn zero credits in their first semester. This represents 1,363 (or 12.0% of) students in the 2023-24 cohort who are enrolled at eligible public, non-TCAT institutions.
• As of fall 2023, nearly 22,000 Tennessee Promise students have transferred to a Tennessee public university to continue their education (Table 7).
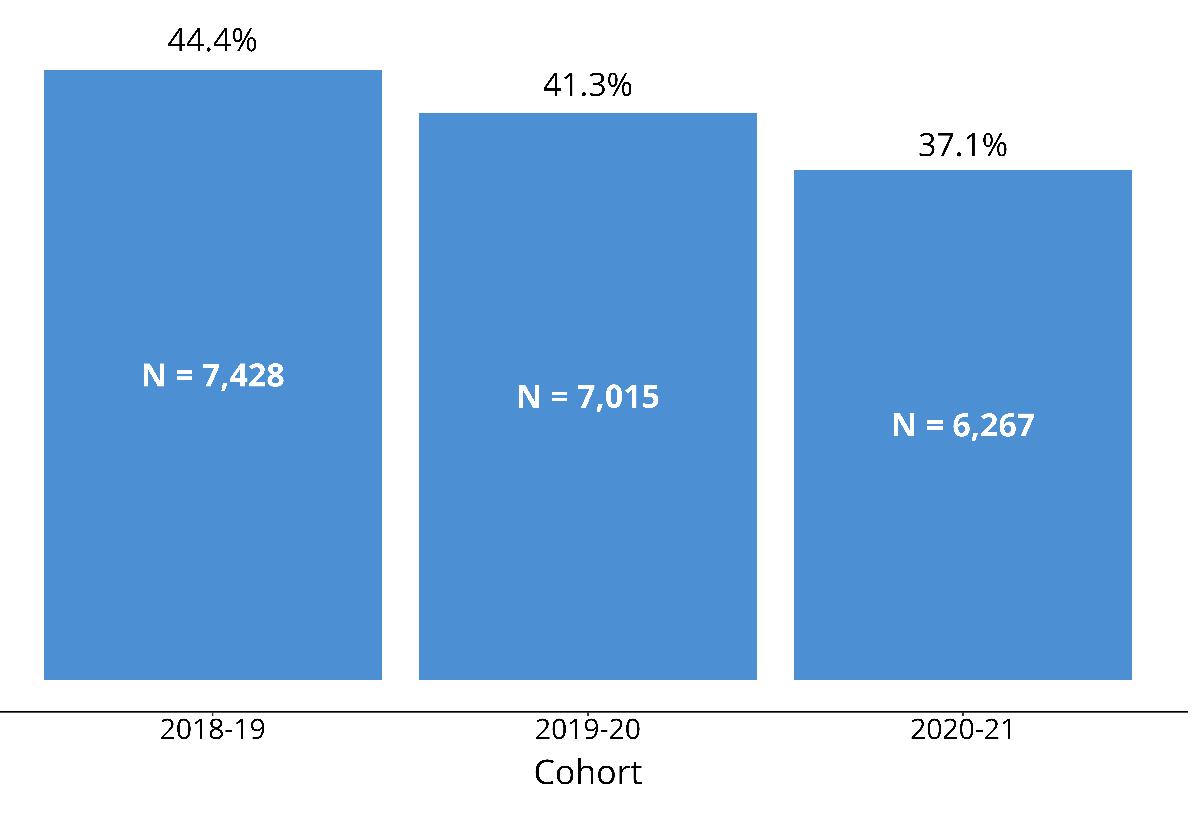
• Over 49,400 Tennessee Promise students have earned a credential since the program began. A total of 6,267 students (37.1%) in the 2020-21 cohort have earned at least a certificate. Figure 1 demonstrates the number of students in recent cohorts and the share of the cohort who have earned a credential.
• Success rates are highlighted in a series of figures (Figure 8, Figure 9, Figure 10) for the 2020-21 through 2022-23 cohorts, illustrating their first 3 years (fall and spring semesters only) of Tennessee Promise eligibility. The 2022-23 cohort saw a 2.5 percentage point increase in the share of students who either earned an award or who were retained from fall to spring during their first year relative to the 2021-22 cohort. The fall to spring dropout rate for 2022-23 cohort declined to 16.2%, marking the lowest rate historically observed.
Figure 1: Share of Tennessee Promise Students Earning Any Postsecondary Credential, 2018-19 Through 2020-21 Cohorts
Completion Grants
New this year is the addition of the Completion Grants Report within the TN Promise report. The Completion Grants Report (2024) is the third of four reports analyzing the completion grants pilot program initiated by the Tennessee General Assembly in 2021. Three years of completion grant participation data was available at the time of reporting. This report focuses on results from the pilot program’s first three years and provides early data on outcomes for recipients of completion grants.
Key findings from the report include:
• In year three (2023-24), the pilot continued to expand to 3,289 unique students with 17,863 completion grants, totaling over $2.09 million (Table 11 and Table 12).
• Individual students may receive multiple grants. Grants represent the number of completion grants awarded, whereas recipients represent the number of students receiving completion grants. In year three (2023-24), students received an average of 5.4 grants with an average total amount of $634.40 per student (Table 12).
• Food and Transportation remained the categories demonstrating the highest need in year three of the pilot (Table 13), and the amount of grant money awarded in these categories expanded (Figure 13). This may reflect students’ ongoing, rather than one-time, need for food and transportation support, as well as limits set on individual grant amounts, while students may not face expenses for books, supplies, and fees as often.
• Compared to coaching students, Black and Hispanic students make up a larger share of completion grant recipients. When compared to Tennessee Promise cohorts overall, women, Black, and Hispanic students are disproportionately represented in the college coaching program (Table 14).
• Student persistence after receiving completion grants is high – 86.7% of fall recipients persisted to spring (Table 15) – and over 830 students who received a grant have gone on to earn a credential so far (Table 17).
Recommendations
Net price at Tennessee’s community colleges has grown 1% over the past five years for Tennessee’s lowest income families.2 This increase, though seemingly modest, stands in contrast to the trends observed at the national level and within the Southern Regional Education Board (SREB) states, where there has been a general decrease in net price for similar income groups. Meanwhile, the cost at Tennessee’s community colleges for highest income families have decreased by 21% over the same period, marking the largest change across income levels.
While Tennessee has a robust portfolio of financial aid available, students still face financial barriers to completion, and the cost to enroll and remain enrolled in higher education extends beyond tuition and mandatory fees. Students who receive Federal Pell grants and Tennessee Student Assistance Award (TSAA) dollars typically receive little, if any, scholarship money directly from Tennessee Promise, which is a consequence of the program’s last-dollar structure. TSAA and Completion Grants present two
opportunities for the state to make postsecondary education more affordable for the state’s lowest income families.
The Tennessee Student Assistance Award (TSAA) supports financially-needy residents of Tennessee in their undergraduate education. Recent increases to funding for TSAA have allowed TSAC to increase eligibility in alignment with Pell eligibility criteria, meaning students who receive a Pell grant are eligible for TSAA. Unfortunately, limited funding means that not all eligible students can be guaranteed an award. About twothirds of TSAA recipients come from homes with annual household incomes of less than $35,000. Approximately 24,200 students were eligible for TSAA in 2023-24 but were unable to receive TSAA due to funding limitations. Increasing funding for TSAA would make recent expansions to TSAA eligibility more impactful, as it would ensure more financially needy students can be awarded TSAA dollars. Additionally, the introduction of the FAFSA Simplification Act will expand the Federal Pell Grant to more students starting with the 2024–25 award year3, increasing the pool of TSAA eligibility. More funding for TSAA would allow low-income Tennessee Promise students to reap the non-scholarship benefits of the program, like mentorship, access to coaching, and access to completion grants, without additional cost to the Tennessee Promise program.
Completion grants are another way to support low-income students facing high non-tuition costs, such as housing, transportation, and textbooks, as they work to obtain a postsecondary credential. The Tennessee General Assembly created a pilot program in 2021 providing grants to low-income Tennessee Promise students, resulting in 17,863 completion grants totaling nearly $2.1 million in the 2023-24 academic year. Establishing permanent funding for the completion grants, with a focus on preserving funds for truly emergent needs, would ensure that students experiencing severe, unforeseen challenges can access the financial assistance needed to stay on track with their education. Limiting funding to emergency needs only, rather than anticipated needs like textbooks, would simplify administration of the program and ensure compliance with U.S. Department of Education guidance.4
Moreover, utilizing Open Educational Resources (OER) to ensure students can complete general education requirements without textbook costs would further reduce financial burdens on students. OER are education materials that can be freely downloaded, edited, and shared to better serve all students 5 By ensuring access to no-cost instructional materials, institutions can enhance student retention and completion.
Introduction
The 2024 Tennessee Promise Annual Report comprises five sections:
1. The first section provides descriptive characteristics for Tennessee Promise applicants through nine cohorts.
2. The second section provides descriptive characteristics for students who enrolled with Tennessee Promise.
3 Detailed information about Federal Pell Grant expansion can be found here: https://studentaid.gov/help-center/answers/article/fafsasimplification-act
4 Detailed information about U.S. Department of Education guidance regarding Other Financial Assistance can be found here: https://fsapartners.ed.gov/knowledge-center/library/dear-colleague-letters/2023-08-04/fafsa-simplification-act-changes-implementation-2024-25
5 More information about OER can be found here: https://www.tn.gov/thec/bureaus/academic-affairs/textbook.html
3. The third section examines the outcomes of Tennessee Promise students, including credit accumulation, degree completion, and transfer.
4. The fourth section provides information about program finances, including the total annual cost of the program and the average cost per student.
5. The fifth section summarizes completion grants participation and available outcomes data from the first three years of the pilot.
Data
Data in this report come from the THEC Student Information System (THECSIS) and the TSAC Financial Aid System of Tennessee (FAST) database. The THECSIS is used to assess enrollment, transfer, and completion while the TSAC FAST database is used to assess payments and financial aid. Data on completion grants is provided by the Tennessee Promise Partnering Organizations, tnAchieves and the Ayers Foundation Trust Each year, Partnering Organizations submit participants in college coaching, applicants for completion grants, and recipients of completion grants.
Privacy Notice
Throughout this report, THEC complies with federal Family Educational Rights and Privacy Act (FERPA) requirements to protect students’ personally identifiable information. When tables are presented, individual cells containing fewer than ten observations are suppressed. Adjacent cells may also be suppressed to prevent unmasking via subtraction (i.e., complementary suppression). The suppressed counts are included in the table totals.
Methods
To be eligible for Tennessee Promise, an applicant must complete all pre-enrollment milestones (apply for Tennessee Promise, file a FAFSA, attend a mandatory meeting, and complete 8 hours of community service) and enroll at an eligible institution in the summer or fall immediately following high school graduation.6
References to $0 Tennessee Promise students are made throughout this report. A Tennessee Promise student might have been paid $0 in a term for a few reasons:
1. Since Tennessee Promise is a last-dollar scholarship, some Tennessee Promise students receive zero dollars from Tennessee Promise because their tuition and fees are covered by other gift aid like Pell grants, the Tennessee Education Lottery Scholarship (TELS), or TSAA. Most $0 Tennessee Promise students fall into this category.
2. Some Tennessee Promise students receive a $0 payment for a term because they are on an approved leave of absence.
3. A student might also receive a $0 Tennessee Promise payment because, while he or she might be eligible to receive Tennessee Promise, their program of choice might be oversubscribed. In these instances, a student is placed on a “waitlist” until they can enroll in their desired program. A student
6 Students who graduate high school or homeschool, or who complete a GED/HiSET program in the fall semester may complete the Tennessee Promise application and pre-enrollment milestones and enroll in the spring semester, pursuant to T.C.A. § 49-4-708(c)(1)(C), which was amended in June 2022 to accommodate these students. Tennessee Promise also allows students to delay their initial enrollment or to take a leave of absence from continuous enrollment due to extenuating circumstances or to fulfill required military training.
maintains eligibility while on this waitlist, and so they are recorded in FAST as having received $0 from Tennessee Promise.
This report identifies Promise students paid at eligible private institutions but limits analysis to Promise students paid and enrolled at eligible public institutions due to limitations on private institutions’ enrollment data.
Program Description Update
The Tennessee Promise Program for the 2024-25 cycle reflects the structure detailed in the previous year’s report. However, due to ongoing challenges faced by students and families experiencing difficulties due to the federal implementation of the new FAFSA, the deadline for Tennessee Promise students from the 202425 cohort to file a FAFSA was extended to August 1st .
See last year’s Completion Grants Report for detail on the program structure and funding of the completion grant pilot program. In the data presented here, Books/Supplies and Class-Specific Fees are combined for year one and two. For year three, the breakdown is as follows:
• Books: Costs associated with books identified by the student as required for the coursework for which the student is registered.
• Supplies: supplies, i.e. computer, pencils, tools, pens, paper, folders, etc., as determined necessary by the student and/or associated with the coursework for which the student is registered.
• Class-Specific Fees: Costs associated with fees charged for a specific course.
The completion grant pilot established in T.C.A. § 49-7-178 is funded using repurposed funds from T.C.A. § 49-11-903, a work-based learning grant fund. In year two, the General Assembly appropriated an additional one-time $14,500,000 to tnAchieves to expand coaching and completion grants over five years. In year three of the pilot, the Ayers Foundation Trust received $33,000 for completion grants, while tnAchieves’s allocation for completion grants was$1,817,000. Additionally, tnAchieves utilized nearly $250,000 in private funds to support the Knox Promise, a community-based program serving Knox County high school graduates specifically with advising and additional financial supports. Students participating in coaching and completion grants in Knox County are not a part of year one and year two data, but they are included in year three data in this report. Knox Promise had 2,021 grants totaling $248,689.90 supporting 327 students in year three.
Knox Promise
Knox Promise is a first-of-its-kind community-based initiative designed to increase the number of students attending and ultimately graduating from college. While the program is deeply rooted in student success, it is also a community-based workforce development initiative. With the generosity of the Haslam Family Foundation, TN Achieves launched Knox Promise as a pilot program for the 2019 and 2020 Knox County high school graduating classes. Knox Promise helps Tennessee Promise students persist and succeed in attaining college degrees and credentials by providing additional financial and coaching support for students. Knox Promise helps students successfully navigate their way through college by addressing additional needs, closing lingering economic and equity gaps, and expanding the tnAchieves coaching model. All Knox County Tennessee Promise students have a dedicated COMPLETE Coach to support them during college. Knox Promise students also have access to Completion Grants under the same parameters as other students who are not a part of Knox Promise, though Knox Promise Completion Grants are funded from private donations. Each Knox Promise student is eligible to request up to $1,500 per semester. In 2021-22, Knox Promise supported 252 students with 1,272 grants totaling $200,584.46. In 2022-23, Knox Promise fulfilled 2,282 grants totaling $304,175.07 for 448 students. The inclusion of Knox Promise students utilizing grants in 2023-24 into the completion grants pilot data presents a more comprehensive picture of the needs facing Tennessee students across the state.
Section 1: Tennessee Promise Applicants
Tennessee Promise Applicants
Applying for Tennessee Promise involves several steps. Table 1 displays the total number of applicants completing each pre-enrollment step to be eligible for the Tennessee Promise scholarship. The number of applicants in the 2023-24 cohort increased over the 2022-23 cohort to a historic high. The 2023-24 cohort saw an increase in application and pre-enrollment activities, with notable rebounds in FAFSA completion, suggesting a continued recovery from the disruptions experienced in previous years.
Table 1: Tennessee Promise Application Process by Counts, 2020-21 Through 2023-24 Cohorts7
Notes: Community service requirements were waived for the 2020-21 cohort due to the COVID-19 pandemic. Cohort years refer to the first year a student is enrolled in postsecondary education. Summer 2024 enrollment data is not available at this time for the 2023-24 cohort
This report uses both payment data reported by TSAC’s FAST and enrollment information from THECSIS to determine Tennessee Promise enrollment. To be considered Enrolled at an Eligible Public Institution, an applicant must have completed all Tennessee Promise pre-enrollment requirements, be paid at a Tennessee Promise eligible institution in the academic year corresponding to their application cycle, and be found in enrollment data at an eligible public institution in the academic year corresponding to their application cycle
Table 2 below presents the proportion of applicants completing each step in the application process for the most recent cohort. The proportion of students who filed the FAFSA remained high at 86.6%, consistent with prior cohorts. However, the completion of community service requirements saw a slight decrease, with 47.1% of applicants fulfilling this obligation, down from 47.9% in the previous cohort. Similar to the 2022-23 cohort, 24.5% of applicants were eligible for Tennessee Promise, with 21.5% of the cohort enrolling in an eligible public institution.
7 Appendix B.1 recreates this table with all nine Tennessee Promise cohorts included.
Table 2: Tennessee Promise Application Process by Proportion, 2020-21 Through 2023-24 Cohorts 8
Notes: Community service requirements were waived for the 2020-21 cohort due to the COVID-19 pandemic. Cohort years refer to the first year a student is enrolled in postsecondary education. Summer 2024 enrollment data is not available at this time for the 2023-24 cohort.
Table 3 presents demographic information for all Tennessee Promise applicants in the 2020-21 through 2023-24 cohorts, including gender, race/ethnicity, first generation status, ACT composite score, and socioeconomic status. For the 2023-24 cohort, the gender distribution remained stable, and the proportion of first-generation applicants slightly increased to 32.0%. Notably, the proportion of Hispanic applicants increased by over one percentage point, rising from 9.2% in the 2022-23 cohort to 10.4% in the 2023-24 cohort.
Notes: First Generation status, Adjusted Gross Income (AGI), and Expected Family Contribution (EFC) are derived from the FAFSA and are only available for applicants with a FAFSA on record. “First generation” students are individuals whose parent(s) listed on their FAFSA did not indicate having a college degree. "Other" includes American Indian, Alaskan Native, Asian/Pacific Islander, and Multiracial students.
8 Appendix B.2 recreates this table with all nine Tennessee Promise cohorts included.
9 Appendix B.3 shows this table with all nine Tennessee Promise cohorts included.
Table 3: Demographics for Tennessee Promise Applicants, 2020-21 Through 2023-24 Cohorts 9
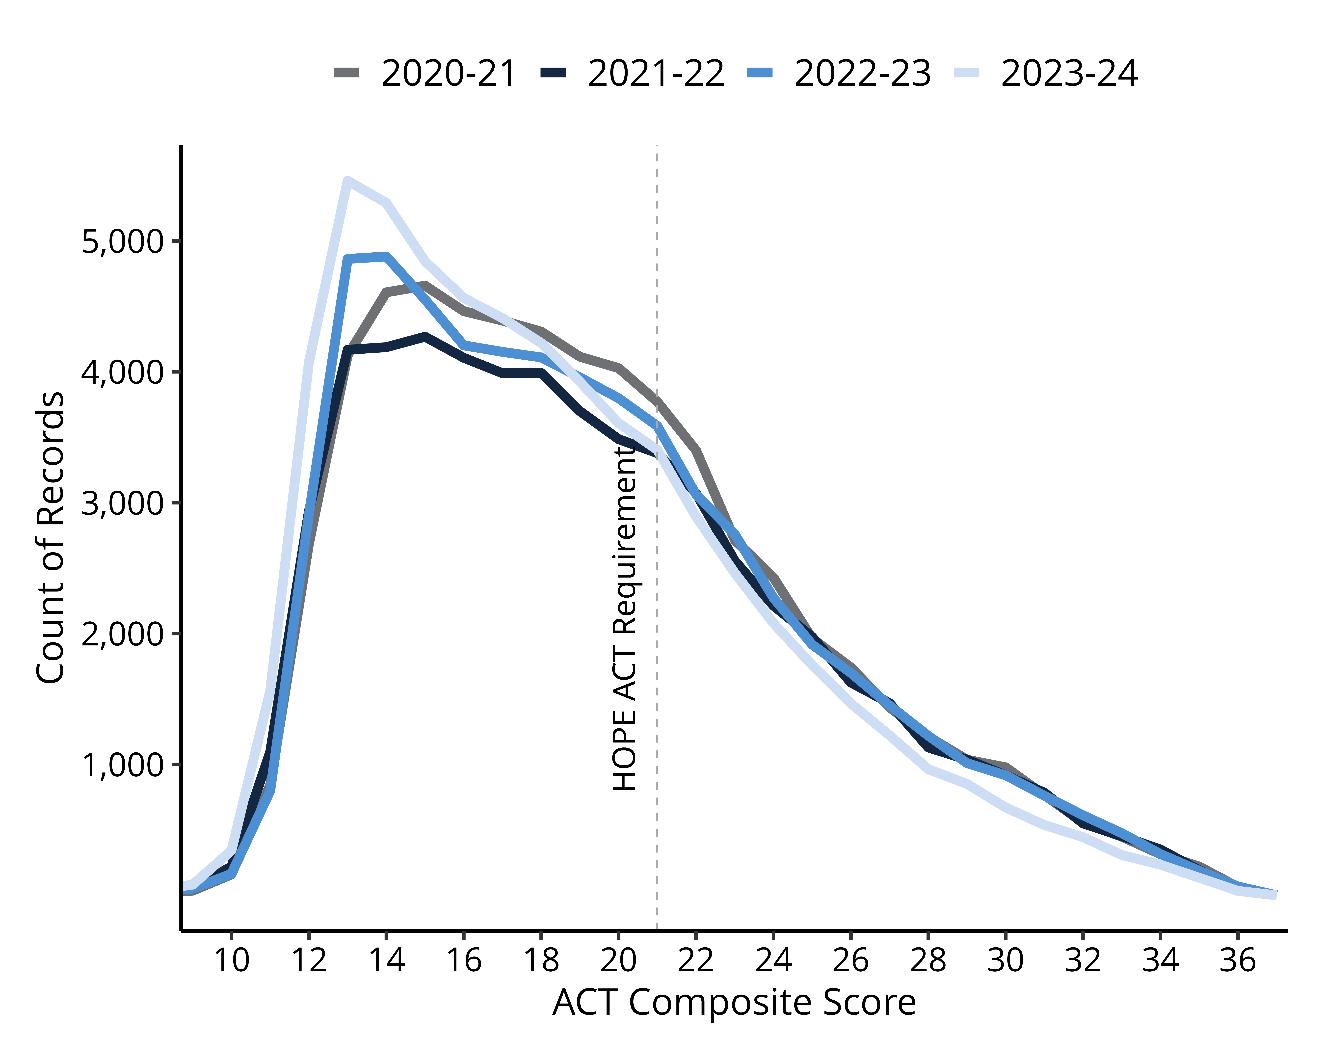
Figure 2 compares the distributions of ACT composite scores for each cohort of Tennessee Promise applicants since the 2020-21 cohort. The HOPE scholarship eligibility threshold is indicated by a vertical dashed line (a 21 or higher composite ACT score). The horizontal axis has been truncated to demonstrate the differences between groups more clearly. Looking at the peak of the distribution curve, falling to the left of the dashed line, most Promise applicants do not achieve a composite ACT score required to be awarded the HOPE scholarship.
Although Tennessee Promise applicants in the 2022-23 cohort recorded the same average composite ACT score as the 2021-22 cohort’s applicants (19.3), the 2023-24 cohort saw a decline in the average ACT score to 18.5. The distribution of scores for the 2023-24 cohort shows that more applicants had lower scores than in the three cohorts preceding it.
A decline in ACT scores aligns with both national and state trends. The ACT organization released a report showing five consecutive years of declines in average scores, with average scores declining in every academic subject.10 Similarly, the Tennessee Department of Education’s public data shows a one point decline in ACT scores for the 2022-23 academic year compared to the 2018-19 academic year.
Figure 2: Distribution of ACT Composite Scores, 2020-21 Through 2023-24 Cohorts
Section 2: Tennessee Promise Students
Tennessee Promise Students
This report defines Tennessee Promise students as those who are paid $0 or more and found in public postsecondary enrollment records in the academic year following their application. These students are certified in financial aid data and are also found in enrollment records at eligible public institutions. Some students might have an approved leave of absence or may be waitlisted for their program. While these students remain eligible for Tennessee Promise, they are excluded from these analyses because they do not yet appear in enrollment records.
Table 4 presents the demographic characteristics of Tennessee Promise students in the 2020-21 through 2023-24 cohorts as compared to the demographic characteristics of the overall applicant pool. In this comparison, the “Applicants” columns are representative of all Tennessee Promise applicants for each respective cohort, while Tennessee Promise students are only those who were certified by financial aid data and were found in enrollment records in the academic year corresponding to their application year.
While the percentage of Black Tennessee Promise applicants has remained mostly consistent from the 2020-21 cohort to the 2023-24 cohort (with a slight decrease from 20.6% to 19.8%), the share of Black Tennessee Promise students has increased to 13.2% in the 2023-24 cohort from 11.4% in the previous cohort. The gap between Black Tennessee Promise applicants and students has narrowed to 6.6 percentage points in 2023-24 cohort. However, the gap remains wider than the 5.5 percentage point gap in the 2020-21 cohort, indicating a persistent issue in conversion rate for Black students.
Male students comprise approximately 50% of applicants but make up approximately 47.5% of Tennessee Promise students. Notably, the proportion of male Tennessee Promise students has increased from 45.4% in the 2020-21 cohort to 47.5% in the 2023-24 cohort. Tennessee Promise students also have higher median Adjusted Gross Incomes (AGI) and Expected Family Contributions (EFC) than the overall pool of applicants.
Table 4: Tennessee Promise Applicants and Tennessee Promise Students, 2020-21 Through 2023-24 Cohorts 11
Cohort
Notes: First Generation status, Adjusted Gross Income (AGI), and Expected Family Contribution (EFC) are derived from the FAFSA and are only available for applicants with a FAFSA on record. “First generation” students are individuals whose parent(s) listed on their FAFSA did not indicate having a college degree. "Other" includes American Indian, Alaskan Native, Asian/Pacific Islander, and Multiracial students. Students enrolled at an eligible private institution, are on a program’s waitlist, or who have an approved leave of absence are captured in the “Applicants” counts but are not captured in the “Students” columns. In 2023-24, 0.1% of Tennessee Promise students’ gender is unknown.
11 Appendix B.4 recreates this table for the 2015-16 through the 2019-20 Tennessee Promise cohorts.
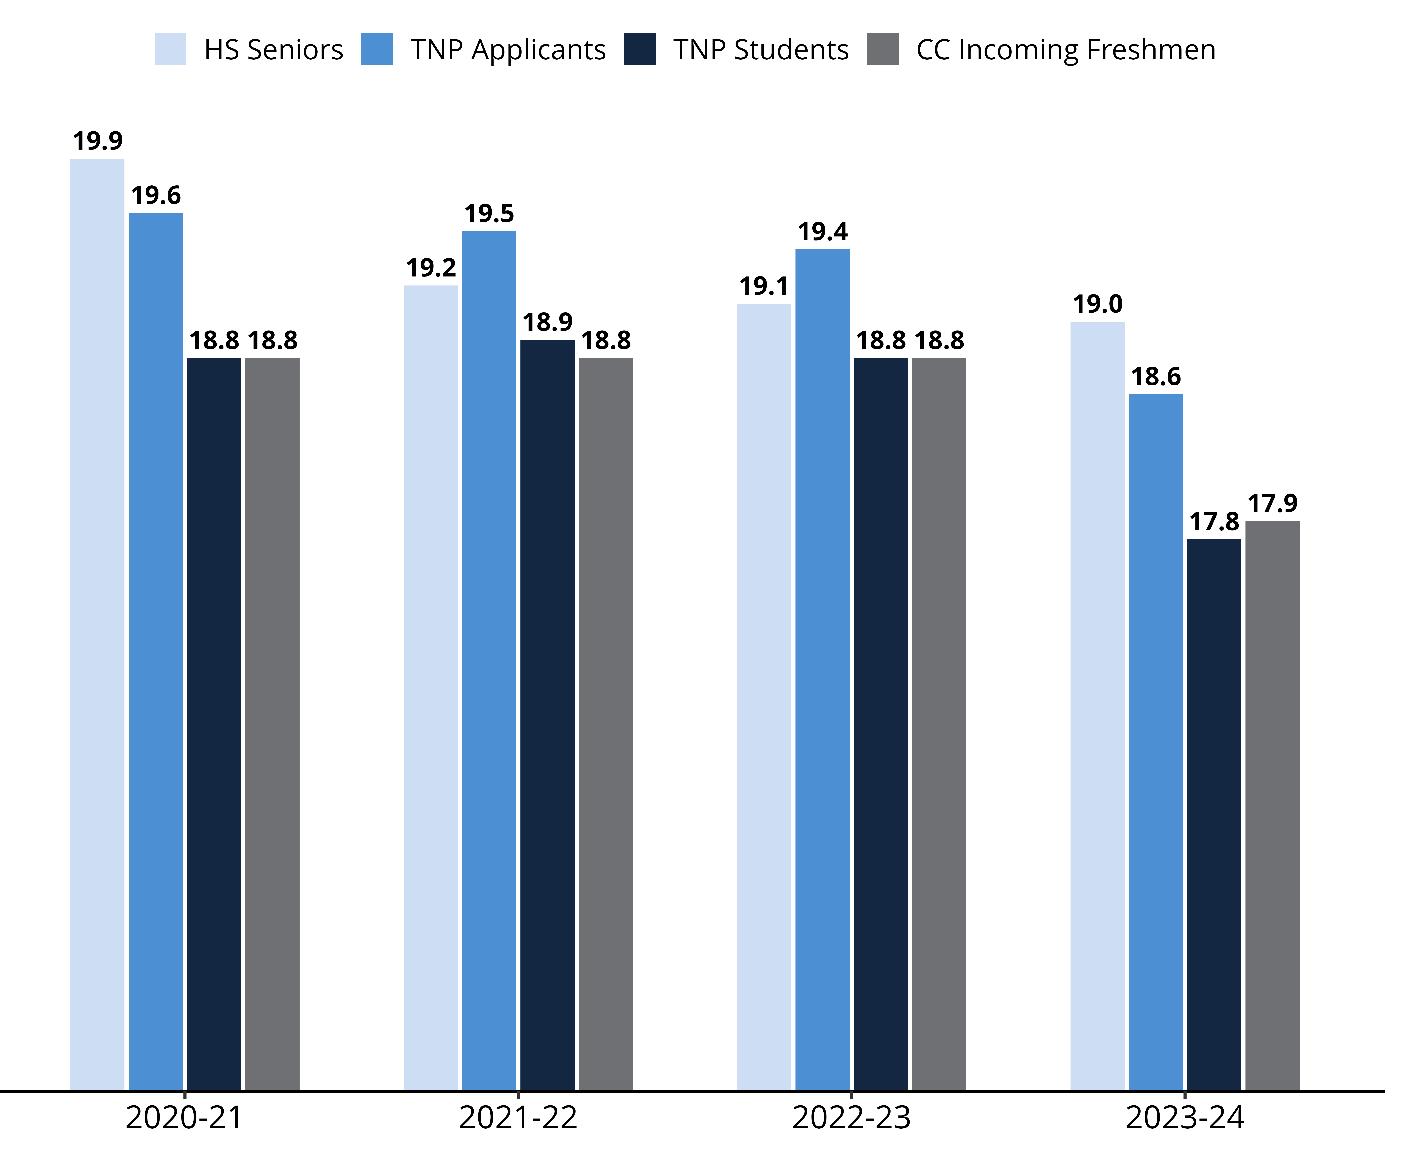
Figure 3 displays the average ACT composite scores for public high school graduates, Tennessee Promise applicants who did not ultimately enroll as a Promise student, Tennessee Promise students, and incoming freshmen at community colleges across the state. ACT scores range from 0-36.
Figure 3: Comparative ACT Composite Scores, 2020-21 Through 2023-24 Cohorts
Notes: High School Seniors’ ACT scores are sourced from the Tennessee Department of Education, who reports the highest ACT score earned for students. For Tennessee Promise Applicants, Tennessee Promise Students, and Community College Incoming Freshmen, ACT scores come first from ACT Inc., which records a student’s most recent test score. If a score is not available from ACT, scores are recorded from the TSAC FAST database or from THECSIS. Both FAST and THECSIS maintain the first ACT score reported for a student. Tennessee Promise applicants and Tennessee Promise students are exclusive groups in the figure above. “High School Seniors” and “Community College Incoming Freshmen” include Tennessee Promise applicants and students.
Figure 4 displays the sector in which Tennessee Promise students first enrolled. The vast majority of Tennessee Promise students enroll first at a community college, but a growing proportion are matriculating to TCATs. In the 2023-24 cohort, 18.4% of Tennessee Promise students enrolled at a TCAT, compared to 11.6% of students in the very first Tennessee Promise cohort and 13.9% in the 2020-21 cohort. Appendix A provides a more comprehensive view of this data including Tennessee Promise enrollment counts by institution.
First Enrollment of Tennessee Promise Students by Sector, 2020-21 Through 2023-24 Cohorts 12
Notes: Percentages may not sum to 100 due to rounding. Public University includes Austin Peay State University and Tennessee State University, and for the 2021-22 and 2022-23 cohorts only, University of Tennessee Southern was included University of Tennessee Southern will phase out its associate degrees on December 1, 2026.
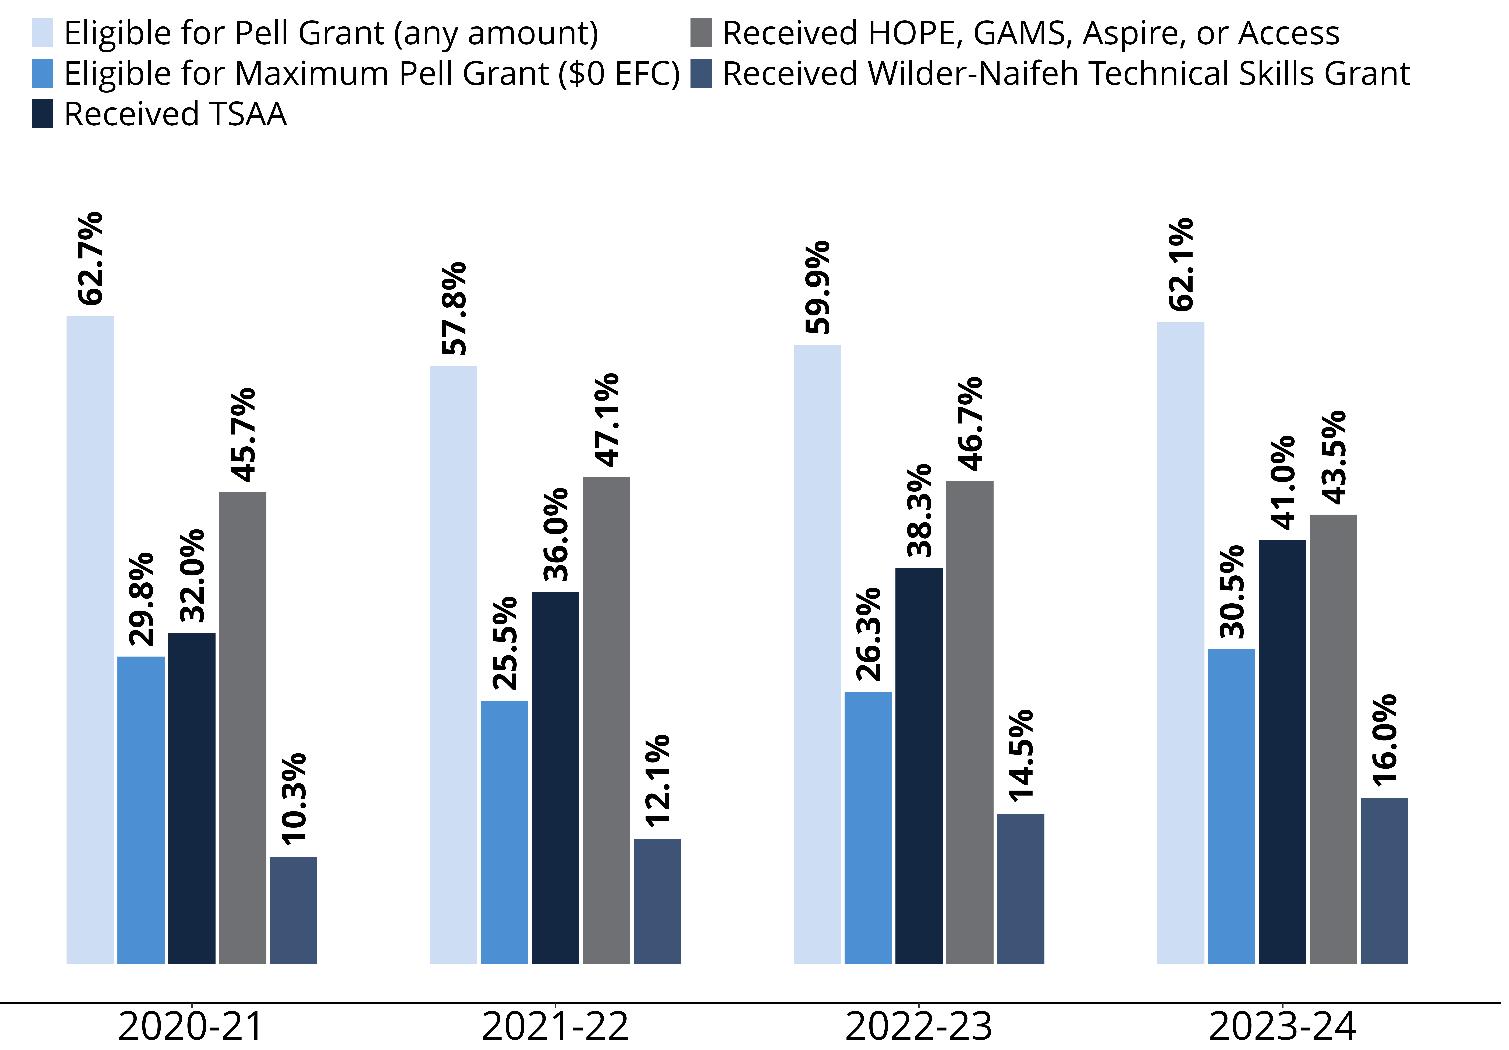
Figure 5 provides financial aid information for Tennessee Promise students in the 2020-21 through 202324 cohorts. If a student was ever eligible for a Pell grant (regardless of when or even if only for one semester), that student is included in the percentage of students who are eligible for a Pell Grant. As time
12 Appendix B.5 recreates this figure with all eight Tennessee Promise cohorts included.
Figure 4:
goes on, students are enrolled longer and more data becomes available, so the likelihood that students are ever eligible for a Pell Grant goes up.
Scholarship receipt is determined by what percentage of students in each cohort, during their first semester, received a scholarship, meaning they were paid more than $0 for the program. For example, 43.5% of students in the 2023-24 cohort received HOPE scholarships in fall 2023, including those students who received GAMS or Aspire supplements.13. Notably, the share of students receiving the Tennessee Student Assistance Award (TSAA) has increased in each of the last four years as TSAA eligibility has expanded.14 The share of Promise students receiving a Wilder-Naifeh Skills Grant has also increased steadily since the 2020-21 cohort, with 16.0% of Tennessee Promise students in the 2023-24 cohort receiving the grant; since the Wilder-Naifeh Technical Skills Grant is available only to TCAT enrollees, this increase mirrors the overall increase in Promise students enrolling at TCATs (Figure 4).
13 Pursuant to Public Chapter (2020) 794, TSAC ceased accepting new applications after September 1, 2021, for the HOPE Access Grant. The HOPE Access Grant program was phased out for students entering in the 2022-23 and 2023-24 cohorts.
14 In the 2021-22 academic year, the EFC threshold for TSAA eligibility was expanded to equal the EFC threshold for Pell eligibility (an EFC of $5,846 or less). $5,846 remained the threshold for TSAA eligibility in the 2022-23 academic year, and in the 2023-24 academic year, TSAA eligibility was expanded once more to include student’s whose EFC was $6,656 or less. Unlike the Pell grant, not all students eligible for TSAA can receive the award due to limited funds. For the 2023-24 academic year, for example, eligible students were awarded until July 1st , meaning FAFSA filers with a qualifying EFC were offered TSAA through July 1st , and after that date EFC-eligible students were not awarded TSAA.
Figure 5: Financial Aid for Tennessee Promise Students, 2020-21 Through 2023-24 Cohorts
Section 3: Tennessee Promise Outcomes
Tennessee Promise Outcomes
Credit Hour Accumulation
Table 5 shows the distribution of credit hours earned in the first semester15 for the 2020-21 through 202324 cohorts and provides important insights into student progress toward timely degree completion. TCAT students are not included here as their progress is not measured in traditional credit hours. Students are categorized into three ranges: those earning zero hours, those earning at least one and less than 15 hours, and those earning at least 15 hours. Fifteen credit hours is the benchmark required to complete a 60-credit hour degree in four semesters, or two years. Notably, the percentage of students earning at least 15 credit hours in their first semester has steadily increased across cohorts, from 19.1% in the 2020-21 cohort to 24.3% in the 2023-24 cohort. This upward trend suggests a positive shift in student performance, as earning more than 15 hours in the first semester is a key indicator of momentum toward on-time graduation.
However, the majority of students continue to earn between 1 and less than 15 credit hours in their first semester, with 63.7% of the 2023-24 cohort falling within this range. There has been a general decline in the proportion of students earning zero credit hours across the most recent four cohorts, decreasing from 21.1% in the 2020-21 cohort (likely a pandemic-related anomaly) to 12.0% in the 2023-24 cohort. This aligns with pre-pandemic levels, where the percentage of students earning zero credit hours typically hovered around 12%. This recent reduction is encouraging, as earning no credits in the first semester is a strong predictor of attrition and delayed graduation. While the increase in students earning more than 15 credit hours is a positive development, additional efforts are required to further shift students from the less than 15 credit hour range to earn at least 15 hours, thereby supporting on-time completion.
Table 5: Percentage of Hours Earned (Including 0 Hours Earned) in First Semester, 2020-21 Through 2023-24 Cohort16
Cohort
15 The first semester is limited to the fall semester in this section.
16 Appendix B.6 recreates this table with all nine Tennessee Promise students included. TCAT students are excluded from the analyses in Table 5, Figure 6, and Figure 7 since those institutions do not use standard semester hours.
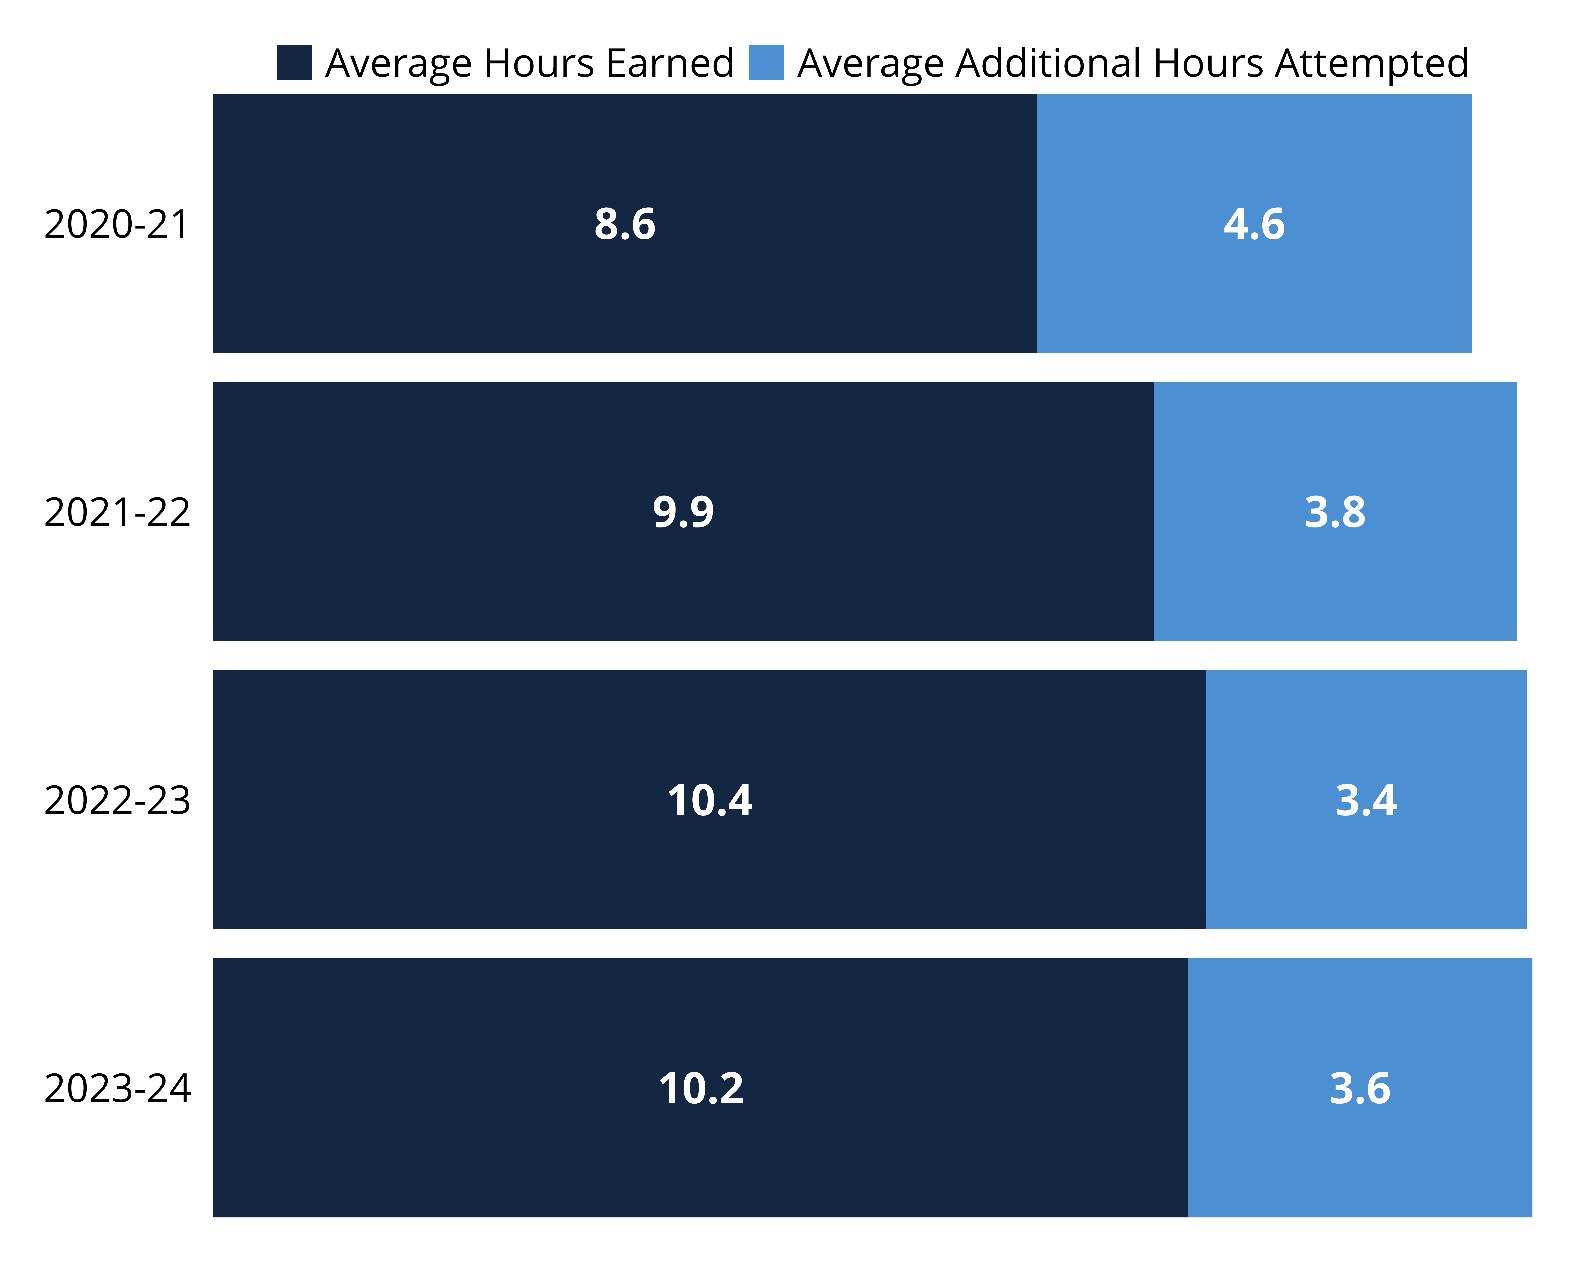
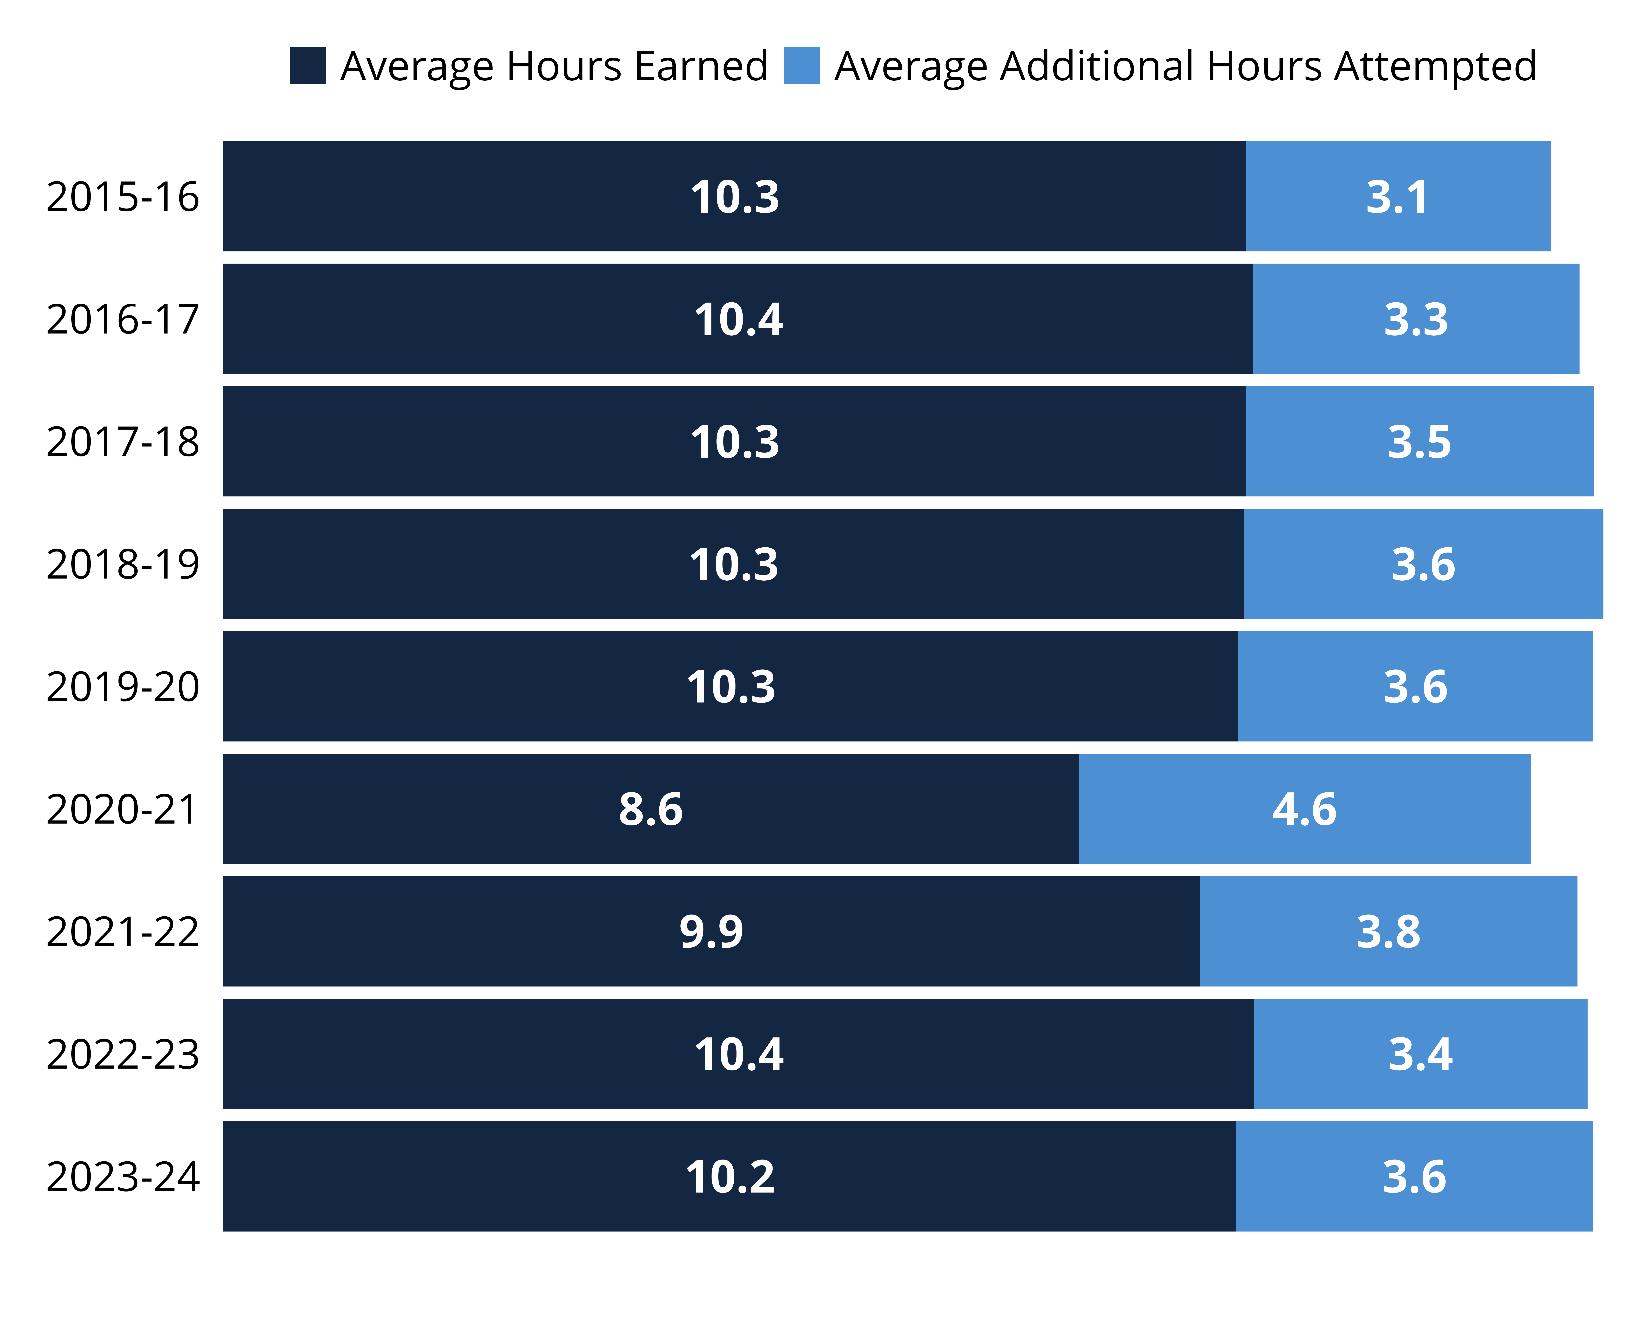
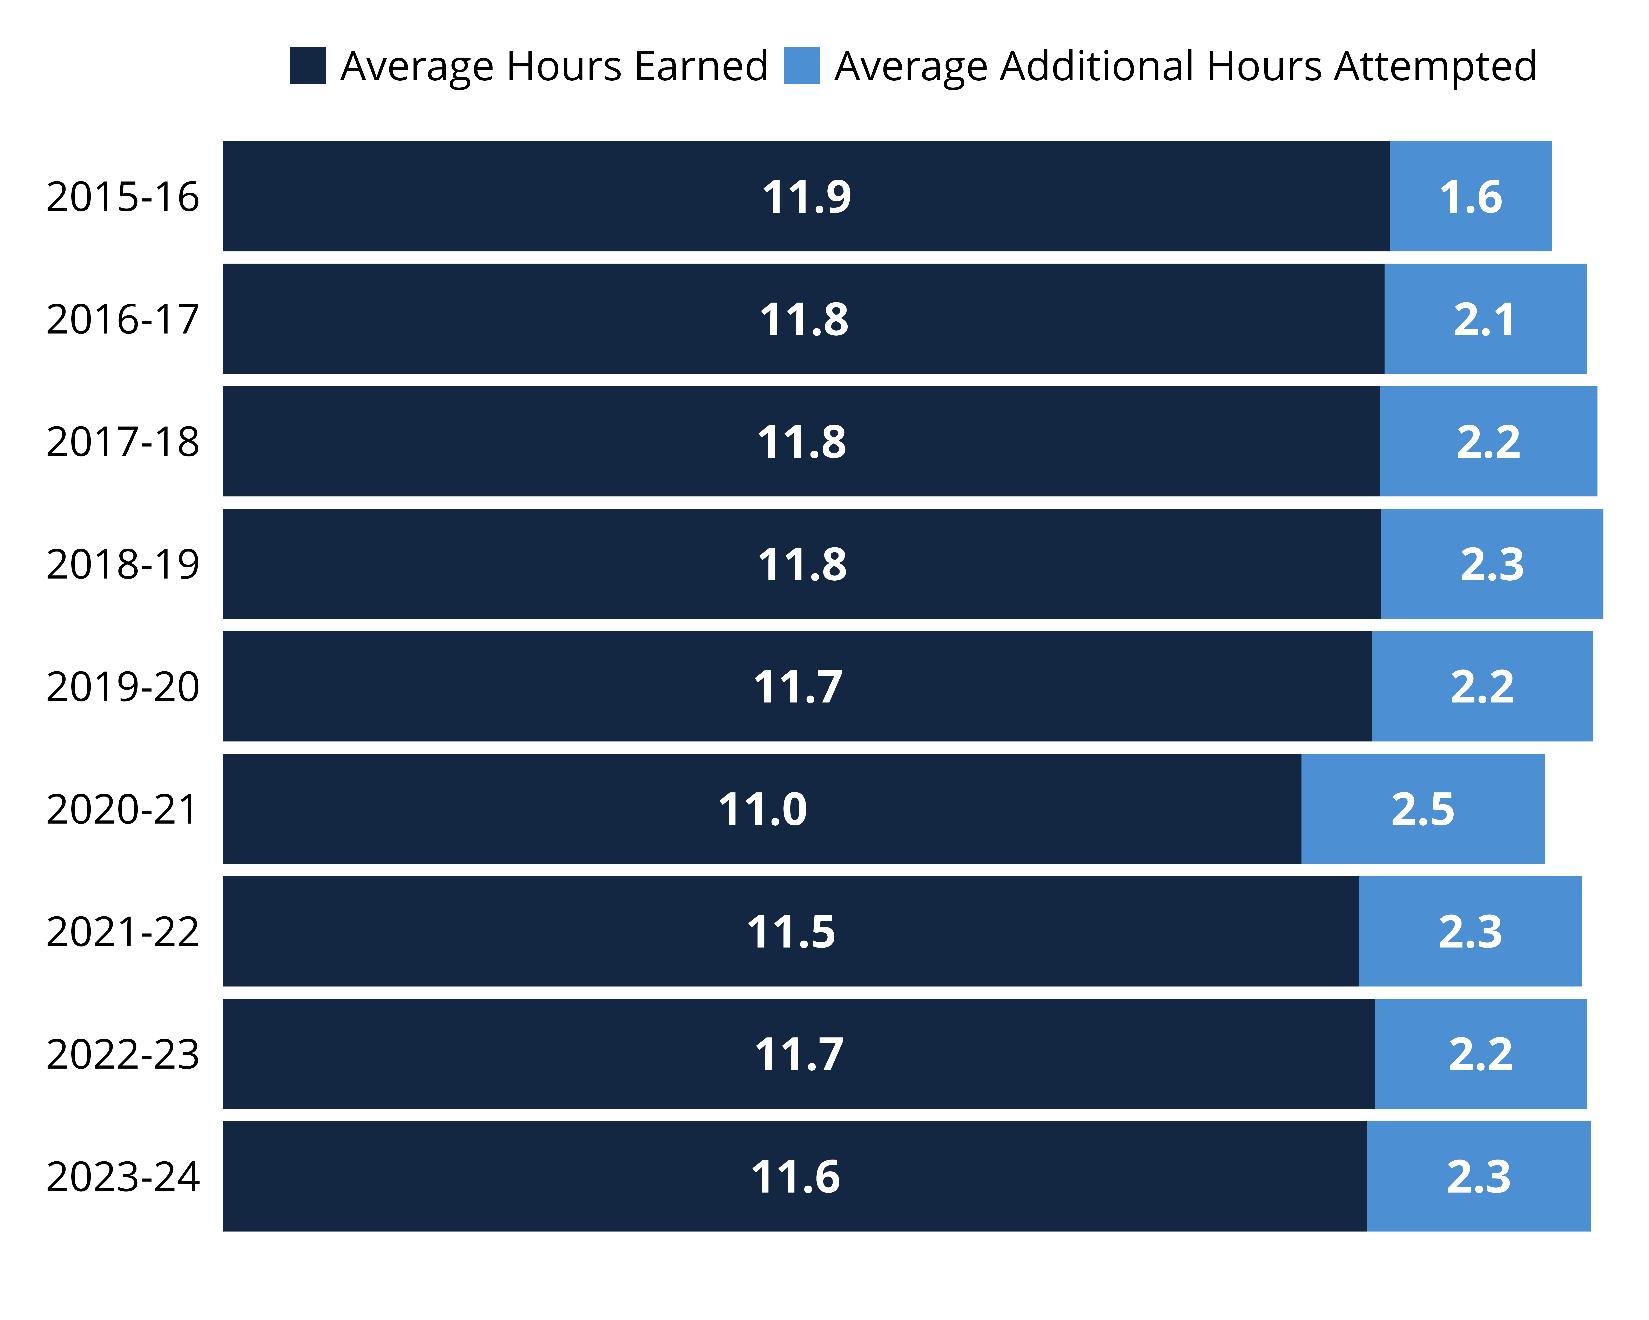
Figure 6 displays the credit hours attempted and earned by each cohort in the first semester they enrolled at an eligible institution.17 TCAT students are excluded from the analyses in the figures below, which capture 11,344 Tennessee Promise students in the 2023-24 cohort enrolled at all other eligible public institutions. Tennessee Promise students are required to enroll in at least 12 hours to maintain scholarship eligibility.
Figure 6: Hours Attempted and Earned (Including 0 Hours Earned) in First Semester, 2020-21 Through 2023-24 Cohorts 18
17 The number of credit hours attempted include hours for non-credit-bearing courses.
18 Appendix B.7 recreates this table with all nine Tennessee Promise students included.
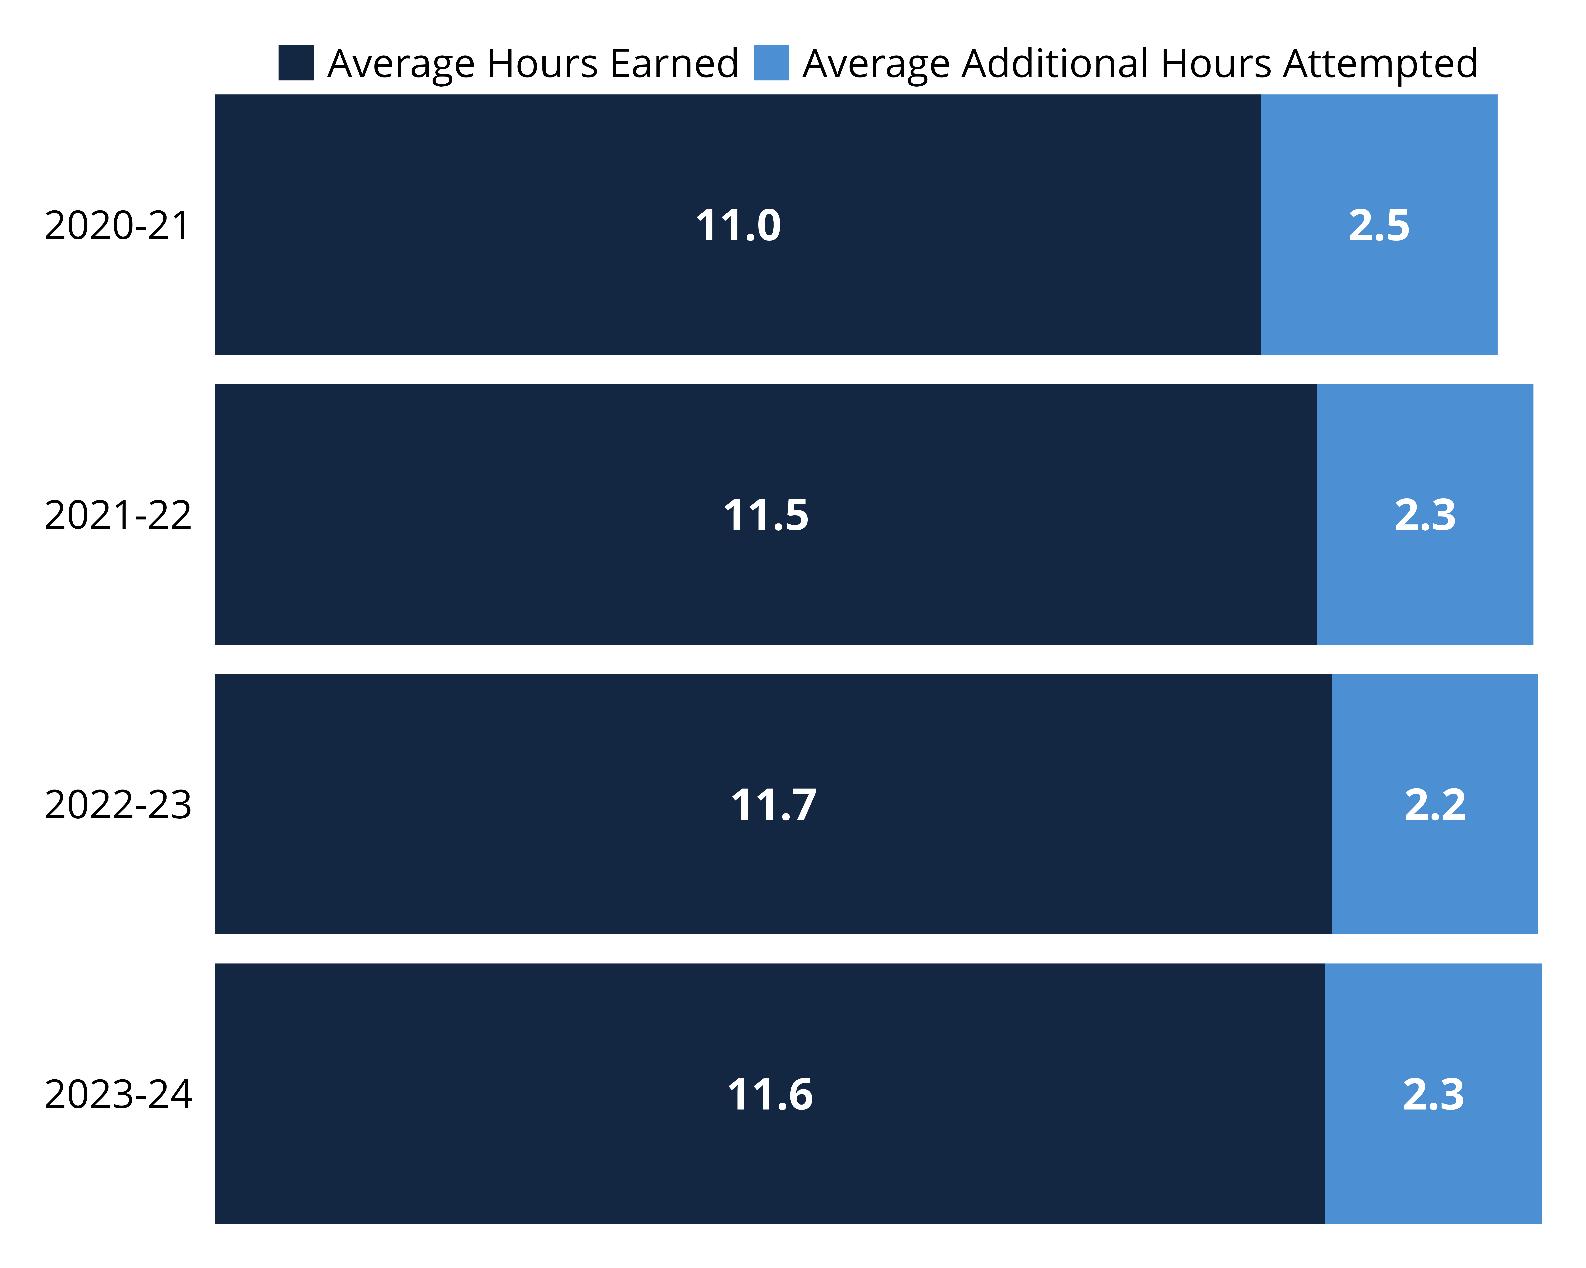
Figure 7 below is almost identical to Figure 6 above, except it excludes observations where students earned zero hours in their first semester. Zero credit hour earners in the first semester may have been enrolled at the census date but did not successfully complete any credit hours that semester, potentially indicating a student who withdrew completely prior to the end of the semester. 1,363 Tennessee Promise students (12.0%) in the 2023-24 cohort were enrolled at eligible public, non-TCAT institutions and fall into the group of zero credit hour earners
This figure depicts the average number of credits earned and the average number of additional credits attempted by the 2020-21 through 2023-24 Tennessee Promise cohorts. Excluding zero credit hour earners, the average Promise student in the 2023-24 cohort attempted 13.9 credit hours and earned nearly twelve credit hours in their first semester, which is consistent with past cohorts.
Figure 7: Hours Attempted and Earned (Excluding 0 Hours Earned) in First Semester, 2020-21 Through 2023-24 Cohorts 19
19 Appendix B.8 recreates this figure with all nine Tennessee Promise cohorts included.
Retention and Completion
The following figures depict the success rates of Tennessee Promise students through their first three years of the program, limited to fall and spring semesters. Students who maintain their eligibility can receive Tennessee Promise for a maximum of five semesters. The success rate comprises students who meet one of the following criteria:
1. A student is still enrolled at any public Tennessee institution with no award.
2. A student earned a credential and remains enrolled at any public Tennessee institution.
3. A student has graduated.20
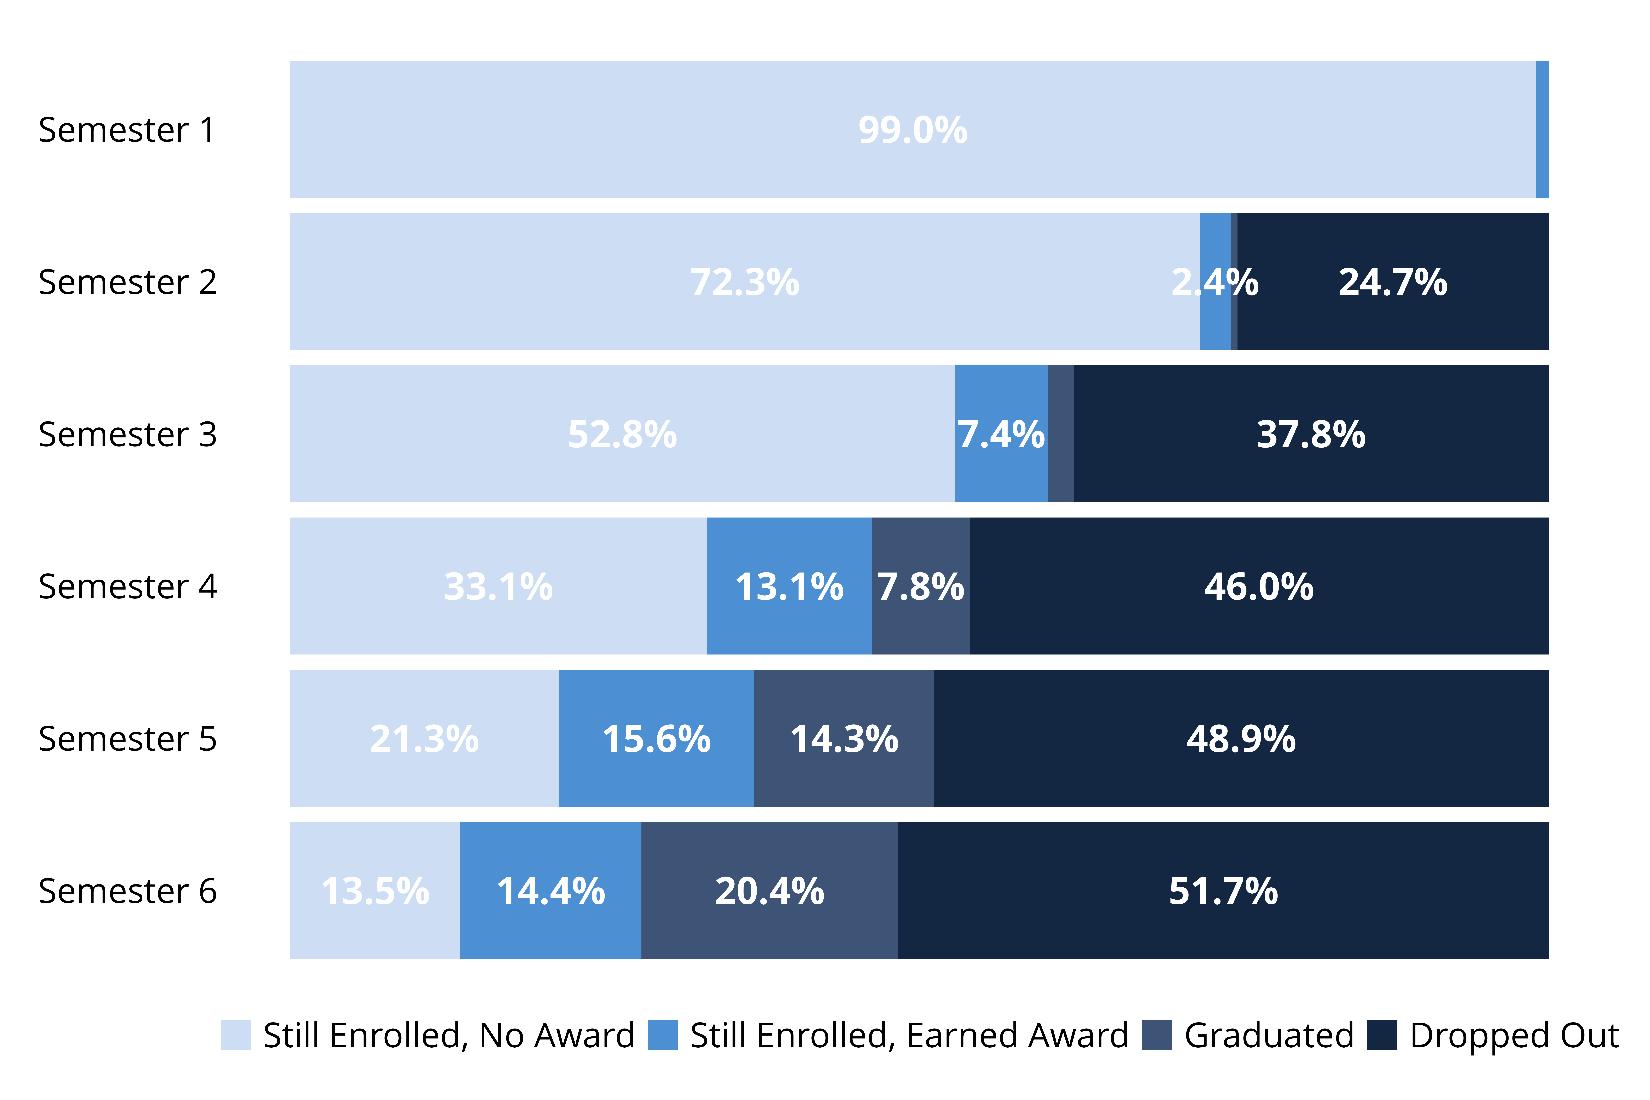
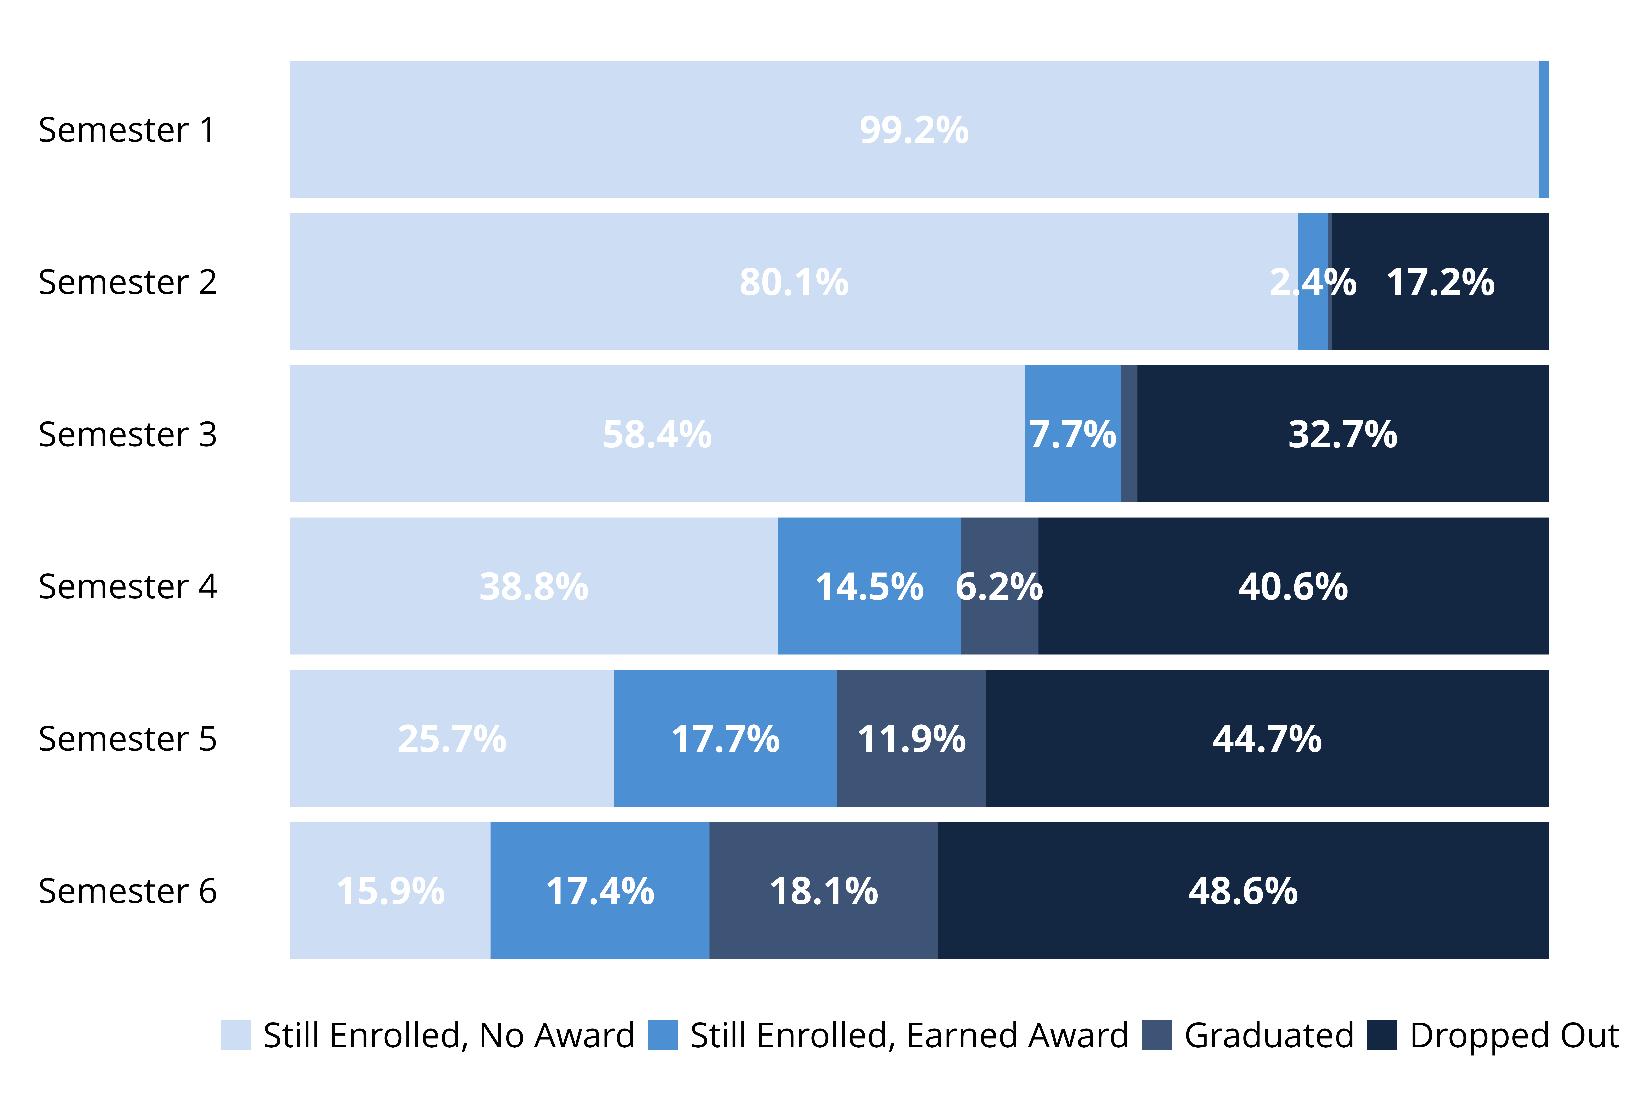
These data restrict the cohorts provided in Table 1 to capture Tennessee Promise students who were certified and enrolled at an eligible institution who first enrolled in the fall semester. These data are inclusive of all Tennessee public community colleges, universities, and TCATs. Awards data include certificates, diplomas, associate, and bachelor’s degrees. Each figure begins with the fall semester and alternates between fall and spring semesters. Awards conferred in the summer, fall, and spring are considered in the calculations for these figures. The biggest loss of students to dropout consistently occurs between the first and second fall semesters. Completions begin as early as semester one, with small shares of students earning certificates. Large jumps in credential attainment typically occur at the end of the second year (semester 4).
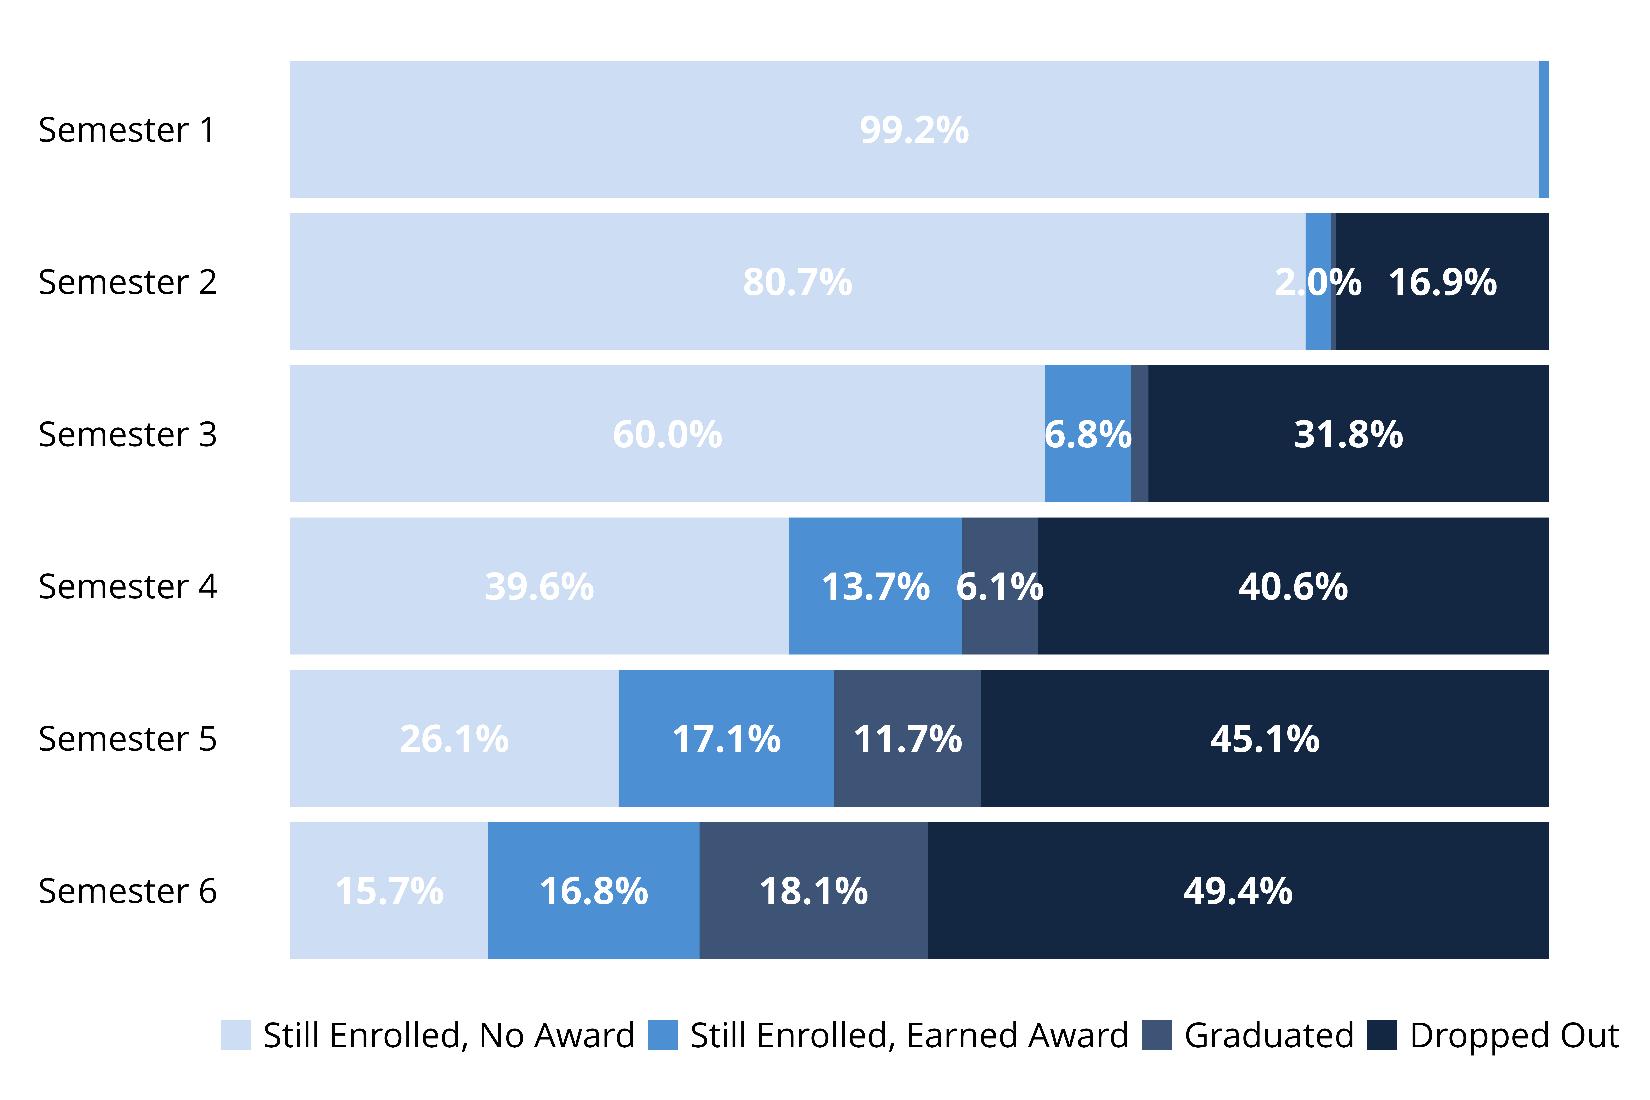
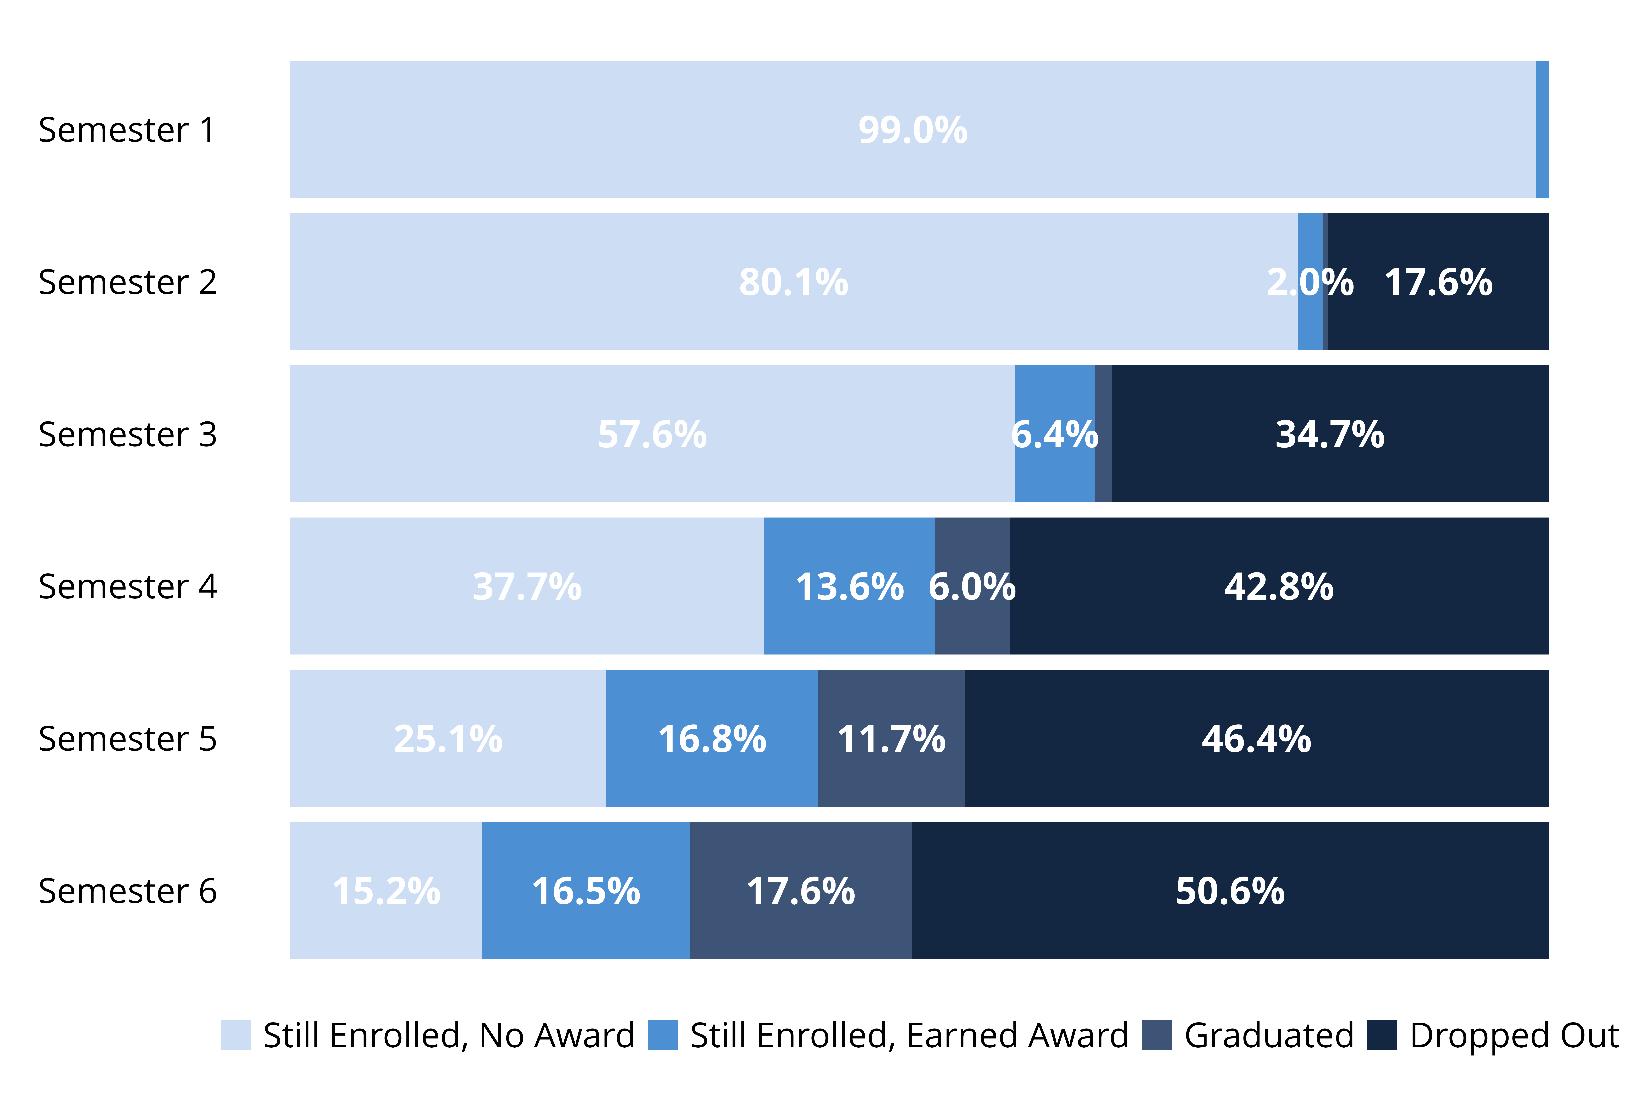
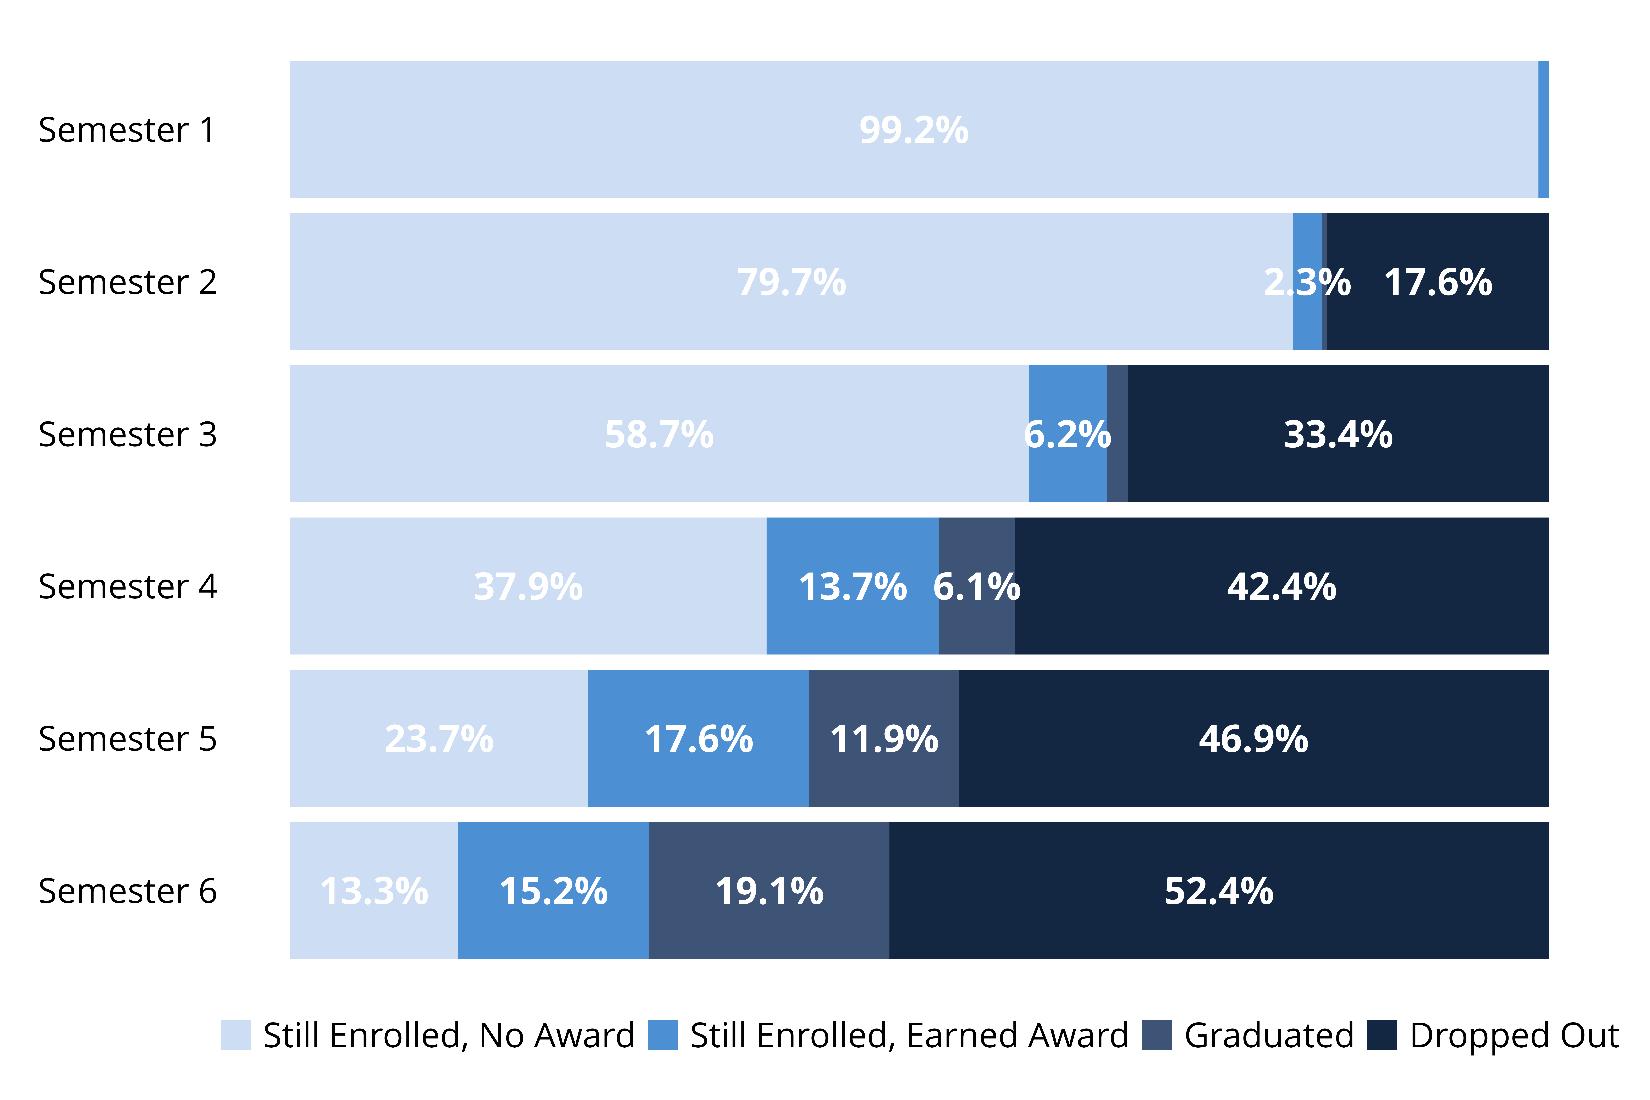
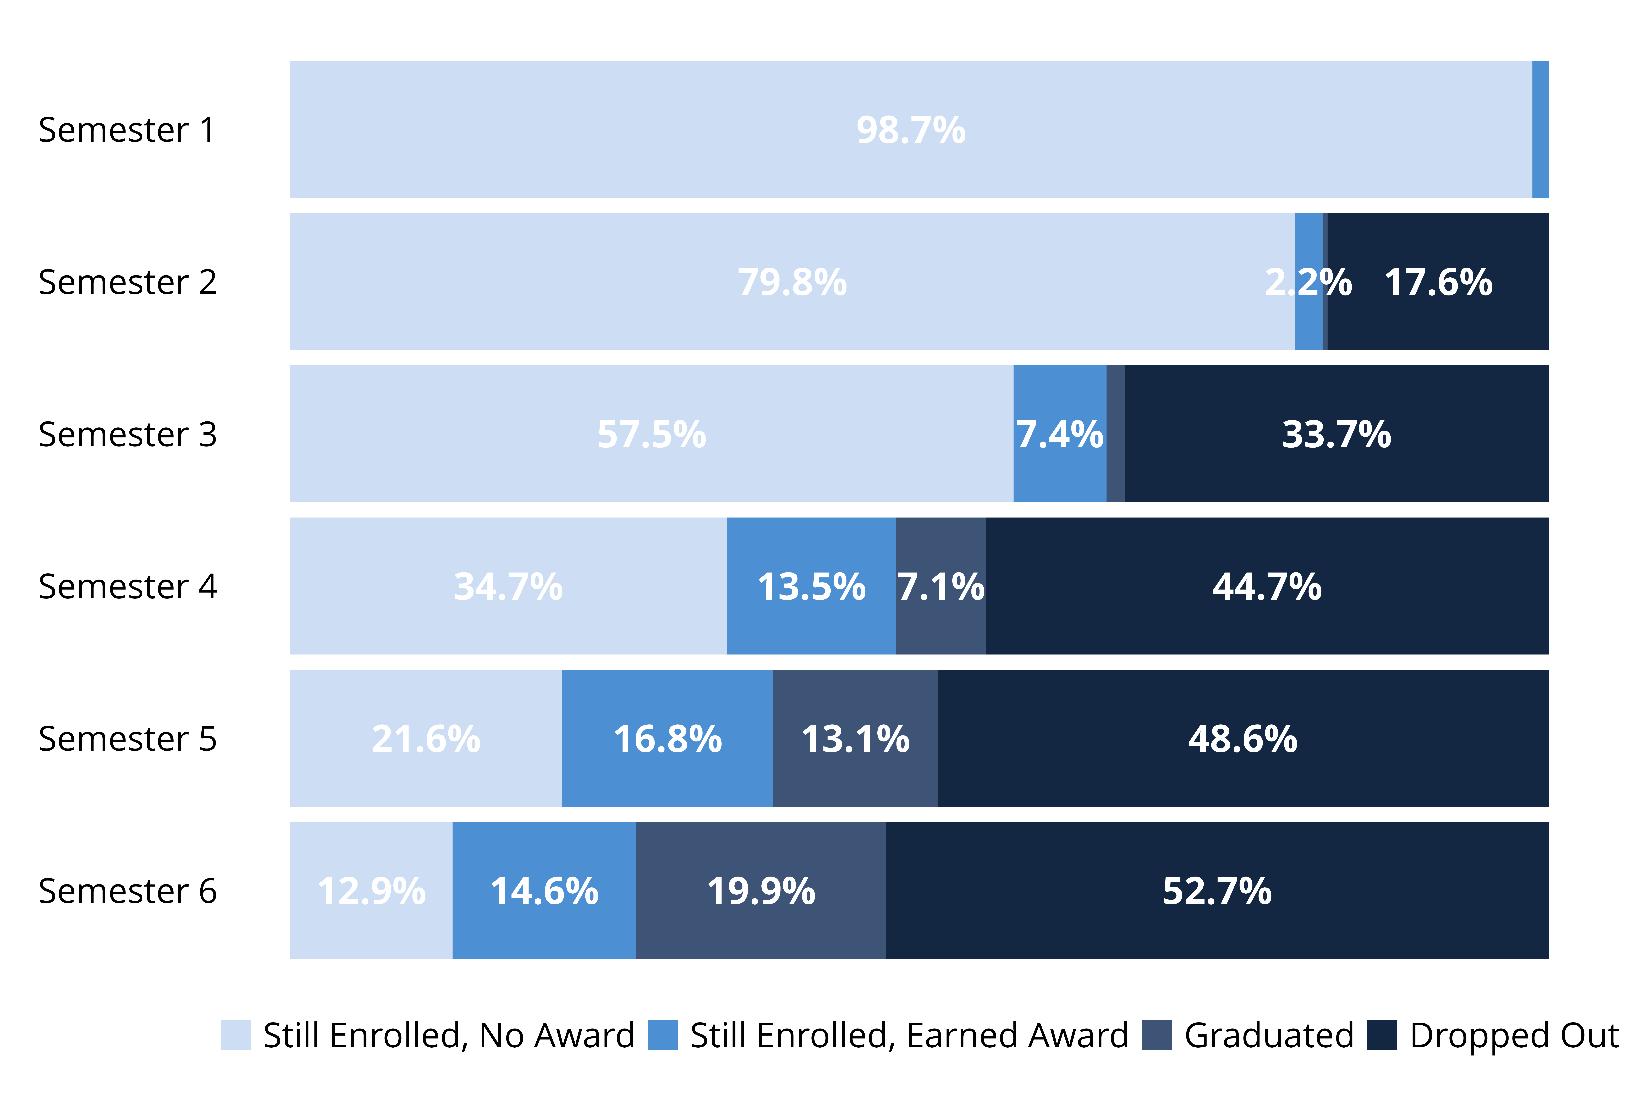
A persisting trend is the increasing number of students who drop out by their sixth semester. In the 201516 cohort, 48.6% of Promise students dropped out by the sixth semester. That figure rose to 49.4% for the 2016-17 cohort, 50.6% for the 2017-18 cohort, 52.4% for the 2018-19 cohort, 52.7% for the 2019-20 cohort, and 51.7% for the 2020-21 cohort, which is the last cohort for which data is available for all six semesters.21
20 Figure 8 through Figure 10 capture students’ movement through Tennessee public higher education. Due to the varying nature of student pathways, this analysis does not permanently drop students. For example, a student could appear as a drop-out in semester two but re-appear as still enrolled in semester three. If a student completed a credential, they will never be classified as a drop-out; they can only be classified as still enrolled, earned a degree, or graduated.
21 Appendix B.9 shows success rates of students in the 2015-16 cohort through their first six semesters. Appendix B.10 shows success rates for the 2016-17 cohort. Appendix B.11 shows success rates for the 2017-18 cohort. Appendix B.12 shows success rates for the 2018-19 cohort. Appendix B.13 shows success rates for the 2019-20 cohort.
Figure
8: Success Rates by Semester, 2020-21 Cohort
Notes: Semester 1 shows fall 2020 results, semester 2 shows spring 2021, semester 3 shows fall 2021 and so on. Data are limited to students who enrolled in the fall of their cohort year. Awards are noted as of the end of that semester.
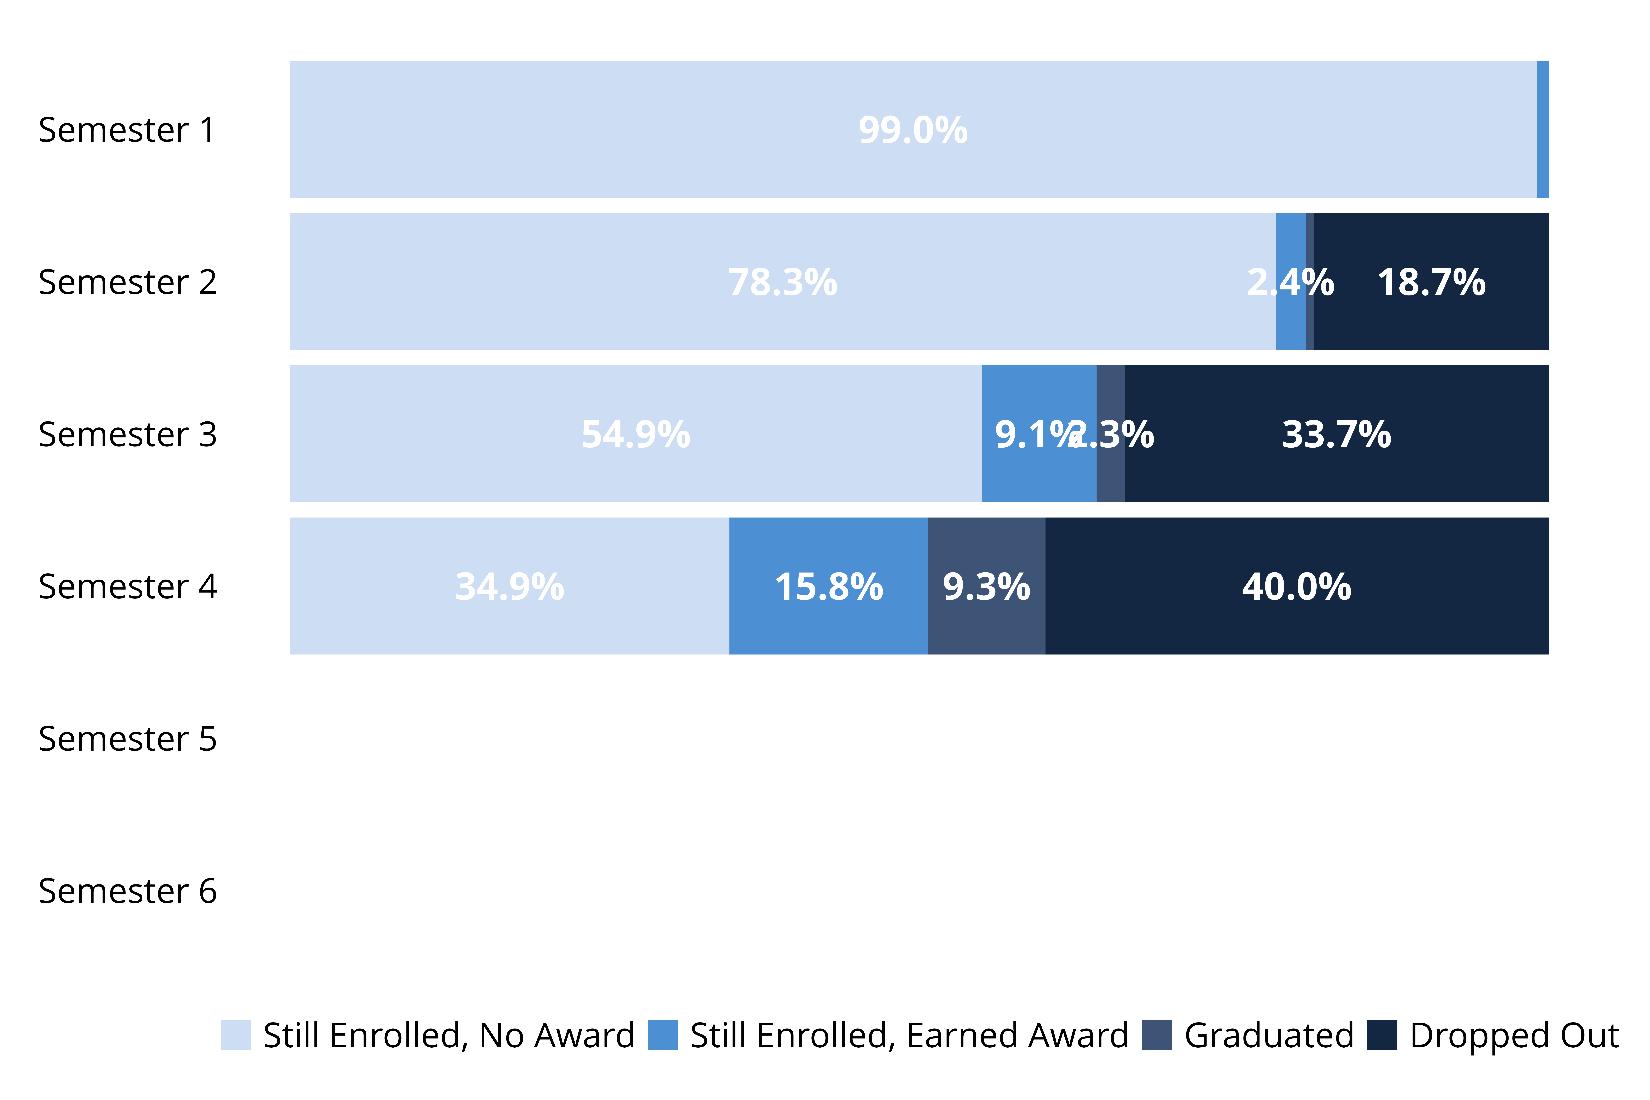
Figure 9 shows the success rates for the 2021-22 cohort, by semester. Data reported here are limited to students’ first four semesters. Semester 5 (fall 2023) is not shown because awards data for this term are not yet available. Retention from the first to the second semester improved compared to the 2020-21 cohort, and first-to-second fall retention remained high.
Notes: Semester 1 shows fall 2021 results, semester 2 shows spring 2022 and so on. Data are limited to students who enrolled in the fall of their cohort year. Awards are noted as of the end of that semester
Figure 9: Success Rates by Semester, 2021-22 Cohort
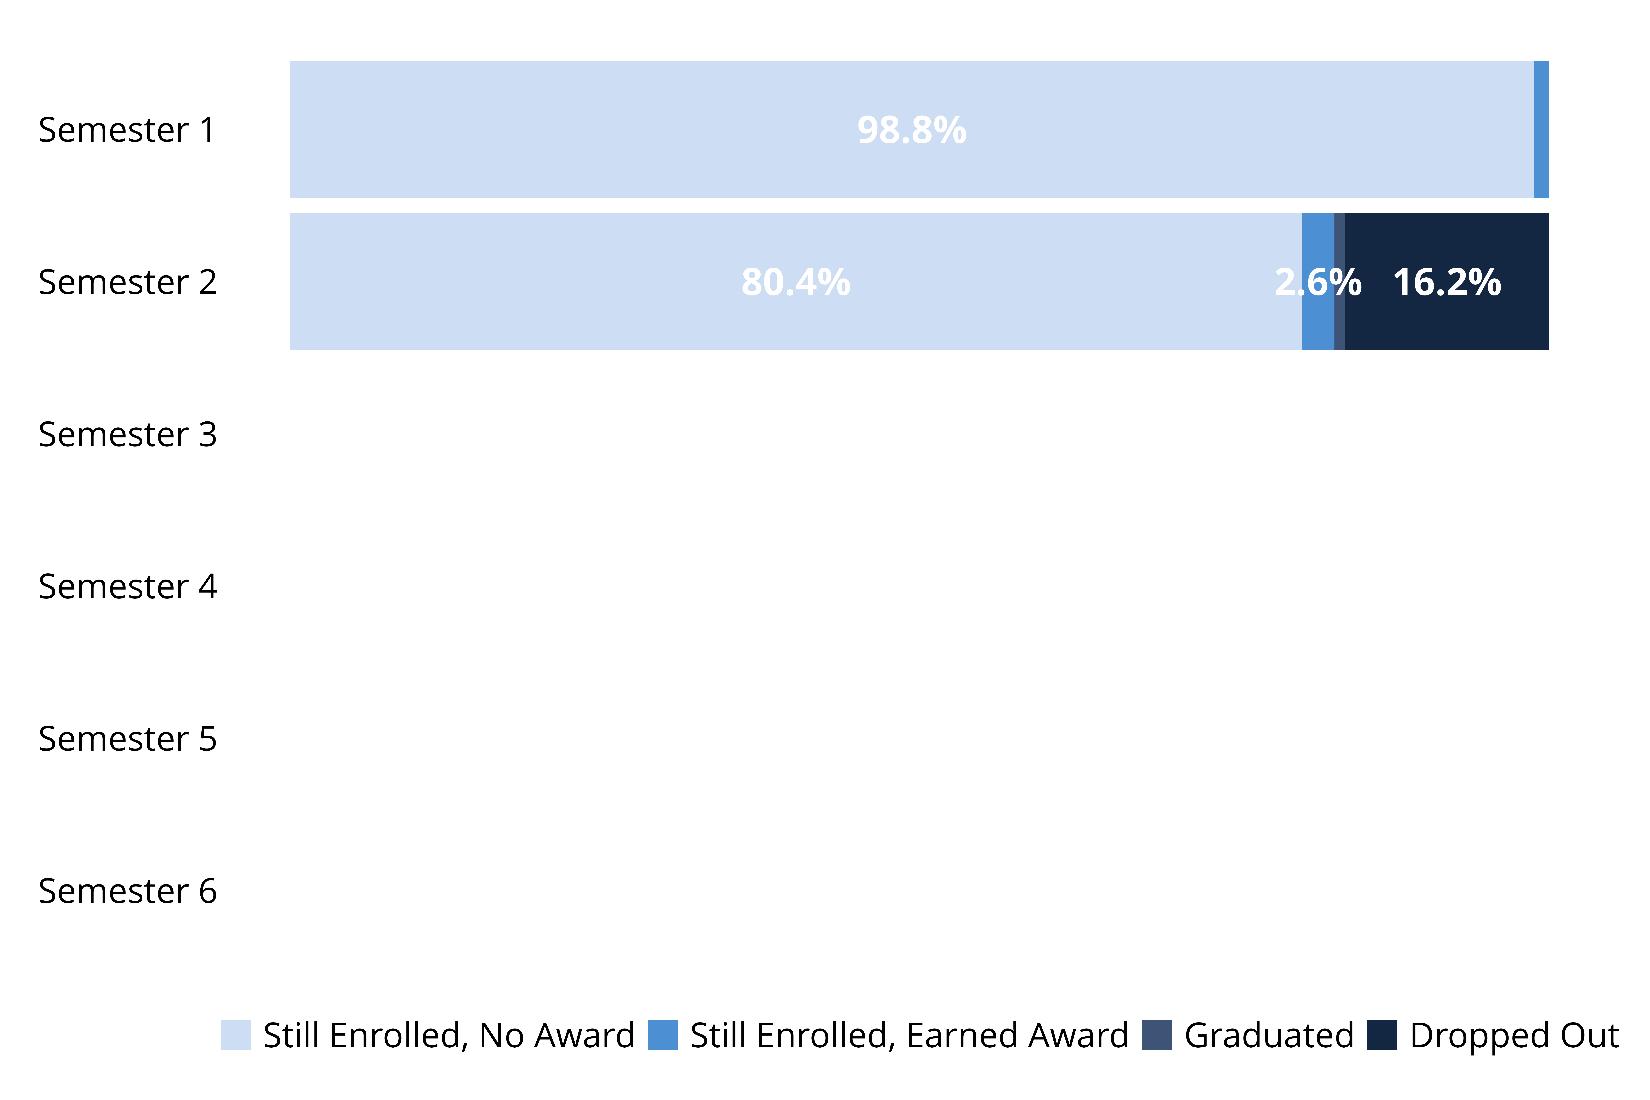
Figure 10 shows the success rate for the 2022-23 cohort, by semester. The 2022-23 cohort remains eligible for Tennessee Promise as of this report and data reported are limited to students first fall and spring semesters. Notably, the first-to-second semester retention rates improved for the 2022-23 cohort, with the drop-out rate declining to a historic low of 16.2%, the lowest among all cohorts studied. This represents an improvement of 2.5 percentage points compared to the dropout rate of the previous cohort (2021-22).
Notes: Semester 1 shows fall 2022 results, semester 2 shows spring 2023. Data are limited to students who enrolled in the fall of their cohort year. Awards are noted as of the end of that semester
Figure 10: Success Rates by Semester, 2022-23 Cohort
Table 6 shows the proportion of students from each community college that have transferred to a fouryear institution, by cohort. Motlow State (24.2%) and Pellissippi State (28.2%) continue to have the highest proportion of transfers to four-year institutions for the 2021-22 cohort. Columbia State and Volunteer State also saw over 1,000 students from the 2021-22 cohort transfer to a university. The data presented here are cumulative, and students may continue to transfer over time, so we expect transfer proportions to increase for earlier cohorts.
For more detail about transfer patterns of the first-time freshmen cohort, see THEC’s Articulation and Transfer in Tennessee Higher Education reports.
6: Tennessee Promise Transfer to University by Community College and Cohort
Table
Table 7 provides a matrix with the number of Tennessee Promise students from all nine Tennessee Promise cohorts that each community college sent to each Tennessee public university as of fall 2023.22 Pellissippi State has sent the largest number of students onto public universities (n=3,536), followed by Motlow State (n=2,703).
Middle Tennessee State University, the University of Tennessee, Knoxville, East Tennessee State University, and Tennessee Tech University lead among recipients of Tennessee Promise student transfers, with each enrolling well over two thousand Tennessee Promise students since the program’s first cohort.
Table 7: Tennessee Promise Transfer to Universities by Sending Community College, 2015-16 Through 2023-24 Cohorts
Note: This table includes data pertaining to the University of Tennessee Southern (UTS). On July 1, 2021, Martin Methodist College merged with University of Tennessee System as the University of Tennessee Southern. Only students who transferred to UTS post-merger are included in these counts.
Table 8 displays the awards earned as of summer 2023 by each Promise cohort. Approximately half (49.9%) of Promise students in the 201516 cohort have earned an award. Associate degrees are the most common award that Tennessee Promise students earn. Additionally, some students in each cohort quickly earn a diploma. Students in the first four Tennessee Promise cohorts have been in the higher education environment longer, and as a result these students are more likely to have earned their bachelor’s (or associate and bachelor’s) degree than students in more recent cohorts. In the 2023-24 cohort, a small number of students have already earned postsecondary credentials by completing college credits through dual enrollment courses and other early postsecondary opportunities. This report will continue to monitor cohorts beyond the five semesters of Promise eligibility.
Table 8: Awards Earned as of Summer 2023, 2015-16 Through 2023-24 Cohorts
Cohort
Note: The data includes awards earned up to summer 2023, with an ongoing investigation into the 2023-24 cohort.
Section 4: Program Finances
Program Finances
Tennessee Promise scholarships are funded by the interest generated from the Tennessee Promise scholarship endowment fund23 and excess Tennessee Education Lottery funds.
Table 9 and Table 10 depict the average Tennessee Promise dollars awarded in each semester since the program’s inception. Importantly, these tables reflect all Tennessee Promise eligible students with certified financial aid data (row 4 in Table 1), which differs slightly from other tables in this report. Data for this report utilizes THEC’s financial aid data warehouse, a database that provides summarized detail on transactional data from FAST to help track financial aid participants. For full program expenditures, see TSAC’s Tennessee Education Lottery Year-End report.24
Table 9 shows average Tennessee Promise dollars awarded and includes students who were paid $0. Table 10 shows averages excluding students who were paid $0. In each case, the average amount for the winter semester is substantially lower than other semesters because winter is a payment term only used for TCATs and select private colleges.
Table 9: Average Tennessee Promise Dollars Awarded Per Student, by Academic Year and Semester ($0 Payments Included)
23 The Tennessee Promise scholarship endowment fund was created by T.C.A. § 49-4-708(d).
24 Historic TSAC TELS Year-End reports are available here
25 Academic years correspond to Tennessee Promise cohort years. The 2015-16 Tennessee Promise cohort is represented by the 2015-16 academic year in Table 9 and Table 10, for example.
Table 10: Average Tennessee Promise Dollars Awarded Per Student, by Academic Year and Semester ($0 Payments Excluded)
Section 5: Completion Grants
Promise Annual Report
Completion Grants Report
Completion Grant Recipients
In 2021, the Tennessee General Assembly created a statewide completion grant pilot for Tennessee Promise students who are experiencing a financial hardship that may prevent the student from completing their degree. Legislation requires that eligible Tennessee Promise students participate in a proactive, high impact college coaching model that facilitates several one-on-one communications between students and coaches. Not all Tennessee Promise students are eligible for the completion grant pilot. Tennessee Promise students must participate in college coaching and be a Pell Grant recipient (see Figure 11) to be eligible to request completion grants.
TN Promise Student College Coaching Participant
Pell Grant Recipient
Approximately 10,200 students participated in college coaching with tnAchieves and the Ayers Foundation Trust in 2023-24. The conditions to be considered a coaching student vary by partnering organization. The Ayers Foundation Trust recognizes all high school graduates who enroll at Jackson State or Columbia State community college or who are identified as at-risk and on Tennessee Promise as coaching students. 26 tnAchieves recognizes a student as a coaching student if they are low-income, enrolled full-time at a community college, and have a minimum of two connections with their coach.27 Students matriculating to an eligible Tennessee Promise institution (e.g., two-year college or TCAT) and who apply for completion grants are added to tnAchieves’ coaching roster. 28
Table 11 shows the total number of grants and amount of grants awarded in the completion grant pilot each term for the first three years of the pilot. Table 12 shows the distinct number of grant recipients in each year. More students were served by grants in 2023-24 than in prior years, and the total amount each student received in grants increased compared to the first year of the pilot. The Ayers Foundation Trust was able to award completion grants into summer 2024 in the third year of the pilot. The average number of grants per student was 4.8 in 2022-23 and increased to 5.4 grants per student in 2023-24. Data on completion grant recipients for 2023-24 by institution are available in Appendix D. Importantly, completion grants data for year three includes 2,021 grants (totaling $248,689.90) to 327 Knox Promise students, which differs from year one and two data. Despite this expansion of the data, the completion grants program continued to increase the number and amount of grants available to serve students in year three.
26 The Ayers Foundation Trust classifies a student as at-risk if they are first generation, low-income (receiving Pell grant), academically underprepared, experiencing transportation challenges, or at the high school counselor’s recommendation.
27 In the first year this was operationalized as a $0 EFC. In year two and beyond, this is operationalized as Pell eligible.
28 Due to timing and the depletion of completion grant funds there are some grant recipients (n= 525) who are not considered coaching participants. Importantly, these grant recipients were participating in coaching at the time of grant receipt but did not stay on to fulfill all requirements to be considered a coaching participant for the semester.
Figure 11: Eligibility for Completion Grants
Table 11: Completion Grants by Term
Table 12: Completion Grant Recipients
Note: The 2021-22 academic year reflects fall 2021 and spring 2022. The 2022-23 academic year reflects fall 2022 and spring 2023. The 2023-24 academic year reflects fall 2023, spring 2024, and summer 2024. Students receiving grants are counted once per year but may receive a grant in one or more terms. Students may also have received a grant in 2021-22, 2022-23 and/or 2023-24 and are counted in each year.
The completion grant pilot identifies five categories for need, including Food, Housing, Transportation, Books and Supplies, and Class-Specific Fees. More information about these categories can be found on page 11.
Table 13 shows the count of grants awarded and count of unique students in each category for the third year of the pilot. Of the 17,863 grants awarded in 2023-24, Food became the leading grant category for the first time, both in terms of the number of grants awarded and the total amount awarded. The Transportation category continued to demonstrate consistently high demand, which includes funds for gas or ride-share assistance to get students to and from school. Importantly, limits were set on total transportation or grocery awards, which may impact the frequency of these awards.
Table 13: Completion Grants by Category, 2023-24
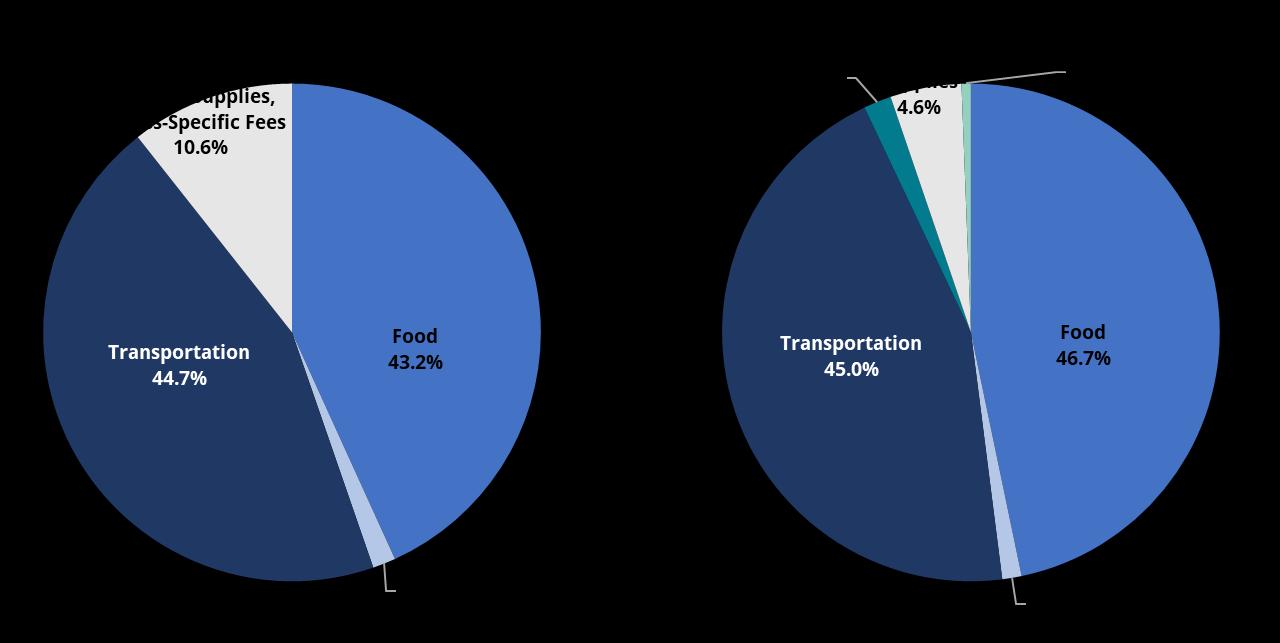
Figure 12 illustrates the distribution of grants across the categories, comparing year two (2022-23) to year three (2023-24). In both years, Transportation and Food remain the most frequently requested categories. Due to discrepancies in reporting, Books, Supplies, and Class-Specific fees were combined for year two reporting. When separated in year three, these categories show distinct distributions, with Supplies being the most frequently granted category, and Class-Specific Fees the least. While Books, Supplies, and ClassSpecific Fees made up only 7% of grants in 2023-24, this category represented 17% of spending.
Figure 13 depicts the share of overall funding by category. In 2023-24, Food and Transportation continued to demonstrate high demand, and the grant awards spent on Books, Supplies, and ClassSpecific Fees shrank relative to 2022-23. As Food and Transportation increased in terms of grants awarded in year three of the program, so too did expenditures in those categories, though the average grant amount stayed similar due to limitations on the amount allowed per grant in these categories.
Figure 12: Completion Grants by Category
Figure
13: Completion Grant Dollars Awarded by Category
Estimated Financial Assistance
Institutions of higher education nationwide provide students with an estimated Cost of Attendance (COA) annually, a total cost for the student to attend their institution. This estimate includes expenses like tuition, fees, books, school supplies, food, and housing. The total amount of financial assistance a student receives cannot exceed the student’s estimated COA. Following the proliferation of emergency financial assistance programs during the COVID-19 pandemic, the U.S. Department of Education (ED) clarified that emergency financial assistance, which includes completion grants in some instances, should be included in the student’s total aid package. ED guidance provides that exceptions may be made to exclude emergency financial assistance from a student’s aid package calculation where the expense is emergent, is not already considered in the student’s COA, and the amount is reasonable. While the ED guidance regarding emergency financial assistance and other types of cash aid to students continues to evolve, the inclusion of completion grants in a student’s Other Financial Assistance (OFA) calculation does increase the burden to administer the completion grants pilot to ensure compliance. The inclusion of these completion grants for some students in the OFA calculations may limit access for students who are already receiving financial aid that covers the full COA, namely the lowest income students who are eligible to receive their full amount of a federal Pell Grant. tnAchieves noted that, in the 2022-23 academic year, a process was implemented to verify a completion grant applicant’s eligibility for OFA before awarding a completion grant to ensure the student’s OFA did not exceed their COA.
Table 14 shows completion grant recipients in year three (2023-24), year three coaching participants (202324), and Tennessee Promise students in the 2021-22, 2022-23, and 2023-24 cohorts. When comparing grant recipients to coaching students, Black and Hispanic students make up a greater share of completion grant recipients than coaching students. Additionally, grant recipients are disproportionately female compared to coaching participants. When compared to Tennessee Promise cohorts overall, women, Black, and Hispanic students are disproportionately represented in the college coaching program. Grant recipients are more likely than coaching participants to be first-generation students, and first-generation students are also disproportionately represented in coaching participants compared to the Tennessee Promise cohorts overall.
Table 14: Grant Recipients, Coaching Participants, and Promise Eligible Cohorts, Year Three (2023-24)
Recipient Characteristics
Notes: Grant Recipient represents the unduplicated count of students receiving funds from completion grants in year three (2023-24). Coaching Participants are identified by Partnering Organizations and represent students who participated in coaching in year three (202324). Promise Eligible represents all students from the 2021-22, 2022-23, and 2023-24 cohorts who ever participated in Tennessee Promise. These groups are not mutually exclusive. A small number of students in the “Grant Recipient” and “Coaching Participants” groups are not able to be matched to demographic details. The percentages for male and female do not total 100% due to a small number of cases where gender is recorded as unknown. *”Other” is an option within FAST for student selection and is grouped with Alaskan Native and Asian/Pacific Islander in this table.
Recipient Outcomes
Since the publication of the last Completion Grants report in December 2023, new awards are still under review in THEC’s Student Information System. This section provides a summary of persistence rates and previously reported degree completions for completion grant students. Additional data will be provided once new awards data are available.
Recipients of completion grants remained enrolled at high rates following the semester they received completion grants. Table 15 shows the persistence rates from fall semester to spring semester of students receiving completion grants at public institutions by sector. Importantly, these counts only include students who received completion grants in either the fall 2021, fall 2022, or fall 2023 semester and persisted in Tennessee public higher education in spring 2022, spring 2023, or spring 2024, respectively. Additional students may have persisted in private or out-of-state higher education, but data is not available to track those outcomes. Some of these students (2 8% or n=177) earned an award in this time and remained enrolled and are counted here as persisting students. Enrollment data for fall 2024 was not available at the time of report publication, but future reports will include spring-to-fall persistence for spring completion grant recipients.
Table 15: Fall Completion Grant Recipients’ (Fall 2021, 2022, and 2023), Student Persistence, Fall-to-Spring
Notes: Counts of students receiving grants by sector are based on data reported by partnering organizations. Counts of students persisting with enrollments in spring term by sector are based on THECSIS records. These records only include enrollments at in-state public institutions. UT Southern is not represented in the University sector. TCATs operate on different schedules than community colleges and universities and are not typically evaluated on this kind of measure, therefore, TCATs are not included here.
Table 16 shows the persistence rates from fall 2022 to fall 2023 of students receiving completion grants at public institutions by sector. Importantly, these counts only include students who persisted in Tennessee public higher education; additional students may have persisted in private or out-of-state higher education. For comparison, the first-to-second fall retention rate of Pell-eligible first-time, full-time freshmen at community colleges for the fall 2022 cohort was 54.9%; at locally governed universities (including Tennessee Promise-eligible Austin Peay State University and Tennessee State University), the rate was 72.0%.29
29 First-to-second fall retention rates for Pell-eligible students presented here are calculated from THECSIS records and include in-state and out-ofstate students. Please see Table 2.1 in the Tennessee Higher Education Fact Book 2023-2024 for more detail on how retention rates are calculated.
Table 16: Fall Completion Grant Recipients’ (Fall 2022) Student Persistence, Fall-to-Fall
Notes: Counts of students receiving grants by sector are based on data reported by partnering organizations. Counts of students persisting with enrollments in fall 2023 by sector are based on THECSIS records. These records only include enrollments at in-state public institutions. UT Southern is not represented in the University sector. TCATs operate on different schedules than community colleges and universities and are not typically evaluated on this kind of measure, therefore, TCATs are not included here. Some of these completion grant recipient students (n=206) earned an award sometime between fall 2022 and fall 2023 and remained enrolled. Those students are counted here as persisting students.
Finally, despite the completion grants pilot’s short existence, many students who received grants have gone on to earn postsecondary awards. Table 17 shows the number of students who have earned awards from Tennessee public higher education institutions, including TCATs, community colleges, and universities, since the time the student received one or more completion grants. Additional students may have earned awards at Tennessee private or at out-of-state institutions. Of all students served by the completion grant pilot in the first two years, 22 3% (n=839) have already earned some kind of postsecondary credential from a public institution. While students who first received completion grants in year one of the program (202122) have had more time to complete a credential, year two of the program (2022-23) saw far more student participants, so award counts are generally higher for students who entered the completion grants pilot in year two.
Table 17: Awards Received by Grant Recipients
Notes: Students earning multiple of the same type of award (i.e., two certificates) are only counted once in that category. These records only include awards earned at in-state public institutions. UT Southern is not represented in awards data Includes awards through summer 2023 for all community colleges and universities and through spring 2024 for TCATs.
Conclusion
Conclusion
This report details the experiences of Tennessee Promise students from the program’s inaugural 2015-16 cohort through the 2023-24 cohort. Students in the most recent Tennessee Promise cohort for which data are available (those enrolling at postsecondary institutions in fall 2023) are the primary focus of the analyses presented in this report, but year-over-year changes and longer-term trends are also presented. The 2023-24 cohort of Tennessee Promise students experienced a slight increase in size compared to the 2022-23 and 2021-22 cohorts The report highlights a few important trends:
• Black and Hispanic Student Enrollment: For Black students, the gap between applicants and enrollees has narrowed slightly, decreasing from 8.1 percentage points in the 2022-23 cohort to 6.6 percentage points in the 2023-24 cohort. Both the application and enrollment percentages for Hispanic students have consistently increased in the past four cohorts.
• TCAT Enrollment: Over 18% of Tennessee Promise students in the 2023-24 cohort chose to enroll at TCATs during their first semester in postsecondary education, representing a historical high and a 1.6 percentage point increase from the 2022-23 cohort.
• First-to-Second Semester Retention Rate: The drop-out rate for the 2022-23 cohort declined to a historic low of 16.2%, the lowest among all nine cohorts studied. This represents an improvement of 2.5 percentage points compared to the dropout rate of the previous cohort.
The success of the completion grants pilot program underscores the importance of this initiative. In its third year, the pilot reached 3,289 students and distributed over $2.08 million in completion grants. These grants, along with the associated coaching programs administered by the partnering organizations, seek to address the barriers Tennessee Promise students face to their continued enrollment and completion. Completion grant data indicate that students have needs inside and outside of the classroom, including transportation, food, coursework costs (books, supplies, and class-specific fees), and housing, that are obstacles to their success. Early indicators suggest successful outcomes for completion grant recipients, with many remaining enrolled in future semesters after receiving a grant, and over 830 grant recipient students earning a postsecondary credential to-date.
Tennessee Promise has the potential to further support Tennessee’s students and workforce. Despite the availability of a comprehensive financial aid portfolio, many students still face financial challenges that hinder their ability to complete their postsecondary education. Increased funding for TSAA will ensure that all low-income, Pell-eligible Tennessee Promise students receive the State’s need-based aid which will help the neediest students address financial challenges while enrolled in college. Establishing permanent funding for completion grants is imperative to ensure sustained support for students facing severe, unexpected economic needs. Lastly, adopting OER is recommended to reduce the financial burdens associated with textbooks and course materials. Implementing these strategies will increase the number of Tennessee students who attain the credentials necessary to succeed in the state’s workforce.
Appendices
30
Community Colleges
Public Universities
Notes:
* In September 2023, TCAT-Covington and TCAT-Ripley merged with TCAT-Northwest.
** TCAT-Henry/Carroll is re-named TCAT-Paris effective in 2023.
^ TCAT-Newbern is re-named TCAT-Northwest effective in 2022.
^^ TCAT-Crossville is re-named TCAT-Upper Cumberland effective in 2024.
# In July 2021, TCAT-Whiteville merged with TCAT-Jackson.
## Martin Methodist College became the University of Tennessee, Southern in July 2021, and was a Promise-eligible institution in 2021-22 and 202223 only.
Appendix B: Additional Tables and Figures
Appendix B.1: Tennessee Promise Application Process by Counts, All Cohorts
Notes: Community service requirements were waived for the 2020-21 cohort due to the COVID-19 pandemic. Cohort years refer to the first year a student enrolled in postsecondary education. Summer 2024 enrollment data is not available at this time for the 2023-24 cohort.
Appendix B.2: Tennessee Promise Application Process by Proportion, All Cohorts
Notes: Community service requirements were waived for the 2020-21 cohort due to the COVID-19 pandemic. Cohort years refer to the first year a student is enrolled in postsecondary education. Summer 2024 enrollment data is not available at this time for the 2023-24 cohort.
Appendix B.3: Demographics for Tennessee Promise Applicants, All Cohorts
Notes: First Generation status, Adjusted Gross Income (AGI), and Expected Family Contribution (EFC) are derived from the FAFSA and are only available for applicants with a FAFSA on record. “First generation” students are individuals whose parent(s) listed on their FAFSA did not indicate having a college degree. "Other" includes American Indian, Alaskan Native, Asian/Pacific Islander, and Multiracial students.
Appendix B.4: Tennessee Promise Applicants and Tennessee Promise Students, 2015-16 Through
2019-20 Cohorts
Notes: First Generation status, Adjusted Gross Income (AGI), and Expected Family Contribution (EFC) are derived from the FAFSA and are only available for applicants with a FAFSA on record. “First generation” students are individuals whose parent(s) listed on their FAFSA did not indicate having a college degree. "Other" includes American Indian, Alaskan Native, Asian/Pacific Islander, and Multiracial students.
Appendix B.5: First Enrollment of Tennessee Promise Students by Sector, All Cohorts
B.6: Percentage of Hours Earned (Including 0 Hours Earned) in First Semester, All Cohorts
Cohort
Appendix B.7: Hours Attempted and Earned (Including 0 Hours Earned) in First Semester, All Cohorts
Appendix
Appendix B.8: Hours Attempted and Earned (Excluding 0 Hours Earned) in First Semester, All Cohorts
Appendix
B.9: Success Rates by Semester, 2015-16 Cohort
Notes: Semester 1 shows fall 2015 results, semester 2 shows spring 2016, semester 3 shows fall 2016 and so on. Data are limited to students who enrolled in the fall of their cohort year. Awards are noted as of the end of that semester
Appendix
B.10: Success Rates by Semester, 2016-17 Cohort
Notes: Semester 1 shows fall 2016 results, semester 2 shows spring 2017, semester 3 shows fall 2017 and so on. Data are limited to students who enrolled in the fall of their cohort year. Awards are noted as of the end of that semester.
Appendix B.11:
Success Rates by Semester, 2017-18 Cohort
Notes: Semester 1 shows fall 2017 results, semester 2 shows spring 2018, semester 3 shows fall 2018 and so on. Data are limited to students who enrolled in the fall of their cohort year. Awards are noted as of the end of that semester.
Appendix B.12:
Success Rates by Semester, 2018-19 Cohort
Notes: Semester 1 shows fall 2018 results, semester 2 shows spring 2019, semester 3 shows fall 2019 and so on. Data are limited to students who enrolled in the fall of their cohort year. Awards are noted as of the end of that semester.
Appendix B.13:
Success Rates by Semester, 2019-20 Cohort
Notes: Semester 1 shows fall 2019 results, semester 2 shows spring 2020, semester 3 shows fall 2020 and so on. Data are limited to students who enrolled in the fall of their cohort year. Awards are noted as of the end of that semester.
Appendix C: Completion Grants by Institution, 2023-24