

Brandywine Flood Study Technical Compendium
Section 1
Watershed Conditions
April 2025
PREPARED BY Brandywine Conservancy
Chester County Water Resources Authority University of Delaware Water Resources Center


Figure 1.1 Subwatershed Boundaries in the Brandywine Creek (with Identifiers)
Section 1 Watershed Conditions
1.1 Introduction
The Brandywine watershed spans 325 square miles (sq. mi.), of which 303 sq. mi. (93%) are in Pennsylvania and 23 sq. mi. (7%) are in Delaware. It is currently home to more than 265,000 people (U.S. Census 2020).
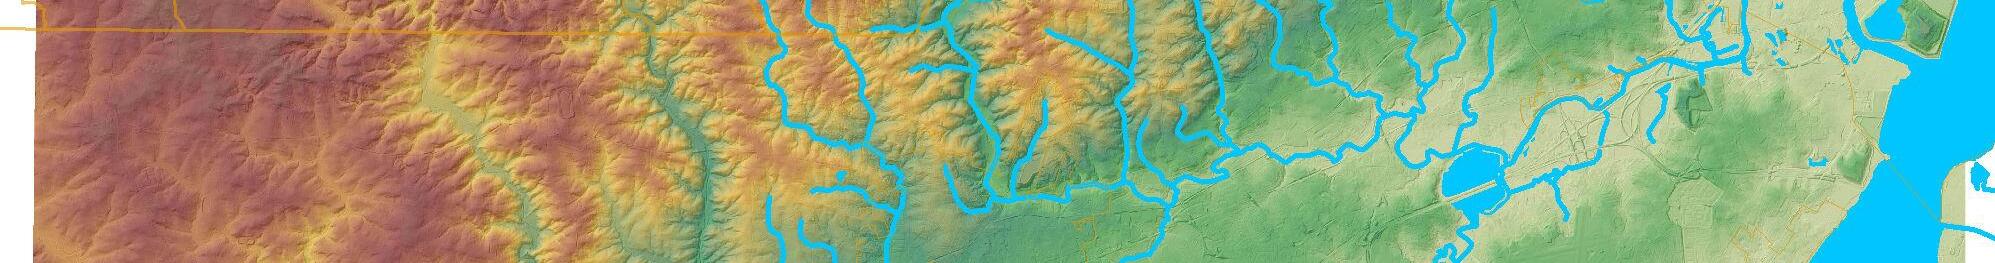
The Brandywine watershed includes more than a dozen tributaries and, for the purposes of this study, was divided into 17 subwatersheds (Figure 1.1 and Table 1.1). This network of waterways includes a total of approximately 183 stream miles. The headwaters of the Brandywine lie in the hilly farmland around Honey Brook, Pennsylvania, near the northern border of Chester and Lancaster Counties. The terrain flattens out around the Pocopson area in Chester County where the two primary tributaries, the East and West Branches of Brandywine Creek, come together to form the Main Stem of Brandywine Creek. As the creek flows south, the watershed narrows into a funnel shape below Chadds Ford, and elevation changes rapidly after the creek enters the State of Delaware (Figure 1.2). The Brandywine ultimately flows into the Christina River in Wilmington, the state’s largest city. The section of the Brandywine Creek in Wilmington, from the Market Street bridge to the confluence with the Christina River, is tidally influenced and historically was used for navigation.

Brandywine Creek from Brandywine Mills Park in Wilmington, DE. Photo courtesy of Elena Hadley.
Table 1.1 Peak Flows for Flood Prone Streams in the Brandywine Watershed
Note: Q10, Q50, Q100, and Q500 are the peak flood flows the USGS defines as likely to occur once every 10, 50, 100, and 500 years, respectively, or more precisely have a 10%, 2%, 1%, and 0.2% annual chance of occurring in any given year, respectively.


Figure
1.2. Topography, Geology and Soils
The Brandywine Creek passes through a diverse lithology, from its headwaters near Honey Brook Township to the confluence and eventual endpoint in Wilmington (Figure 1.3). Most of the watershed is underlain by metamorphic rocks. The northernmost portion is predominantly gneiss, with the East Branch traversing an outcropping of igneous rock (anorthosite). Both branches pass through a significant depression running east-west in the central portion of the watershed, characterized by sedimentary rock (limestone and dolomite). This feature, known as the Chester Valley or the Great Valley, is noteworthy for its karst geology and steep slopes to the north and south. The long, straight valley lent itself to the development of road and rail systems, accommodating both the U.S. Route 30 highway and Southeastern Pennsylvania Transportation Authority (SEPTA) rail lines. Along this corridor lies the most intensive urban development within the Pennsylvania portion of the watershed.
Geology o f the Brandywin e Watersh ed

Felsic and intermediate gneiss

felsic gneiss
Nantmeal
Banded mafic gneiss
Chickies Format on Graphitic felsic gne ss Felsic and intermediate gneiss Anorthosite
Chickies Formation Banded mafic gneiss Banded mafic gneiss
mafic gneiss Graphitic felsic gneiss
Caln
Chickies Formation
Banded mafic gneiss
Conestoga Formation Banded mafic gneiss
Felsic and intermediate gneiss

Banded mafic gneiss Chickies Formation
Felsic to m afic gneiss
Chickies Format on Antietam and Harpers Formations, undivided Ledger Formation
Bra nch
ndywine C ree k
Conestoga Formation
Coatesville
Octoraro Formation
Chickies Formation Ledger Format on Glenarm Wissahickon formation Ledger Formation Felsic and intermediate gneiss


Peters Creek Schist
Ma in Ste m Br an dywine Cre ek West Bra nch Bra ndywine Cre ek Graphitic felsic gneiss
Cockeysville Marble
Felsic gneiss
Felsic and intermediate gneiss

Glenarm Wissahickon formation
Setters Quartzite Felsic and intermediate gneiss
Felsic and intermediate gneiss
Fe sic and intermed ate gneiss
Mafic gne ss
Felsic and intermediate gneiss "Glenarm Wissahickon" formation


Surfic ial sedim ents
Watershed boundar y Town or township
County boundary
State boundary Stream
Bryn M awr Formation W ssahickon Formation
Montchanin Metagabbro Faulkland Gneiss
Brandywine Blue Gneiss

Delaware Bay Group undifferen

Figure 1.3 Geology of the Brandywine Watershed
South of this valley lie schist formations, which predominate until the creek flows past Chadds Ford, where the bedrock consists of gneisses, with some outcrops of igneous gabbro, and significant areas of Brandywine Blue gneiss, the so-called “Wilmington Blue Rock.” As the creek flows through Wilmington, it enters the Coastal Plain, which is characterized by unconsolidated silt and sediment.
Soils in the Brandywine watershed are predominantly well-drained loams (Hydrologic Group B). These soils are relatively transmissive of overland flow, allowing infiltration of excess precipitation. The upper East Branch has extensive areas of Hydrologic Group C/D soils, which are moderately well-drained, as well as the watershed’s most extensive areas of poorly drained soils (Hydrologic Group D). The portion of the watershed drained by the West Branch has the greatest extent of Hydrologic Group A soils, which are the most well-drained soils and allow the highest amount of infiltration. The main stem of the Brandywine, from Pocopson south into Wilmington, is characterized by generally well-drained ( Hydrologic Group B) soils, with some areas of less-well-drained Hydrologic Group C/D soils adjacent to the creek and its lower tributaries (Figure 1.4)..

Figure 1.4 Soils of the Brandywine Watershed
1.3. Population Data and Trends
The Brandywine Creek watershed is characterized by areas of relatively sparse population in the agricultural region in the northern portion of the watershed and the lower sections of the West Branch, along with fairly densely urbanized areas along major transportation corridors in the central watershed and lower East Branch. The highly urbanized areas are typically surrounded by more extensive, low-density suburban development. Based on the 2020 Decennial Census, there are more than 265,000 inhabitants in the watershed, with roughly 222,000 (84%) in Pennsylvania, and 43,000 (16%) in Delaware (Table 1.2). Figure 1.5 presents the total population by subwatershed in the Brandywine Creek watershed, including total population density in people per acre.

Table 1.2 Watershed Population in the Brandywine Creek Watershed by County
Minch Park in Parkesburg Borough in the Buck Run subwatershed

Figure 1.5 Population in the Brandywine Watershed, 2020
The highest population densities occur in the urbanized areas along the US Route 30 corridor in Chester County, PA, concentrated in and around the City of Coatesville and the Borough of Downingtown, in West Chester Borough, and in the City of Wilmington, DE. Figure 1.6 shows the population density across the watershed. Streams flow through and around many of the more populous communities in the watershed, leaving them more prone to flooding issues.
In the decades between 2000 and 2020, the Brandywine Creek watershed saw a net increase of over 52,000 residents, or 24.6%, based on the U.S. Census Bureau Decennial Census. New Castle County Delaware, in the lower portion of the watershed, increased by more than 2,700 residents (6.9%) in the twenty-year period, while

Figure 1.6 Population Density in the Brandywine Watershed, 2020
the Pennsylvania portion of the watershed increased by nearly 50,000 (28.7%). The largest absolute population increase within the watershed boundary occurred in Chester County (47,460, or 28.2%), with Delaware County increasing by 2,076 residents (48.7%), and Lancaster County increasing by 184 residents (24.0%).
Figure 1.7 and Table 1.2 show the change in population between 2000 and 2020 by subwatershed in the Brandywine watershed. Darker shades indicate a greater increase in total population over the period. Much of the most intensive growth has occurred in the subwatersheds along the Route 30 corridor in central Chester County (B3, B9, B12, and B13), as well as in the southern portion of Chester County between Route 1 and the confluence of the East and West Branches of the Brandywine Creek (B14).


Population Change in the Brandywine Watershed 2010 - 2020


Figure 1.7 Population Change in the Brandywine Watershed by Subwatershed, 2010-2020
1.4. Land Use and Land Cover
Land cover is a key determinant of the quality of watersheds and their water bodies, affecting habitats, ecological functions, and water quality, both on the surface and in groundwater. It also plays a major role in the generation of surface water runoff. Land cover in the Brandywine watershed varies geographically, with large extensive areas of agricultural land to the north, bordered by mixed suburban and wooded land that extend south to the highdensity urban/suburban development along the U.S. Route 30 corridor in central Chester County (Figure 1.8). Continuing south, the watershed is largely rural again, with scattered pockets of suburban development, until it reaches the greater Wilmington, DE, area. Generally speaking, land cover in the watershed is divided in thirds, with roughly equal amounts of forested land, agricultural land, and urbanized areas (Figure 1.9).

Figure 1.8 Land Cover in the Brandywine Watershed by Subwatershed, 2021
Depending on the subwatershed, there are various proportions of each major land cover type (Figure 1.10). The East Branch watershed is more urbanized, particularly around Exton, Downingtown, and West Chester, than either the West Branch or the main stem. In the West Branch, development is concentrated in and around the City of Coatesville, while in the main stem watershed, it is centered around the City of Wilmington.
Land cover in the Brandywine watershed has changed significantly over time. What began as a largely forested region gave way in the early colonial period to farms and small villages. As time progressed, industry and transportation innovations shifted the landscape, which allowed for populations to expand. Over the course of the last 100 years, thousands of formerly


Figure 1.9 Percentage of Major Land Cover Categories in the Brandywine Watershed, 2021
Figure 1.10 Percentage of Major Land Cover Categories in the Brandywine Watershed by Subwatershed, 2021
agricultural or forested acres have been converted into residential or commercial spaces to keep pace with needs of modern communities. These changes in land use have major impacts on the watershed, particularly as they relate to increases in impervious cover. Hard-scaped areas tend to lead to increased stormwater runoff, as water is less able to percolate into the groundwater table during periods of rainfall. Hence, land use changes can cause streams to flood more frequently during storms. The same process may cause low stream flows during dry periods, as the groundwater that feeds those streams are prevented from percolating into the ground. In addition to water quantity, land use change also has the potential to impact water quality. Pollutants such as heavy metals, oils, and bacteria can enter waterways as an area becomes increasingly developed. Sediment, pesticides, and nutrients such as nitrogen and phosphorous, as well as bacteria from animal waste, wash off from agricultural uses if they are not contained by good management practices.
Over the past 20 years, from 2001 to 2021, the Brandywine watershed has experienced significant development pressure. Meeting this increased demand has resulted in an overall decline of both natural forested areas and agriculture. The graph in Figure 1.11 shows the trend in each 5-year period between 2001 and 2021 for each land cover category. Development overall increased, with accompanying decreases in agricultural and, to a slightly lesser extent, forested land.
The maps in Figures 1.12 through 1.14 illustrate the change in each major land use category by subwatershed. The central subwatersheds from the confluence of the East and West Branches, particularly in the highly developed East Branch, show the largest percentage increase in development. The more northerly subwatersheds in Chester County saw the highest amount of change due to development. During the same period, those subwatersheds also saw a decrease in the amount of forested land and agriculture. The upper and lower West Branch subwatersheds saw the least loss of agricultural lands, while forested land in the lower portion of the West Branch remained relatively stable.

Figure 1.11 Land Cover Change in the Brandywine Watershed, 2001-2021

Figure 1.12 Change in Developed land, 2011-2021

Figure 1.13 Change in Agricultural land, 2001-2021

Figure 1.14 Change in Forested land, 2001-2021
1.5. Impervious Cover
As previously discussed, the amount of impervious surface in a watershed is typically dictated by the amount of development and can have a significant impact on both water quality and quantity. In the Brandywine watershed, the areas of highest imperviousness are in the most urbanized areas, including the U.S. Route 30 corridor in central Chester County, the U.S. Route 202 corridor, and the Wilmington metropolitan region. The map in Figure 1.15 illustrates the distribution and intensity of imperviousness across the watershed, based on 2021 data. Darker red areas have a higher percentage of impervious land cover.
Figure 1.16 shows the overall percentage of impervious cover in each subwatershed. Wilmington has the highest percentage imperviousness at 45%, followed by the urbanized areas around Exton and Coatesville, at 17% and 15% respectively.

Figure 1.15 Impervious cover in the Brandywine Watershed, 2021
The change in impervious cover over time might indicate where potential flooding may be exacerbated by land use change. The type and pattern of development has a large influence on the degree to which imperviousness may have negative impacts on the watershed. For instance, hard surfaces on steep slopes or without adequate stormwater controls will have a greater negative impact than other types of impervious cover. Between 2001 and 2021, the greatest increases in impervious cover generally occurred in and around areas with the most intensive development. Many of those areas are also characterized by relatively steep slopes and existing flooding problems.
Though increasing impervious cover over the past few decades does have an impact on the total volume of stormwater runoff generated in the watershed, it is worth noting that development during this timeframe was done in accordance with modern stormwater management regulations. Therefore, assuming its associated stormwater infrastructure is functioning as designed, a new development is less likely to exacerbate localized runoff and flooding challenges than one constructed prior to 1990, which may not have any meaningful stormwater infrastructure installed.
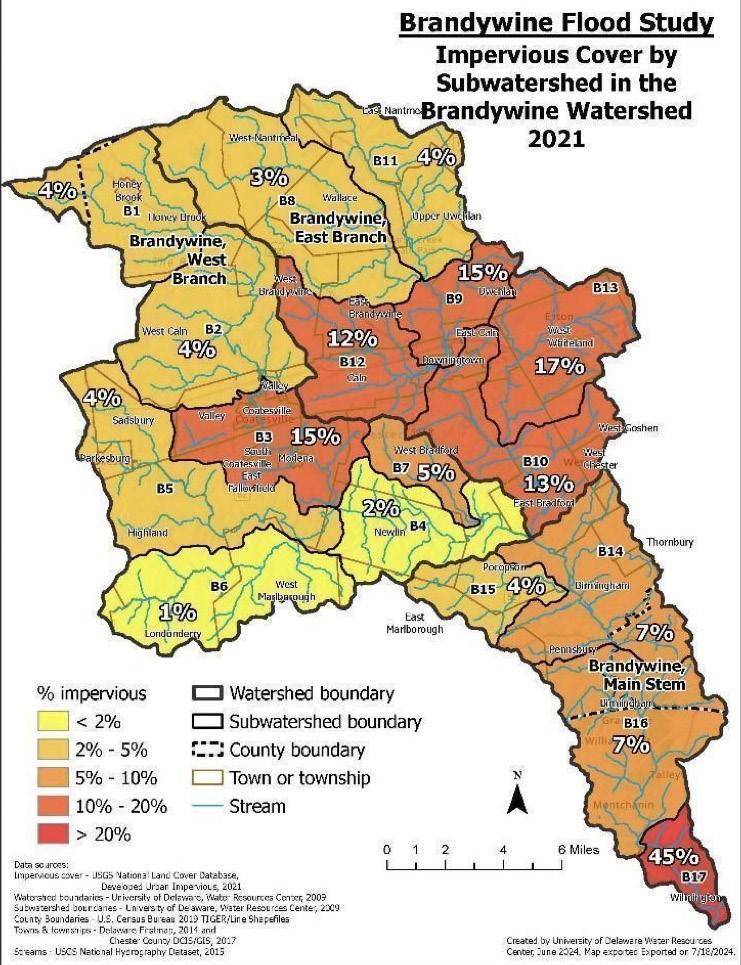
Figure 1.16 Impervious Cover in the Brandywine Watershed by Subwatershed, 2021