

The Baldwin Review 2024-25
A collection of individual research papers produced by Upper School students of The Baldwin School


Foreward
Nine years ago, Eliza Thaler ’18 founded The Baldwin Review with a vision to spotlight the intellectual curiosity and achievements of Baldwin students. Unaware of her original initiative, Megan Chan ’24 and Blair Williams ’24 were driven by a similar mission to create a platform where our peers could share their academic passions and accomplishments with the broader community. It is with this shared purpose that, as the new editors, we continued their work in proudly reviving this journal and now present its fifth edition.
This year’s issue features seven outstanding research papers authored by members of the Class of 2025. These students dedicated their summers to meaningful work in research labs and clinical settings across Greater Philadelphia, including Temple University, Thomas Jefferson University, The Children’s Hospital of Philadelphia (CHOP) and The University of Pennsylvania. Each paper represents months of rigorous inquiry, persistence and intellectual growth. As we reviewed their work, we were deeply impressed by the depth, originality and global relevance of the research presented – each project is a testament to the drive of Baldwin students.
It has been a privilege to contribute to the continuance of The Baldwin Review, and we are excited to see future generations of Baldwin scholars carry this tradition forward, leading boldly in their academic journeys.
-
Claudia Kim and Gurnoor Othie, Class of 2025
Special Thanks To
Mrs. Lisa Algeo, Mrs. Christie Reed, Ms. Maia Hajj, and Ms. Heather Wilson for their help with this journal.
Mission
The Baldwin School, an independent college preparatory school, develops talented girls into confident young women with vision, global understanding and the competency to make significant and enduring contributions to the world. The School nurtures our students’ passion for intellectual rigor in academics, creativity in the arts and competition in athletics, forming women capable of leading their generation while living balanced lives.
Table of Contents
CLAUDIA KIM ‘25
Modeling Photoelectron Spectra of Nucleobases using Density Functional Theory
GURNOOR OTHIE ‘25
The Effects of Population Density on Female Fly Fertility and the Counteracting Potential of Herb Supplements
AMELIA DENNIS ‘25
Plasmid Preparation for Transgenesis in Danio rerio
LEXI MCCURDY ‘25
NELFE Affects Chromatin Accessibility in Hepatocellular Carcinoma
ALLIE MENG ‘25
Knockdown of NELFE in PDAC Using an mAID System
AMELIA TANG ‘25
Functional Validation of Childhood Obesity Variants
GEORGIA JANE WHAMOND ‘25
The Effects of SST Peptide, EZH2 Inhibition, and Wnt Activation on Neurogenesis and Neuronal Morphology
CLAUDIA KIM ’25
Claudia Kim, a senior from Bryn Mawr, PA, and co-editor of The Baldwin Review has attended Baldwin since eighth grade. She is the Head of the International Human Rights Club that focuses on spreading awareness and taking action against human rights violations that happen globally. She is also co-head of the Science Research Consortium, a science competition organization that competes in the Pennsylvania Junior Academy of Sciences, which she has competed in for the past two years. She has conducted research at Penn Dental Medicine at the University of Pennsylvania for almost three years at the Hwang Lab. She is a member of the cross country team in the fall and the track and field team in the spring. During her free time, she enjoys taking walks outside, spending time with friends and family and reading books.

Modeling
Photoelectron Spectra of Nucleobases using Density Functional Theory
Claudia Kim ’25, Spiridoula Matsika PhD, Carson Baker Matsika Lab at Department of Chemistry, College of Science and Technology, Temple University
ABSTRACT
Excessive ionization of DNA bases by UV radiation can lead to DNA damage. Using rigorous ab initio quantum chemical methods to study ionization of DNA bases is prohibitively computationally expensive. This study seeks to find cheaper methods (TDDFT) to calculate these energies. For this study, a variety of Density Functional Theory (DFT) were used to measure the first five ionization energies of the five primary DNA bases using WebMO, a web-based interface for computational chemistry programs to set up, run, and visualize chemical calculations. It was found that the ionization potentials using B3LYP with the 6-311+G(D), a specific method and basis set, provided the best alternative that matched to ionization energies obtained from higher levels of theory.
INTRODUCTION
Photoelectron Spectroscopy (PES) is an experimental technique used to determine the ionization energies of electrons in atoms and molecules. Removing electrons from their orbitals around the nucleus of atoms requires various amounts of energy. This energy can be measured by scientists because they control the amount of energy applied to the electrons by a laser. Once the energy of the laser is applied, the ionization energy (or kinetic energy of the ejected electron) can be measured. The PES technique shows the energy of each electron on an action spectrum with peaks in the graphs. This is because the experimental devices for measuring ionization energy measure the kinetic energy of the ejected electrons. Since the energy pumped into the system from lasers is controlled by the researcher, the energy needed to remove the electron can be calculated. If enough energy is used to remove many electrons, then there will be lots of kinetic energies in the PES spectrum, leading to the peaks in the graphs.
PES is very expensive because it requires large and powerful lasers, advanced optical setups, and sensitive detectors. This technique is expensive in both monetary cost and the time it takes to prepare the experiment. However, by using computational chemistry through a computer, this is a cheaper alternative. DFT methods take around four minutes to complete calculations and the CCSD methods, a more complex version of DFT, typically take multiple hours to complete.
Vertical ionization potential (VIP) is the energy of the cation from the minimum energy of the neutral geometry, and it is used to create the photoelectron spectra. The x-axis of a photoelectron spectrum shows the energy of ejected electrons. Peaks in the spectrum can be interpreted as corresponding to the electronic energy levels of the molecule of interest. For example, a peak at 9.2 eV indicates that 9.2 eV of energy was required to eject this electron. In order to gain more information about the experimental spectrum, computational chemistry was used to calculate the ionization energies of electrons and the molecular orbitals to observe where the electrons of each peak were originating from. However, since there were a lot of approximations involved, a benchmarking study is required where a lot of different methods are used to see which one reproduces the experimental spectrum. The best-fit method will give the correct information about the molecular orbitals and electronic structure of the system. The substances tested in this experiment were the 5 DNA/RNA bases: Adenine, Guanine, Cytosine, Thymine, and Uracil.
COMPUTATIONAL METHODS
Using WebMO, an interface that runs computational quantum chemistry programs, the neutral molecular geometry for each DNA base was optimized to obtain the neutral geometry. Using a 6-31 G(d) basis set, a collection of mathematical functions that represent atomic orbitals, helps form a linear combination that represents molecular orbitals. The basis set must remain consistent throughout the data because multiple changing variables will complicate the calculations further. In order to solve the problem of excessive complexity, like acquiring the x, y, and z coordinates for the position of each atom and each election, methods like Density Functional Theory helps describe the entire molecule based on electron density. Instead of a multitude of coordinates and calculations, DFT methods only require 3 points. The excited states of the cation were then calculated from the neutral geometry and the molecular orbitals were also calculated. Four DFT Functionals (B3LYP, PBE, ωb97x-D, and M06) were used with a 6-31G(d) basis set. B3LYP takes the exact exchange from quantum mechanics, a hybrid method between DFT and quantum. PBE is a generalized gradient approximation (GGA) that adds the derivatives of the density to the LDSA, the most basic formula of DFT. ωb97x-D is long range corrected which means it can better describe things happening far away from the molecule M06 is highly parameterized for maximum versatility, which is a hybrid that takes exact exchange from quantum mechanics and uses both DFT and quantum. The VIPs were also calculated at the B3LYP/6-311+G(d) level of theory. Each of these methods were tested to determine which level of theory best balanced computational cost and quality of results.
RESULTS

Table 1. Vertical Ionization Potentials of Uracil in eV with a 6-31G(D) basis set showing the four different methods used from ground state to excited state 3. Experimental and high-theory data is included along with the B3LYP data with the expanded 6-311+G* basis set.

EOM-IP-CCSD/6-31G(d)
ordering
Figure 1. Molecular Orbitals of the first four ionized states in Uracil at the
level of theory. The
in ascending energy is π(CC), nO1, πNO, nO2 (1)

Figure 2. Molecular Orbitals of the first four ionized states in Uracil at the B3LYP/6-311+G(d) level of theory. The orbitals are ordered in ascending energy.

Figure 3. Experimental photoelectron spectrum. Theoretical values are shown as sticks (2).
The character of excited state orbitals was seen to be different between the functionals. This was determined by comparing orbitals and VIPs from other papers and literature. The orbital ordering for the DFT data in Figure 2 and the CCSD data in Figure 1 corresponds poorly as well. The stick plots in Figure 3 for Uracil at B3LYP/6-311+G(d) using DFT and the experimental PES using CCSD did not match up very well.
DISCUSSION
PBE, wB97x-D. and M06 did not give the best results, because the VIPs for each excited state did not correspond well to the EOM-IP-CCSD (complex and more expensive) data. B3LYP agrees reasonably well with CCSD but it doesn’t have a third excited state (D2) at 10 eV and the overlap between the experimental PES and the calculated stick plots was seen to be quite poor. The expanded basis set (B3LYP/6-311+G(d)) agreed even better than the original basis set used because the VIP values were very similar to the VIP values from the CCSD higher-theory data. None of the functionals from the cheaper theory data (DFT) have orbital ordering that are the exact same as shown in the expensive higher theory theoretical data (CCSD). Although the values of the VIPs are similar, the
Modeling Photoelectron Spectra of Nucleobases using Density Functional Theory | Claudia Kim ’25
orbital orders in Figure 1 and 2 do not match up completely. Some of the functionals have certain structures of the orbitals, but not in the correct order. Even though the closest match to the cheaper alternative is B3LYP under the 6-311+G(d) basis set, it wasn’t the perfect match to the more accurate higher theory data.
FUTURE STEPS
To find an even closer match to the cheaper alternative, expanding the basis set to something more complex in order to increase the accuracy in the data using DFT would be necessary. It would also be interesting to try out different DFT functionals to find the best alternative.
ACKNOWLEDGEMENTS
This research was supported by Dr. Spiridoula Matsika, and undergraduate Carson Baker. Thank you to the Baldwin Science Department for connecting me with this opportunity.
LITERATURE CITED
1. Assmann, M., Köpel, H., Matsika, S. 2015. Photoelectron Spectrum and Dynamics of the Uracil Cation. The Journal of Physical Chemistry. 119: 866-875. DOI: 10.1021/jp512221x
2. Trofimov, A. 2006. Photoelectron spectra of the nucleobases cytosine, thymine and adenine. The Journal of Physical Chemistry. 39: 305-329. DOI: 10.1088/0953-4075/39/2/007
3. Worley, S. 1971. Photoelectron Spectroscopy In Chemistry. The Chemical Reviews. 71: 298-314.
GURNOOR OTHIE ’25
Gurnoor Othie, a senior from Media, PA, has attended Baldwin since eighth grade. She is co-head of the Science Research Consortium, a competitive organization that participates in the Pennsylvania Junior Academy of Science, which she has competed in for three years, and co-editor of The Baldwin Review. During past summers, Gurnoor has conducted research at both Children’s Hospital of Philadelphia’s Division of Neonatology and as a part of the TRIP Initiative, a selective 3-month program hosted by Fox Chase Cancer Center. In her free time, she enjoys baking, cooking, drawing and spending time with friends and family.

The Effects of Population Density on Female Fly Fertility and the Counteracting Potential of Herb Supplements
Gurnoor Othie ’25, Alyssa Leystra PhD, Amanda Purdy PhD Fox Chase Cancer Center
ABSTRACT
As fertility rates continuously decline in humans, a discrepancy has been noted between these rates in rural and urban areas. One potential cause for this difference is overcrowding (overpopulation) (1, 2). This experiment investigated this by comparing and quantifying the embryos produced by female flies in vials of standard and overpopulation density. In an effort to find solutions to counteract the potential negative impacts of overpopulation on fertility, herb supplements were explored as a possible and convenient solution by comparing and quantifying the embryos produced by female flies in vials of standard food, Fenugreek-dense food, and Shatavari-dense food. While Shatavari is known for its ability to increase estrogen levels, Fenugreek is known to promote hormonal balance (3,4,5). The health of progeny was also explored by recording the percentage of embryos that hatched from the ones that were laid. It was found that overpopulation had no impact on fertility levels but did negatively impact the health of the progeny. It was also found that both Fenugreek and Shatavari increase fertility levels and are able to rescue the health of the progeny.
INTRODUCTION
Overview of Specifics from the Experiment: Overcrowding, also referred to as population density, refers to the concentration of individuals (humans) within a particular geographic region, and has been cited to be an increasingly ongoing problem in urban or metropolitan areas compared to rural areas with less population. This discrepancy in population density in urban versus rural areas can also be correlated to the difference in fertility rates. While infertility rates have been recorded to be 15% in urban areas, they have been recorded to be 6% in rural areas (6,7,8). In order to counteract infertility rates, individuals may opt to take a variety of supplements including Fenugreek and Shatavari. Fenugreek is a native herb from the Mediterranean, Europe, and Asia. It has been found to counteract infertility by stimulating mammary glands to augment breast milk production and it increases estrogen levels to enhance sexual health (5). Shatavari is native herb from Africa and Asia that has been found to counteract infertility by maintaining hormonal balance to combat stress-related reproductive disorders and regulating menstrual cycles to promote healthy ovulation (3, 4). The impacts of these herbs on counteracting the potential harm of overcrowding on female fly fertility were tested by quantifying the embryos produced by female flies in vials of standard food, Fenugreek-dense food, and Shatavari-dense food in both standard and overpopulated conditions. It was predicted that a higher population density would lead to a decrease in embryos produced per female fly and that these effects could be counteracted by consumption of Shatavari and Fenugreek. Fruit flies were utilized due to short lifespans and high reproduction rates (around 400 in a lifetime) to test this hypothesis. (3,4,5,6).


Figure 1. Shatavari (4)
Figure 2. Shatavari in Powder Form (4)

Fruit Flies Sex Determination and Life Cycle:
Fruit Flies have often been used in research for their ability to produce an abundant quantity of offspring from each mating and relatively short life cycles. The sex of a fruit fly can be determined by examining the abdomen of the fly. The male abdomen is much darker than in the female’s abdomen (Figure 4). The fruit fly’s life cycle consists of four main stages: egg, larva, pupa, and adult (Figure 4). The egg stage occurs after mating has occurred, and the stage lasts for approximately 30 hours after which the egg hatches. Fruit fly larvae emerge from these eggs and are small, white, and round in appearance and are approximately 1/4 of an inch. This stage lasts about 4 days until the larvae grow approximately ¼ inch in size. Next, the fly enters a stage of puparium in which a hard case encloses the fruit fly until metamorphosis occurs and the fruit fly transforms into an adult fruit fly. The adult fly then pushes out of the pupae case and goes on to live around 2 weeks. However it can start reproducing within 2 days (6,7).

Figure 3. Fenugreek (5)
Figure 4. The Drosophila Life Cycle (8)
MATERIALS AND METHODS
Setting up the Vials
In order to establish the controls and independent variables (the overcrowding, the Fenugreek, and Shatavari) multiple vials had to be set up. In order to make the control vial 2.5 grams of fly food and 10mL of water were added to a vial. Next, three more vials were filled with 2.5 grams of fly food. However, the 10 mL of water was replaced with 10 mL of Fenugreek stock (made by first adding 27.85 mg of Fenugreek powder, moving the powder into a 50 mL conical tube, and then adding water up to 50 mL. Then 100 µL of this mixture was added into 9.9 mL of water), 10 mL of Shatavari stock (made the same method as the Fenugreek stock except with Shatavari powder), and a mixture of 5 mL of each the Shatavari and Fenugreek stock (10mL in total), respectively, in each vial. Two other vials were then filled with 3.75 grams of fly food in order to represent overcrowding. However, one was mixed with 15mL of water while the other was filled with 15mL of a mixture of Fenugreek and Shatavari stock mixture.
Getting the Flies in the Vials
Carbon Dioxide (CO2) was utilized to sort the fruit flies. A CO2 gun was shot into vials provided by the lab after which the fainted flies were laid onto a CO2 plate. A microscope was utilized to examine the abdomen of each fly and 20 males and 40 females were sorted for each of the six vials set up 240 females and 120 males in total), and transferred into each of them.

Figure 5. CO2 gun and plate set-up
Fertility Assay
After a week, these vials were examined by applying the female fly fertility assay. This was done by first taking a pre-made grape plate (made from Methylparaben, Acetic Acid, Grape Juice, Agar, and Water) and adding yeast paste to the center. This was done with six yeast plates for each of the six vials prepared (Control, Fenugreek, Shatavari, Shatavari+Fenugreek, Overcrowded (which referred to 50% more food in the vial compared to the control or standard vials, so the flies had less living area, leading to a greater concentration of flies, also known as a greater population density), and Overcrowded+Shatavari+Fenugreek). Six collection cages were then obtained which were each labeled. The six vials from the previous week (the ones with the food, stock, 20 males and 40 females) were then obtained, and a CO2 gun was used to calm the flies from each of the six vials to transfer them into the corresponding six collection cages. The yeast-grape plates were then used to cap the collection cages by taping them on to cover the ends of them ( Figure 6). The collection cages were turned upside down so that the grape plates were at the base and on the bottom. The cages were then placed in a cardboard box and the flies were left to mate for 2 hours. After 2 hours, each of the collection cages were examined by using CO2 to knock out the flies and placing the grape plate of each cage under a microscope to examine how many embryos had been laid. Another data point collected was the number of unhatched versus hatched embryos laid. The plates were then moved into a humidified chamber and left to incubate for another 48 hours, and the same data was collected. If there were unhatched embryos on the first day of counting , this value was subtracted from the total number of embryos (counted on the second day) to get the “Total embryos adjusted for pre-hatched embryos”. Finally, the percent hatching was calculated by dividing the number of hatched embryos by total embryos. Higher quantity of embryos indicate higher fertility while higher % hatching indicated greater health of the progeny. This assay was conducted for three weeks.


Figure 6. Example Collection Cage with Yeast plate Taped On (9)
Figure 7. Collection cage and Yeast Plate Set-up
RESULTS
The data of the three weeks was averaged to make a final conclusion, and construct the following charts.

Figure 8. Displayed the average of the three weeks of fertility assay data collected to indicate the average number of embryos laid per female per the overcrowded vial versus the standard.

Figure 9. Displays the average of the three weeks of fertility assay data collected to indicate the percentage of embryos hatched in each vial.

Figure 10. Displayed the average of the three weeks of fertility assay data collected to indicate the average number of embryos laid per female per each vial.
DISCUSSION
The initial hypothesis of this experiment was that a higher population density in the fruit fly culture would lead to decrease fertility as measured by the embryos laid per female fly, and that Shatavari and/or Fenugreek would counteract this decrease. The results showed that while overpopulation had no impact on the fertility of the flies (though the vial with overpopulated conditions had a slightly greater number of embryos laid per female, the difference between the embryos laid per female in the overpopulated vial and the control vial was so minimal that it was thought of as negligible), it did have a negative correlation with the health of the progeny. This was shown by the data as the embryos per female in both the overpopulated and standard vial were similar but the percent hatching for the overpopulated vial was greater (Figure 8, 9). Additionally, both the Fenugreek and Shatavari showed an increase in fertility, both when incorporated in the food individually and when combined together, and also showed the potential to rescue the health of the progeny in overpopulated conditions (Figure 9, 10). This was shown by the data as the number of embryos produced per female and the percent of embryos that hatched were increased when treated with Fenugreek and/or Shatavari when compared to the control without the herb supplements. When the flies were treated with both herb supplements and contained in an overcrowded environment, fertility was rescued as measured by an increase in the percent of flies that hatched compared to the control. (Figure 9.10). Connecting these findings to the real world, scientists should continue testing other herbs, especially ones native to overpopulated areas, for potential health benefits and should collaborate with policymakers to continue tackling and possibly preventing the implications of overpopulation on future generations.
ACKNOWLEDGEMENTS
Thank you to Dr. Alyssa Leystra and Dr. Amanda Purdy, PhD, and all the members of the TRIP Initiative at Fox Chase Cancer Center. By participating and learning from this program, I learned numerous skills such as fly sorting, fertility assays, micropipetting, and more. Thank you for this opportunity.
LITERATURE CITED
1. Njagi, P., Groot, W., Arsenijevic, J., Dyer, S., Mburu, G., & Kiarie, J. 2023. Financial costs of assisted reproductive technology for patients in low- and middle-income countries: A systematic review. Human Reproduction Open, 2023 (2). https://doi.org/10.1093/hropen/hoad007
2. U.S. Fertility Rate Drops to Another Historic Low. 2024, April 25. National Center for Health Statistics. https:// www.cdc.gov/nchs/pressroom/nchs_press_releases/2024/20240525.htm
3. Pandey, A. K., Gupta, A., Tiwari, M., Prasad, S., Pandey, A. N., Yadav, P. K., Sharma, A., Sahu, K., Asrafuzzaman, S., Vengayil, D. T., Shrivastav, T. G., & Chaube, S. K. 2018. Impact of stress on female reproductive health disorders: Possible beneficial effects of shatavari (Asparagus racemosus). Biomedicine & Pharmacotherapy, 103: 46-49. https://doi.org/10.1016/j.biopha.2018.04.003
4. Cadman, B. 2023 July 19. What are the health benefits of shatavari? MedicalNewsToday. https://www.medicalnewstoday.com/articles/322043#uses-of-shatavari
5. Allarakha, S., Dr. (n.d.). What Does Fenugreek Do for Females? MedicineNet. https://www.medicinenet.com/ what_are_the_benefits_of_fenugreek/article.htm
6. The fruit fly life cycle. (n.d.). National Fruit Fly Council. https://www.preventfruitfly.com.au/understanding-fruit-fly/the-fruit-fly-life-cycle/
7. BSCI 1511L Statistics Manual: Life Cycle and Anatomy of Drosophila. (n.d.). Vanderbilt University Libraries Research Guides. https://researchguides.library.vanderbilt.edu/c.php?g=156859&p=1161911
8. Fernández-Moreno, M.A., Farr, C.L., Kaguni, L.S., Garesse, R. 2007. Drosophila melanogaster as a Model System to Study Mitochondrial Biology. In: Leister, D., Herrmann, J.M. (eds) Mitochondria. Methods in Molecular Biology™, Humana Press. 372: 33-49. https://doi.org/10.1007/978-1-59745-365-3_3
9. Tenn Research Internship Program. Techniques Packet. https://docs.google.com/document/d/1U5psaHoFtO_ Owdl1bGjksMU0qk4dA142VJ6f2nYxKVM/edit?tab=t.0#heading=h.pufkq7z2m7c
10. Fruit Fly Metamorphosis. (n.d.). Orkin. https://www.orkin.com/pests/flies/fruit-flies/fruit-fly-metamorphosis
AMELIA DENNIS ’25
Amelia Dennis, a senior from Merion, PA, has attended Baldwin since ninth grade. She is a Head of Mock Trial, serves as the Senior Class Secretary and is a member of the B-Flats, Baldwin’s a cappella group. She has also done three theater productions during her time at Baldwin. In her free time, Amelia enjoys spending time outside, playing piano and grabbing coffee with friends.

Plasmid Preparation for Transgenesis in Danio rerio
Amelia Dennis ’25, Jessie Greenslade, Bushra Raj PhD Department of Cell and Developmental Biology, The University of Pennsylvania
ABSTRACT
Putative enhancer sequences are non-coding regions upstream of genes that help to enhance gene expression. To better understand how these work in zebrafish (Danio rerio), plasmids with these non-coding sequences, along with the reporter gene for GFP, were constructed and prepared. Ideally, transgenesis, or insertion of these plasmid constructs into zebrafish embryos, would allow researchers to understand how non-coding enhancers impact gene expression in zebrafish.
INTRODUCTION
Around 98% of the human genome is made up of non-coding regions, or regions that do not code for proteins (1). How these non-coding sequences regulate or drive gene expression is still an unanswered question in biology. Zebrafish, or Danio rerio, are ideal model organisms to use when exploring this question because they share 70% of their genome with humans, develop rapidly, produce large clutch sizes, and are transparent throughout development.
Among these non-coding regions are enhancers, sequences of DNA that activate transcription of genes in eukaryotes when bound by transcription factor proteins. By taking putative, or suspected, zebrafish enhancer sequences and inserting them into the zebrafish genome at the 1-cell stage of zebrafish development, it is possible to see whether or not the sequence drives expression of a green fluorescent protein, GFP, in the zebrafish through fluorescent imaging. Thus, it is possible to see whether or not a sequence is an enhancer. In order to insert these sequences into the genome, the enhancer sequences must first be inserted into plasmids, or circular pieces of DNA. This report describes the construction of a plasmid with the putative enhancer sequence and the reporter gene for GFP. Preceding transgenesis, which is the process of inserting a foreign genetic sequence into an organism, preparation and purification of these plasmids is necessary.
This endeavor was part of a larger project. For the purposes of this article, plasmids were prepared from bacterial stock to restriction enzyme digest, which verified plasmid fragment sizes. PCR was performed as well.
MATERIALS AND METHODS
Methods to create and confirm the plasmid containing the enhancer sequence and the reporter gene GFP
Transformation of E.coli cells using a standard CaCl2 protocol. Single colonies were selected and grown in LB broth at 37℃ overnight. The plasmid DNA was extracted and purified using a standard mini-prep protocol. Polymerase chain reaction (PCR) was performed to amplify the plasmid DNA and then the DNA was digested with EcoRV and SalI to confirm the correct orientation of the sequences and prepare for insertion of the enhancer sequence.
Transformation of E.coli with plasmid construct.
Figure 1. A map of the pCK083 plasmid which indicates the EcoRV and SalI digestion sites. Plasmid Preparation for Transgenesis in Danio rerio | Amelia Dennis ’25


Figure 2. Basic diagram of 9500 bp plasmid with restriction enzymes EcoRV and SalI. A 2500 base pair region of the 9500 base pair plasmid was cut out. This region is where the enhancer will be inserted later.
Gel electrophoresis confirmed the amplification of the plasmid by PCR and the digestion by restriction enzymes EcoRV and SalI. Samples were placed through a gel with a ladder measuring base pairs.
The data generated by gel electrophoresis showed how many base pairs the plasmid sequence contained.
RESULTS

Figure 3. Restriction enzyme digest of 9500 bp plasmid with 1 kilobase ladder (depicted on the leftmost wells). Each increment on the ladder represents 1000 base pairs, starting at the top.
These results confirmed that restriction enzymes EcoRV and SalI cut 2500 bp segment out of the 9500 bp plasmid, as the samples reached about 2500 and 7000 base pairs on the ladder.
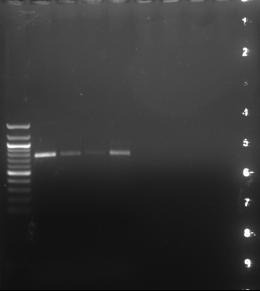
Figure 4. PCR amplification of tyrosinase locus, 761 base pairs. The tyrosinase locus relates to pigmentation. The restriction enzymes EcoRV and SalI were found to have cut the plasmid appropriately, as the gel imaging indicated that the plasmid was cut at 2500 base pairs.
DISCUSSION
This report focuses on the steps involved in constructing plasmids that will then be inserted into zebrafish. Over the course of this research, many techniques were learned including bacterial culturing, DNA extraction, and gel electrophoresis. Restriction digests were performed to cut the plasmid so a target sequence could be inserted, and PCR was used to illustrate how a target gene could be amplified for insertion into the plasmid (Figure 3 and 4).
FUTURE STEPS
In the future, putative enhancer sequences can be inserted into the purified plasmids. From there, the next step is zebrafish transgenesis. Zebrafish will be crossed and a stable transgenic line will be created from the founder zebrafish, the zebrafish that were originally injected with the enhancer sequence at the 1-cell stage. Then, the offspring will be assessed to determine if they express the green fluorescent protein.
ACKNOWLEDGEMENTS
I would like to thank my mentor, Jessie Greenslade, as well as the entire Raj Lab for their patience and encouragement throughout this process. Additionally, I would like to thank the Baldwin Science Department for the opportunity to do this internship!
LITERATURE CITED
1. Bai, N. and Smith, D. 2017, February 2. The Mysterious 98%: Scientists Look to Shine Light on our Dark Genome. UCSF News Center. Retrieved March 9, 2025, from https://www.ucsf.edu/news/2017/02/405686/ mysterious-98-scientists-look-shine-light-our-dark-genome.
LEXI MCCURDY ’25
Lexi McCurdy, a senior from Newtown Square, PA, has attended Baldwin since Pre-K. She is the Head of Senate and Co-Captain of the lacrosse team. She also plays field hockey, runs indoor track and is a member of Lamplighters (Baldwin’s student ambassador group). During her free time, Lexi enjoys baking, spending time with friends and traveling.

NELFE Affects Chromatin Accessibility in Hepatocellular Carcinoma
Lexi McCurdy ’25, Anna Barry, Kai Zhang, Alvaro Lucci PhD, Hien Dang PhD Thomas Jefferson University Sidney Kimmel Cancer Center, Dang Lab
ABSTRACT
In 2024, an estimated 611,720 people will die of cancer in the United States (1). Hepatocellular carcinoma (HCC), the most common type of liver cancer and the 6th most common cancer in the world, is on the rise in the U.S. due to alcoholism and non-fatty liver disease (2,3). Molecularly, HCC tumors acquire alterations in the tumor transcriptome that allow malignant growth and progression (4,5). These changes often include dysregulation of RNA binding proteins (RBPs), which regulate many cellular processes. For example, Negative Elongation Factor E (NELFE) is a part of the protein complex NELF, which acts as a transcriptional regulator by pausing RNA polymerase Ⅱ (6). NELF-induced promoter-proximal pausing and its role as a transcription brake is one crucial mechanism that the cell uses to regulate transcription and gene expression (7). NELFE is upregulated in HCC tumors and has been shown to affect cancer cell phenotypes (4). One way that NELFE does this is by interacting with the chromatin-remodeling protein SMARCB1, which is part of the SWI/SNF complex (8). Recently, biomolecular condensates have been linked to cancer progression. Biomolecular condensates are membrane-less organelles that consist of proteins and nucleic acids that are formed by liquid-liquid phase separation (LLPS) (9). Proteins that form these condensates have intrinsically disordered regions (IDRs). Specifically, NELFE forms biomolecular condensates through its own IDR’s, which may be a mechanism that NELFE uses to promote an open chromatin state in HCC tumors.
INTRODUCTION
This paper has been a review of the work being done in the Dang Lab identifying and understanding the relationship between NELFE and activation of gene expression in liver cancer cells. My work in the lab was a part of a much larger whole, however, I was able to perform many tests and contribute to the work by producing and analyzing data.
NELFE is an RNA binding protein (RBP), which are very important proteins that are involved in many cellular processes. NELFE stands for Negative Elongation Factor E and is part of the 4 subunit protein complex NELF. The NELF complex acts as a transcriptional regulator by pausing RNA polymerase Ⅱ, which is one mechanism that the cell uses to modulate transcription and gene expression. Since RBPs are involved in so many processes that affect the cell, it is unsurprising that the dysregulation of RBPs was found linked to so many diseases. In HCC, it was found that RBPs are upregulated in HCC tumors (4).
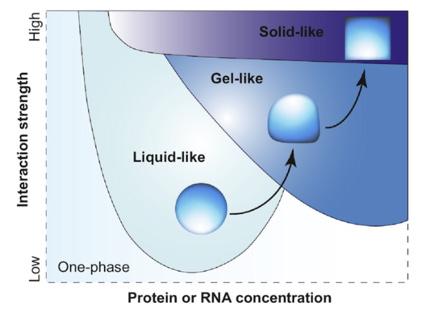
Biomolecular condensates are organelles that lack a membrane. They are filled with proteins and nucleic acids that are condensed and separated from the surrounding liquid, similar to oil droplets in water (9). These have many important functions in cells, for example, they are involved in chromatin organization, transcription, and repair. Since they are involved in a lot of cellular processes, it is unsurprising that it is now being seen that these condensates and any condensate related activity could be linked to cancer progression. One example of a biomolecular condensate is a stress granule which is formed under stressful conditions and these help keep important functions in the cell going.
Condensates are formed by liquid-liquid phase separation which is basically when the condensate forms into its own little compartment of biomolecules. This process has not only been seen linked to HCC, but also in other diseases such as Ewing’s sarcoma and leukemia (9).

How do these biomolecular condensates connect to NELFE? Proteins that are able to undergo phase separation have IDRs, which are intrinsically disordered regions. These regions are part of the proteins and they are flexible in structure and characterized by simple amino acid repeats. NELFE happens to be able to form biomolecular condensates and its IDRs are low complexity region 1 and low complexity region 2.
In order to confirm that NELFE forms condensates in HCC tumor cells, an immunofluorescence assay which allows NELFE proteins to be visualized in cells by using specific antibodies, was completed. This immunofluorescence showed NELFE in two different types of HCC tumor types, one cell line being Hep3B and the other HLE. Figure 3 showed that in both HCC cell types, NELFE condensates were present (as indicated with the red color). DNA was stained with DAPI to indicate the nucleus and the merged images showed that NELFE condensates were present in the nucleus of these cells.
Next, an in vitro phase separation was done to observe if NELFE formed condensates in vitro. Purified NELFE and RNA were prepared in a tube and added to a slide to be imaged. In the full length, it was clear that condensates formed. Then, when the LCS1 or LCR1 region in NELFE was deleted, there were significantly less condensates being formed. In the deletion of LCR2, it was seen that there were no condensates formed. This in vitro phase separation confirmed that the LCR regions in NELFE were crucial for phase.
Figure 1. Model of the NELF complex (10)
Figure 2. Schematic representation of biomolecular condensates (11)
NELFE Affects Chromatin Accessibility in Hepatocellular Carcinoma | Lexi McCurdy ’25


It was previously known that loss of NELFE reduced chromatin accessibility and therefore can turn down gene expression, but the question of how this occurs still remained. Nuclear lysate samples were prepared for mass spectrometry and identified 139 proteins in the nucleus (13). Then, Metascape analysis was used to help determine the potential NELFE function in the nucleus; and Metascape analysis revealed chromatin regulation proteins may play a role, specifically SMARCB1 (13). SMARCB1 is a core protein in the SWI/SNF complex and is required for the integrity of the SWI/SNF complex. In HCC, SMARCB1 is overexpressed and is rarely mutated (8). One way to confirm if SMARCB1 and NELFE interacted was through co-immunoprecipitation. To perform this co-immunoprecipitation, agarose beads were attached to a specific antibody for SMARCB1 and the nuclear lysates were added. This essentially allows scientists to pull out the SMARCB1 complexes and then determine which proteins are also bound to SMARCB1 by doing a western blot and detecting various proteins. In this case, NELFE was identified as a protein that binds to SMARCB1 (Figure 5). The reverse procedure was also completed to immunoprecipitate NELFE and then blot for SMARCB1. In both cases, the results demonstrate that SMARCB1 and NELFE are bound to each other in the nucleus (Figure 5).
Figure 3. Immunofluorescence of NELFE in Hep3B and HLE cell lines. Data generated by Anna Barry, Dang Lab of NELFE in Hep3B and HLE cell lines.
Figure 4. In vitro phase seperation data generated by Fawzi Lab at Brown University.
Figure 5. Co-IP and Western blot data generated by Alvaro Lucci, Dang Lab
After discovering that SMARCB1 and NELFE interact, the next step was to find out whether or not they phase separate together. In order to further explore this possibility, a couple steps were needed. First, the Infusion Cloning process. This started with linearizing the vector, which was done by taking restriction enzymes and cutting the vector at two spots. Then, PCR was done on SMARCB1 so that it could be used in the upcoming process. After amplifying with PCR, the SMARCB1 had an overhang on the 5’ ends of it so that it could link into your vector. After incubating, transformation was done on the new DNA from the Infusion cloning. That DNA was taken and put into E.coli and heat shocked. Once the DNA was in the bacteria, it was then placed onto a LB plate with agar which also included an antibiotic that was specific to the plasmid being used. Then, the colonies were left to grow on the plate to confirm that the Infusion worked. The colonies were then taken and used to perform a miniprep. After the miniprep, instead of being sequenced, a restriction digest was run to confirm whether or not the Infusion was successful. Unfortunately, the restriction digest data showed that the Infusion was unsuccessful because the primers were not designed correctly.


CONCLUSIONS AND FURTHER DIRECTIONS
It was observed through an immunofluorescence assay that NELFE does phase separate. It has also been observed that since reducing NELFE had an effect on chromatin accessibility, NELFE might have been phase separating with SMARCB1. Through the co-IP, it was seen that NELFE and SMARCB1 did interact, but it was not yet found whether or not they phase separate together.
Through the analysis of this data, it was concluded that NELFE underwent phase separation to form biomolecular condensates and that NELFE and SMARCB1 interacted with each other. To further expand on this research, a future step would be observing whether SMARCB1 and NELFE phase separate together in vitro and if they
Figure 6. InFusion cloning technique (12)
Figure 7. Vector with the incorrect primers. SMARCB1 was the section being cut out.
NELFE Affects Chromatin Accessibility in Hepatocellular Carcinoma | Lexi McCurdy ’25
co-localize in HCC cells. These could potentially be done through in vitro phase separations and immunofluorescence data. In the previous data, these tests showed proof of NELFE condensates and interactions between NELFE and SMARCB1, and through tests combining the two, it can be determined how they might be affecting each other.
ACKNOWLEDGEMENTS
I would like to thank the Dang Lab for welcoming me into their space and letting me work with them. Thank you to Anna Barry, in particular, for teaching me and editing my poster. I would also like to thank Ms. Wilson and the Baldwin Science Department for connecting me with the lab and guiding me through this process.
LITERATURE CITED
1. Cancer Stat Facts: Common Cancer Sites. n.d. National Cancer Institute: SEER. https://seer.cancer.gov/statfacts/ html/common.html.
2. Li, Q., Cao, M., Lei, L., Yang, F., Li, H., Yan, X., He, S., Zhang, S., Teng, Y., Xia, C., & Chen, W. 2022. Burden of liver cancer: From epidemiology to prevention. Chinese journal of cancer research = Chung-kuo yen cheng yen chiu. 34(6): 554–566. https://doi.org/10.21147/j.issn.1000-9604.2022.06.02l
3. Suresh, D., Srinivas, A. N., & Kumar, D. P. 2020. Etiology of Hepatocellular Carcinoma: Special Focus on Fatty Liver Disease. Frontiers in oncology, 10, 601710. https://doi.org/10.3389/fonc.2020.601710
4. Dang, H., Takai, A., Forgues, M., Pomyen, Y., Mou, H., Xue, W., Ray, D., Ha, K. C. H., Morris, Q. D., Hughes, T. R., & Wang, X. W. 2017. Oncogenic Activation of the RNA Binding Protein NELFE and MYC Signaling in Hepatocellular Carcinoma. Cancer cell, 32(1), 101–114.e8. https://doi.org/10.1016/j.ccell.2017.06.002
5. Liu, M., Jiang, L., & Guan, X. Y. 2014. The genetic and epigenetic alterations in human hepatocellular carcinoma: a recent update. Protein & cell, 5(9), 673–691. https://doi.org/10.1007/s13238-014-0065-9
6. Aoi, Y., Smith, E. R., Shah, A. P., Rendleman, E. J., Marshall, S. A., Woodfin, A. R., Chen, F. X., Shiekhattar, R., & Shilatifard, A. 2020. NELF Regulates a Promoter-Proximal Step Distinct from RNA Pol II Pause-Release. Molecular cell, 78(2), 261–274.e5. https://doi.org/10.1016/j.molcel.2020.02.014
7. Whelan, M., & Pelchat, M. 2022. Role of RNA Polymerase II Promoter-Proximal Pausing in Viral Transcription. Viruses, 14(9), 2029. https://doi.org/10.3390/v14092029
8. Mittal, P., Roberts, C.W.M. 2020. The SWI/SNF complex in cancer — biology, biomarkers and therapy. Nat Rev Clin Oncol 17, 435–448. https://doi.org/10.1038/s41571-020-0357-3
9. Cai, D., Liu, Z., Lippincott-Schwartz, J. 2021. Biomolecular Condensates and Their Links to Cancer Progression. Trends in biochemical sciences, 46(7), 535–549. https://doi.org/10.1016/j.tibs.2021.01.002
10. Vos, S. M., Pöllmann, D., Caizzi, L., Hofmann, K. B., Rombaut, P., Zimniak, T., Herzog, F., Cramer, P. 2016. Architecture and RNA binding of the human negative elongation factor. eLife. 5. https://doi.org/10.7554/ eLife.14981.
11. Conti, B. A., Oppikofer, M. 2022. Biomolecular condensates: new opportunities for drug discovery and RNA therapeutics. Trends in Pharmacological Sciences. 43(10): 820-837. https://doi.org/10.1016/j.tips.2022.07.001.
12. In-Fusion Cloning tips and FAQs. n.d. Takara. https://www.takarabio.com/learning-centers/cloning/infusion-cloning-faqs?srsltid=AfmBOormHdyS0IwxtM97Ka0iB3Stblm6RNFBl9Ny64voDFh7BN6kGtYi
13. Barry, Anna (personal communication, August 2024).
ALLIE MENG ’25
Allie Meng is a senior from Ambler, PA, and has attended Baldwin since the ninth grade. She is a Co-Founder and Co-Head of the Botanical club, which promotes interest in botany through plant swaps, regional terrarium workshops and participation in the Philadelphia Flower Show. Additionally, she is a member of the cross country team. In her free time, she enjoys reading, watching movies, crocheting, volunteering at her local cat shelter and exploring creeks.

Knockdown of NELFE in PDAC Using an mAID System
Allie Meng ’25, Brittany Ruiz, Anna Barry, Matt Gaida, Hien Dang PhD Dang Lab at Sidney Kimmel Cancer Center at Thomas Jefferson University
ABSTRACT
Pancreatic cancer is highly aggressive and the third national leading cause of cancer death. 90% of pancreatic cancer cases are pancreatic ductal adenocarcinoma (PDAC). It is hypothesized that NELFE regulates MYC, a common oncogene, in PDAC. In this experiment, a CRISPR-Cas9 vector and template mAID vector were successfully synthesized with the goal of implementing an mAID system in the KPC mouse pancreatic cancer cell line. The mAID system would tag and degrade Nelfe in the mouse cell. Future steps include co-transfecting the plasmids into KPC mouse cells and testing them for cancer-associated phenotypes to understand the relationship between Nelfe and Myc in mouse pancreatic cancer models.
INTRODUCTION
Pancreatic cancer led to 51,750 deaths in the United States in 2024, making it the third national leading cause of cancer death (1). It is highly aggressive, with a five-year survival rate of only 12.8% (2). A major reason for its aggressiveness is pancreatic cancer usually shows little to no symptoms until late stages. Thus, up to 80% are diagnosed in later stages that are more difficult to treat (3).
90% of pancreatic cancer cases are pancreatic ductal adenocarcinoma (PDAC) (4). PDAC is cancer in the lining of pancreatic ducts, which are responsible for transporting digestive enzymes and fluids to the small intestine (5,6). PDAC arises from lesions in ductal cells called pancreatic intraepithelial neoplasias, or PanIns for short (7). Current treatment for PDAC that hasn’t metastasized is resection. However, after the tumor metastasizes, the treatment is systemic chemotherapy (8).
MYC, a well established oncogene, is activated in many PDAC cases (9). Although efforts are being made to target MYC in cancer, no drugs are currently available due to MYC’s “undruggable” properties (10). Instead, regulators of MYC can be targeted to indirectly combat MYC dysregulation.
NELFE (Negative Elongation Factor E) is an RNA binding protein and regulatory factor of RNA Polymerase II (11). NELFE has been found to be oncogenic in Hepatocellular carcinoma, a common type of liver cancer, because it enhances the signaling of MYC (12).
Preliminary evidence suggests that NELFE potentially regulates MYC in PDAC as well. NELFE levels might i nversely correlate to survival rates in PDAC patients (Fig. 1). Additionally, NELFE expression might positively correlate to MYC expression in PDAC cells (Fig. 2). Thus, it is hypothesized that NELFE regulates MYC in PDAC.

Figure 1. Preliminary evidence of IHC patient samples showed PDAC cell lines NELFE is overexpressed in PDAC and high NELFE levels correspond to lower expression in PDAC. Unpublished data provided by Matt Gaida, Johannes Gutenberg University.

Figure 2. Knockdown of NELFE in human staining in PDAC using shNELFE indicates MYC expression decreased when NELFE expression decreased, suggesting that NELFE regulates MYC overall survival rates. Unpublished data provided by Brittany Ruiz, Thomas Jefferson University.
In order to understand the role of NELFE in PDAC, it was critical to develop a system that can rapidly degrade NELFE expression in PDAC cells. Mini auxin inducible degron (mAID) system is a recent technology that allows for specific and rapid degradation of the protein of interest using a plant-specific degradation pathway. When the phytohormone auxin is introduced to a protein tagged by mAID, auxin binds to mAID and recruits the E3 ubiquitin ligase complex to rapidly degrade NELFE via the ubiquitin-proteasome system (Fig. 3) (13).
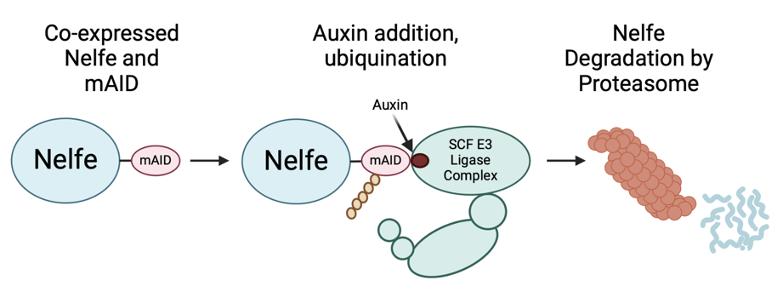
Figure 3. When the cell is treated with phytohormone auxin, auxin binds to mAID and recruits SCF E3 Ligase complex, resulting in degradation of target protein via the ubiquitin proteasome system.
To tag NELFE with mAID, the mAID sequence was inserted before Nelfe’s stop codon so mAID could be co-transcribed with Nelfe. A double stranded cut was administered before Nelfe’s stop codon using CRISPR/Cas9 technology, a tool for gene editing. To repair the cut, a donor mAID sequence was guided to the cut site by homology arms. Homology arms are sequences of DNA that match the edited DNA, so in this case the homology arms were homologous to Nelfe. The mAID sequence was then used as a template for homology directed repair (Fig. 4)
The homology arms were homologous to the mouse Nelfe gene because the experiments were designed to be conducted in the KPC mouse cell line, a mouse cell model of PDAC (15).

Figure 4. Double-stranded cut is administered before the Nelfe stop codon via CRISPR/Cas9 system introduced into the cells by a vector. mAID donor sequence from another vector is guided by homology arms to cut the site. Homology directed repair then inserts a copy of mAID sequence before stop codon. Nelfe and mAID are coexpressed, thus Nelfe is “tagged” by mAID as they are connected by a linker sequence.
MATERIALS AND METHODS
DNA required to construct the mAID system in KPC mouse cell lines were transfected via donor plasmids. Two donor plasmids were created. One contained mAID flanked by Nelfe homology arms and was dubbed the mAID donor plasmid (Fig. 5). The second contained Cas9 and gRNA specific to Nelfe’s stop codon to guide the double stranded cut, and was dubbed the CRISPR/Cas9 plasmid (Fig. 6).

Figure 5. SnapGene online model of the Mouse Nelfe mAID Donor plasmid. It contains homology arms and the sequence for mAID to insert the mAID sequence into KPC cells via homology directed repair.

Figure 6. Model of px330A-1x2, a gift from Takashi Yamamoto (Addgene plasmid # 58766 ; http://n2t.net/addgene:58766 ; RRID: Addgene_58766) that expresses Cas9 nuclease and gRNA.
Synthesis of mAID Plasmid
First, PCR extension was performed to attach 15 base pair long overhangs to the upstream Nelfe homology segment (dubbed “up”), mAID segment (dubbed mAID), and downstream Nelfe homology segment (dubbed “down”). The overhangs were complementary to the segment that it would bind to (Fig. 7). For example, the Up segment is flanked with complementary overhangs to the backbone and mAID segment.
7.

Figure
Next, the segments were bound together with overlap PCR, then infused into the PBluescript plasmid backbone (Fig. 8).
Figure 8.

The plasmids were then transformed into competent E. coli cells. After letting the bacteria grow and then picking clones, the samples were miniprepped to yield the plasmids. A restriction digest confirmed the infusion was successful because four of the clones yielded the correct band size (Fig. 9). The four clones were sent for Sanger sequencing to confirm the correct placement and orientation of the inserts.
9.

Synthesis of CRISPR/Cas9 Plasmid
First, the Cas9 backbone was digested with a restriction enzyme to produce sticky ends, which are single stranded DNA ends that are complementary to ends attached to the oligo inserts. The 5’ ends of the backbone were dephosphorylated to prevent self-ligation.
Next, the ends of the oligos were phosphorylated and the sense and antisense strands were annealed to form a duplex before ligating the insert into the Cas9 backbone.
Finally, the plasmids were transformed into competent cells. Clones were picked, miniprepped, and sent for Sanger sequencing.
Figure
RESULTS
mAID Plasmid

Figure 10. Sanger sequencing results for the hygromycin resistance gene, mAID gene, downstream Nelfe homology arm and upstream Nelfe homology arm show clean peaks.
CRISPR/Cas9 Plasmid

Figure 11. Sanger sequencing results for each of the three plasmids made with a unique gRNA sequence shows clean peaks.
DISCUSSION
The goal of my work was to create plasmid constructs to be used in mouse pancreatic cancer cells (KPC cell line). These plasmids will eventually allow researchers to induce degradation of NELFE via the proteasome using the mAID system and then test the genetically engineered pancreatic cancer cells for cancer-related phenotypes, testing the hypothesis that NELFE regulates MYC in pancreatic cancer. We were successful in creating these plasmids as verified by Sanger sequencing (Figures 10 and 11) and now they are ready to be introduced into the cell line.
FUTURE STEPS
The future steps are to co-transfect these plasmids into the KPC cell line, which is a mouse model of PDAC. Once we have a working mAID system in the KPC cells, we will administer auxin treatment to rapidly degrade NELFE and then conduct functional assays including colony formation, proliferation, and migration to determine if NELFE is important for these cancer associated phenotypes.
ACKNOWLEDGEMENTS
I would like to give my mentor, Brittany Ruiz, a special thank you for patiently guiding me through my entire project and poster creation process. I’m also so grateful to Dr. Hien Dang and the entire Dang Lab for being so welcoming, kind, and educational. Finally, thank you to Ms. Heather Wilson and the Baldwin School for providing me this opportunity.
LITERATURE CITED
Note on figures 3, 4, 7, 8, 9: Made using Bio Render, https://app.biorender.com/signin
1. National Cancer Institute. n.d.. Common Cancer Sites — Cancer Stat Facts. SEER Cancer. https://seer.cancer. gov/statfacts/html/common.html
2. National Cancer Institute. n.d.. Cancer Stat Facts: Pancreatic Cancer. https://seer.cancer.gov/statfacts/html/ pancreas.html
3. Sarantis, P., Koustas, E., Papadimitropoulou, A., Papavassiliou, A. G., & Karamouzis, M. V. 2020. Pancreatic ductal adenocarcinoma: Treatment hurdles, tumor microenvironment and immunotherapy. World Journal of Gastrointestinal Oncology, 12(2), 173–181. https://doi.org/10.4251/wjgo.v12.i2.173
4. Johns Hopkins Medicine. 2023. Pancreatic Cancer Types. https://www.hopkinsmedicine.org/health/ conditions-and-diseases/pancreatic-cancer/pancreatic-cancer-types
5. Johns Hopkins Medicine. Johns Hopkins Researchers Identify Key Markers in Pancreatic Cancer Progression Using a New Analysis Pipeline. 2024. https://www.hopkinsmedicine.org/news/newsroom/news-releases/2024/08/ johns-hopkins-researchers-identify-key-markers-in-pancreatic-cancer-progression-using-a-new-analysis-pipeline
6. Baylor Medicine. Pancreas and Its Function. 2020. Baylor College of Medicine. https://www.bcm.edu/healthcare/specialties/oncology/cancer-types/gastrointestinal-cancers/pancreatic-cancer/pancreas-and-its-function
7. Opitz, F. V., Haeberle, L., Daum, A., Esposito, I. 2021. Tumor Microenvironment in Pancreatic Intraepithelial Neoplasia. Cancers, 13(24), 6188. https://doi.org/10.3390/cancers13246188
8. Pancreatic Cancer Treatment (Adult) (PDQ®)–Patient Version - NCI. 2022. https://www.cancer.gov/types/ pancreatic/patient/pancreatic-treatment-pdq#_286
9. Hessmann, E., Schneider, G., Ellenrieder, V., Siveke, J. T. 2015. Myc in pancreatic cancer: Novel mechanistic insights and their translation into therapeutic strategies. Oncogene, 35(13), 1609–1618. https://doi.org/10.1038/ onc.2015.216
10. Wang, C., Zhang, J., Yin, J., Gan, Y., Xu, S., Gu, Y., Huang, W. 2021. Alternative approaches to target MYC for cancer treatment. Signal Transduction and Targeted Therapy, 6(1). https://doi.org/10.1038/s41392-021-00500-y
11. U.S. National Library of Medicine. 2024. Nelfe negative elongation factor complex member E [Homo Sapiens (human)] - gene - NCBI. National Center for Biotechnology Information. https://www.ncbi.nlm.nih.gov/gene/7936
12. Dang, H., Takai, A., Forgues, M., Pomyen, Y., Mou, H., Xue, W., Ray, D., Ha, K. C. H., Morris, Q. D., Hughes, T. R., Wang, X. W. 2017. Oncogenic Activation of the RNA Binding Protein NELFE and MYC Signaling in Hepatocellular Carcinoma. Cancer Cell, 32(1), 101–114.e8. https://doi.org/10.1016/j.ccell.2017.06.002
13. Yesbolatova, A., Saito, Y., Kanemaki, M. T. 2020. Constructing Auxin-Inducible Degron Mutants Using an All-in-One Vector. Pharmaceuticals (Basel, Switzerland), 13(5), 103. https://doi.org/10.3390/ph13050103
14. KPC Cell Line (C57/BL6 genetic background). n.d.. Ximbio. https://ximbio.com/reagent/153474/kpc-cell-linec57bl6-genetic-background
AMELIA TANG ’25
Amelia Tang is a senior from Chambersburg, PA, and has attended Baldwin since ninth grade. She is a Co-Head of the Botanical Club, an organization that takes care of Baldwin’s gardens and spreads appreciation for botany throughout the school and local community. She is also a co-captain of the Baldwin varsity golf team. During her free time, she enjoys traveling, spending time with her family, reading and practicing piano and violin.

Functional Validation of Childhood Obesity Variants
Amelia Tang ’25, Winter Bruner PhD, Molly Ridler, Struan Grant PhD Grant Lab, Children’s Hospital of Philadelphia Research Institute
ABSTRACT
This study aimed to further verify a possible childhood obesity genetic variant previously identified and investigated in a genome-wide association study (GWAS) and a massively parallel reporter assay (MPRA). To do this, a firefly luciferase assay was performed. Firefly luciferase assays measure the activity of firefly luciferase, a reporter enzyme, in cultured mammalian cells. They are used to study gene regulation and function (1). This study observed that the preliminary results corroborate the GWAS and MPRA.
INTRODUCTION
A genome-wide association study (GWAS) is a type of study which identifies genes associated with a certain disease or trait (2). Prior to this study, a GWAS was performed based on genomic data from children who had obesity and children who were considered healthy. The study compared the genome sequence data between the two groups to identify regions of noncoding DNA which had variations in comparison to each other that may be associated with childhood obesity. Part of the lab’s current work entails verifying a massively parallel reporter assay (MPRA) study which further isolated the GWAS variants that showed differential allele regulatory response— different levels of gene regulation and expression resulting from different alleles. MPRA, a targeted, highthroughput functional assay that directly tests regulatory effects of specific genetic variants, was needed to further investigate variants from the GWAS to elucidate the variants’ functional impact on gene expression (3). Whereas GWAS is used to identify potential disease-associated loci, MPRA is used to pinpoint variants within loci and study their effect on gene expression.
The variants selected in the GWAs and MPRA studies are non-coding regulatory sequences that control the gene expression of various genes. To determine the impact these regulatory variants have on gene expression, a luciferase assay was completed. Luciferase is a reporter gene that when expressed, produces an enzyme that catalyzes the oxidation of luciferin to produce light, a measurable product. So if the regulatory regions, or non-coding variants, control the increased expression of genes, there should be more light produced by the luciferase assay. If there is low expression of light in the luciferase assay then that particular regulatory variant is not very effective in increasing gene expression (1).
MATERIALS AND METHODS
DNA Digestion
Cut vector backbone and noncoding variant DNA sequence insert to isolate the necessary sections using restriction enzyme sites HindIII and KpnI.
Figure 1. Diagram of vector backbone and DNA insert which will be ligated to form a complete plasmid.

Functional
Ligation
Insert the non-coding variant into the plasmid vector pGL4.23 that contains the luciferase reporting gene to make a construct that can be inserted into E. coli cells.

E. coli Transformation
Insert plasmid into competent E. coli cells which will make more plasmid as they undergo cell division.
Gel Electrophoresis
Gel electrophoresis was used to verify the inserts by linearizing the DNA.
Sanger Sequencing
To determine that the correct sequences were inserted and that the molecular cloning was successful, sequencing of the DNA was conducted.
Cell Culture and Nucleoinfection
Microglial cells called HMC3 cells were cultured in preparation for nucleoinfection which inserts the desired construct into the nucleus of cells by creating small pores in membranes using electroporation.
Figure 2. Diagram of a complete plasmid.
Luciferase Assay
Luciferase assay was conducted to test expression of the luciferase gene which is regulated by the insert included in the plasmid. When expressed, the enzyme luciferase produced light which was measured. The production of light is directly proportional to the amount of luciferase enzymes present, and thus represents levels of gene expression and activity of the regulatory sequence of interest. A successful luciferase assay also indicates the success of nucleoinfection, as cells that received the plasmid will produce light.
RESULTS

Figure 3. Relative luminescence units are directly proportional to the activity of the regulatory sequence of interest. The results of the luciferase assay demonstrate that the variant allele caused a decreased amount of light to be produced, compared to the reference allele. Statistically, the alternative allele shows a –3.8 log2 fold change compared to the reference allele.
DISCUSSION
These preliminary results corroborate the previous MPRA study, indicating a potential differential allelic expression between the reference and alternate sequences being investigated. The results suggest that the alternative allele, which is present in a section of noncoding DNA, is involved in decreased expression of the luciferase gene when compared to the reference allele. The luciferase assay functioned effectively and can be used in future experiments to detect the capability of regulatory sequences in non-coding DNA to express genes.
ACKNOWLEDGEMENTS
Thank you to Dr. Winter Bruner for her mentorship and patience with me. Thank you to Molly Ridler for first teaching me proper technique and lab etiquette. Thank you to Dr. Struan Grant for giving me the opportunity to work in his lab. Thank you to the Baldwin Science Department for all their support. Thank you to my parents for allowing me to stay in Bryn Mawr over the summer for this internship.
LITERATURE CITED
1. Bioluminescent Firefly Luciferase Assays. n.d. MilliporeSigma. https://www.sigmaaldrich.com/US/en/ technical-documents/technical-article/cell-culture-and-cell-culture-analysis/imaging-analysis-and-live-cell-imaging/ firefly-luciferase-assays.
2. What are genome-wide association studies? n.d. National Library of Medicine. https://medlineplus.gov/ genetics/understanding/genomicresearch/gwastudies/.
3. Tewhey, R., Kotliar, D., Park, D. S., Liu, B., Winnicki, S., Reilly, S. K., Andersen, K. G., Mikkelsen, T. S., Lander, E. S., Schaffner, S. F., & Sabeti, P. C. 2016. Direct Identification of Hundreds of Expression-Modulating Variants using a Multiplexed Reporter Assay. Cell, 165(6): 1519–1529. https://doi.org/10.1016/j.cell.2016.04.027.
GEORGIA JANE WHAMOND ’25
Georgia Jane Whamond is a senior from Haverford, PA. She has attended The Baldwin School since the 3rd grade. She rows on the crew team, is section editor of the Hourglass and runs costuming for the Baldwin Maskers. In her free time, she enjoys cooking, arranging flowers and going to concerts with her friends.

The Effects of SST Peptide, EZH2 Inhibition, and Wnt
Activation on Neurogenesis and Neuronal Morphology
Georgia Jane Whamond ’25, Qian Yang PhD, Hongjun Song PhD Department of Neuroscience, Perelman School of Medicine, University of Pennsylvania
ABSTRACT
The foundation of neural development is neurogenesis, the differentiation of stem cells into different types of neural cells. In this study, human induced pluripotent stem cells (iPSCs) were treated with EZH2 pathway inhibitor (EZH2i), SST peptide, or Wnt activator. The cells were then allowed to grow for one week and then stained with progenitor markers, neuronal markers, and proliferative markers. Through immunofluorescence microscopy, the differences in the proportions of progenitors and differentiated neurons, as well as the cells’ morphology, was compared between treatments. The findings of this study sought to address how distinct signaling pathways affect the process of neurogenesis in a human neural model. It was found that cells treated with Wnt activator, somatostatin (SST peptide), or EZH2 inhibitor exhibited lower ratios of progenitor cells to total cells. This indicates that these chemicals all decreased progenitor proliferation, leading to higher percentages of differentiated cells in a sample.
INTRODUCTION
The use of human induced pluripotent stem cells, or iPSCs, has proven one of the most effective ways to study the human brain on a cellular level (1). Ethical debate around the use of embryonic human brain tissue, coupled with the dissimilarity of the human brain to that of a model organism commonly used for vivisection (eg. mice), has made the study of neurogenesis incredibly difficult to practice. However, neurogenesis, or the differentiation of stem cells into different neural cell types, serves as the foundation for neural development. iPSCs are one of the most effective tools to study neuronal development and differentiation (2). This study was focused on the processes involved with neurogenesis, and sought to understand the effects the activation or inhibition of certain signaling pathways would have on neurogenesis, neural cell development, and neural cell morphology. Specifically, the effect of agonizing the Wnt pathway and inhibiting the EZH2 pathway were observed.
In this study, immunofluorescence microscopy was used to determine the prevalence of certain cell types when treated with a protein activating the Wnt pathway, a protein inhibiting the EZH2 pathway, and with an inhibitory hormone called SST peptide. When Wnt ligands bind to specific receptors, they activate the Wnt/β-catenin signaling pathway or β-catenin-independent Wnt/Ca2+ or Wnt/planar cell polarity cascades (3). Activity of EZH2, the methyltransferase of histone H3K27, contributes to the active division of neural progenitor cells, so its inhibition discourages this behavior (4). SST peptide, or somatostatin, is an inhibitory peptide that has been implicated in the differentiation of GABAergic neural cells, and its presence associated with differentiation of iPSCs (5). All cell samples were descended from the same line of iPSCs. It was hypothesized that if the iPSCs were treated with EZH2 inhibitor, SST peptide, or Wnt activator, then the samples would exhibit lower ratios of SOX2+ cells to overall cells than the untreated samples.
MATERIALS AND METHODS
The methodology used in this experiment was nearly the same across samples of iPSCs, which all originated from the same line. All samples were treated with their respective proteins, with the exception of the control, which was treated with no additional proteins, for one week. Then, the samples were rinsed and fixed with formaldehyde. Subsequently, the cells were stained with a variety of primary antibodies. Then, samples were treated with anti-mouse, anti-goat, anti-rabbit, and anti-chicken secondary antibodies dependent on the origin
of their primary antibodies. This facilitated the staining process, undertaken with general nuclear stain DAPI, and immunofluorescent antibodies for the proteins SOX2, Nestin, MAP2, and Ki67.
Immunofluorescence microscopy allows fluorescent dyes to react with primary antibodies with which the cells are treated, which then light up under lasers. Images of these cells can be taken, and analyzed with both the naked eye and image analysis softwares. The presence of these markers was indicated with immunofluorescent dyes, and images taken using laser microscopy. The resulting images were analyzed using ImageJ’s Fiji software, counting the number of DAPI-positive nuclei against the number of SOX-2 positive nuclei in order to determine the ratio of neural progenitor cells to total neural cells in each sample.
The iPSCs, once treated with Wnt activator, EZH2 inhibitor, SST peptide, or left untreated, were then treated with primary antibodies to the proteins they were treated with or, in the case of the control sample untreated with a specific protein, with a non-immune antibody. Then, the samples were stained with fluorophore-conjugated secondary antibodies that, when imaged, indicate the presence of SOX2 protein, Nestin protein, MAP2 protein, and Ki67 protein. The cells were also treated with the general nuclear stain DAPI. The presence of SOX2, or Ki67 in cell nuclei is indicative of progenitor cell activity, as is the presence of Nestin in cell cytoplasm. MAP2 protein serves as a dendritic marker, and, when stained, provides insight into the morphology and maturity of differentiated neural cells. DAPI, a general nuclear stain, allows for the counting of nucleus numbers and, therefore, overall cell numbers in a sample.
RESULTS

Figure 1. The average ratio of SOX2-positive (SOX2+) progenitor cells per sample to total cells in the sample.

DISCUSSION
The data (Figure 1 and 2) support the hypothesis that human neural differentiation involves the Wnt and EZH2 pathways. If the iPSCs are treated with Wnt activator, EZH2 inhibitor, or SST peptide, then the ratio of SOX2+ progenitor cells per sample to total cells in the sample would be lower than that in the control (Figure 1). Since cells treated with Wnt activator show a marked decrease in SOX2-stained progenitor cells, it demonstrates the role of the Wnt pathway in differentiation. Similarly, the decrease in progenitor cells upon the inhibition of EZH2 pathway indicates the EZH2 pathway, when inhibited, allows increased differentiation. The data collected supported the postulation that inhibition of the effects would vary depending on the chemical treatment, with different averages of progenitor-to-total-cell-count ratios for each treatment, and differing standard deviations.
Furthermore, a previously undocumented phenomenon was discovered. Inhibition of the EZH2 pathway in neural stem cells led to neurons with larger somata and decreased branching morphology as compared to the untreated group (Figure 2). Somata are the non-process portion of neural cells, containing the nucleus. EZH2 inhibition led to a complete absence of basal progenitor cells in the culture and increased neurogenesis, and the presence of SST peptide similarly increased neurogenesis while decreasing the numbers of basal progenitor cells in the culture. This meant that cells treated with EZH2 inhibitory or SST peptide were differentiated at a faster rate than untreated cells. Wnt activation, on the other hand, behaved very differently. Activating the Wnt pathway actually led to a complete halt of neurogenesis in the cultures. Instead, cell cultures demonstrated renewal of progenitors, in contrast to the elimination of progenitor cells seen with EZH2 inhibition and the introduction of SST peptide. Overall, the data from this experiment indicated very different effects of each chemical on cultures of neural cells. However, all of the chemicals undoubtedly exerted effects on the cultures they treated.
Figure 2. The morphology of neurons stained with MAP2. Untreated neurons at left, and neurons treated with EZH2 inhibitor at right.
FUTURE STEPS
In the future, I’d like to further investigate the effects of EZH2 pathway inhibition on the morphology of neurons, since little research on it has been published. In fact, current research does not note any change in the size of neuronal somata, only in dendritic development, making the results of this experiment indicating a change in somata size especially fascinating. Additionally, I’d like to retry staining a proliferative marker, as I experienced some errors with Ki67 and Nestin staining, but think it could be fascinating to observe. Lastly, I’d like to continue experimenting with inhibiting and activating different chemical pathways in neural progenitor cells, hoping to find more strategies to increase neurogenesis, as decreased neurogenesis has often been linked to neurodegenerative disease (6).
ACKNOWLEDGEMENTS
Thank you to Dr. Hongjun Song, PhD, for the privilege of working in his lab and for his time, and to Dr. Qian Yang, PhD, for her time, guidance, and mentorship. Thank you to the staff of the Song and Ming labs for their kindness and help, and to the Baldwin Science Department for their placement and support!
REFERENCES
1. Cerneckis, J., Cai, H. & Shi, Y. 2024. Induced pluripotent stem cells (iPSCs): molecular mechanisms of induction and applications. Signal Transduction and Targeted Therapy 9, 112.
2. Kumar, A., Pareek, V., Faiq, M. A., Ghosh, S. K., & Kumari, C. 2019. ADULT NEUROGENESIS IN HUMANS: A Review of Basic Concepts, History, Current Research, and Clinical Implications. Innovations in Clinical Neuroscience. 16(5-6): 30–37.
3. Vega, L.A. & Alvarado, P. 2020. Cell-to-cell communication in developmental biology: A perspective. Frontiers in Cell and Developmental Biology 8, 860.
4. Kurosawa, H. 2019. Methods for inducing pluripotent stem cells. Stem Cell Research & Therapy, 10(1): 1.
5. Gómez, M. J., Muñoz, M. D., & Rodríguez, F. J. 2019. Wnt signaling regulates the differentiation of human iPSCs into GABAergic neurons. Molecular Brain, 12(1): 85.
6. Winner, B., & Winkler, J. 2015. Adult neurogenesis in neurodegenerative diseases. Cold Spring Harbor Perspectives in Biology. 7(4): a021287.
