Distracted Driving Statistics Zebra | 03.23.2020 by Taylor Covington In January 2020, The Zebra conducted a survey to observe
Continuing a survey conducted in 2019 by The Zebra, we
the driving behaviors and attitudes of 2,000 Americans.
analyzed the driving patterns of individuals categorized
• 37.1% of respondents completely agree that distractions
by their mobile device’s operating system.
on your mobile device impair your ability to drive safely,
• 58.6% of respondents using Apple iOS said they felt
yet 28.6% of all respondents admitted to texting and
a very high degree of pressure to respond to a text
driving as their number one distracted driving behavior,
message, while only 17.7% of Google Android users felt
over video-chatting, engaging with work emails, and
the same.
taking photos or videos.
• 70.4% of Apple iOS using-respondents admitted to
• 56.7% of all respondents reported that they eat or drink while driving.
video-chatting while driving, while only 23.7% made the same choice.
• 8.9% of respondents aged 25 to 34 said they felt a high
• 53.7% of Android users in this survey completely agree
degree of pressure to respond to a text message as soon
texting and driving is equally dangerous as drinking
as it came in, and 7.3% of that same age group also felt
and driving, while only 51.5% of iPhone users feel the
a high degree of pressure to respond to work-related
same way.
messages/emails while driving. • Of those respondents who completely agree that texting and driving is equally as dangerous as drinking and driving, 39.9% said they have engaged with drinking alcohol while driving.
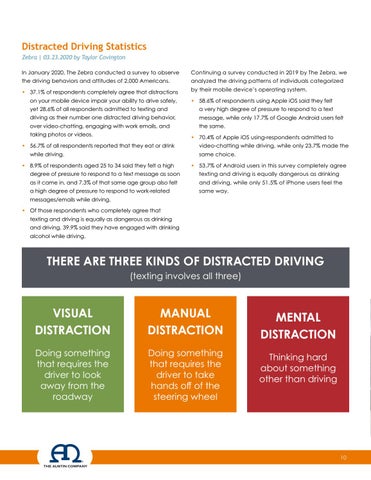
THERE ARE THREE KINDS OF DISTRACTED DRIVING (texting involves all three)
VISUAL DISTRACTION
MANUAL DISTRACTION
MENTAL DISTRACTION
Doing something that requires the driver to look away from the roadway
Doing something that requires the driver to take hands off of the steering wheel
Thinking hard about something other than driving
10