Suite 29, 3A Floor, IOI Business Park, 1 Persiaran Puchong Jaya Selatan, Bandar Puchong Jaya, 47170 Puchong, Selangor Darul Ehsan, Malaysia. Tel: +(603) 8070 9949 Fax: +(603) 8070 0047 Email: info@dimensionpublishing.com Website: http://www.dimensionpublishing.com
Chairman ROBERT MEBRUER
CEO/Publisher PATRICK LEUNG patrick@dimensionpublishing.com
General Manager SHIRLEy THAM admin@dimensionpublishing.com
Accounts cum Admin Assistant HO HWEE yEE accs@dimensionpublishing.com
For advertisement placements and subscriptions, please contact: dimension P ublishing sdn. bhd. (449732-T) at +(603) 8070 9949, or Email: info@dimensionpublishing.com
Subscription Department Email: subscription@dimensionpublishing.com
Printed by
hoffset P rinting sdn. bhd. (667106-V) No. 1, Jalan TPK 1/6, Taman Perindustrian Kinrara, 47180 Puchong, Selangor Darul Ehsan, Malaysia. Tel: +(603) 8075 7222 Fax: +(603) 8075 7333
Jurutera m onthly c irculation : 25,000 co P ies
Submission or placement of articles in JURUTERA could be made to the:Chief Editor THE INSTITUTION OF ENGINEERS, MALAySIA, Bangunan Ingenieur, Lots 60 & 62, Jalan 52/4, P.O. Box 223 (Jalan Sultan), 46720 Petaling Jaya, Selangor. Tel: +(603) 7968 4001/4002 Fax: +(603) 7957 7678 Email: pub@iem.org.my or sec@iem.org.my IEM Website: http://www.MyIEM.org.my
Number 2, February 2011 IEM Registered on 1 May 1959
Majlis Bagi s esi 2010/2011 (ie M Coun C il s ession 2010/2011)
YA ng D I pertuA / p res ID ent:
Y. Bhg. Dato' Ir. Prof. Dr Chuah Hean Teik
tIM bA l A n YA ng D I pertuA / Deput Y p res ID ent:
Ir. Chen Kim Kieong, Vincent
nAI b YA ng D I pertuA / V I ce p res ID ents:
Ir. M.C. Hee, Ir. Lee Weng Onn, Y. Bhg. Datuk Ir. Rosaline Ganendra, Ir. Yim Hon Wa, Ir. Prof. Dr Ruslan bin Hassan, Y. Bhg. Dato' Ir. Hj. Abdul Rashid bin Maidin, Ir. Choo Kok Beng
s et IAus A h A Kehor MAt / h onor A rY s ecretA rY:
Ir. Prof. Dr Lee Teang Shui
b en DA h A r I Kehor MAt / h onor A rY t reA surer:
Ir. Assoc. Prof. Dr Chiang Choong Luin, Jeffrey
WAKI l AWA M / c IVI l r epresentAt IV e:
Ir. Prof. Dr Mohd. Zamin bin Jumaat
WAKI l Me KA n IKA l / Mech A n I c A l r epresentAt IV e:
Ir. Tan Chee Lin @ Tan Ah Kow, Phillip
WAKI l e le K tr IK / e lectr I c A l r epresentAt IV e:
Ir. Yusouf bin Ahmad
WAKI l s tru K tur / s tructur A l r epresentAt IV e:
Ir. Tu Yong Eng
WAKI l K IMIA DA n D I s I pl I n lAI n / c he MI c A l An D others r epresentAt IV e:
Ir. Razmahwata bin Mohamad Razalli
Wakil lain-lain displin / Rep R esentative to othe R disciplines:
Ir. Assoc. Prof. Dr Cheong Kuan Yew
A hl I MA jl I s / c ounc I l Me M bers:
Ir. S. Kukanesan, Ir. Lai Sze Ching, Ir. Manogaran a/l K.Raman, Ir. Oon Chee Kheng, Ir. Li Thang Fai, Ir. Prof. Dr Mohd. Saleh bin Jaafar, Ir. Noor Hisham bin Yahaya, Ir. Prof. Dr Lee Sze Wei, Ir. Yee Yew Weng, Ir. Mah Soo, Ir. Dr Ahmad Anuar bin Othman, Ir. Yau Chau Fong, Ir. Wong Chee Fui, Ir. Mohd. Khir bin Muhammad, Y. Bhg Dato' Ir. Hj. Mohd. Isa bin Hj. Sarman, Ir. Assoc. Prof. Dr Marlinda binti Abd. Malek, Y. Bhg. Dato' Ir. Lim Chow Hock, Ir. Lai Kong Phooi, David, Y. Bhg. Dato' Ir. Chee Shi Tong, John, Ir. Gopal Narian Kutty, Ir. Tan Yean Chin, Y. Bhg. First Admiral Dato' Ir. Hj. Ahmad Murad bin Hj. Omar (Rtd), Ir. Ng Shiu Yuen, David, Ir. Kim Kek Seong, Ir. Chong Chew Fan, Ir. Hj. Mohamed Ali bin Yusoff, Ir. Kok Yen Kwan ahli majlis / council m embe Rs (by a ppointment):
Y. Bhg. Dato' Ir. Hj. Ahmad Husaini bin Sulaiman, Y. Bhg. Dato' Ir. (Dr) Seo Kian Haw, Andy, Y. Bhg. Dato' Dr Ir. Gan Thian Leong
b e KA s YA ng D I pertuA t er AK h I r / I MM e DIAte pA st p res ID ent:
Y. Bhg. Dato' Paduka Ir. Prof. (Dr) Keizrul bin Abdullah
be KA s YA ng DI pertuA / pA st p res ID ent s: Y. Bhg. Dato' Paduka Ir. Prof. (Dr) Keizrul bin Abdullah, Y. Bhg. Dato' Ir. Pang Leong Hoon, Y. Bhg. Dato' Ir. (Dr) Hj. Ahmad Zaidee bin Laidin, Y. Bhg. Datuk Ir. Prof. Dr Ow Chee Sheng, Ir. P.E. Chong, Ir. Dr Gue See Sew pengerus I c AWA ng A n / br A nch ch AI r MA n:
5. Negeri Sembilan – Ir. Hj. Baharuddin bin Ahmad Nasir
6. Timur – Ir. Hj. Roslan bin Abdul Azis
7. Terengganu – Ir. Hj. Rusli bin Embok
8. Melaka – Ir. Mohd. Khalid bin Nasir
9. Sarawak – Ir. Dr John Panil
10. Sabah – Ir. Teo Chee Kong
11. Miri – Ir. Ting Kang Ngii, Peter
A hl I jAWAtA n KuA s A I n F or MA s I DA n penerb I tA n / stA n DI ng co MMI ttee on I n F or MAt I on A n D publ I c At I ons 2010/2011: Pengerusi/Chairman cum Chief Editor: Y. Bhg. Dato' Ir. Hj. Abdul Rashid bin Maidin Naib Pengerusi/Vice Chairman: Ir. Tan Yean Chin Setiausaha/Secretary: Ir. Lau Tai Onn Ketua Pengarang/Chief Editor: Y. Bhg. Dato' Ir. Hj. Abdul Rashid bin Maidin Pengarang Buletin/Bulletin Editor: Engr. Abi Sofian bin Abdul Hamid Pengarang (Jurnal)/Journal Editor: Ir. Assoc. Prof. Dr Marlinda binti Abdul Malek Pengerusi Perpustakaan/Library Chairman: Ir. CMM Aboobucker Ahli-Ahli/Committee Members: Ir. Yee Thien Seng, Ir. Oon Chee Kheng, Ir. Chin Mee Poon, Ir. Prof. Dr Mohd. Saleh bin Jaafar, Ir. Hj. Look Keman bin Sahari, Ir. Mohd. Khir bin Muhammad, Ir. Prof. Dr Mohd. Zamin bin Jumaat, Ir. Tu Yong Eng, Ir. Yee Yew Weng, Y. Bhg. Datuk Ir. Prof. Dr Ow Chee Sheng, Ir. Cheong Loong Kwong, Allen, Ir. Ong Guan Hock, Ir. Tey Choo Yew, Calvin, Engr. Chin Kok Keong, Steven Engr. Shuhairy bin Norhisham
IEM Secretariat: Nor Aziah Budin, Nurul Aida Mustafa
the institution of engineers, M alaysia Bangunan Ingenieur, Lots 60 & 62, Jalan 52/4, P.O.Box 223, (Jalan Sultan) 46720 Petaling Jaya, Selangor Darul Ehsan. Tel: 603-7968 4001/4002 Fax: 603-7957 7678
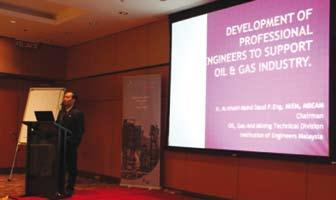
asset Management in the Oil, Gas and Mining Industry
by Ir Al-Khairi bin Mohd. Daud Chairman of Oil, Gas and MiningTechnical Division, IEM
the oil and gas industry in Malaysia started with the first production of oil in Miri, Sarawak, more than a century ago. When the oil derrick was closed 63 years later, she had produced 650,000 barrels of oil. Now, the oil derrick, nicknamed the ‘Grand Old Lady’, has become a state monument equipped with an observatory platform and a Petroleum Science Museum built next to it. The Grand Old Lady is an icon of a well-managed asset throughout its lifecycle.
Malaysia’s oil and gas industry has progressed tremendously from a mere upstream sector with offshore oil production platforms to complex refineries, gas liquefaction plants and petrochemical plants activities. Many of the oil and gas platforms and processing plants were built in the 1990s. After more than 20 years, these plants need upgrading and retrofitting work to rejuvenate the plants’ performance. As the plants get older, serious attention has to be given to ensure that the safety and integrity of the asset is not compromised. Various methodologies such as Risk Based Inspection and Fitness for Service have been introduced to address the asset risk factors.
In 2008, the world experienced a major energy crisis when oil price increased drastically. The rise sent economic shock waves which impacted the whole world. The event opened the world’s eye on the sustainability of petroleum as the main energy source. For now, the dependency on petroleum continues until a reliable alternative energy supply materialises. As for the industries, it is paramount that the management of the asset is given priority in order to support the economic requirement by maximising the productivity of the plants.
The development of any oil and gas facilities incurs a huge capital investment. Assets have to be managed effectively to avoid losses to the company due to failure in facilities and equipment. In Malaysia, recent events involving fires on an oil platform and refineries have prompted the industry to evaluate the performance and standard of the asset management of the companies concerned.
On a bigger scale, we were shocked to witness the explosion of a drilling rig on Deepwater Horizon in the Gulf of Mexico causing the lost of lives and leading to major environmental disasters to marine and wildlife ecosystems. For engineers, the incidents tested the competencies and safety standards in dealing with equipment and procedures, especially on new frontiers such as deep sea exploration. The incidents pushed engineers to think not only how to improve the design, but more importantly how to ensure that the incident will not recur in the lifecycle of the facilities.
In the mining industries, we witnessed the miracle rescue of 33 miners trapped 700 metres underground from a copper-gold mine in San Jose, Chile. The rescue efforts were successful due to support from an international collaboration team. Both of the companies involved in the two incidents have questionable safety records and sub-par operation and maintenance standards. The management was not serious in the proper management of the asset. The results of the incidents are clear. Asset management should be taken seriously for the sustainability of the organisation as well as the environment that we live in.
Asset management can be defined as a process that guides the gaining of assets, along with their use and disposal, in order to make the most of the assets and their potential throughout the life of the assets. While doing this, it also manages and maintains any costs and risks associated with the assets. It is not something that you can buy, but rather a discipline you must follow in order to maintain your assets.
Thus, in light of the importance of managing assets effectively, we would like to stress that engineers must be able to evaluate their current standard of asset performance and improve the management of the asset lifecycle more effectively. It is not enough that engineers only design and build facilities and plants. Engineers must also ensure that the facilities are operated, maintained and disposed of properly. We hope that engineers learn from the two unfortunate events and embrace good asset management practice holistically. n
asset Integrity Management at a Glance
asset integrity is the ability of the asset to perform its required function effectively and efficiently whilst safeguarding life and the environment. Asset integrity management, on the other hand, ensures that the people, systems, processes and resources which deliver the integrity are in place, in use and fit for purpose over the whole lifecycle of the asset.
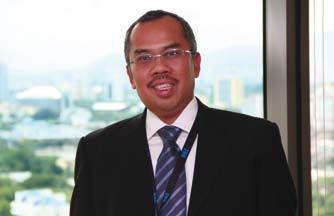
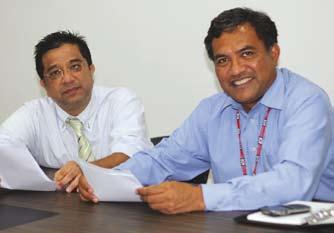
To grasp a better understanding of its importance, Jurutera met up with En. Sofiyan bin Yahya, President of the Malaysian Oil and Gas Services Council (MOGSC); En. Mohamed Hussain bin Md. Kamil, who heads the Asset Integrity Management Working Group at MOGSC; and Ir. Rozali bin Ahmad, president of the Association of Malaysian Oil and Gas Engineering Consultants (MOGEC).
Sofiyan began by explaining that, unlike other industries in Malaysia, the oil and gas industry is homogenous. As such, every player from the industry subscribes to the same global standard. He said, “This makes the workers in the oil and gas industry very exportable. That is why they are in high demand from oil producing countries such as Qatar and other countries in the Middle East.”
As far as the industry players are concerned, Mohamed Hussain pointed out that, “The main focus of oil and gas production companies is to maximise the returns of their assets, especially the platforms. The best way to do that is by coming up with a system to ensure the maximum lifecycle of their platform.”
For example, he explained that multinational companies such as Petroliam Nasional Bhd (Petronas) focus on minimising downtime to maintain its production schedule. This is crucial as Malaysia produces about 600,000 barrels of crude oil per day. Having an asset integrity management system in place can help avoid any shutdown or equipment failure and maintain the level of production.
This is in line with the objectives of the Asset Integrity Management Working Group at MOGSC, which are to collaborate and promote the development of asset integrity management in the Malaysian oil and gas industry towards maximising return on facilities or assets while maintaining stakeholder value.
Sofiyan stressed that asset integrity management is very important as the nation relies on the oil and gas industry players to boost the current production level. He said, “Under the Economic Transformation Programme, the level of crude oil production has been targeted to an increase of 700,000 barrels a day. This means that not only must the asset be in tip top condition, the industry players must also create new ways of extracting more oil.”
In order to do so, Ir. Rozali said, “These asset owners have to ensure that their assets are well maintained for the entire lifecycle of the assets, which is about 20 to 30 years. This can only be achieved by having a maintenance system in place to maintain the assets.”
He added that, “As part of the standard maintenance practice, local oil and gas platforms conduct a scheduled yearly maintenance check and audit. The platforms are shutdown for about two weeks for inspection and rectification work. If any problem arise, it has to be rectified within this timeframe.”
Mohamed Hussain concurred, saying that, “When a proper asset integrity management system is in place, asset owners can maintain their assets in accordance to the system. This helps them to plan the right time for a scheduled shutdown. With such a plan in place, they can maximise the productivity of their platform.” In addition, by optimising the inspections activity using the risk approach, this will allow asset owners to eventually extend the remaining life of their facilities.
Mohamed Hussain, who is also the Business Development Manager – INY (Oil and Gas) at Bureau Veritas (M) Sdn Bhd, pointed out that companies such as Bureau Veritas, which has significant experience in asset integrity management for leading international oil and gas companies globally, assists the latter in developing their asset integrity management program. These programs include:
He said, “From the audit, we will collect data which will be keyed into the software. This software will then predict with good accuracy the occurrence of the next failure, and when an asset owner should maintain their equipment before it fails. It is important to note that the accuracy rate depends on the data, so the accuracy will improve when more accurate and reliable data is available for analysis.”
Mohamed Hussain explained that the consultants look at different types of assets including the physical structure element such as the jackets, topside, walkway, ladder and well. He stated that such audits are very detailed as asset integrity management is multi dimensional.
Ir. Rozali pointed out that, “Failure in maintenance can cause a disaster or even a big loss to the asset owner. If the system is not well maintained, the platform may have to halt production. This creates a big impact as every platform is capable of producing millions of barrels.”
He added that a shutdown is very costly as it interrupts the production and supply of oil and gas to the domestic or international market. The consequences will have a cascading effect on the consumers as they may suffer supply shortage.
Sofiyan stressed that when a breakdown occurs on an oil platform, the situation can become very dangerous. For example, in December 2010, six offshore oil rig workers were injured when a fire broke out at a platform that was undergoing a scheduled shutdown for maintenance. He said, “Besides affecting productivity, asset or equipment can also cause injuries or even fatalities. As such, asset integrity also has a direct relation to human safety.”
He added, “The disaster at Deepwater Horizon is another example of the consequences of not looking after your assets. Because of that incident, the global oil and gas industry is currently reviewing and upgrading the standard to ensure that such a disaster will not repeat itself in the future. The fact is, Malaysia has also been affected by the incident at Deepwater Horizon. However, few outside the industry realise this.”
According to Ir. Rozali, there have been several disasters in the past. For example, a worker was injured when a fire broke out on an oil platform off Argentina’s South Atlantic coast last
year. In another incident, a fire and an explosion on an oil rig in the Gulf of Mexico off the state of Louisiana in the United States in April 2010 killed 11 people and caused massive ecological disaster as oil spilled into the water for months.
Fortunately, according to Mohamed Hussain, asset integrity management is widely practiced among oil and gas companies in Malaysia as well as around the world. He added that, although each oil and gas company have their own methodology and approach, the end result is always the same as most of these companies refer to the guidelines provided by the American Petroleum Institute, the American Society of Mechanical Engineers or other applicable internationally acceptable standards widely used in the oil and gas industry.
Ir. Rozali also pointed out that the oil and gas industry in Malaysia has been established since 1974. With almost 40 years of experience, the industry has spent a lot of effort to learn from industrial experience and adopt good asset integrity management practices.
Sofiyan said, “So far, Malaysia has been able to maintain a good track record in terms of maintenance. In spite of that, accidents can and do happen. This goes to show just how important asset integrity management is and the fact that there can never be enough of it.” n
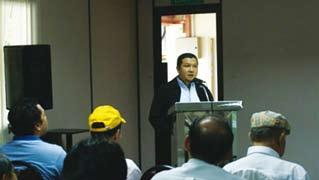
En. Mohamad Hussain bin Md. Kamil (left) and En. Sofiyan bin Yahya
Optimising asset
Dear Readers
One of the definitions of Asset in business term is anything of material value or usefulness that is owned by a person or a company. The key word here is usefulness. How do we ensure that the asset is useful? First it must be fit for purpose, not only when it is acquired but throughout its designed life. In engineering standard the life term may range from twenty-five to even fifty years.
Over the years, there have been many approaches considered and taken to sustain the usefulness of one’s asset. Most of them are related to the way the asset is maintained. Terms such as Total Quality Management (TQM), Condition Based Monitoring (CBM), Preventive and Predictive Maintenance (PM) and even Corrective Maintenance (CM) have been used to reflect the desire of technical teams to ensure that a particular asset is fit for purpose as long as possible. Asset Lifecycle is probably one of the latest trends or approaches in optimizing the usefulness of an asset. With proper execution of the relevant methodology, the Return on Asset (ROA) and Return on Investment (ROI) values would benefit the company and its shareholders.
The challenge for engineers actually does not start the moment the asset is delivered to the premise. In fact, it should start well before that when the conceptual design was first mooted. So often that this predesign stage overlooked the
by Engr. Abi Sofian bin Abdul Hamid
requirements for maintenance stage. As a result, modification or variation had to be done to improve the asset lifecycle. The main reason is probably the exclusive nature of the design and maintenance groups. As professionals, engineers should strive to widen their knowledge beyond the traditional outlook. Designers should not limit themselves to theoretical applications and likewise the operators or maintenance experts should be able to share and impart their knowledge and expertise so that the end result is one of unity!
While a lot of progress has been made in improving the lifecycle of fixed assets be it properties, plants or equipment, there are still a lot more need to be done for the other asset, namely human capital. We used to hear that employees are the best asset of a company but is this still true today? Without doubt, we could have the most sophisticated and intelligent building, equipment and maintenance system but if it is not matched with equally intelligent, skilled and versatile workforce to execute all the programs would we be able to optimize our ROA and our ROI?
Please share your thought. n
Warm Regards
The Editor
Voting papers for the Election of Council Member for Session of 2011/2012 will be posted to all Corporate Members in March 2011. Following the close of nominations on 30 December 2010, the election exercise will be in progress. All Corporate Members are to take note of the requirements of Bylaw Section 5.11.
The voting paper shall, not less than twenty-eight (28) clear days before the date of the Annual General Meeting be sent by post to all Corporate Members residing in Malaysia and to any other Corporate Members who may in writing request to have the paper forwarded to him. The voting paper shall be returned to the Honorary Secretary in a sealed envelope so as to reach him by a specified date not less than seven (7) days before the Annual General Meeting.
It is expected to send out the voting papers by 1 March 2011 in compliance with the requirements of Bylaw Clause 5.11 above. The voting papers will be sent by post to all Corporate Members residing in Malaysia
Any Corporate Members residing outside Malaysia, who wish to receive voting papers, are advised to write to the Honorary secretary on or before 25 February 2011.
Regards.
Y. Bhg. Dato’ Ir. Pang Leong Hoon Election Officer, IEM
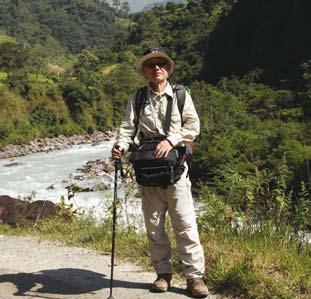
My Hobbies and Life after retirement
If you ask me, I really cannot tell you exactly when I retired from my working life. All I remember is that, in 2000, I decided that I had enough of the mental pressure that came from my job as a contractor, that I did not want to have big ulcers in my stomach, and that I wanted to have some time to really indulge in my hobbies, so I reorganised my business that year. After that exercise, I only went to my office in the morning, and even then, I did not do much work there as far as the business was concerned. I devoted more and more time to things that I found pleasure in doing.
About four years ago, my eldest son left his job in Singapore to completely relieve me of my remaining responsibilities in running the business. Since then, I have been able to enjoy my hobbies without undue concern for worldly considerations such as time and financial constraints.
Strictly speaking, life after retirement is, like life before retirement, a very personal thing and it need not be shared with others. However, since I have come across quite a number of cases where people (not necessarily engineers) were unwilling to retire because they do not know what to do with their time when they stop going to work, I guess my little experience in managing my life before and after retirement may help some would-be retirees overcome their initial phobia for the unknown world of retirement and, at the same time, help some younger people prepare themselves for the unavoidable eventuality of retirement.
You will have recognised by now that, unlike certain people, I actually looked forward to my retirement from work. Now that I have been a retiree for four years, I am also very pleased to report that not only have I not become a couch potato, I
by Ir. Chin Mee Poon
have, in fact, not watched any TV programs for quite sometime, not even my favourite National Geographic and Animal Planet channels. I simply do not have enough time to do all the things that I like to do.
Many of my hobbies and interests were cultivated during my school days. I started to collect stamps when I was very young. When I was still in Standard Six, I began to contribute essays to Chinese magazines and newspapers. I even wrote some short stories and poems during my secondary school and varsity days. To date, I have written three books; all three are travel stories. When I saved enough of my meagre pocket money, I bought a pinhole camera and started shooting away. At one time, I also enjoyed playing the harmonica.
In those days, the only time I travelled outside of my hometown in Teluk Intan (known as Telok Anson then) was to visit my grandparents in Singapore with my mother and younger sister during the year-end school holidays, cycling to Bidor for its waterfall, and cycling to Sabak Bernam to visit classmates. My first overseas trip was to Bangkok and Hong Kong with several of my classmates under the banner of the “Engineering Study Tour” organised during my undergraduate days as an engineering student at the University of Malaya. When my children were still young, my wife and I used to take them on motoring holidays, at times, making a complete trip around the peninsula from north to south and from coast to coast. That helped cultivate our children’s liking for travel too. Without making any conscious effort on my part, I picked up new interests as time went by. One of them was the collection of matchboxes. I now have a few thousand matchboxes in my collection.
I also started to collect turtle replicas about 15 years ago. With a collection of more than 450 replicas now, I am listed in the Malaysia Book of Records as having the largest collection in this category. My interest in collecting turtle replicas was actually kindled by another interest of mine. About 20 years ago, I became a certified scuba diver. In a diving expedition at Pulau Sipadan off the southeastern coast of Sabah, I encountered so many green and hawksbill turtles in the sea and became so fascinated with them that I made up my mind there and then to start collecting turtle replicas.
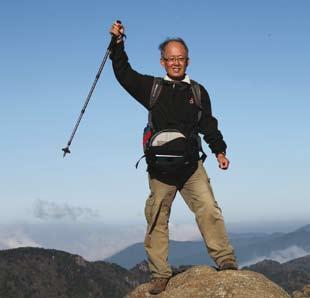
My interest in trekking and mountain climbing evolved out of my curiosity for the unknown, including my own physical stamina and mental tenacity. About 15 years ago, I attended IEM’s AGM that was held in Kota Kinabalu, Sabah. I decided on the spur of the moment to join in for the climb up Mt. Kinabalu which was organised for the attendees of the AGM.
Without any preparation or knowing what to expect and wearing only a jacket over my normal clothing which I had bought at the eleventh hour, I ended up among the last to reach Laban Rata, completely soaked in the rain and shivering from the cold. It was one of the rare occasions when Sabah was hit by a typhoon that also thwarted the mountaineering engineers’ hope of reaching the peak.
I was subsequently able to have my photo taken at Low’s Peak in 2000 when I joined a group of Rotarians for the millennium climb. I made it to the peak again a few years later. It was during this second successful climb that I met a young lady who was a very keen trekker. My interest in trekking developed from there as my circle of trekking friends grew.
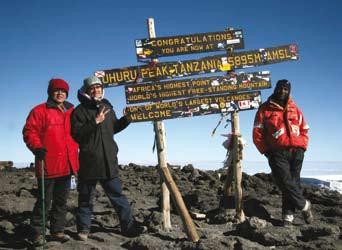
Since then, I have trekked many different parts of our country as well as in Nepal, India, Bhutan, China, Mongolia, Russia, Indonesia, Thailand, Philippines, South Korea, Iran, Turkey, New Zealand, Australia, Tanzania, Cyprus, Scotland, Peru, Ecuador, United States and Canada. I have also successfully climbed Gunung Rinjani on Lombok Island, Indonesia, and Mt. Kilimanjaro in Tanzania, East Africa.
So you realise by now why my life after retirement appears to be as busy as before retirement. It is certainly more colourful than before because of the great varieties of activities that I allocate my time for. However, from the adage that “all work and no play makes Jack a dull boy”, I believe in the corollary that “all play and no work makes Jack a playboy”. As such, I re -
main an active member of the Institution of Engineers, Malaysia and of the Rotary Club of Shah Alam.
IEM is a learned society to which I, as a professional engineer, rightly belong. It was through my training as a civil engineer that I was able to build a career and achieve financial freedom in the process of advancing my career. So it is only natural for me to try to play a small role to give back a little of my time and know-how for the advancement of the engineering profession. My contribution may not be significant, nevertheless, if the little that I do can make some engineers happy, I consider it meaningful enough and I shall continue to do it.
I became a Rotarian at the end of 1983. My involvement with the Rotary movement actually started in 1962 when I joined the Interact Club of my school. Interact Clubs, as you probably already know, are sponsored by Rotary Clubs for school pupils between the age of 14 and 18. I became the president of my school’s Interact Club in 1964. Almost 20 years later, I was invited to join the Rotary Club of Shah Alam. I became its president in 1994/5.
Through my involvement in the Rotary movement, I was not only able to widen my social circle substantially beyond the engineering fraternity, I was also able to render service to some less fortunate members of our society in ways that I alone would find difficult to do.
I consider myself very lucky to be able to pull out from the quagmire of poverty and enjoy relative affluence when many people still have to struggle to make ends meet. Therefore, if I can help bring a little sunshine to some people’s life or replace tears with a smile on a child’s face, let me do it. If my strength and means are too insignificant, let me join hands with other like-minded people and do it together.
I have also been a member of the Malaysian Nature Society for about 30 years now and I participate in many of the society’s activities. I have delivered several talks with slide shows to some of the society’s members.
Yes, I may be as busy as when I was working, but there is a significant difference. I am now busy doing things without feeling any mental pressure, and all the things that I do are things that I LIKE to do, not things that I HAVE to do. So I derive a lot of pleasure and satisfaction from doing those things, and I look forward to the arrival of every new day as each new day signifies more time for the enjoyment of all my hobbies and interests.
I am thankful that my hobbies and interests cover both the physical and mental aspects of my life. I am able to maintain my physical health through trekking, mountain climbing, scuba diving and even travelling, and I am also able to derive a lot of satisfaction and spiritual fulfilment from my mental pursuits such as writing travel stories, sharing my travel photos and travel experiences with friends, reading, and even just looking at my collection of stamps and turtle replicas.
Last but not least, I am thankful that through sheer hard work, careful planning and prudent investment, I have been able to achieve financial freedom which allows me to indulge in all of my hobbies and interests while continuing to support my family and I with a reasonably high standard of living. n
rM1 Billion Contracts
for terengganu
Hydroelectric Project Inked by tNB
Tenaga Nasional Bhd (TNB) has inked three agreements worth RM991.8 million for the Hulu Terengganu hydroelectric project which is expected to be completed and the station made operational by October 2015. The project was part of ongoing efforts to provide peak load capacity in order to meet increasing electricity demand and improve power system security by using renewable energy and reduce carbon emissions. The first agreement, worth RM828.3 million, was a joint venture involving Loh & Loh Corp Bhd and Sinohydro Corp Ltd for the main civil works including the construction of two dams, a water transfer tunnel and an underground power house.
The second agreement, worth RM127.6 million, was with a consortium involving Alstom Projects India Ltd and Alstom Hydro Malaysia Sdn Bhd involving the design, manufacture, erection, testing and commissioning of two generating plant, each with a generating capacity of 125MW and the associated electrical and mechanical equipment. The third agreement, worth RM35.9 million, was with a joint venture comprising SNCLavalin Inc, SNCLavalin Power (Malaysia) Sdn Bhd, KTA Tenaga Sdn Bhd and G & P Professionals Sdn Bhd to provide detailed engineering design for the main civil works, engineering design review for the electrical and mechanical works, project management and site supervision.
(Sourced from The Star)
Boeing Held regional Benchmarking tour for Leading aerospace Manufacturers
Boeing recently held its first Southeast Asian Aerospace Industry Benchmarking Tour in Malaysia to foster supplier partnerships and enhance Malaysia’s position as a global aerospace manufacturing hub. The objective of the tour was to help its key suppliers in Malaysia and across the region competitively position themselves to support the substantial growth expected in the Asia Pacific region over the next 20 years. Participating Malaysian aerospace manufacturers included Asian Composites Manufacturing Sdn Bhd (ACM), Composite Technology Research Malaysia Sdn Bhd (CTRM), Spirit AeroSystems (M) Sdn Bhd, SME Aerospace Sdn Bhd, Malaysia Airlines (MAS) Engineering, and Honeywell Malaysia. Boeing Commercial Airplanes currently places direct work with two Malaysian suppliers, ACM and SME Aerospace. Boeing also has indirect composites work with CTRM through its supplier partners, Goodrich and Spirit AeroSystems, as well as systems and avionics work with Honeywell and Celestica in Penang. Boeing Commercial Airplanes, through Aviation Partners Boeing (APB), has also chosen MAS Engineering as its only modification and installation center for blended winglets in Southeast Asia.
(Sourced from BERNAMA)
rM1 Billion Solar Cell Plant by twin Creeks in Perak
According to Deputy Prime Minister Tan Sri Muhyiddin Yassin, the Government was working on building strong research and development to support innovation in the solar production value chain. Officiating at the groundbreaking ceremony of Twin Creeks Malaysia Sdn Bhd's RM1 billion highpower solar cells production plant in the Kanthan Industrial Area, he also noted that Twin Creeks' foray into Perak was another development that has potential and that the state could be the hub to produce solar energy in the future.
Twin Creeks Malaysia is a joint venture (JV) between USbased Twin Creeks Technologies Inc, Perak State Development Corp and a state government subsidiary, The Red Solar (M) Sdn Bhd. Datuk Rais Hussin Mohamed Ariff, The Red Solar’s executive chairman, said the JV was signed in June 2010 to manufacture solar cells using Twin Creeks' patented technology. The Red Solar would be the exclusive distributor for the solar cells and panels produced by Twin Creeks Malaysia for the country and Southeast Asia. Phase one of the plant would begin with a production capacity of 100MW in 2012, which would be increased to 500MW in 2014. The plant will create 1,000 jobs involving 500 semiskilled workers, 200 in engineering and the rest in management and supervision. Twin Creeks Malaysia planned to continue with the second phase construction of the plant in 2015 on 15ha stretching to Perak HiTech Park.
(Sourced from The Star)
Four PhD Students receive uSM’s Vice-Chancellor award
FOUR doctoral (PhD) students from Universiti Sains Malaysia (USM) have become recipients of the university’s ViceChancellor Award 2011. The prestigious award has been given to only seven other PhD students since 2007.
The recipients will each get a RM3,000 monthly allowance while their tuition and examination fees for three years will be borne by the university. Lim Way Foong, 26, a second year PhD candidate from the School of Materials and Mineral Resources Engineering, said the award now allowed her to purchase materials and chemicals for her research. Her research seeks to reduce energy loss during its conversion from sustainable energy sources such as solar power to high powered electrical appliances. Chang Kah Haw, 25, from the School of Health Sciences, will use the allowance to purchase resource materials for his research on gunshot residue. The other two recipients are Quah Hock Jin from the School of Materials and Mineral Resources Engineering working on kalium nitrate as high powered devices and Lam Man Kee from the School of Chemical Engineering.
(Sourced from The Star)
business development: A Preview
Preamble
The purpose of this article is to share relevant and preliminary insights pertaining to the subject of business development but not intended to present a discourse on it. Those insights may relate to business development at corporate and/or entrepreneurial levels.
background
Business growth in a balanced context remains one of the relevant solutions for an enterprise in pursuit of its long term objectives. The term “balanced growth” envisaged here refers to the balance between profits, asset and enterprise growth that give rise to a healthy cash flow and often business growth related to business development.
ImPortance and PrevaIlIng defInItIon of busIness develoPment
In light of globalisation, and the intense competition locally and internationally, an enterprise can ill-afford to stay with the same knitting for a considerable period without proper forms of business development. An enterprise that adopts the appropriate approaches of business development enhances its chances of meeting its tangible short term and long term objectives in addition to staying viable – at least in the same form and under the same ownership.
Business development can be construed differently. The writer is inclined to adopt the meaning that business development relates to all the processes involved in achieving the objectives of new business opportunities, including product or service design, business model design and marketing.
The basics of business development in this article could be looked at via:
1) long term objectives (three to five years into the future); 2) project management perspectivei) scope; ii) specification/performance requirements; iii) timeline; iv) financial constraints; and 3) project chronological phasesi) development; ii) implementation; iii) close out.
long term obJectIves
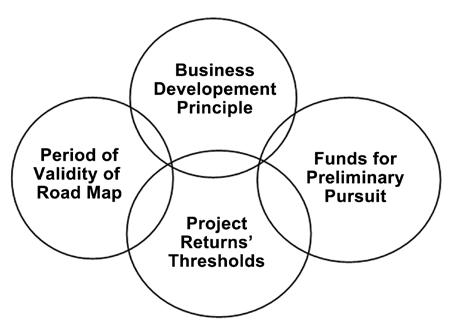
In establishing an appropriate approach for business development, it would be prudent for an enterprise to contemplate over the Road Map Parameters (RMP) that typically comprise of those in Figure 1.
The RMP refers to the high level agreement of stakeholders in the type of business development opportunities to be undertaken, period of review, expected returns for various types of projects and the amount of financial provisions to be allocated for relevant business development pursuits. The latter may vary from case-to-case. (Figure 1)
by Ir. Fathullah Razzaq Ghazali, Oil, Gas & Mining Technical Division (OGMTD)
Figure 1: Road map parameters
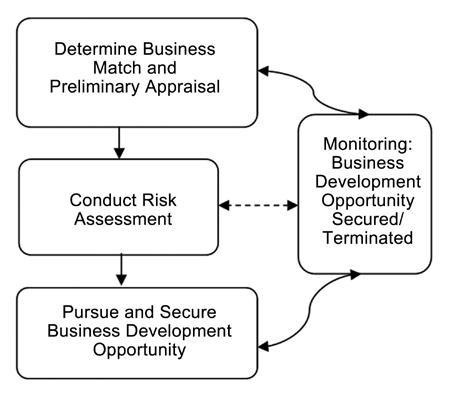
Figure 2: Process overview
Process overvIew and rIsk assessment
Regardless of whether an enterprise was aiming for low hanging fruits and/or for a long shot, it would be prudent for that enterprise to undertake the relevant sub-process as described in Figure 2.
Such sub-processes promote effective learning and capture of the business development opportunity pursued and SWOT (Strength, Weaknesses, Opportunity and Threat) analysis.
It may be prudent to assign the responsibilities of these sub-processes under planning to provide one of the checkand-balance mechanisms in a “deal fever”.
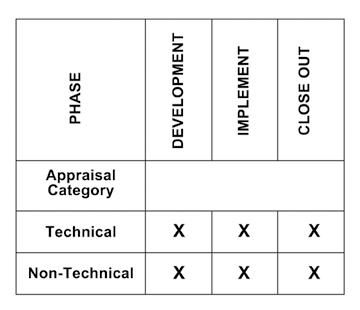
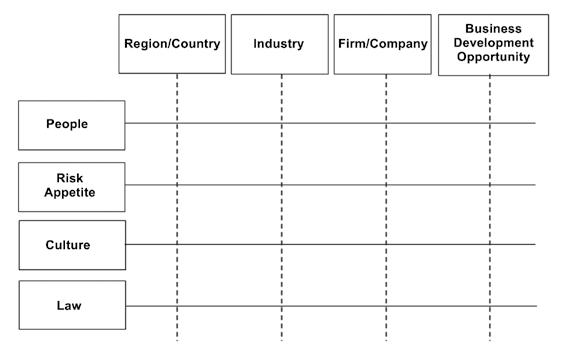
A sub-process of risk assessment would typically entail preliminary and/or finalised technical and non-technical assessments as illustrated in Figure 3 and for the general scope shown in Figure 4. Such assessment should also cover project management perspective and chronological phases.
It would be imperative to assess the risk in accordance with established standards to enable consistent learning and capture of the business development opportunity pursued and accompanying SWOT analysis. Such standards ought to have been sanctioned by high level stakeholders.
other resources to suPPort rIsk assessment
There are already in existence global information service providers that provide general and/or specific researches that relate to business development being pursued and supplement the risk assessment exercises. With the appropriate subscription requirements, such global information services may add value to meeting the enterprise’s short term and long term objectives.
take-a-ways to consIder
Business development:
i) can generally be a function of people and their risk appetite, law and culture; ii) would require the prudent exercise of an appropriate risk assessment; and iii) could be supplemented by relevant resources to support risk assessment - global information service providers. n
[3] Wikipedia, the free encyclopedia (15 February 2009) en.wikipedia. org/wiki/New_business_development, Website Wikipedia, “New Business Development”.
[5] http://blogs.wsj.com/source/2010/07/28/deal-fever-is-no-raredisease/, Robert Armstrong, “Deal Fever Is No Rare Disease“, July 28, 2010, The Wall Street Journal.
[6] http://www.monash.vic.gov.au/forms/events/EventsGuideAppendixF-RiskAssessmentPlanv.15.pdf, “Australian Standard 4360:2004 Risk Management”
[7] H. Felix Kloman and Seawrack Press, Inc, “Global Risk Management Standards and Definitions”, Risk Management Reports, Volume 27, No. 9 September 2000.
Figure 3: Risk assesment
Figure 4: Scope of risk assessment
Jay Goldman
electrical asset Management: A Guide to Benchmark Methodology and Case Study
eLeCtrICaL asset management is very crucial in every plant operation to sustain its continuity in operation. Every production plant aspires to operate at the fullest and in flawless mode without technical teething glitches if possible. However, the operation of electrical equipment is unpredictable as most of the equipments are operating in a ‘static’ nature with inherent hidden risk within it.
The probability of the failure rate for electrical equipment is very low in comparison with other equipment assets in general. However, this does not prevent electrical equipment programme asset failure if poor asset management coexist within the maintenance organisation. Once the primary and secondary electrical equipment break down, it can put the plant into a catastrophic state, resulting in a long lead time to restart the production line and lost of business opportunities. In an effective plant operation management, a good control on asset management in electrical equipment is encouraged to avoid any mishaps from occurring. Therefore, a benchmarking assessment is recommended to measure the effectiveness of asset management in practice, by benchmarking it with the best performers who are leaders in electrical asset management in its business process units.
by Ir. Lam Sing Yew
This paper will present the benchmarking methodology concept for the post engineering field of electrical asset man-agement by examining equipment reliability and effective maintenance in practice. A case study will be presented to show how this benchmarking assessment methodology is able to assist a business organisation to prepare electrical asset management roadmap strategies that can be incorporated into their electrical asset management in the future. Thus, the plant operation can operate in a safe manner and has effective execution derived reliability strategies in place to mitigate future electrical failure risk.
BeNCHMarKING CONCePt
The simple definition of ‘benchmarking’ is the process of measuring products, services and practices against those of leading companies. In this context, benchmarking is used to measure engineering maintenance practices in the post engineering field, assessing how asset management organisation is performed and also how to adapt or enhance the way of doing things within an organisation. Once the equipment warranty expires and a lackadaisical asset care attitude towards the electrical asset exists within an
Table 1: Initial composition of composting material
organisation, the plant asset has a tendency to operate in a high risk condition if the current maintenance has not been revamped since day one of the operation. Therefore, an effective benchmarking assessment study is recommended, which should be carried out by external specialist consultants or in-house global reliability maintenance experts. The outcome of the benchmarking assessment will create a management of change in the maintenance culture by tapping the best practice leaders approach.
BeNCHMarKING MetHODOLOGY
This benchmarking tool has adapted the qualitative and quantitative methodology and is used to carry out the assessment for each reliability and maintenance of an organisation. In Table 1, each defined element will specify the benchmarking target objective and assessment criteria which has been described in detail and is based on the standard ISO 14224: 2006 [1].
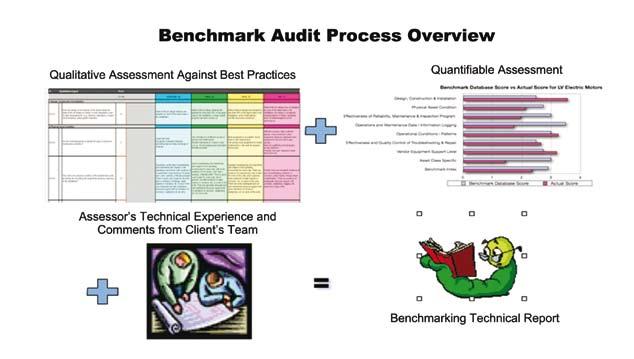
The qualitative methodology uses a formulated tailor questionnaires for each element to ensure that the assessment criteria is achieved. Each electrical asset management asset will consist of 20 to 25 questionnaires. The quantitative methodology tabulation is used to compute the average benchmark performance score from all the elements of the qualitative questionnaires which uses a rating of 0 to 4. Each element is weighted in the percentage contribution and is dependent on the priority ranking of the benchmarking assessment objective. Figure 1 shows the benchmark audit conceptual approach of the Electrical Reliability Maintenance (ERM) tool which has been used in many industries to benchmark against world class performers.
aSSeSSMeNt aND aNaLYSIS
The benchmarking assessment is carried out by a welltrained assessor. He/she shall acquire the following attributed skills:
Has acquired many years of experience in electrical operation and maintenance of industrial electrical equipment
Has excellent knowledge in electrical maintenance programme development; e.g. Basic Asset Care, Predictive Techniques, Preventive Maintenance Programmes, including reliability assessment
Is able to identify strengths and weaknesses, i.e. opportunities for improvement
Is able to deliver a structured, comprehensive technical report on the findings and recommendations
Possess the confidence and background to defend his/ her audit findings at any level of the organisation
The benchmarking exercise is divided into two parts in the scope of works. The first phase is to have an interactive discussion on the maintenance practices of the organisation. The second phase is to survey the electrical asset equipment in the field selected at random. Field activities do not involve measurement, however, physical observation is carried out on selected equipment to assess the equipment operation, and it is executed with the following techniques:
Visual
Visual physical inspection of the asset condition; e.g presence of foreign substance (e.g. oil, dust), wiring entry and exit, operating panel, reading pane, operating condition and ambient environment
Listen
Listening to electrical noise and operating mode; e.g. humming noise, high decibel, emitting unusual noise
Observe
Observing the electrical asset behaviour; e.g. moving parts mechanism, electrical distribution condition, electrical environment location
Feel
Feel or touch the safe surface of the electrical equipment to assess the heat generation, static charge, feel the operating condition surrounding the equipment
After gathering the required information, the assessor will then rate each assessment element with the relevant rating. The score will be computed into the average score after it has gone through the benchmark logic analysis. The assessor will prepare the benchmarking report which will consist of the following contents:
The position ranking against the best performers
The reliability and maintenance gap identification of areas of improvement
Identification of the risk focus areas for immediate action plan
Map out a three-year asset management roadmap programme strategies for the top management
CaSe StuDY
The ERM benchmarking tool has been used to assess one of the Upstream and Exploration fields where the electrical asset has been in operation for more than 20 years. The management has decided to do a benchmarking exercise to measure the effectiveness of the reliability and maintenance practice culture in their business organisation. The management also intended to adopt world class best practice industry in electrical asset care management in its organisation. In addition, this exercise also allows the maintenance personnel to learn from world class practitioners for electrical asset.
This project was completed in 2009 for some of the selected electrical oil and gas platforms, which covered most of the electrical assets. However, this report will only present one asset class, which is the low voltage electric motor equipment, for the purpose of the case study.
I) Non-Field and Field Data Collection
There were about 150 low voltage electric motors that have been installed at the selected oil and gas platforms of which some of them were old and some have been newly replaced at site. Before going to the field activities, an interactive discussion took place with the reliability and maintenance department to scrutinise
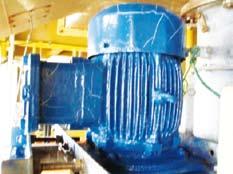
Figure 2: Field data collection of low voltage electric motor
the maintenance data capturing process and also history records. With the prior gathered information in hand, the field audit activities were carried out successfully and the identified focus area was set as the target for the assessment. The non-field and field data collection was analysed at the back office between the lead assessor and the other assessors in order to rate the ERM benchmark tool after scrutinising the gathered technical and non-technical facts from the field site.
The whole benchmarking exercise for each asset class took about two days for non-field and field data collection and another two more days to do post data analysis using the ERM benchmarking tools. Figure 2 exhibits samples of the field collection data at site.
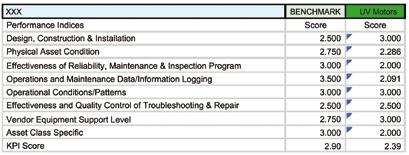
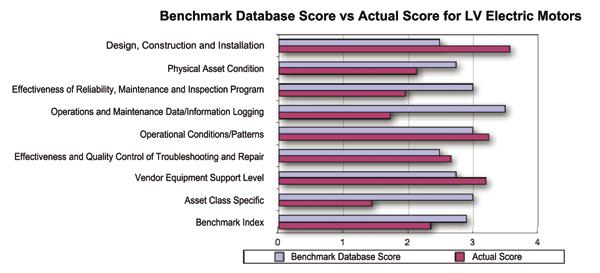
Figure 4 shows that the score of the LV motors was below the benchmarking level after inputting the non-field and field data into the standard assessment questionnaire. Therefore, there were gaps in certain areas that will be identified for improvement for this electrical asset. As shown in Figure 5, the output result was tabulated in the plotted histogram bar chart to indicate how far the gap was against the benchmark level.
From time to time, the master benchmark database score will be updated after each audit assignment performed by
an assessor if he/she has seen the best performer plant from the audit site. Until now, the current master benchmark database has six data reference points since the benchmark tool was introduced at the end of 2008. The first data point was entered in February 2009 and the benchmark database is updated once a new assignment has been engaged.
2) Benchmarking report
The short and precise benchmarking report will be prepared with the best practice recommendation to close the identified gap areas after careful consideration of all the important facts. In addition to that, an overall electrical asset management strategies roadmap will be prepared for the consideration of the business organisation which is recommended to be incorporated into their asset management planning strategies in the future. From the benchmarking report, a final exit keynote presentation will be prepared for the top management, detailing the findings and also way forward to improve electrical asset care management in the future.
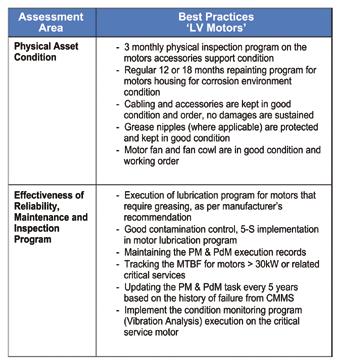
Figure 4 exhibits some parts of the LV electric motor best practice from the benchmark database library as a reference.
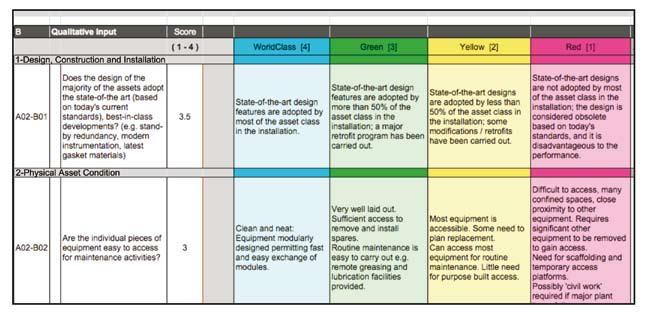
Figure 3: Template of the ERM benchmarking tool
Figure 4: Output of the Electrical Reliability Maintenance (ERM) benchmarking tool
SuMMarY
This case study has demonstrated the benchmarking assessment benefits for electrical asset care. It has met the customer management objective through this benchmarking study. The identified weaknesses and strengths focus asset area for the electrical asset class for certain elements have been captured in this assessment. As a result, this benchmarking assessment has succeeded in convincing the top management to adopt a culture of change towards its electrical asset and in managing the reliability and maintenance organisation by tapping into world class leading companies best practices in electrical asset management.
CONCLuSION
The benchmarking assessment tool will indeed bring great benefits to an organisation if the benchmarking study is properly executed with a defined objective that is set by the external specialist consultant and customers. By knowing how to use the results of the benchmarking study to create a management of change towards the electrical asset and understanding the electrical asset management organisation behaviour, it will produce great results from the outcome of the benchmarking study.
The beauty of the ERM benchmarking tool is in its ability to identify the reliability and maintenance best practice gap, and prepare an effective execution asset management strategies roadmap for the electrical asset in order to extend the life cycle service (LCS) of the electrical asset. The final conclusion is that this benchmarking study can enhance the elec-trical asset in a plant to operate in high dependability condition and also alleviate the liability risk in the asset care which can affect business sustainability operation and corporate image. n
reFereNCe:
[1] ISO 14224-2006: Petroleum, petrochemical and natural gas industries — Collection and exchange of reliability and maintenance data for equipment
The author is a freelance Principal Consultant who is operating EeSolution Engineering, which specialises in electrical reliability principle, modern solution of maintenance best practice, benchmarking assessment and electrical energy management and optimisation.
Copyright Disclaimer:
All text, images, graphics and other materials presented in this paper are subject to the copyright and other intellectual property rights of EeSolution Engineering unless stated otherwise. Whilst every care has been taken to ensure that this technical presentation material is up-to-date and as accurate as possible, EeSolution Engineering does not take any responsibility for any errors or omissions contained herein. Furthermore, responsibility for any loss, damage or distress resulting from adherence to any advice, suggestions or recommendations made available through this presentation, howsoever caused, is equally disclaimed by EeSolution Engineering
Figure 6: Partial literature of best practice of LV electric motor in benchmark database
Figure 5: Histogram bar chart representing the LV electrical motor asset class
Innovation tools for lean Practices (Part 1)
Note: This article is the first of two parts. Part two of the article would be published in the March 2011 issue.
1. IntroductIon
The principle of lean production is to create value (product or service) according to customer need and which the customer is willing to pay for it. All forms of wastes like material, delay time, human effort, equipment or space which do not add value must be continuously reduced and eliminated. Only the right resource with the right amount is required. Successful attainment of this objective will bring about speed and reduction in cost to enhance the business competitiveness of an organisation.
According to Simon and Zokaei (2005), the success of lean production is formed from the combination of practices, policies and philosophies, commonly known as 3P which is summarised in Table 1.
Lean practices represent the practical techniques or tools, capable of streamlining the value stream and moving it closer to achieving lean principle. There are varieties of innovation tools with each having the specific ways to tackle non value added activities. Therefore Allen, Robison and Stewart (2001), suggested that selecting and systematically implementing the right innovation tool, can and will bring an organisation to becoming lean. Brief explanations of the popularly used tools are included in the following sections.
Table 1: 3P – Lean practices, policies and philosophies (Simon and Zokaei, 2005)
lean Practices (Tools / Innovation)
lean Policies
lean Philosophies
2. 5S
- 5S
- Single Minute Exchange of Die (SMED)
- Standardised Work
- Kanban (visual signal)
- Cellular Manufacturing
- Total Preventive Maintenance (TPM)
- Enhanced problem solving ability of employee 5 Why
- Enhance employee participation (Small Group Activity – SGA)
- Long term relationship with customer
- Cooperation and transparency across the supply chain
- Visual management and control
- Waste elimination
- Continuous incremental improvement (Kaizen)
- Striving for perfection
5S is a methodology to transform and maintain a work environment that supports lean implementation. It is also a methodology that promotes a culture of order and efficiency in the workplace. Better organised workplace can speed up task, avoid unnecessary delay and improve safety to worker
by Ir. Oh Seong Por
as well as product quality. The term 5S is derived from the five Japanese characters that represent the vital elements, necessary to drive the transformation in the workplace.
i) Sort (Seiri) means to clearly distinguish between the necessary and the unnecessary, to make the hard decisions and to implement stratification management (based on level of importance) to get rid of the unnecessary. It requires the identification as well as prioritisation of what is needed to perform a particular operation or task. All other unnecessary items like materials, machines, tools etc are to be removed out from workplace
ii) Set (Seiton) means to neatly arrange the necessary items and create the right places for each item so that they can be retrieved for use in a hurry. It is a way of eliminating the need to search for item, a kind of non value adding task. The arrangement of item is based on the frequency of use and search elimination. In addition, visual aids such as location lines, label makings and signage are applied for easy identification thus averting the time to search.
iii) Shine (Seiso) means to perform regular cleaning and inspection of equipments, tools and work places. Fundamental cleaning approach is from top to bottom and from inside to outside. Cleaning indirectly brings employees nearer to equipments, create awareness to the workplace surroundings and, promote early detection of potential problems and better quality since contaminant is removed.
iv) Standardise (Seiketsu) means to establish visual management method that allows employees to continually and repeatedly maintaining the conditions of the earlier stages: sort, set and shine.
v) Sustain (Shitsuke) means to sustain the gains and to create a culture for continuous improvement. The main emphasis is to develop the right procedures conduct training and compliance follow up through planned audit exercise. The goal is to instill discipline and develop the right habit to effectively control all the 5S stages. Also encourage total participation of employees to contribute improvement ideas.
3. SIngle MInute exchange of dIe (SMed)
Almost all manufacturing lines require setup time for changeover activity to re-configure machine and process settings before another product can be made. Each time
changeover is performed either machines or material inputs or both must be stopped temporarily. This discontinues the flow of piece by piece, one of the conditions essential for achieving lean production goal. The longer the setup time, the higher the losses are incurred in term of production opportunity. Therefore, the endeavor to reduce setup time either through reducing the number of setup or improving setup procedure, is an important approach to becoming lean.
Shingo (1985) who has over many years working as consultant to Toyota has developed a methodology to reduce setup time which is known as Single Minute Exchange of Die or SMED. The meaning of SMED is to complete changeover within a single digit minute or less than 10 minutes. There are four stages to reduce setup according to SMED approach.
Stage # 1: distinguish Internal and external Setup
External setup is the changeover activity, which can be performed even when machine or main operation line is running while internal setup can only be carry out when machine or main process is completely stopped. Methods to separate these two types of setups are:
i) checklist that records every setup procedures, ii) work sampling study
iii) interviewing shop floor members who are directly involve in changeover tasks in order to listen to their feedback or suggestions.
iv) videotaping setup activity so that man and machine motion can be thoroughly investigated.
The main target is to identify the time consuming internal setups from the entire changeover activities so that the right improvements can be developed.
Stage # 2: convert Internal Setup to external Set-up
Reexamine all internal setups to determine if any of them can be converted to external setup. For example early preparation of parts, preassembly or preadjustment of components which are needed for changeover and off line preliminary processing before transferring to the main line.
Stage # 3: Improve all aspects of Set-up operation
The emphasis is to decrease internal setup time. This may be realised through simplifying and standardising procedures on existing machine. Setup procedures must be simplified enough so that eventually every machine operators are capable to conduct changeover. In addition, by modifying the parts, joining method to reduce the assembling and disassembling time can greatly drive down internal setup. For example changing of bolt fastening to clamp gripping, replacing normal flat washer to U-shaped washer, using shorter bolt, etc. To speed up adjustment to parts, special jig, fixture or reference guiding tools are also widely used.
Stage # 4: abolish Set-up
One way to eliminate setup is to use the same, standardised parts and components for different products. The fewer the differences between things to be produced, the faster the changeover can become. Application of group technology and production by part families can also cut down setup time since similar geometry parts can be processed using the similar machine setting conditions. The advanced development of computer programming to control machines such as program logic control or PLC has enhanced the flexibility of machine to respond quickly to setting changes for handling
different types of products. The success has created flexible manufacturing system which is capable to process different products simultaneously involving minimal readjustment. As such internal setup can be conveniently abolished.
4. cellular ManufacturIng
Cellular manufacturing is a concept of performing all of the necessary operations to make a part, component, subassembly or finished product in a work cell. Cellular manufacturing exhibits the pull production concept which is one of the important principles of lean thinking. According to Schonberger (2008), a largescale pull production process can be created by stringing together many work cells.
Each work cell produces specific parts, components and subassemblies which are assembled into the final finished product later at the final process. Since each work cell is capable of producing a variety of parts or components, the overall production system eventually is capable of making multi products.
The primary objectives of implementing cellular manufacturing are to reduce setup times (by using part family tooling and sequence) and flow time (by reducing setup time, motion time, waiting time, delay time and using small lot production). Through these, unnecessary inventory can be avoided and production system could response quickly to market demand which actually fits well with lean principle. Another unique benefit of cellular manufacturing as argued by Davis (1999) is that it represents sociological unit conducive to develop strong teamwork among cell fellow workers. This means that worker motivation factor for process improvement can be naturally developed in the work cell.
The basic building blocks of a work cell consist of workstations (places where operations are performed), machines, workers and material transferring system. In a work cell, these items are located as near as possible and in proper routing sequence for a product or product family. The reasons are to reduce human and material movement as well as allowing smooth flow of processing activities. Basically there are two types of work cell, namely assembly cell and machining cell. Generally the operation tasks in an assembly cell are difficult or costly to automate and as such the tasks are performed manually. In contrast, machining cell involves work tasks which are usually simpler and more easily automated. Designing the work cell capacity is
important so the pull production system is flexible enough to fulfill varying demands without creating unnecessary stock. Factors which determine work cell capacity are number of workers, number of machines, skills of workers and flexibility of material transferring systems.
Cellular manufacturing concept is said to be able to contribute to quality improvement through the active involvement of worker (Davis, 1999). Normally workers are trained to handle multi tasks essential to transform work piece to the finished good stage or semi complete stage. This means workers are responsible to build parts, components or finished products. Psychologically, the workers are indirectly forced to take the ownership to ensure that parts, components or finished products made by them are acceptable. No item identified at a work station as defective is allowed to proceed to the next station. It empowers the workers to make quality product.
Implementing cellular manufacturing not only involves shifting machines to a new layout (grouping into cell) and drafting new procedures but also changes to the shop floor organisation. Direct workers who are operating inside a work cell are more empowered to handle productivity and quality while the roles of supervisors are focused more on supporting. Supporting roles can be the forms of providing training to work cell operator, providing on demand technical guidance and performing tasks that require higher level expertise. This opposes the division of labor concept, introduced by Adam Smith in which the entire operations needed to make a product are divided into smaller division tasks or smaller work elements with each one handle by specific workers. In short, workers are trained to perform only tasks assigned to them repeatedly. Workers are expected to handle same tasks as instructed by supervisors. This division of task and labor force has increased the efficiency for large volume production and has been widely applied for mass assembly production. However it kills the creativity of worker to contribute idea of improvement since every worker has been trained to do specific task repeatedly. It is the stereotype that requires workers to leave their brains at the factory gate. Just follow the given instructions and perform the repeating task. No empowerment to worker to involve in improvement activity. In the principle of lean thinking, it is considered as the waste of human creativity and talent. n
Happiness cannot come from without. It must come from within. It is not what we see and touch or that which others do for us which makes us happy; it is that which we think and feel and do, first for the other fellow and then for ourselves.
Helen Keller
assessment Method for Course Outcome and Program Outcome in Outcome Based education
an accredited engineering program is judged as providing satisfactory preparation of graduates, to initially enter the profession as registered engineers and then develop their skills subsequently to the level of professional engineers (Javed et. al. 2009). The accreditation process is designed to publicly assure the competence of graduates, as well as the independence of the certification and credentials provided by the institutions of engineering education. “Program Outcomes are statements that describe what students are expected to know and able to perform or attain by the time of graduation. These relate to the skills, knowledge, and behaviour that students acquire through the programme” (EAC Manual 2007). From the EAC Manual, students of an engineering programme are expected to attain the following 10 program outcomes:
i) ability to acquire and apply knowledge of science and engineering fundamentals;
ii) acquired in-depth technical competence in a specific engineering discipline;
iii) ability to undertake problem identification, formulation and solution;
iv) ability to utilise systems approach to design and evaluate operational performance;
v) understanding of the principles of design for sustainable development;
vi) understanding of professional and ethical responsibilities and commitment to them;
vii) ability to communicate effectively, not only with engineers but also with the community at large;
viii) ability to function effectively as an individual and in a group with the capacity to be a leader or manager;
ix) understanding of the social, cultural, global and environmental responsibilities of a professional engineer; and
x) recognising the need to undertake lifelong learning, and possessing/acquiring the capacity to do so.
1. PraCtICaBLe aSSeSSMent In enGIneerInG PrOGraM
Assessment in Outcome Based Education (OBE) can be done in many different ways by the respective institutions to reflect the process of Continuous Quality Improvement (CQI). Since the concept of OBE is relatively new, some may find that the assessment for OBE is rather cumbersome and will take a lot of energy to keep track of students for every course at any given time. This has to be done continuously
by Ir. Zamri bin Mohamed
for as long as the program is being accredited by the respective Engineering Accreditation Council as approved by the Washington Accord.
The guide by the accreditation is rather insufficient for any program owner to be confident of their assessment documentation. However, a method can be used to measure the achievement of course outcome in relation to the program outcome, which should meet the program’s objectives. The achievement of the program outcome needs to be measured so that continuous improvement can be done to upgrade the quality of engineering graduates.
There are two levels of assessment measurement; one is at the course level and the other is at the cohort level. For every course, the course attainment is recorded and this becomes the input for the cohort level assessment which takes into account all the courses taken by each cohort in any given semester. To ensure that the attainment is recorded, the course instructor needs to produce several forms and this will become the base for the next time when improvement needs to be done. The form will include the marks distribution and table for the course outcome attainment as well as table for the program outcome attainment.
2. COurSe OutCOMe MaPPInG tO PrOGraM OutCOMe
Course Outcomes from Fluid Mechanics 1 are taken as samples to be analysed. There are five associated course outcomes as decided by the instructor. They are as follows:
CO1: Solve fluid statics based problems
CO2: Solve fluid in motion problems
CO3: Solve fluid friction in pipes problems
CO4: Solve fluid flow measurement problems
CO5: Apply the concept of dimensional analysis
All of this Course Outcomes shall have linkage to Program Outcomes in such a way that the strongest emphasis has the value of 3, whereas the least emphasis is rated 1 (Table 1).
3. COurSe OutCOMe attaInMent
For the detail assessment division, Table 2 indicates the subdivision of each question or assignment that relates to the specific COs. As shown in the table, there are four questions for Test 1 (T1); Q1 and Q2 are to assess CO1, while Q3 and Q4 are for CO2 assessment. A similar case for Test 2 (T2) apply, two are designated to measure CO3 and another two for assessing CO4. In addition, CO1 to CO5 are also measured using assignments (Asgn) and Final Exam (FE).
The column ‘% Total’ contains ‘a’, ‘b’, ‘c’, ‘d’, ‘e’ which is the sum of each row normalised to 100. The column ‘result’ is to indicate whether each CO is achieved using value from column ‘% Total’. The last column represents ‘Yes’ or ‘No’.
score. Q1 from Test 1 may only contribute 3% towards the overall final score. Q2 from Test 1 might only contribute 2%, Assignments 1 and 2 give another 4%, and lastly Q1 of Final Exam constitutes 5%. So altogether, the total mark that justifies CO1 is only 14% from the final overall score. To be
To measure the attainment for each CO, it is imperative to decide on the appropriate value of the mark that will indicate that the CO has been achieved. For example, an average number of 50 out of 100 may be chosen as the minimum level of mark needed to be obtained by students. If that is so,
(Q1 from Test 1) + (Q2 from Test 1) + (A1 + A2) + (Q1 from Final Exam) ≥ 50%, then CO1 has been achieved. To best visualise the arithmetic, it is easier to take each mark as the portion of mark towards the final course
able to say that CO1 has been achieved for any student, they need to get at least 7% so that it counts as 50% of the total possible score for CO1. A similar assessment needs to be done on other COs so that all COs are evaluated.
4. PrOGraM OutCOMe attaInMent
Next, the achievement of the COs needs to be linked to the achievement of the POs or Program Outcome. To do this, value from Table 1 is used to calculate the score for PO. Table 4 shows the linkage from the COs to the POs. The ‘CO Result’ column shown below is an example of CO attainment. For this case, CO1, CO3 and CO4 are set as achieved whereas CO2 and CO5 are set as not achieved. From Table 4, for each of the CO that is achieved (Y), the weightage in the matrix is calculated towards the value of PO Attainment. From the example in Table 4, CO1, CO3 and CO4 is met, therefore the weightage is calculated from the overall sum of the weightage for PO1. The bolded weightage represents the CO which has been achieved.
1Sudoku
Centerpiece "2'
by Mr. Lim teck Guan
About the puzzle:
In this Sudoku variant, only 1 number is given as clue, thus the name 1Sudoku. The rest of the clues are given in the numbered cages (the dotted frame encompassing 2 or more squares). You are to search for the right combinations to fit the total for the cages and end up with a Sudoku Grid, the 9 by 9 composite of squares where there is no repeat of the number 1 to 9 in every Row, Column or Block.
Fill in the remaining 80 squares with single digits 1-9 such that there is no repeat of the digit in every Row, Column and Block. The number at the top left hand corner of the dotted cage indicates the total for the digits that the cage encompasses.
For tips on solving, visit www.1sudoku.com.my Twin Tree Publishing Answer is in the following pages of this edition.
x = 60% (Multiply by 100 to get the percentage of PO Attainment)
A similar calculation is done on PO5 and PO7. The calculated PO Attainment is the partial contribution of one course towards the Program Outcomes. In any case, all of the courses need to be evaluated the same way progressively. After getting the PO Attainment for all of the courses in the same semester, one can use statistical method to determine the overall PO Attainment contribution for one semester. An average value may be used to get the distribution of the PO Attainment for all courses in one semester. Later, towards the completion of the 4-year program, the program owner could get the overall PO Attainment for all semesters. Only this final PO Attainment (all semesters) can be considered as the Program Outcomes measurement for any cohort or entry.
5. COnCLuSIOn
By taking the OBE concept, one should at all times take measurement of the cohort progress. Any intervention can be done to improve the CO Attainment as well as the PO Attainment before the cohort finishes the program. After each cohort has completed the program, the overall PO Attainment can be used as a benchmark for the next cohort. In any case, the value or numbers from the PO Attainment is just a number and it may bring meaning to some standard or it may be meaningless. Depending on what measures have been carried out to keep track of the process and quality, PO measurement can ensure that the students produced have been included in the continuous quality improvement process and therefore, by the very meaning of OBE, engineering students should be imrpoving from time to time. n
reFerenCeS:
[1] Engineering Programme Accreditation Manual 2007: Board of Engineers Malaysia (BEM), pp. 2-3: Appendix G.
[2] D. Andrich, “A Framework Relating Outcomes Based Education and the Taxonomy of Educational Objectives”, Studies in Educational Evaluation 28 (2002) pp.51.
[3] Javed A. Memon, R. Esra and B. S. Chowdhry, “Achievements, outcomes and proposal for global accreditation of engineering education in developing countries”, Proceeding of Social and Behavioral Sciences 1 (2009) 2557–2561
[4] Andrich, D. (in press). Implications and applications by modern test theory in the context of Outcome Based Education. Studies in Educational Evaluation.
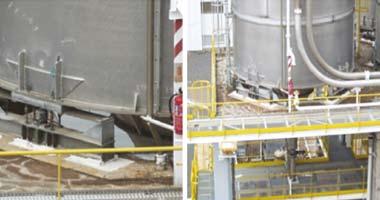
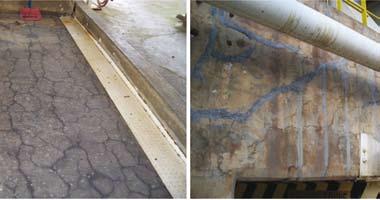
Civil and structural asset Management in Oil and Gas Plants
by Ir. Mohd. Nazri Mustafa
this article describes the procedure to manage civil and structural assets in oil and gas plants. The main objective of having an effective asset management program is to avoid unplanned shutdown due to the sudden failure of civil and structural facilities or unfit facilities which pose possible safety hazards.
The current status of these facilities needs to be recorded and continuously monitored. Cracks propagation needs to be studied properly to establish the actual cause of the problem. There are cases where cracks were repaired repetitively without adequately analysing its cause. By establishing the pattern of cracks over time, the cause of the cracks could be pinpointed.
The following program as presented in this article is in line with the concept of Preventive Maintenance as an effort to avoid unplanned lost of production opportunity which could affect a company’s financial capability.
As Preventive Maintenance is based on the statistical/ historical data of meantime to failure, the plant owner could predict, based on the pattern of defects, the best and most economical time to repair, strengthen or replace the structures or facilities to avoid serious defects that could hamper the plant’s operation.
CiViL and struCturaL assets:
Civil and structural assets in oil and gas plants can be categorised into the following:
• Structures which include all major and minor structures (R.C. and steel) supporting all types of equipment and piping. This category includes superstructures as well as substructures for both onshore and marine structures.
• Buildings which include process and non-process buildings. Some of the process buildings are designed as blast resistant buildings based on their function and location, e.g. control building.
• Shelters which include all portal frames and steel shelters.
• Surface and underground drainage system.
• Other miscellaneous civil works which include platforms, road, fire proofing, etc.
In line with the design life of an oil and gas plant which is between 20 to 30 years, civil and structural assets are also designed to fulfil the target design life. Corrosion rate and protection, concrete cover, carbonation and chloride intrusion rate are among the important items that need to be considered.
asset ManaGeMent PrOCedure:
In order to effectively manage an asset, the changes in its characteristic and properties over time should be fully understood. In normal circumstances, an asset management procedure will first be established by the plant owner. The document will provide guidelines for the following civil and structural items:
• The list of possible defects for concrete and steel materials.
• Categorisation of defects, e.g. cracks (major, minor, structural, non-structural, active, non-active). Other defects such as the corrosion of steel members shall not be ignored and shall be described appropriately. The category of corrosion (severe, medium and mild) and the type of corrosion (uniform, galvanic, crevice, stress and erosion) shall be recorded in order to accurately identify the cause of such corrosion.
• List of DT and NDT for concrete and steel (for detailed inspection). The common DT and NDT for concrete and steel such as In-situ Ultrasonic Pulse Velocity Measurement, Covermeter Measurement, Ultrasonic Test, etc, shall be clearly listed in the inspection form to facilitate further investigation.
• Visual inspection forms for all civil and structural assets. The inspection forms will record all visible defects, the need for DT and NDT, photos of defects and recommendation by the inspector and endorsed by the engineer in-charge.
The prioritised items of inspection and frequency of inspection will depend on the criticality of the particular civil and structural assets. The assets are normally ranked high or low priority based on the following criteria:
High priority assets:
• Foundations and structures supporting major equipment and piping of which shutdown will result in significant operation loss.
• Blast resistant control building and substation.
• Major underground services (drainage, fire water, etc) of which non-functional will give rise to HSE issues.
Low priority assets:
• Miscellaneous foundations and structures for less important equipment and piping.
• Miscellaneous platforms for access and maintenance.
• Surface drain, roads and paving.
• Miscellaneous shelters and buildings.
It is always recommended that plant owners adopt the Preventive Maintenance approach as opposed to Corrective and Reactive Maintenance. This will produce a safer working environment with a proper budget plan for repair work. In general, inspection frequency is divided into several categories:
• Immediate inspection (in the event of visible serious defects or following an exceptional event that could harm the integrity of the assets. An example of such a situation is when the structure is subject to fire which warrants immediate inspection).
• Short term inspection (once every 3-6 months).
• Medium term inspection (once every 1-5 years).
• Long term inspection (once every 10 years).
It is recommended to adopt the short term inspection for all civil and structural assets. A walk-through inspection with adequate engineering knowledge of structural behaviour and possible defects combined with the appropriate inspection forms will be sufficient to identify any anomaly on structures and other assets. Structural settlement, uplifting, cracks, spall, corrosion, etc, could be detected by the naked eye. If needed, further detailed inspection to check structural tilting, deflection, sagging, settlement, etc, could be performed. Survey equipment is commonly used to measure the verticality of a tall structure, deflection of horizontal members, foundation settlement, etc. Levelling tools are also used to monitor structural verticality and horizontal movement. Demec Gauges are used to monitor cracks movement and propagation, while vibration devices are used to measure acceleration, velocity and displacement due to vibration.
The record of such periodic inspection will be kept in the database to form an inspection history for future reference.
Structural Integrity Assessment is one aspect of Asset Management. Structural Integrity Assessment is normally performed due to the following reasons:
• Change of use of the structures
• Extension of structural design life
• Presence of apparent defects
• Change of applied loads
• Structural modifications
• Structural damage due to fire, blast, impact, etc
Structural Integrity Assessment involves structural analysis and design review, and the result will be in the form of Structural Utilisation Ratio, Reserved Strength Ratio and Remnant Life Assessment. Structural Integrity Assessment is important in order to plan the structural strengthening and modification for future expansion.
Based on the results of the visual inspection, analysis of the DT and NDT result and Structural Integrity Assessment, the prioritised plan and budget could be made on the items based on their criticality ranking:
• Category A : Immediate replacement needed
• Category B : Major repair and strengthening required
• Category C : Minor (but significant) repair required
• Category D : Routine maintenance required
• Category E : Extensive/specialist study required
The categories are shown in the asset lifecycle in Figure 1. With the aforementioned categories, the assets in oil and gas plants could be effectively managed in line with the Preventive Maintenance concept.
reaL Case eXaMPLes OF asset ManaGeMent issues
Materials deterioration though gradual, but if left unattended, could pose serious problems to plant operation. A real case example is the development and propagation of major cracks due to alkali-silica reaction which has placed an equipment support structure at one of the plants under the high risk category of structural failure (refer Figure 2). Continuous repair, strengthening, monitoring and analysis needs to be done to ensure the structure could last the design life as originally intended. The economics between the total reconstruction of the structure and continuous repair of cracks and structural strengthening was studied. Based on the designed life of the plant, severity of defects and rate of cracks propagation, it was decided that the structure was able to perform its function provided all defects were continuously monitored and repaired accordingly. Structural strengthening was provided in line with the recommendation based on structural modelling and analysis.
Structural defects could also be caused when the applied loads are greater than designed. In such a case, the root cause of the problem shall be rectified prior to the rectification of structural defects. This relates to another real case example whereby a reinforced concrete structure supporting major equipment has major and minor cracks due to excessive equipment vibration (refer Figure 3). Modifications on the equipment to reduce the vibration amplitudes and avoid resonance were given the highest priority. Proper vibration monitoring, structural modelling and analysis was
done and, based on the result, the source of the cracks was due to excessive vibration during start-up and shutdown. During normal operation, vibration was in normal mode. New cracks re-appeared over repaired cracks after some time which indicated that the problem remained even though the cracks had been repaired. When equipment vibration was reduced by modifying the inlet and outlet details, the cracks propagation stopped.
The cost profile of periodic repair to ensure structural safety was calculated for the next 20 to 30 years in line with the extended design life as decided by the plant owner. The cost could be as high as RM50-RM100 million depending on the amount of repair and strengthening work, and unit shutdown involved.
COnCLusiOn
Having an effective asset management program will definitely reduce the overall cost of plant operation by avoiding unplanned shutdown due to unfit facilities. It is always the objective of any oil and gas plant to ensure that safety is upheld and repair is done before it is too late. Failure to exercise proper asset management will result in money and time lost due to unnecessary repair, strengthening and shutdown. It is also important for the plant owner to adopt an effective asset management policy in view that not all defects are visible. Invisible defects such as carbonation and chloride intrusion could cause serious damage to the structure and compromise its overall integrity. Failure to anticipate potential defect could result in serious risk of failure. n
Figure 2: Cracks on structures supporting equipment.
Figure 3: Cracks due to excessive vibration of equipment.
Bringing aPI-u training to Malaysia Seminar
On 12 July 2010, a seminar entitled “Bringing API-U to Malaysia” was conducted by Frontium Energy Sdn Bhd together with Equity Engineering Group Inc (E2G), a certified American Petroleum Institute (API) training provider. The seminar, conducted at the Kuala Lumpur Convention Centre (KLCC), was officiated by Dato’ Ir. Dr Johari Basri, Director General of DOSH, Ministry of Human Resources.
Representatives from DOSH, SIRIM, IEM, UKM as well as E2G President and CEO, Mr. David Osage, presented a paper during the seminar. IEM was represented by Ir. Al-Khairi Mohd Daud, Chairman of the Oil, Gas and Mining Technical Division, who delivered a presentation on “Development of Professional Engineers to Support the Oil and Gas Industry.”
Most of the topics in the seminar revolved around the technology and requirement for equipment Risk Based Inspection and Fitness for Service especially for the oil and gas industries and petrochemical plants. To complement the technical details, Ir. Al-Khairi brought up the subject on the need for professional engineers in the oil and gas industries. He reminded the audience of the registration of the Engineers Acts 1967 as the first basis of engineering practice in Malaysia in which many engineers in the oil and gas industries do not comply with even though it is a statutory requirement.
Ir. Al-Khairi stated that the BEM and IEM, as the bodies that qualify professional engineers, not only look at engineering technical competencies, but also at the maturity and ethical aspect of engineering practices as well as one’s ability to lead and communicate effectively within an organisation. The non-technical aspects can only be evaluated after the engineers have accumulated sufficient practical experience in the industry.
He then stressed that the most important aspect of professional engineers is abiding by the engineers’ code of conduct, a requirement of which unregistered engineers may not be aware of. Moreover, professional engineers are required to upgrade their knowledge by continuous learning as mandated by the CPD requirement. Thus trainings such as the API certification program will support the professionalism and development of technical expertise by engineers.
Ir. Al-Khairi then explained that the oil and gas industry is one of high risk where combustible and explosive materials are present and where operations are sometimes
carried out in dangerous and hostile environments. Equipment failure can have a major impact on human life as well as to the environment such as the explosion of the deep water well in the Gulf of Mexico recently. Having professional engineers in the industry will promote ethical responsibility and the ability to communicate effectively with other disciplines which will result in stronger trust in the industry as well as promote the engineering discipline itself.
Thus it is for the benefit of a company to have professional engineers in key positions to portray an image of professionalism, integrity and high value to protect society as well as the national interest. As for individual engineers, being a professional will allow easier cross boundary mobility as well as better employability. In his closing remark, Ir. Al-Khairi implored oil and gas industry players to support the registration of professional engineers to ensure ethical and professionalism in their service and activities. n
by Ir. Al-Khairi bin Mohd. Daud
OIl, GaS and MInInG technIcal dIvISIOn
Dato' Ir. Dr Johari officiating the seminar.
Ir. Al-Khairi delivering his presentation.
technical Visit to David Brown (thailand)
by Ir. Kumar Subramaniam Chairman, AFETD
a technical visit was conducted by three engineers to David Brown (DB), a gear reducer unit assembly plant in Bangkok, Thailand on 13 and 14 August 2010.
The visit was made to review the plant facilities, to cross check on the quality of gear units being produced and to have technical discussion with the Manufacturing Division head on type and models being widely used in the Palm Oil Industry. Such gear reducing units are being widely used in the industry, which include the Palm Oil Mills, the Kernel Crushing Plants and the CPO (Crude Palm Oil) refineries.
The visit started with the introduction presentation by Mr. Gareth Thomas, the Manufacturing Manager, followed by visit to the Assembly Plant, the Tools Division, the QC (Quality Control) Department, the Design Section and finally the Packing and Delivery section.
David Brown commenced business in 1860 as a general pattern maker and the core business at that time was the production of patterns for the manufacture of cast gears. They have now been at the forefront of the engineering industry for 150 years and is famously known for their DB series for Austin F1 Race team. In 1997, David Brown (Thailand) acquired the Powauto factory which was built in 1992 by Powauto. The plant in Thailand is a world class manufacturer and supplier of geared motors and it is also capable of sub-contracting jobs on machining and assembly of industrial components. David Brown Radicon
supplies products and services for a host of industries, such as Cement, Food and Beverage, Material Handling, Mining, Oil and Gas, Power Generation, Quarrying and Water Treatment Plant. They offer a wide range of repair services and they can boast many years of experience repairing transmissions in numerous industries that were demanding and highly critical technically. Their current repair expertise can be applied to the simplest transmissions and to the most complex drive arrangements of all makes and types. In addition to repairing gears and transmission products, David Brown Radicon offers a full range of technical services from identifying the root cause of any production problems to recommending the optimum solution.
The technical discussion held was centred on common production problems, down time due to drive system failures, maintenance of conveyors and elevators and the suitability of using other type of gear units in the industry, as replacement units. Stocking of required common spare parts in the workshop, to ensure low down time and optimum productions in any manufacturing plant, was also discussed.
The visit has provided the engineers valuable experience and exposure on how Gear units are being assembled, and on the design and operational aspects involved in the productions. The engineers were grateful to DB Bangkok Plant operators for making the visit most fruitful. n
Random QC in progress
Technical explanations by Mr. Gareth Thomas Assembly in progress
Ashley Hodgeson
Half Day Workshop on “How to Design Water recovery Network for a Process Plant”
a technical talk entitled “How to Design Water Recovery Network for a Process Plant” was organised by the Chemical Engineering Technical Division (CETD) on 3 October 2009 at the C&S Lecture Room of Wisma IEM. The talk was conducted by Associate Professor Ir. Dr Dominic Foo, as a follow up on a technical talk on a similar topic delivered in August 2009. A total of 18 members attended the workshop.
The overall workshop was divided into four sessions where participants learnt different techniques for designing a maximum water recovery network. In Session 1, the speaker introduced to the participants the various domestic and industrial water-consuming processes. He then presented the water pinch analysis technique as the main tool to be learnt during the workshop.
The speaker then coached the participants in plotting a graphical targeting tool, i.e. material recovery pinch
diagram, to identify the maximum water recovery potential in a process plant. The technique identifies the minimum amount of fresh water needed as well as the minimum amount of wastewater that can be generated by the process prior to the detailed network design.
After a short tea break, the speaker resumed the workshop with Session 2, where he presented the water cascade analysis, an algebraic technique to determine the minimum flowrates. This was followed by Session 3, where a systematic procedure known as the nearest neighbour algorithm is used to design the water network that achieves the identified water targets.
The appropriate use of a water regeneration unit (e.g. filter, ion exchangers, etc.) is explained in the final session, before some industrial case studies were shown. The workshop concluded at 1.15 p.m. n
life rewards effort
Successful people aren’t born that way. They become successful by establishing the habit of doing things unsuccessful people don’t like to do. The successful people don’t always like these things themselves; they just get on and do them.
William M. Thackeray
by Ir. Hj. Tunai Shamsidi bin Ahmad
CHemiCal eNgiNeeriNg teCHNiCal DivisioN
two-day course on earthquake Ground Motions and responses of reinforced concrete Buildings
by Ir. Ong Sang Woh
the two-day course on “Earthquake Ground Motions and Responses of Reinforced Concrete Buildings” was organised by the Civil and Structural Engineering Technical Division of IEM, in collaboration with the IEM Technical Committee on Earthquake. The event was held on 22-23 June 2010 at Armada Hotel, Petaling Jaya, and was attended by 87 participants.
Professor Dr Nelson Lam from the University of Melbourne, Australia, is an internationally recognised expert in earthquake engineering and structural dynamics, and served as a member of the subcommittee for developing the new standard for Earthquake Actions in Australia. He has done extensive research and is active in consultancy work in this field and has published 200 technical articles in earthquake engineering and structural dynamics in journals worldwide.
Dr Hing-Ho Tsang, currently a lecturer at the University of Hong Kong, is also actively involved in the field of earthquake engineering and has published 60 technical articles. He has given several lectures internationally, notably the keynote speech at the Australian Earthquake Engineering Conference in 2008.
The first speaker, Professor Dr Lam, began by presenting an overview on the occurrence of earthquakes, the source of an earthquake and its relation to ground motion and the path of propagation of seismic waves with reference to attenuation modelling. The fundamentals of seismic activity, the use of tectonic maps and seismic hazard maps and earthquake modelling was explained in detail. This was followed by Dr Tsang’s lecture on Seismic Hazard Analysis for regions of low to moderate seismicity. The major topics covered on the first day of the course were:
earthquake Basics, Ground Motion ProPerties and resPonse sPectra
Earthquakes occur mainly due to high stresses in the Earth’s crust (caused by tectonic activity) that results in the rupture of the crust at the weakened planes along fault lines. The fault rupture mechanism can be caused by either vertical movement in the form of normal or thrust faulting, and/or horizontal movement in the form of transcurrent or transform faulting. The different earthquake magnitude scales such as the Richter (local) magnitude, surface wave and moment magnitudes and the ground motion characteristics in terms of mass, time, velocity and displacement (fault length) were elaborated.
The damping mechanism and elastic response behaviour of structures were presented using the single degree of freedom
systems. The peak ground acceleration (PGA), peak ground velocity (PGV) and peak ground displacement (PGD) together with the pulse wave duration, effects of damping and the acceleration time-history affecting the response of the structure were emphasised. Finally, the use of typical earthquake response spectra diagrams and its co-relation with PGA, PGV and PGD (shown in tri-partite format) and the site soil effects were established.
introduction to attenuation ModellinG
The different types of attenuation models, namely, empirical, semi-theoretical, intensity and stochastic models and the effect of Source (magnitude), Path (distance and attenuation) and Site Conditions (rock, soil, etc) on the Structure (hazard and prediction for the intensity of ground shaking) were discussed. The attributes, advantages and disadvantages of these different types of attenuation models proposed by various researchers and the Modified Mercalli Intensity (MMI) scale of seismic intensity were highlighted.
seisMic hazard analysis (sha) for reGions of low-Moderate seisMicity
Two basic methods (deterministic and probabilistic approaches) for SHA, their procedures of application and the merits of using the different alternative methods for SHA by various researchers were demonstrated with the aid of case studies from different countries. The lessons from low-probability large-consequence earthquakes based on known damage to properties, recorded injuries and number of deaths, worst-case scenarios, great earthquake uncertainties at large magnitude range and the benchmark return period for zoning maps using past records were documented.
coMPonent attenuation Model (level 1)
The background and basis for the development of the response spectrum for seismic design using the parameters of Acceleration, Velocity and Displacement to formulate the Component Attenuation Model (CAM) was elaborated in detail. The formulae of maximum Velocity and Displacement and its relation to the radius of 30km on hard rock, energy absorption along travel path, geometrical spread of energy, presence of rock crusts and soil sediments was introduced. The results computed using the formulae when compared with actual recorded data showed a good degree of conformity and were on the conservative side. The speaker has used
numerous examples for illustrating the CAM formulae, and tables and charts were also developed for ease of reference.
coMPonent attenuation Model (level 2)
Further demonstration of the CAM stochastic simulations of ground shaking was carried out to incorporate the sum of harmonics of different frequencies and amplitudes and, after the filtering process, the response spectra and ensemble averaging was achieved. Source modelling, path attenuation modelling and upper crustal modelling were introduced to enhance the CAM for real life applications. In addition, further development of the CAM was undertaken at the site and computations were carried out to check and verify the results obtained from differing models at numerous case studies within Australia, Hong Kong, Northern Iran, China, Taiwan and the Sumatran-Malaya regions.
A question and answer session was conducted before the end of the first day of the course. Professor Dr. Lam informed the course participants that 2.5% of gravitational acceleration was stipulated as the lateral seismic force to be catered for in Building Design for some countries. He mentioned that sufficient data needed to be obtained in order to use the probabilistic approach for SHA. Besides replying to questions from the audience, additional explanations were also given for peak ground acceleration.
On the second day of the course, Professor Dr Lam covered the following major topics:
analytical static Method for seisMic desiGn
The concept and procedures for the calculation of the elastic deflection in buildings, the Effective Displacement, the Effective Mass, the Effective Stiffness, the Effective Natural Period and the Performance Point were introduced. The use of approximate hand calculation procedures for building displacement of low-rise buildings and the construction of capacity diagrams for linear elastic systems were emphasised.
He also demonstrated the steps for estimating the response behaviour of reinforced concrete building structures to earthquake ground shaking and the determination of seismic displacement demand using the Acceleration-Displacement Response Spectrum (ADRS) diagram. This was also extended to cater for non-linear systems. All these computations were illustrated with actual examples.
disPlaceMent controlled Behaviour for aPPlication in low and Moderate seisMicity reGions
The use of Peak Displacement Demand (PDD) for the displacement controlled behaviour of structures and the use of a single pulse were explained. The relationship between the acceleration response spectrum, velocity response spectrum and displacement response spectrum diagrams and
the corresponding relationship formulae was explained using actual examples.
The analysis of the overturning stability of freestanding objects of varying heights and widths using the PDD diagram showed a linear relationship. Two case studies for the assessment of a historical structure and a soft-storey building using PDD were illustrated.
deforMation ModellinG of reinforced concrete (rc) sections
The concept of Effective Stiffness of RC sections was introduced together with the post yield stress-strain relationship between concrete and steel reinforcement. The modelling of RC sections in bending deformation, plastic hinge rotation and shear deformation modelling for uncracked and cracked concrete were explained and illustrated by spreadsheets (using an iterative process) for the different section types and arrangement of rebars. The shear deformation for cracked concrete was modelled using a truss analogy and the shear deformation was shown to be affected by the shortening of the struts, lengthening of stirrups and longitudinal reinforcement.
disPlaceMent caPacity of BuildinG structures
The deflection of a RC cantilever wall at yield and a coupled shear wall was analysed up to the limit of steel yielding. The ultimate post-yield displacement capacity of the RC cantilever wall (yield and plastic rotation), and the design and analysis of confined concrete was analysed. In addition, general recommendations for the confinement detailing of fully ductile RC elements to avoid the buckling of rebars were explained.
in closinG
Professor Dr Lam also shared his findings on the damage investigation (shown using photographs) caused by the Magnitude 5 earthquake in the Kalgoorlie-Boulder area of Western Australia. He highlighted his findings that small features such as short parapet walls and frames tended to fail and collapse, while large or tall structural features remained standing in that particular earthquake event. This gives credence to the displacement capacity concept in determining actual structural response.
During the question and answer session on the final day of the course, Professor Dr Lam explained his views on vertical acceleration, the use of research models, the use of geomorphology data, the push-pull effect on columns & stability of buildings using shear walls, the importance of ductile detailing for earthquake resisting structures and the effect of piled foundations on seismic design and buried underground water tanks.
Finally before the conclusion of the two-day course, a token of appreciation was presented to each of the speakers by Ir. MC Hee in his capacity as Vice-President of IEM, and also on behalf of the organisers. n
technical talk on “engineering Geology: three recent Case Studies”
by Ir. Chow Chee Meng
the technical talk given by Mr. Tan Boon Kong on 14 July 2010 was held at the Tan Sri Prof. Chin Fung Kee Auditorium. Attended by 55 participants, the talk focused on three recent case studies on engineering geology for the following projects:
a) Proposed Kuala Lumpur Outer Ring Road (KLORR)
b) New Low Cost Carrier Terminal (LCCT)
c) Sunway Lagoon
The first case study, i.e. KLORR, illustrated the role of engineering geology in the assessment of different construction methods in sensitive areas such as the existing Klang Gates Quartz Ridge. The study compared the viability of a tunnel against a viaduct based on the following factors:
a) Slope instability f) Reservoir leak
b) Rockfall g) Environmental impact
c) Construction difficulties h) Scenic view
d) Blasting i) Security concern for dam
e) Damage to dam j) Cost
While the first case study focused on technical considerations with respect to construction in rock, the second case study is on classification of soil according to Quaternary Sediment/Peat, Residual Soil and Bedrock. The determination of the thickness of the Quaternary Sediment/Peat
is important for the design of earthworks as the different thickness of the soft layer will affect the magnitude of settlement due to additional fill. As such, information from the geological assessment in the form of an isopach map as shown in Figure 1 will be useful.
The third and final case study involved the assessment of rock slope and limestone pinnacle at Sunway Lagoon where Mr. Tan illustrated the importance of a proper interpretation of critical joint sets in the stability assessment of rock slope and subsequent strengthening works.
At the end of the talk, there was a lively discussion between the participants and the speaker. The technical exchanges illustrate the interdependence of civil engineering works (especially geotechnical works) and engineering geology, and such exchanges between experienced engineering geologists and the civil engineering community will certainly benefit both professions. n
Figure 1: Isopach map of quaternary sediment/Peat for LCCT project
GeoteChniCal enGineerinG teChniCal DiviSion
technical talk on Commercial aspects of Malaysia's Gas Sales agreement
Oil, GaS and MininG teChniCal diviSiOn
the Oil, Gas and Mining Technical Division (OGMTD) had organised a presentation on 10 April 2010. The talk was presented by En. Mohd. Azlan Salim, a business analyst with Talisman Malaysia Limited. A total of 43 IEM members attended the talk.
The speaker started off in an interesting way by presenting a paragraph that had key concepts and phrases highlighted, thus providing an anchor point for his discussion and a focus point to which he returned to at the end of his presentation.
Launching into his presentation, En. Mohd. Azlan brought up basic financial concepts such as net cash flow to get the audience aligned. He then showed examples of various Production Sharing Contracts (PSC) and how the contracts differed from each other. He described how PSCs is not the only way to do business, concessions being another method.
Mohd. Azlan then described how the revenue from a barrel of oil would be split between royalty, the cost of oil, the contractor’s oil profit and the host company’s oil profit. From these tranches, he then showed how the revenue was eventually split between the host government, host company and the contractor. It was enlightening to note that the sample contractor company that he presented only enjoyed 10% profit on every barrel produced.
by Ir. Razmahwata Mohd. Razali
The audience was then introduced to a history lesson on the evolution of PSCs in Malaysia. A recent form of the PSC is the Revenue-over-Cost (RoC) Concept, which favours the contractor in the initial stages of the project, where the economics are generally not favourable to the PSC. In practical terms, the RoC PSC is set up in such a way that the oil cost portion is very large in the early stages of the project, thus increasing the contractors’ profit of the barrel revenue.
Next, En. Mohd. Azlan discussed the topic of gas PSCs, and the similarities and differences with oil PSCs. The main difference is that there is no supplemental payment, no export duty and the need to consider the impact of Penalty Quantity (PQ) as stipulated in the Gas Sales Agreement (GSA). It was noted that the PQ was imposed as there was no practical way to ‘store’ the access gas produced, to be drawn on when the production rate does not meet demand.
The speaker then moved to explaining general economic principals such as net cash flow in greater detail. The audience delved deep into their financial training to analyse the typical cash flow and key indicators discussed, e.g. Net Present Value, Discount Profitability Index, Internal Rate of Return and Spider and Tornado Plots, after which the presentation was concluded. n
ieM enGineerinG Week 2011 19-26 March 2011
The Institution of Engineers, Malaysia (IEM) is pleased to announce that IEM Engineering Week 2011 (EW2011) will commence from 19 March until 26 March 2011.
This will be the fifteenth (15th) consecutive year that IEM is organising the event. The theme for this year’s Engineering Week is ‘ENGINEERING FOR A BETTER LIVING’. It represents IEM’s continuous effort to enhance the image of the engineering profession amongst the community.
A one-week programme has been arranged to promote engineering aggressively and will include all aspects; the challenges, professionalism, exciting working environment and wide career options available to engineers. Society must be made to understand and appreciate the versatility of the engineering profession in providing them with a high standard of living. The target groups for these strategies should be the engineering related industries, IEM members, universities and schools.
The highlight of EW2011 will be the opening ceremony followed by a forum on “Engineering Stars” whereby prominent speakers will share their engineering experience with the public, fellow engineers as well as students. The event is scheduled to be held at the MATRADE Exhibition & Convention Center (MECC), Kuala Lumpur, on 19 March 2011. For details and registration, do visit the IEM website.
Kindly refer to the circular in the Bulletin and announcement in our website for details, contact the IEM Secretariat at 03-7968 4021 or email to mizi@ iem.org.my for further information. Organisations willing to be part of EW2011 by organising their own events during that particular week are most welcome.
The Standing Committee on Welfare and Service Matters Session 2010/2011
talk on “recent advances in Column technologies to Improve Soft Soils”
by
the public lecture on “Recent Advances in Column Technologies to Improve Soft Soils” was delivered by Prof. Jie Han on the evening of 21 July 2010 at the Prof. Chin Fung Kee Auditorium, Wisma IEM, Petaling Jaya, at 5.30 p.m. (see Figure 1) under the auspices of the Geotechnical Engineering Technical Division (GETD).
Prof. Jie Han is a professor in geotechnical engineering at the Department of Civil, Environmental and Architectural Engineering at the University of Kansas, United States. The talk was attended by more than 100 participants (see Figure 2).
Prof. Jie Han also conducted a 2day short course in Petaling Jaya from 21 to 22 July 2010 on “Principles and Practice of Ground Improvement” under the auspices of AGSSEA and supported by the GETD. The event was attended by 75 participants.
During the lecture, Prof. Jie Han presented on the various methods of the installation of stone columns, deep mixed columns, lowstrength concrete columns and composite columns. The load transfer mechanisms between columns and soils, and the design methods for the settlement, consolidation and stability of columntreated foundations were highlighted during the lecture. The concluding remarks of Prof. Jie Han in his lecture are:
• A variety of column technologies have been developed and successfully adopted for different applications
• Based on column stiffness, columns can be classified into flexible, semi-rigid and rigid columns
• Composite columns or combined technologies with columns have been increasingly used to combine their advantages
• Columns have functions of densification, pile effect, drainage and/or reinforcement
• Columns can fail not only due to bulge, crushing, shear and/or punching under compressive load, but also under shear, bending, tension and/or rotation under a combination of vertical and horizontal load
• Columns can be used to increase bearing capacity, reduce settlement, accelerate consolidation, increase stability and increase liquefaction resistance
• Theoretical or approximate solutions are available to design individual columns or composite foundations with columns
• Combined technologies with columns have complicated problems, posed challenges to design and provided opportunities for future research and applications
The talk ended at 7.30 p.m. with many interesting questions from the floor. Dr Ooi, on behalf of the GETD, thanked Prof. Jie Han for his most informative lecture and presented a certificate and token of appreciation to him (see Figure 3). n
Ir. Dr Ooi Teik Aun
Figure 1: Prof. Jie Han delivering his lecture on “Recent Advances in Column Technologies to Improve Soft Soils”
Figure 2: Partial view of the participants during discussion time
Figure 3: Presentation of memento to Prof. Jie Han by Ir. Dr Ooi
GeoteChnICal enGIneerInG teChnICal DIvISIon
Luncheon Meeting with Women engineers and Single Mothers Organisations
by Ir. Khamsah binti Rais
It has always been the intention of the lady engineers to continue their efforts in organising charitable activities especially for the less fortunate groups in the community. This time, the IEM Sub-committee on Women Engineers (WE) decided to focus on single mothers, hence, a luncheon meeting was organised with representatives from several single mothers organisations.
The objective of the meeting was to identify the type of assistance and support that suits their current and future needs that are within the means of the ladies engineer subcommittee.
The meeting was held at Restaurant Puteri, Brickfields, Kuala Lumpur on 5 December 2009. A total of five representatives from the IEM Sub-committee on Women Engineers, namely, Ir. Toh Ai Ching, Ir. June Lau Yuk Ma, Ir. Assoc. Prof. Hayati Abdullah, Ir. Khamsah Rais and Ir. Erni Juwita Abd. Manan, took part in the luncheon mee ting. There were eight representatives from different organisations/areas of single mothers groups, with Pn. Faridah Abdul Karim from WIRDA (Women Institute for
Research, Development and Advancement) leading the single mothers’ representatives during the meeting.
The meeting took note of the Spring Single Mother Society’s comments that the role of being single mothers is not merely limited to supporting their families singlehandedly, they also assume the roles of the fathers in their families including educating the children.
Single mothers face all kinds of humiliation and misunderstandings, and need a lot of moral and social support to ease their burden. They also require support to give them strength and encouragement to lessen the burden and to rebuild their confidence.
The meeting also noted that some of the activities that have been organised by single mothers to generate income while spending time with their children include:
a) Organise or participate in festivals where they can sell handycraft and spend time with their children.
b) Learn new skills such as sewing and baking.
c) Learn basic computer skills to improve their knowledge and to educate them to be more independent.
As a way forward, the WE proposed that:
a) To get single mothers to participate in Women Engineers gatherings or other suitable IEM activities such as Family Day in order to demonstrate/sell their products to generate income.
b) To assist single mothers in their job search.
c) To provide moral support to the groups, i.e. visit the single mothers society homes/centre.
d) To organise suitable activities such as medical checkups in collaboration with other parties such as MAKNA. n
Sub-cOMMIttee On WOMen engIneerS
Visit to Centralised utility Facilities, Gebeng
the Oil, Gas and Mining Technical Division (OGMTD) had organised a half-day technical visit to PETRONAS Gas Bhd (PGB)’s Centralised Utility Facilities (CUF) Plant in Gebeng, Kuantan, Pahang, on 22 May 2010. A total of 20 participants comprising IEM members and the Secretariat staff took part in the visit.
On hand to welcome the participants were CUFG’s Asset Manager Tn. Hj. Ahmad Hasbullah bin Hassan and Public Relations Executive Cik Syuhada Shamsudin.
A short welcoming remark by Tn. Hj. Ahmad Hasbullah followed soon after. He conveyed CUFG’s appreciation for IEM’s visit and hoped that the presence of IEM members could further spur the interest of the many young engineers at CUFG to be active in IEM. He pointed out that many engineers at the CUFG plant were relatively young and below 34 years old. However, the majority of them were not around that day as it was a Saturday, while others were involved in CUFG’s internal sports event at another location. He also conveyed the Plant Manager’s apology for his absence due to a prior engagement.
Participants were then shown a video of PGB. The video chronicled, among others, the history of PGB, its business activities, the main divisions of the company and its contribution to the people and the environment. There was also a segment showing how gas was being transported from offshore fields, processed at the gas processing plants and further transported via pipelines throughout the Peninsular Gas Utilisation (PGU) system that spans across the whole of Peninsular Malaysia. As such, PGB is organised into three main divisions, the Plant Operations Division (POD), Transmission Operation Division (TOD) and Centralised Utility Facilities Division (CUFD) to realise its business vision of becoming a ‘World Class Gas and Utilities Company’.
CUFG’s Shift Supervisor, En. Shazwan Saleh then engaged the participants in a lively briefing session on the technical aspects of the CUFG Plant. In summary, he explained about the four main systems of the plant, namely, the COGEN system, the Demineralised Water system, the Cooling Tower system and the Nitrogen Generation system. The systems produce products such as industrial gases, cooling water, electricity, demineralised water and steam to customers within the Gebeng Petrochemical Complex.
CUFG’s customers include the nearby Propane Dehydrogenation (PDH), BASF, Central Emergency Fire Services (CEFS), Kaneka, MOX, Polyplastic and Industrial Gases plants. CUFG also exports electricity to the TNB grid. Each
by Ir. Ahmad Rafidi bin Mohayiddin
Welcoming remarks by Tn. Hj. Ahmad Hasbullah
Visit to the control room
Technical briefing by En. Shazwan
IEM participants
Oil, Gas and mininG teChniCal diVisiOn
customer takes in various utilities from CUFG but not necessarily all of the utilities. The technical briefing attracted many questions from the participants and was very well handled by En. Shazwan and Tn. Hj. Ahmad Hasbullah.
A short tour of the CUFG plant was organised subsequently along the allocated ‘Green Zone’ where the bus could pass through and the participants would not need to don the full Personnel Protective Equipment (PPE). The participants were later taken to the Main Control Building to see up-close the Plant’s Distributed Control System (DCS) where numerous data was being monitored by the personnel on a 24-hour shift rotation. En. Shazwan continued to accompany and brief the participants with help from Cik Syuhada and En. Sani Abdul Salaam. The participants were also shown the overall schematic of the CUFG Plant and the laboratory where samples were analysed on a regular basis to ensure that CUFG’s products meet their customers’ specifications.
The visit had achieved OGMTD’s objectives of promoting the oil and gas industry to the IEM members, increasing the members’ knowledge of the industry and creating networking opportunities between IEM members and industry players. n
1Sudoku Centerpiece "2'
About the puzzle:
In this Sudoku variant, only 1 number is given as clue, thus the name 1Sudoku. The rest of the clues are given in the numbered cages (the dotted frame encompassing 2 or more squares). You are to search for the right combinations to fit the total for the cages and end up with a Sudoku Grid, the 9 by 9 composite of squares where there is no repeat of the number 1 to 9 in every Row, Column or Block.
Fill in the remaining 80 squares with single digits 1-9 such that there is no repeat of the digit in every Row, Column and Block. The number at the top left hand corner of the dotted cage indicates the total for the digits that the cage encompasses.
For tips on solving, visit www.1sudoku.com.my Twin Tree Publishing Answer is in the following pages of this edition.
A group photo
by mr. lim teck Guan
assessment of in-situ Compressive Strength Clarified
by Ir. Tu Yong Eng
The paper entitled “Structural assessment according to EN 13791: Assessment of in-situ compressive strength in structures and precast concrete” published in the pages 26-30 of the April 2010 issue of the Bulletin (Paper series on Structural Eurocodes) by Ir. Tu Yong Eng and Mr. Yap Seow Keong has received comments from Ir. Yeoh Sik Ching (on 21 April 2010 and 13 May 2010) and Dr Tam CT (10 May 2010). The authors would like to take this opportunity to thank both engineers for their valuable comments. The following tables show the comments and replies from the authors.
Comments from Ir. Yeoh Sik Ching
Firstly, I would like to thank the authors for the article. I read the article with great interest as I am also in the construction industry. I would like to highlight to the authors the possible error in tabulating the "Mean in-situ Characteristic Strength".
1) Table 1, row, BS6089, Estimated insitu characteristic strength work out to be 29.51
2) Table 2, row, BS6089, Estimated insitu characteristic strength work out to be 29.6 instead of 35.9 row, BS EN 13791, Estimated insitu characteristic strength work out to be 31.15 instead of 33.2
Authors’ reply
In BS 6089:1989, it was recommended that 95% of the confidence level lies within ± and based on the Manual of Ready-Mixed Concrete, the estimated characteristic strength of the core tests shall be (1 - ) x , where x is the mean of the group of the core and n is the number of the cores. Hence, standard deviation is not used in the computation of the estimation of the characteristic strength.
Personally, I always favour this approach, but this is seldom (or rarely) adopted by most engineers. The authors reported that “it is rather common that a singlecore or two-core samples are used” for which, at best, the mean of two values is available. Even with such limited information, the minimum value of 1.2 times the characteristic strength often form the basis of acceptance. The approaches in EN 13791, in all cases, tend to provide a much more conservative (and in the view of the writer, more appropriate) assessment.
Authors’ reply
Clause 6.5 of BS 6089: 1981 give the formula fcu = mean concrete cube strength –1.64 x standard deviation for a large number of the standard cube test result which is the same with Equation (1) of our paper. We agree with Dr Tam that EN 13791 gives a better approach to the assessment of the core test.
Query 2 from Dr tam
Query 1 from Dr tam
BS 6089: 1981 (prepared in relation to CP 110, before BS 8110) provides guidelines but without specific details on the number of cores and the interpretation of such results compared to EN 13791. It is clearly stated in EN 13791 that characteristic in-situ strength forms the basis of the assessment. However, the mean strength is often considered when the in-situ strength is considered. Hence, the statement under Section 5.0 (page 28) that “BS 6089 recommends the following formula for determining the characteristic strength of in-situ concrete, fcu = µ –1.64 σ Equation, (1)” is the interpretation by the authors.
Under Section 3.0, the authors have selected for the Null hypothesis and the Alternate hypothesis, the mean value, µ = f cu + 1.64σ. It would appear that the requirement to reach the target mean strength in the design of concrete mix for production is extremely demanding. It is expected that the in-situ concrete strength is lower than the standard cube strength of the same batch of concrete.
Authors’ reply
We believe that hypothesis testing is a better approach in assessing the concrete strength. As pointed out by Dr Tam, the in-situ strength is normally expected to be lower. In this paper, it only gives preliminary suggestion on the procedure for hypothesis testing. The actual null hypothesis shall be subjected to an agreement between the industry players to ensure fairness to all parties.
Query 3 from Dr tam
In Section 6.0, both core test standards BS 1881: Part 120 and BS EN 12504-1 are stated. However, it is to be noted that Clause 7.1 of EN 13791 states that “Except for where it is not feasible, cores shall be exposed to a laboratory atmosphere for at least three days prior to testing”, i.e. in air-dried condition, compared to the requirement of soaking (to saturated condition) in the BS 1881: Part 120 and “when required” in EN 12504-1. The saturated case is expected to indicate a lower strength.
Authors’ reply
This is an important observation. Tests based on BS EN 12504–1 is in fact closer to the actual site condition. Hence, it is important to carry out the assessment based on a set of harmonised codes.
Query 4 from Dr tam
In Section 8.0, half of the 22 cores is drilled “Hor” and the other half “Ver”. Since the direction of coring is considered in BS 6089 but not in EN 13791, the separation into the two cases will lead to different comparison with BS 6089.
Authors’ reply
This was done on purpose to show the difference between BS 6089 and EN 13791. We fully agree with Dr Tam that a separation into two different sets may show a more remarkable difference.
Query 5 from Dr tam
In Section 8.0 i) BS 6089, it is not shown how the value for the characteristic strength of 33.2 N/mm2 is derived from the mean value of 34.1 N/mm2.
Authors’ reply
In 6089, the means are expected to be within ± and based on CSTR [1] and the Manual of Ready-Mixed Concrete [2], characteristic strength can be estimated from the mean by (1 - ) x
Query 7 from Dr tam
In Case II i) BS 6089, similar to Query 5, it is not shown how the characteristic strength is derived from the mean strength.
Authors’ reply
Refer to the response in Query 5.
Query 8 from Dr tam
In Case II ii) EN 13791, based on a mean of 39.2 and standard deviation of 5.4, Sample 1 with a value of 30.9 is more than 1.5 times the standard deviation (the criteria adopted by the authors for detecting outliers).
Authors’ reply
There are two schools of thought on the outliers. One school of thought believes that we should respect our testing, unless it is proven that it is an outlier based on sufficient information (for core test, a core with initial defect or samples from a different mix or supplier shall be considered as outlier), it should be included in the interpretation. The other school of thought believes that whenever results move away from the majorities, it shall be considered as the outlier.
Query 9 from Dr tam
In Case II iii) Statistical testing, it is not clear for the standard deviation to be taken as 3 N/mm2. Since the eight cores may not be from the same population, it is doubtful if they should be considered statistically as a group.
Authors’ reply
This was from an actual test carried out by others, thus we have no prior knowledge on the original population. Hence, it is advisable for a proper understanding of the testing object prior to the actual planning of the strength investigation.
Query 10 from Dr tam
BS 6089 has been revised as a complimentary standard to EN 13791, the use of t-distribution is expected to be provided with more guidance. The final review for the national guidance clauses may be delayed until this is available for consideration.
Authors’ reply
Query 6 from Dr tam
In Section 8.0 ii) EN 13791, the characteristic in-situ cube compressive strength = 31.7 N/mm2. Based on Table 1 of EN 13791, the corresponding compressive strength class in EN 206-1 is slightly above C 30/37.
Authors’ reply
We agree with Dr Tam. Based on EN 13791, the result complies with C 30/37.
We are in fact in favour of hypothesis testing using t-test (if the underlying distribution is normal) compared to the recommendation of BS 6089: 2010.
referenCeS:
[1] Concrete Core Testing for Strength. Second edition, including addendum, Technical Report No. 11, Concrete Society, London 1987.
[2] Dewar, J.D., Anderson R., Manual of Ready-Mixed Concrete, Blackie Academic and professional, Second edition, 1992.
To All Members, Date: 10 January 2011
CaNDIDateS aPPrOVeD tO SIt FOr Year 2011 PrOFeSSIONaL INterVIeW
The following candidates have been approved to sit for the Professional Interview for 2011. In accordance with Bylaws 3.9, the undermentioned names are published as having applied for membership of the Institution, subject to passing the year 2011 Professional Interview. If any Corporate Member of the Institution has any reason as to why any of the candidates is not a fit and proper person for election, he should communicate in writing to the Honorary Secretary. Such communication should be lodged within a month from the date of this publication.
ir. prof. Dr Lee Teang shui Honorary Secretary, The Institution of Engineers, Malaysia
NeW aPPLICaNtS
Name Qualifications
BuILDING SerVICeS eNGINeerING
NORSUZANAWATI BINTI HJ. NOR @ HJ. NOA BE HONS (UMIST) (BUILDING SERVICES, 1996)
CHeMICaL eNGINeerING
ZULKERNAIN BIN MAT ADAM BE HONS (UM) (CHEMICAL, 1994)
CIVIL eNGINeerING
ABANG AFFENDY BIN ABANG SEPUAN BE HONS (MALAYA) (CIVIL, 2000)
ABDUL HANIF BIN KAMALUDIN BE HONS (USM) (CIVIL, 2002) MSc (UiTM) (BUILDING, 2010)
KAMARUDIN BIN SALEH BE HONS (UTM) (CIVIL, 1996)
LAU BENG KIM BE HONS (UKM) (CIVIL & ENVIROMENTAL, 2002)
MOHAMAD ADHAR BIN YAHAYA BE HONS (UiTM) (CIVIL, 2003)
MOHD ADIB BIN PAHORUDIN BE HONS (UTM) (CIVIL, 2003)
RAJA ROSLAN BIN RAJA BAHAROM SHAH BSc (PLYMOUTH POLYTECHNIC, CNAA) (CIVIL, 1980)
SITI RAFIZAH BINTI MOHD KASIRAN BE HONS (UKM) (CIVIL & STRUCTURAL, 2003)
WAN MOHD AZIMAN BIN WAN IBRAHIM BE HONS (UPM) (CIVIL, 1998)
YAP LEAN KENT BE HONS (USM) (CIVIL, 2002)
ZULKIFLI BIN SAMSUDIN BE HONS (UiTM) (CIVIL, 1998)
eLeCtrICaL eNGINeerING
LIM KEW TEE BSc (TENNESSEE) (ELECTRICAL, 1993)
NOOR MOHD FADZLI BIN OTHMAN BE HONS (ADELAIDE) (ELECTRICAL & ELECTRONIC, 2005)
SYAFRAH BINTI ABD JALIL BE HONS (UNITEN) (ELECTRICAL POWER, 2007)
YUSOF BIN SARNAWI BE HONS (UTM) (ELECTRICAL, 1999)
eLeCtrONIC eNGINeerING
AHMAD SAZREE BIN ABD AZIZ BSc (PURDUE) (ELECTRICAL, 1998)
NeW aPPLICaNtS
Name Qualifications
CONtrOL aND INStruMeNtatION eNGINeerING NG CHIN GUAN, JASON BE HONS (UTP) (ELECTRICAL & ELECTRONICS, 2005)
MeCHaNICaL eNGINeerING AKMAL HISHAM BIN HAMZAH BE HONS (MANCHESTER) (MECHANICAL, 1998)
GAN CHEE HAU BE (SHEFFIELD) (MECHANICAL, 2002) HOR KOK LUEN BE HONS (USM) (MECHANICAL, 2001)
traNSFer aPPLICaNtS
Mem No. Name Qualifications
CHeMICaL eNGINeerING
36256 ABDUL MALEK BIN ABDUL KADIR BE HONS (UTM) (CHEMICAL, 2000)
CIVIL eNGINeerING
12985 AZMI BIN IBRAHIM BSc (TOLEDO) (CIVIL, 1986)
22928 CHONG KEN MIN BE HONS (PORTSMOUTH) (CIVIL, 2001)
21803 GAN MING ONG BE HONS (UTM) (CIVIL, 2000) ME (UTM) (CIVIL, 2005)
33940 MOHD FAISAL BIN NORDIN @ BE HONS (USM) (CIVIL, 2004) ISHAK
41117 MOHD FAZLI BIN MOKHTARUDDIN BE HONS (UiTM) (CIVIL, 2003)
41103 MOHD NAJIB BIN ABDULLAH BE HONS (UTM) (CIVIL, 2004)
28047 MOHD ZAMRY BIN ZAKARIAH BE HONS (UTM) (CIVIL, 2005)
24519 OOI CHOY HOONG BE HONS (UTM) (CIVIL, 2003)
28204 SAFFUAN BIN WAN AHMAD BE HONS (UTM) (CIVIL, 2007)
37243 SO WEE SIANG BE HONS (UTM) (CIVIL, 2003)
traNSFer aPPLICaNtS Mem No. Name Qualifications
20187 TE CHEI YEAN BE HONS (UTM) (CIVIL, 2001) ME (UTM) (CIVIL & STRUCTURE, 2007)
18806 TEO NGUONG LEONG BE HONS (RMIT) (CIVIL, 1998)
38731 THILLAPPAN A/L SUBRAMANIAM BE HONS (UTHM) (CIVIL, 2006)
32613 TIONG KAI SONG BE HONS (PLYMOUTH) (CIVIL, 2002) 29104 WONG MUN FAI BE HONS (UKM) (CIVIL & STRUCTURAL, 2005) 40008 WOO JUN JIANG BE HONS (UKM) (CIVIL & ENVIRONMENTAL, 2006)
eLeCtrICaL eNGINeerING
28830 CHENG KAM HON BE HONS (UTM) (ELECTRICAL, 2003) 18282 KOH SIONG LEE BSc (MISSISSIPPI STATE) (ELECTRICAL, 1993)
38848 MAK KAH WEE BE HONS (UTM) (ELECTRICAL, 2005) 29094 MOHD HASANUDIN BIN BE HONS (UTM) (ELECTRICAL, 2005) HAMIDION
28978 MOHD FAIRUZ BIN ABDUL HAMID BE HONS (UTM) (ELECTRICAL, 2002) ME (UTM) (ELECTRICAL-POWER, 2008) 33766 SIOW JAT SHERN BE HONS (MMU) (ELECTRICAL, 2007) 20335 TOH LEONG
(ELECTRICAL, 2003)
(UTM) (ELECTRICAL, 2006)
CONtrOL aND INStruMeNtatION eNGINeerING
HONS (USM) (ELECTRICAL & ELECTRONIC, 2002)
BE HONS (UTM) (ELECTRICALCONTROL & INTRUMENTATION, 2002)
MeCHaNICaL eNGINeerING
The Institution would like to thank all contributors for donating towards the Wisma IEM Building Fund. Members and readers who wish to donate can do so by downloading the form from the IEM website at http://www.MyIEM.org.my or contact the IEM Secretariat at +603-7968 4001/4025 for more information. The list of the contributors as at 31 December 2010 are shown as in table.
IeM DIarY OF eVeNtS
Kindly note that the scheduled events below are subject to change. Please visit the IEM website at www.MyIEM.org.my for more information on the upcoming events.
environmental engineering Technical Division
23 February 2011
TAL k ON "Li F e A FT er T i N M i N i NG AND q UA rrY i NG:
The sUN wAY experie NC e"
Time: 5.30 p.m. to 7.30 p.m.
Venue: Tan Sri Prof. Chin Fung Kee Auditorium, Wisma IEM
Speakaer: Mr Phang Koon Tuck (Invitation to register)
Agricultural and Food engineering Technical Division
25 February 2011
AUTOMOT i V e i NDU s T rY e FFLU e NT: T re ATM e NT and re-use
Time: 5.30 p.m. to 7.30 p.m.
Venue: TUS Lecture Room, 2nd Floor, Wisma IEM
Speaker: Mr. Tanjore Swaminathan (Invitation to register)
Chemical engineering Technical Division
28 February 2011
TAL k ON ‘MA xi M isi NG re T e NT i ON OF BIO-a CTIV e I n G red I en T s I n de HY draT ed pr ODUCT s’
Time: 5.30 p.m. to 7.30 p.m.
Venue: TUS Lecture Room, 2nd Floor, Wisma IEM
Speaker: Ir. Assoc. Prof. Dr Law Chung Lim (Invitation to register)
Civil and structural engineering Technical Division
28 February 2011
O N e DAY COU rse ON s T r UT AND T he MOD e LL i NG OF CONC re T e s T r UCTU res
Time: 9.00 a.m. to 5.30 p.m.
Venue: To be confirmed
Fees: IEM Student Member - RM200
IEM Graduate Member - RM300 IEM Corporate Member - RM400 Non IEM Member - RM800 (Invitation to register)
building services Technical Division
1-2 March 2011
Tw O DAY C OU rse ON "Fire C ONT r OL CONC ep T s AND D esi GN OF ACT i V e we T sYs T e M"
Time: 9.00 a.m. to 5.30 p.m.
Venue: Tan Sri Prof. Chin Fung Kee Auditorium, Wisma IEM
Speaker: Ir. Gary Lim Eng Hwa Fees: IEM Member - RM650 Non IEM Member - RM850 (Invitation to register)
sub-Committee on Women engineers 5 March 2011
Half daY W O rks HO p O n 'flOW er arran G emen Th AND s ON T he esse NC e OF FLO wer'
Time: 9.00 a.m. to 1.00 p.m.
Venue: C&S Room, 2nd Floor, Wisma IEM
Speakaer: Miss Tan Bee Lee and Mr Lim Boon Yan Fees: IEM Member - RM80 Non IEM Member - RM100 (Invitation to register)
engineering education Technical division
21 March 2011
ON e DAY w O rksh O p "prepA ri NG e AC se LF A ssess M e NT rep O r T"
Time: 8.30 a.m. to 5.30 p.m.
Venue: Tan Sri Prof. Chin Fung Kee Auditorium, Wisma IEM
Speaker: Ir. Prof. Dr Ramesh Singh Fees: IEM Member - RM370 Non IEM Member - RM670 (Invitation to register)
ie M
CONF ere NC e AND exhibi T i ON 2011
Venue: Grand Dorsett Subang Jaya (formerly known as Sheraton Subang Hotel)
Organised by: Tunneling and Underground Space Technical Division (Invitation to register)
19 March 2011
Ope N i NG C ere MONY OF ie M e NG i N eeri NG W eek 2011 (e W2011) and fO rum O n "malaYs I a e NG i N eeri NG s
Venue: Matrade Hall, Matrade Exhibition and Convention Centre, Level 3, Jalan Khidmat Usaha, Kuala Lumpur
Time: 9.00 a.m. to 5.00 p.m.
Fees: IEM Member - RM80 Non IEM Member - RM150 Graduate and Student Member - RM30 (Invitation to register)
2 April 2011 ie M Ope N i NG bALLOT DAY
Venue: GETD Board Room, Bangunan Ingenieur, Petaling Jaya, Selangor (IEM office will be closed for this day)
16 April 2011
Venue: Wisma IEM, Petaling Jaya, Selangor
Time: 9.00 a.m. to 1.00 p.m. (Invitation to register)
ie M ANNUAL D i NN er
Venue: IOI Marriot Hotel, Putrajaya
Time: 7.30 p.m. to 10.30 p.m.
Fee: RM300.00 per person (Invitation to register)
12-14 july 2011
br O w NF
2011
International Conference on Remediation and Management of Contaminated Land: Focus on Asia
(First circular and call for paper)
Venue: Selangor (Call for submission of abstract)
27-30 November 2011
29T
Venue: The Rizqun International Hotel, Brunei Darussalam
(Call for submission of abstracts by 15 February 2011)
Effective from 1 August 2010, defaulting members in arrears of subscription will be considered as suspended members with all benefits removed. Consequently, these members will not be allowed to attend free talks and will be charged the non-member’s fee at the entrance. They will also not be entitled to register for visits/courses/seminars/conferences and any paid event of the IEM at members’ registration fee.
To avoid this, all Iem members are advised to settle their annual subscription on time and the dateline for payment each year is on 31 January.
Thank you.
By the Executive Committee of the IEM Council
CONFereNCeS & SeMINarS
For more information, kindly contact the organiser.
5-7 April 2011 M ALAY si A
Venue: CIDB Convention Centre, KL
Tel: +603 4042 8880
Email: miiell@cidb.gov.my/ecidbh@cidb.gov.my
Website: www.cidb.gov.my/miie2011
Venue: Crown Plaza Mutiara,
November 2011 CAF eO 29
Venue: The Rizqun International Hotel Tel/Fax: +673 238 4021
Email: cafeo29.brunei@gmail.com
Website: www.puja-brunei.org (Invitation to register)
News from standing Committee on Welfare and service Matters
IeM BOarD aND PaNeL aDVertISeMeNt at WISMa IeM
It gives us great pleasure to notify you of a new value added service that IEM will be providing to our members as well as companies involved with the supply of products and services related to the engineering profession. As you may be aware, the new IEM building, Wisma IEM, is now the venue for all IEM activities such as talks, seminars, courses, workshops, etc
With a nominal fee, we are offering you the opportunity to introduce your products and services to fellow engineers by putting up advertisements at our advertisement boards/panels or electronic board. Check out our offer in the IEM website, www.MYIEM.org.my. Feel free to contact our IEM Secretariat staff at 03-79684021 (Tarmizi) for further information.
Advertise your vacancies on one of the most prestigious engineering website in Malaysia. Hire qualified candidates!
Cheaper than using traditional search firms or newsprint!
Job postings appear for 30 days in website compared to 1 day for newsprint
20,000 Engineers exposed to your job posting
300 website hits per day
Looking for Engineers?
minimum of RM50 per job advertised for IEM members and RM100 for non-members
Please be informed that IEM provides job vacancy advertisement through the IEM Website and Notice Board to its members and non-members who are looking for engineers on a full time/contract or on part-time basis to fill job vacancies in their respective companies. The ‘Job Vacancy Advertisement Form’ and ‘Its Terms and Conditions’ are available at the IEM website, http://www.MyIEM.org.my or you may contact En. Mizi, the IEM Secretariat at +603 7968 4001/2 for more details.
Job seekers can search for their desired employment in the IEM Website under the ‘Job Gallery’ section for the latest job vacancy advertisements. Thank you and best regards,
Chairman
Standing Committee on Welfare and Service Matters
The Institution of Engineers, Malaysia
errata
Note: Some information on this paper were superseded with the earlier version in Paper series on Structural Eurocodes which was printed on pages 30-33 of the July 2010 issue.
teCHNICaL COMMIttee IeM-SWO FOr StaNDarDS IN DeSIGN OF CONCrete StruCtureS BeHaVIOur StuDY OF BaND BeaMS StIFFNeSS
Prepared by Working Group (IEM-SWO) No. 3 (Mar’ 09)
the following Notation is used (refer to aCi 318-95 part 5 Chapter 13 – two-way slab)
I
Ib = moment of inertia about centroidal axis of gross section of flange beam as defined in Figure 4 (Clause 13.2.4 of ACI 318-95)
s = moment of inertia about centroidal axis of gross section of slab = h3/12 times width of slab defined in notations of α
Ecb = modulus of elasticity of beam concrete
E
cs = modulus of elasticity of slab concrete
l1 = length of span in direction that moments are being determined, measured center-to-center of supports l2 = length of span transverse to l1 , measured center-to-center of supports.
α = ratio of flexural rigidities of beam section to flexural rigidities of a width of slab bounded laterally by centerlines of adjacent panels (if any) on each side of the beam = Ecb Ib / E cs I s
α1 = α in the direction of l1
A beam can be considered stiff (when α1 l2 / l1 > = 1) or flexible (when α1 l2 / l1 < 1).
The computation of load transfer onto the beams can be deduced from clause 13.6.8.1 and 13.6.8.2 of ACI-318-95
For horizontal beam b2; l1 = 6m, l2 = 12m For vertical beam b1; l1 = 12m, l2 = 6m
Assume E cs = Ecb
b w = 1.0 m Ib = K
h = 0.35m
K = 1.15 (to allow for flange beam action)
Ib = 1.15 x = 4.1 x 10⁻³ m4
I s = x 12 x 0.183 = 5.832 x 10⁻³ m4
b w = 1.0 m Ib = K
h = 0.35m
K = 1.15 (to allow for flange beam action)
α1 = = = 0.7
*Beam B2 can be considered as stiff beam b w h3 12 1 x 0.353 12 1 12
Ib I s 12 6
4.1 x 10⁻³ m4 5.832 x 10⁻³ m4
α1l2 / l1 = 0.7 x = 1.4 > 1.0
Figure 4 : Portion of slab to be included with the beam for computation of Ib b w h3 12
Ib = 1.15 x = 4.1 x 10⁻³ m4
I s = = 2.92 x 10⁻³ m4
Ib I s 1 x 0.353 12 1 x 6 x 0.183 12
4.1 x 10⁻³ m4 2.92 x 10⁻³ m4
α1 = = 1.4
*Hence flexible beam
MyIEM Portal – IEM is pleased to announce that members are now able to perform various payment transactions with IEM online using Maybank2U. Various transactions such as the renewal of annual subscriptions, payment of registration fee for events, etc, can be performed online. Kindly activate your first time login if you have not done so (First Time Login Activation) to enjoy better interaction with IEM via cyberspace.
GuIDe tO ONLINe PaYMeNt
online Membership renewal via MyieM portal by Maybank2U (M2U) http://www.MYIeM.org.my
After activation of the first time login, kindly proceed to login into your membership main menu.
Click on Renew Membership button/link.
Select Annual Subscription 2011 and fill in the amount for contribution/ donation to the IEM Building, Benevolent Fund and Education Fund.
Double check the amount. If it is accurate, please click on the confirm button to proceed or else click the back button to adjust the amount.
Click on the M2U payment option to proceed.
A small M2U window login page will pop up. Please key in all your M2U login details to proceed.
After the M2U login is done, please click on the request for security TAC number which will be sent via SMS to your registered M2U mobile number. Key in the TAC number into the TAC column box and click confirm to perform the transaction. M2U system will then notify you whether the transaction is successful or not.
You may logout and close the pop up windows and go back to the MyIEM portal page where a successful message will be displayed and an online receipt will be emailed to your email address in IEM’s record.
accountable or responsible?
the terms accountable and responsible are frequently used interchangeably. There are salient differences in the two words. To understand the difference, let us think about it this way: A person is still accountable even though the person can delegate part or all of the responsibilities to another party.
For example, delegating tasks to a subordinate or consultant. In the end, the party taking the “job” will need to deliver on the tasks assigned. Legal compliance is similarly delegated to professional parties. At times, it makes sense as the delegated party might have specific skills or knowledge. However, does that mean that the delegating party is no longer accountable?
What does the Occupational Safety and Health Act 1994 (Act 514) say about management accountability? For this, let us turn to Part IV: General Duties of Employers and Self-Employed Persons.
This is the key statement [Subsection 15 (1)]: It shall be the duty of every employer and every selfemployed person to ensure, so far as is practicable, the safety, health and welfare at work of all his employees. For a discussion on “Practicable”, please refer to this column published in the October 2010 issue.
Subsection 15 (2) states that the duties (again “so far as is practicable”) include:
(a) Provision and maintenance of plant and systems of work.
(b) Providing arrangements in accordance with the use or operation, handling, storage and transport of plant and substances.
(c) Provision of information, instruction, training and supervision.
(d) Maintenance of the place of work including the provision and maintenance of the means of access to and egress from the place of work.
(e) Provision and maintenance of a healthy working environment with adequate facilities for welfare.
Section 16 requires the Employer and Self-Employed person to prepare and communicate a written statement of the general Safety and Health Policy
by Ir. Shum Keng Yan
for his employees and the organisation and arrangements to carry out the policy. This general policy needs to be revised as often as maybe appropriate to keep it current. Section 16 does not apply to those who carry on an undertaking with not more than five Employees.
Section 17 covers person other than Employees. Imagine the immediate neighbours, customers, contractors, visitors and the public who might be affected by the industry.
Section 18 covers Occupiers who are the “controllers” of premises who make available non-domestic premises as a place of work to those who are not employed by them. Imagine the Occupier as one of the tenants of a shopping complex.
There are two additional actions for the Employer under Part VI: General Duties of Employees. They are:
i) Section 26 – i.e. the duty NOT to charge Employees for things done or provided under the Act and regulations made under.
ii) Subsection 27 (1) – i.e. the duty NOT to discriminate against an Employee if the Employee makes a complaint or joins and exercises his function as a member of the Safety and Health Committee. (Note: Subsection 27 (2) states a similar requirement for Trade Unions not to discriminate against their member for the same reasons stated here.)
A takeaway is that the activity and place of work is under the management or control of the Employer. Those who have figured out Accountability and Responsibility can help enlighten us at pub@iem. org.my. n
There is often a reversal in “Accountability and Responsibility” in actual practice. Subordinates tend to be made “Accountable and Responsible” whenever something goes wrong whereas the Supervisor becomes “Responsible” by micro-managing the Subordinates. I suppose the remuneration should be reversed too in these cases.