THE MONTHLY BULLETIN OF THE INSTITUTION OF ENGINEERS, MALAYSIA
KDN PP 1050/12/2012 (030192) ISSN 0126-9909 AUGUST 2016


KDN PP 1050/12/2012 (030192) ISSN 0126-9909 AUGUST 2016
Number 08, August 2016
IEM Registered on 1 May 1959
MAJLIS BAGI SESI / IEM COUNCIL SESSION /
YANG DIPERTUA / PRESIDENT
Ir. Tan Yean Chin
TIMBALAN YANG DIPERTUA / DEPUTY PRESIDENT
Ir. David Lai Kong Phooi
NAIB YANG DIPERTUA / VICE PRESIDENTS
Ir. Prof. Dr Ruslan bin Hassan, Ir. Lai Sze Ching, Ir. Lee Boon Chong, I . P of. D Jef e Chia g Choo g Lui , I . Asso . P of. D No lida t Bu i a i ,
Ir. Ellias Bin Saidin, Ir. Ong Ching Loon
SETIAUSAHA KEHORMAT / HONORARY SECRETARY
Ir. Yam Teong Sian
BENDAHARI KEHORMAT / HONORARY TREASURER
Dr Wang Hong Kok F.I.E.M.
BEKAS YANG DIPERTUA TERAKHIR / IMMEDIATE PAST PRESIDENT
Y.Bhg. Dato’ I . Li Cho Ho k
BEKAS YANG DIPERTUA / PAST PRESIDENTS
Y.Bhg. A ade i ia Ta S i Dato’ I . D Hj. Ah ad )aidee i Laidi , Y.Bhg. Dato’ I . D
Gue See Se , Y.Bhg. Dato’ Paduka I . Keiz ul i A dullah, Y.Bhg. A ade i ia Dato’ I .
Prof. Dr Chuah Hean Teik, Ir. Choo Kok Beng
WAKIL AWAM / CIVIL REPRESENTATIVE
I . P of. D Mohd. )a i i Ju aat
WAKIL MEKANIKAL / MECHANICAL REPRESENTATIVE
Ir. Dr Kannan M. Munisamy
WAKIL ELEKTRIK / ELECTRICAL REPRESENTATIVE
Y.Bhg. Dato’ I . D Ali Aska i She Moha ad
WAKIL STRUKTUR / STRUCTURAL REPRESENTATIVE
Ir. Hooi Wing Chuen
WAKIL KIMIA / CHEMICAL REPRESENTATIVE
I . P of. D Tho as Choo g Shea Ya
WAKIL LAIN-LAIN DISPLIN / REPRESENTATIVE TO OTHER DISCIPLINES
I . Roz a i A dul Rashid
WAKIL MULTIMEDIA DAN ICT / ICT AND MULTIMEDIA REPRESENTATIVE
M . A dul Fatah i Mohd. Yai , M.I.E.M.
AHLI MAJLIS / COUNCIL MEMBERS
I . Ga Li E g H a, Y.Bhg Dato’ I . Hj. Noo Az i i Jaafa , I . D A i uddi i Mohd Baki, I . Mohd Radzi i Salleh, I . O g Sa g Woh, I . Mohd Khi i Muha ad, Y.Bhg Dato’ I . Hj. Ha api Bi Moha ad Noo , I . D Ah ad A ua i Oth a , I . Ishak i A dul Rah a , I . Cho g Pi k E g
PE Cho g , I . Ng Yo g Ko g, I . Teji de Si gh, I . S eeda a a/l Ra a ,
I . Roge Wo g Chi We g, I . Asso . P of D . Ah ad Ka il i A shad,
Ir. Dr Tan Kuang Leong, Ir. Hoo Choon Sean, Y.Bhg. Lt. Jen. Dato’ Wira Ir. Ismail i Sa io Ret. RMAF , I . Hj. A ua i Yah a, I . Mah Wa She g, I . Gu asaga a a/l K ist a , I . Che Ha Shea , I . Mohd A a i Hj. Id is, I . Gopal Na ia Kut , I . Yap Soo Hoe, I . Sa thaku a a a/l E usa
PENGERUSI CAWANGAN / BRANCH CHAIRMAN
1. Pulau Pinang: Ir. Dr Mui Kai Yin
2. Selatan: Ir. Lee Meng Chiat
3. Perak: Ir. Lau Win Sang
. Kedah-Pe lis: I . P of. D Rezu a i Ka a uddi . Nege i Se ila : I . Shah i A i i Jaha i . Kela ta : I . Hj. Mohd )ai i A d. Ha id . Te e gga u: I . Ate i i Sulo g
8. Melaka: Ir. Dr Tan Chee Fai
. Sa a ak: I . Vi e t Ta g Chok Khi g . Sa ah: I . Hj. Yahi a i A a g Kaha . Mi i: I . Paul Chie Lik I g
12. Pahang: Y. Bhg. Dato’ I . T . Hj. A dul Jalil i Hj. Moha ed
AHLI JAWATANKUASA INFORMASI DAN PENERBITAN / STANDING COMMITTEE ON INFORMATION AND PUBLICATIONS / Pengerusi/Chairman: Ir. Prof. Dr Ruslan Hassan Nai Pe ge usi/Vi e Chai a : I . Mohd. Khi Muha ad Seiausaha/Se eta : I . Lau Tai O Ketua Pengarang/Chief Editor: Ir. Prof. Dr Ruslan Hassan Pe ga a g Bulei /Bullei Edito : I . Mohd. Khi Muha ad Pengarang Prinsipal Jurnal/Principal Journal Editor: Ir. Prof. Dr Ruslan Hassan Pe ge usi Pe pustakaa /Li a Chai a : I . C.M.M. A oo u ke Ahli-Ahli/Co itee Me e s: Y.Bhg. Datuk I . P of. D O Chee She g, I . P of. D Do i i Foo Ch a Yee, D Wa g Ho g Kok F.I.E.M., Ir. Santha Kumaran a/l Erusan, M . A dul Fatah i Moha ed Yai M.I.E.M., Ir. Chin Mee Poon, Ir. Yee Thien Seng, I . O g Gua Ho k, I . D Oh Seo g Po , I . Teji de Si gh, Ms. Mi helle Lau Chui Chui Grad. IEM
LEMBAGA PENGARANG/EDITORIAL BOARD 2016/2017
Ketua Pengarang/Chief Editor: Ir. Prof. Dr Ruslan Hassan Pe ga a g Bulei /Bullei Edito : I . Mohd. Khi Muha ad Pengarang Jurnal/Journal Editor: Ir. Prof. Dr Ruslan Hassan Ahli-ahli/Co itee Me e s: I . O g Gua Ho k, I . Lau Tai O , I . Yee Thie Se g, Dr Wang Hong Kok F.I.E.M.
Secretariats: Janet Lim, May Lee
COVER NOTE
Combating the ‘Inconvenient Truth’
COVER STORY
Consequences of Climate Change
FEATURE ARTICLES

5


6 - 12
14 - 31
Sustainability Design Principles in Practice ..........14
Passive Cooling System in Terrace Houses: Towards Collective Action ..........................................20
Lean Product Design and Competitiveness: A Green Technology Approach ..........................................25
SAFE TEA TIME
Engagement Safety Trainings Part 3: A New Beginning
Evidence of Past Sea Level Change and the Formation of Recent Coastal Alluvial Deposits in Peninsular Malaysia ...........................................36
Managing Energy Saving Project for Telecom Towers in Asia .......................................................38 Technical Visit to Unired Pressure Vessel Manufacturer ..........................................................40
NEWS FROM BRANCH
Southern Branch’s Efforts in Fight Against Dengue
GLOBE TREKKING
Mendenhall – A Shrinking Glacier
43
-
-


Global warming was the subject of the famous 2006 documentary film titled “An Inconvenient Truth”, about former U.S. Vice President Al Gore’s campaign in raising international public awareness of this environmental issue.
Theglobalwarmingisreal,potentiallycatastrophicandhuman-causedassuggested in the film. It is undeniable and appropriate action must be taken to address this increasing “planetary emergency” before it is too late.
Al Gore, who became more prominent as an environmentalist than a politician, concluded: “Each one of us is a cause of global warming, but each one of us can make choices to change that with the things we buy, the electricity we use, the cars we drive… The solutions are in our hands; we just have to have the determination to make it happen.” Engineers, endowed with the mission of fostering technological innovation and excellence for the benefit of humanity are, needless to say, duty-bound to play a more active role in combating this “inconvenient truth” of global warming. With this in mind, this issue of JURUTERA is devoted to this topic with articles contributed mainly by members of this Standing Committee.
It is hoped that we will be able to inspire and influence the engineering community to mitigate, if not eradicate, the effects of global warming.
Let us reflect on Native American Chief Seattle’s quote made two centuries ago: “Humankind has not woven the web of life. We are but one thread within it. Whatever we do to the web, we do to ourselves. All things are bound together. All things connect.”
If we do not protect Earth from global warming caused by our actions, it is only a matter of time before we perish along with it.
DIMENSION PUBLISHING SDN. BHD. (449732-T)
Le el - - , PJX-HM Shah To e , No. A, Pe sia a Ba at, Petali g Ja a, Sela go Da ul Ehsa , Mala sia.
Tel: + Fa : +
E- ail: i fo@di e sio pu lishi g. o We site: .di e sio pu lishi g. o
Fo ad e ise e t pla e e ts a d su s ipio s, please o ta t:
DIMENSION PUBLISHING SDN. BHD. (449732-T) at + , o E- ail: i fo@di e sio pu lishi g. o
Su s ripio Depart e t E- ail: i fo@di e sio pu lishi g. o
Pri ted
HOFFSET PRINTING SDN. BHD. -V No. , Jala TPK / , Ta a Pe i dust ia Ki a a, Pu ho g, Sela go Da ul Ehsa , Mala sia. Tel: + Fa : +
Mailer
-P Jala TSB , Ta a Pe i dust ia Su gai Buloh, Su gai Buloh, Sela go Da ul Ehsa , Mala sia. Tel: +
Chair a ROBERT MEBRUER
CEO/Pu lisher PATRICK LEUNG
Ge eralMa ager SHIRLEY THAM shirley@dimensionpublishing.com
HeadofMarkei g&Busi essDe elop e t JOSEPH HOW joseph@dimensionpublishing.com
Editor TAN BEE HONG bee@dimensionpublishing.com
Co tri ui gWriters PUTRI )ANINA & )OE PHOON putri@dimensionpublishing.com zoe@dimensionpublishing.com
Se iorGraphi Desig er SUMATHI MANOKARAN sumathi@dimensionpublishing.com
Graphi Desig er NABEELA AHMAD beela@dimensionpublishing.com
Ad erisi gCo sulta ts A)IM SHAARI & THAM CHOON KIT azim@dimensionpublishing.com ckit@dimensionpublishing.com
A ou ts u Ad i E e ui e YEN YIN yenyin@dimensionpublishing.com

Human inluence on the climate system is clear. The more we disrupt our climate, the more we risk severe, pervasive and irreversible impacts.

Prof. Dr Joy Jacqueline Pereira, FASc.
Prof. Dr Joy Jacqueline Pereira, a Fellow of Academy of Sciences Malaysia (FASc) is currently a Principal Research Fellow at the Southeast Asia Disaster Prevention Research Initiative (SEADPRI-UKM), Universiti Kebangsaan Malaysia.
Prof. Joy Pereira who is a Member of the IPCC Bureau was elected as ViceChair of Working Group 2 at the 42nd IPCC Session in Dubrovnik in October 2015. On the nomination by the Ministry of Natural Resources and Environment (NRE), Malaysia, she was also elected to the IPCC Executive Committee to represent the South-West Paciic (Region V), which comprises 22 countries.
This key message was delivered by the Intergovernmental Panel on Climate Change (IPCC) after conducting the most recent comprehensive assessment on the state of climate in the world. Yet, there are those who question indings based on scientiic evidence. They are probably misguided by non-peer reviewed articles with a political agenda designed to inluence ongoing international negotiations on issues related to compensation, transfer of technology and resources.
The most recent assessment on global climate change is documented in reports of the IPCC Working Groups 1, 2 and 3 as well as the Synthesis Report, which was released in late 2013 and 2014. The entire reports are available at http://www.ipcc.ch/.
This article will provide some background on the IPCC and highlight key issues related to Malaysia. The information is derived from the most recent IPCC reports. We start with a brief description of the IPCC and the role of Malaysia. This is followed by a short discussion on key terms related to the climate change discourse, highlighting the need to clarify terminology for operational purposes. The final section focuses on the climate prognosis for tropical Asia. The implications for Malaysia can be inferred implicitly and some recommendations are made on the way forward.
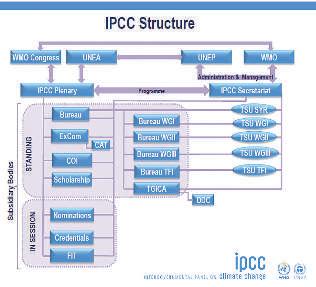
IPCC was jointly established by the United Nations Environment Programme (UNEP) and the World Meteorological Organisation (WMO). It was endorsed by the UN General Assembly in 1988. Its 195 member states navigate the science-policy interface via the IPCC Plenary, with support from an elected IPCC Bureau and IPCC Executive Committee as well as three Working Groups and a Task Force, as well as assistance of the IPCC Secretariat and Technical Secretariat Units. The IPCC Working Group 1 covers The Physical Science Basis. Working Group II covers Climate Change Impacts, Adaptation and Vulnerabilities. Working Group III covers Mitigation of Climate Change. The Task Force focuses on National Greenhouse Gas Inventories. The IPCC Plenary comprises National Focal Points from member states which elect scientists and experts to its various bodies on a cyclic basis.
The role of IPCC is “to assess on a comprehensive, objective, open and transparent basis, the scientific, technical and socio-economic information relevant to understanding the scientific basis of risk of humaninduced climate change, its potential impacts and options for adaptation and mitigation.” Since 1990, IPCC has produced five Assessment Reports (1990, 1995, 2001, 2007, 2013/14) and other documents (Special Reports, Guidelines and Technical Papers) to support these assessments. The First Assessment Report (1990) led to the establishment of the United Nations Framework Convention on Climate Change (UNFCCC). Since then, four assessment reports have provided inputs for the UNFCCC and the latest Fifth Assessment Report (2013/2014) provide the scientific foundation for negotiating the Paris Agreement. The reports are neutral withrespecttopolicyanddealobjectivelywithscientific, technical and socio-economic factors relevant to the application of particular policies.
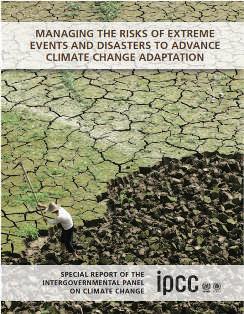
An appreciation of the climate change discourse requires an understanding of the terms and definitions of some key concepts used by IPCC and its subtly different interpretation in other key platforms. IPCC issued the Special Report on Managing Risks of Extreme Events and Disasters to Advance Climate Change Adaptation in 2012.
This report was momentous in that it integrated the perspectiveofthreehistoricallydistinctgroupsofscientists: Specialists in disaster risk reduction, who are mostly new to IPCC, authorities in the areas of the physical science basis of climate change, who are generally associated with Working Group 1 of the IPCC, and experts in climate changeimpacts,adaptation,andvulnerability,whowork under the auspices of Working Group 2.
SomekeytermsusedthatareofrelevancetoMalaysia are highlighted below, with differences in other platforms highlighted briefly.

Climate Variability refers to variations in the mean state and other statistics (such as standard deviations, the occurrence of extremes, etc.) of climate at all spatial and temporal scales beyond that of individual weather events. This covers short-term changes. Climate Extremes refers to the occurrence of a value of weather/climate variable above (or below) a threshold value near the upper (or lower) ends of the range of observed values of the variable.
Climate Change in IPCC refers to change that can be identified (e.g. by using statistical tests) by changes in the mean and/or the variability of climate properties and which persist for an extended period, typically decades or longer, and may be due to natural variability or a result of human activity. This broad definition covers the longterm, including natural and human causes.
Climate Change in Article 1 of the UNFCCC refers to “a change in climate attributed directly or indirectly to human activity which alters the composition of the global atmosphere and which is in addition to natural climate variability observed over comparable time periods”. This narrow definition leaves out natural causes and has implications on negotiations on compensation for loss and damage, from developed to developing countries.
Climate change mitigation is restricted to human interventiontoreducethesourcesortoenhancethesinks of greenhouse gases.
Disaster mitigation refers to the lessening of potential adverse impacts of physical hazards (including those that are human-induced) through actions that reduce hazard, exposure and vulnerability.Thus, climate change mitigation and disaster mitigation are two different concepts that occasionally cause confusion when disaster management specialists interact with climate change adaptation experts.
Climate Change Adaptation refers to both human and natural systems. In human systems, it is the process of adjustmenttoactualorexpectedclimateanditseffects,in ordertomoderateharmorexploitbeneficialopportunities. In natural systems, it refers to the process of adjustment to actual climate and its effects; human intervention may facilitate adjustment to expected climate.
Climate Change in the National Policy on Climate Change (2008) refers to any change in climate over time that directly or indirectly affects humans and their activities as well as natural systems and its processes. This definition is silent on the causal element. The goal of the National Policy is climate resilient development. In Malaysia, this refers to development that takes into account measures to address climate change and extreme weather in line with national priorities. This broadened definition enables the National Policy to serve as an instrument to harmonise and integrate to the extent possible and corresponding to national priorities, measures on climate change adaptation, climate change mitigation and disaster risk reduction.
In order to make this goal operational, there is a need todevelopalexiconofconceptsthatcanaccommodate the variety of disciplines and perspectives of practitioners working on these areas in Malaysia. Examples of such concepts include susceptibility, exposure, vulnerability and risk, among others.
The Fifth Assessment Report of the IPCC Working Group II on Climate Change Impacts, Adaptation and Vulnerabilities for Asia (Chapter 24) reports with high confidence that warming trends and increasing temperature extremes have been observed across most of Asian in the past century. Increasing numbers of warm days and decreasing numbers of cold days have been observed,withthewarmingtrendcontinuingintothenew millennium. Precipitation trends including extremes are characterised by strong variability, with both increasing and decreasing trends observed in different parts and seasons of Asia. The report states that “there is evidence that climate has changed in Asia and future changes can be expected which will increasingly challenge the resilience and undermine the development that has been achieved in the region”.
The report identifies 10 Key Risks for Asia, based on available literature and expert judgment. They are in no particular order of importance and cannot be compared to other regions. Of these, 8 have a direct impact on society in terms of health, well-being and security while two are related to ecosystems and their services, which will indirectly affect the resilience and sustainable development in the region.
Climate Extremes: Five of the 10 Key Risks are related to extreme climate events linked to precipitation and
high temperatures. The report concludes that “extreme climate events will have an increasing impact on human health, security, livelihoods, and poverty, with the type and magnitude of impact varying across Asia. More frequent and intense heat-waves will increase mortality and morbidity in vulnerable groups. Increases in heavy rain and temperature will increase the risk of diarrhoeal diseases, dengue fever and malaria. Increases in floods and droughts will exacerbate rural poverty in parts of Asia due to negative impacts on the rice crop and resulting increases in food prices and the cost of living.”
Evidence from an earlier IPCC Report (2012) indicates that fatalities from climate-related hazards are higher in developing countries (In 1970-2008, over 95% are in developing world). However, economic losses are highest in middle income countries such as Malaysia, with losses amounting up to 1% of the GDP. In low income countries, losses amount to about 0.3% of the GDP and in high income countries they are 10-fold lower, at 0.1% of the GDP. The National Disaster Management Agency (NADMA) is taking serious consideration of climaterelated hazards such as floods and flash-floods and its cascading effect such as landslides and environmental pollution. A National Disaster Risk Reduction Platform has been established, bringing together stakeholders, including government and non-government agencies, universities, research institutes and the private sector, to reviewtheprobleminaholisticmannerandtoimplement coordinated actions, from national to local levels. In Malaysia, disaster risk reduction is viewed as the first step to climate change adaption.
1. Increased [coastal, riverine and urban] looding leading to widespread damage to infrastructure and settlements (medium conidence)
2. Increased risk of heat-related mortality (high conidence)
3. Increased risk of drought-related water and food shortage causing malnutrition (high conidence)
4. Increased risk of lood-related deaths, injuries, infectious diseases and mental disorders (medium conidence)
5. Increased risk of water and vector-borne diseases (medium conidence)
6. Increased risk of crop failure and lower crop production could lead to food insecurity (medium conidence)
7. Water shortage in arid areas (medium conidence)
8. Exacerbated poverty, inequalities and new vulnerabilities (high conidence)
9. Coral reef decline (high conidence)
10. Mountain-top extinctions (high conidence)
Source:Chapter24(Asia),ClimateChange2014,Impacts, Adaptation and Vulnerability (Volume II) available at http://www.ipcc.ch/
Food and Water Security: Water scarcity is expected to be a major challenge for most of the region. However, for tropical Asia (including Malaysia), this is not attributed to climate change but rather to increased demand and poor management. Current management practices cannot continue and must be improved to support sustainable development. Increase in population and demand arising from higher standards of living, may worsen water security in many parts in Asia. Integrated water management strategies can help adapt to climate change, including developing water saving technologies, increasing water productivity and water reuse.
The impact of climate change on food production and food security in Asia will vary from region to region, withmanyareastoexperienceadeclineinproductivity. This is evident in the case of rice production. Most models show that higher temperatures will lead to lower rice yields as a result of shorter growing periods. A number of regions are already near the heat stress limits for rice. However, CO2 fertilisation may, in part, offset yield losses in rice and other crops. The rise in sea levels will inundate low lying areas and affect rice growing regions.
Poverty, Inequalities and New Vulnerabilities: There is a high level of confidence that key risks related to climate extremes, food and water security are expected to exacerbate poverty and inequalities as well as create new vulnerabilities. This will most certainly undermine all the achievements in Asia so far. Climate change will compound the various stresses caused by rapid urbanisation, industrialisation and economic development. It is expected to adversely affect the sustainable development capabilities of most Asian developing countries by aggravating pressures on natural resources and the environment. Development of sustainable cities with fewer fossil fuel driven vehicles and with more trees and greenery will have a number of co-benefits, including improved public health. The push for low carbon development is critical in this context. Malaysia has announced an ambitious reduction in carbon intensity but this is subject to availability of international resources particularly technology.
Biodiversity and Ecosystem Services: Rising sealevels are expected to cause a decline in mangroves, salt marshes and seagrass beds unless these can move inland, while coastal fresh water swamps and marshes will be vulnerable to saltwater intrusion with rising sealevels. Widespread damage to coral reefs, correlated with episodes of high sea-surface temperature, has been reported in recent decades and there is high confidencethatdamagetoreefswillincreaseinthe21st century as a result of ocean warming and acidification. Marine biodiversity may decrease if thermal tolerance limits are exceeded. There are major research gaps in the tropics and these include the temperature dependence of carbon fixation by tropical trees and
the thermal tolerances and adjustment capacities of both plants and animals. Interactions between climate change and the direct impacts of carbon dioxide on crops and natural ecosystems are also currently poorly understood. In Malaysia, research has to be prioritised to assess the potential impacts on biodiversity in a warming world.
Given the scenario of a warming world and limits to adaptation, the international community, and in particular developed countries have to accelerate efforts under the Paris Agreement to achieve greater emission reduction. Malaysia has embarked on an economic transformation plan that emphasises green technology and low carbon development. It is critical to accelerate low carbon development to ensure inclusive and sustainable development while building resilience to climate change and disaster risk reduction, as we are exposed primarily to climate induced hazards.
The Ministry of Natural Resources and Environment (NRE), in its capacity as the National Focal Point for critical climate change platforms such as the UNFCCC and IPCC, has a critical role to play. There is ongoing collaboration with other Ministries to fulfill national commitments under the Paris Agreement. It also has to engage more with the National Disaster Management Agency and other agencies working on climate change adaptation on an operational level, to manage the risk of impacts due to climate extremes and climate change. One aspect that is critical for enhancement is coordination of multi-disciplinary research involving multi-sectoral research institutes, universities, professional bodies and knowledge societies. No one entity can work
alone to address the challenges of climate change. NRE should consider engagement with multi-sectoral and multi-disciplinary platforms such as the Academy of Sciences and the National Council of Professors to advance the research agenda on building climate and disaster resilience.
BIBLIOGRAPHY
1. Barros,V.R.,C.B.Field,D.J.Dokken,M.D.Mastrandrea, K.J. Mach, T.E. Bilir, M. Chatterjee, K.L. Ebi, Y.O. Estrada, R.C. Genova, B. Girma, E.S. Kissel, A.N. Levy, S. MacCracken, P.R. Mastrandrea, and L.L. White (eds.) 2012. Climate Change 2014: Impacts, Adaptation, and Vulnerability. Part A: Regional Aspects. Contribution of Working Group II to the Fifth Assessment Report of the Intergovernmental Panel on Climate Change, Cambridge University Press, Cambridge, United Kingdom and New York, NY, USA.
2. Hijioka, Y., E. Lin, J.J. Pereira, R.T. Corlett, X. Cui, G.E. Insarov, R.D. Lasco, E. Lindgren, and A. Surjan, 2014: Asia. In: Climate Change 2014: Impacts, Adaptation, and Vulnerability. Part B: Regional Aspects. Contribution of Working Group II to the Fifth Assessment Report of the Intergovernmental Panel on Climate Change [Barros, V.R., C.B. Field, D.J. Dokken, M.D. Mastrandrea, K.J. Mach, T.E. Bilir, M. Chatterjee, K.L.Ebi,Y.O.Estrada,R.C.Genova,B.Girma,E.S.Kissel, A.N. Levy, S. MacCracken, P.R. Mastrandrea, and L.L. White(eds.)].CambridgeUniversityPress,Cambridge, United Kingdom and New York, NY, USA, pp. 13271370.
3. Pereira, J.J., Hunt J. C. R. & Chan, J. C. L.2014. Science and Technology for Disaster Prevention and Climate Resilience in Asia. ASM Science Journal 8(1): 1-10
4. Pereira, J.J., Komoo, I., Tan, C.T., Che Moin Umar & Lian, K.F. 2012. Climate Change and Disaster Risk Reduction. ASM Series on Climate Change, Academy of Sciences Malaysia, Kuala Lumpur.

Ir. Prof. Dr Ruslan Hassan is currently the IEM Vice President and a Fellow of Academy of Sciences Malaysia. Presently he is attached to the Malaysia Institute of Transport (MITRANS) and Universiti Teknologi MARA (UiTM). He researches, consults and teaches Sustainability Design in Practice.
Sustainability emerged from the “sustainable development” concept. Sustainable development1 is deined in the Brundland Commission Report [1] as meeting the needs of the present without compromising the ability of future generations to meet their own needs.
At present, the human population is not approaching sustainability. Wackernagel et al., [2] provides evidence that our demand for natural resources has rapidly increased in the last few decades. In 1961, demand corresponded to 70% of Earth’s capacity for biological productivity; by 1980s, demand began to exceed the biosphere’s capacity, and by 1999, we were using 120% of Earth’s natural resources. In other words, it would require 1.2 earths to regenerate what was used in 1999. Clearly, this does not meet the test of sustainability.
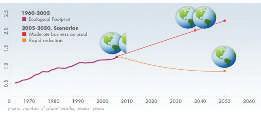
Source: Wackernagel et al.,[2]
Sustainable development must achieve the due balance of environment, economy and the society. Development is the sum of our products and projects, i.e. application of technology. In these applications, engineers carry out, influence or decide on the options evaluated, the decision making criteria as well as the detailed design and implementation/ production. For the development to become sustainable, engineers must incorporate ‘sustainability’ into the planning and engineering of products and projects. Sustainability is the ability to maintain to perpetuity or the capability of being maintained whereas sustainable design goal is to produce objects using only renewable resources and which, in operation, will deplete only renewable resources.
The design perspectives should be able to achieve the following:
1. Long-term design
2. Use more from less
3. Closing loop
1. Long-term design through Nature-Inspired Algorithms
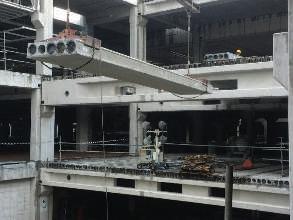
Through years of evolution, Nature has been surviving. Biomimicry is emulating Nature's best biological ideas to solve human problems. The popularity of the Nature-Inspired Algorithms is primarily influenced by the ability of biological systems to effectively adjust to a frequently changeable environment. Swarm intelligence has been of great interest for many research scientists in the last decade. Bonabeau [4] has defined swarm intelligence as designing algorithms or distributing problem-solving devices based on the collective behaviour of animal societies and social insect colonies. The core of this study is to develop meta-heuristics by adopting the insect problem solving abilities. Many studies have been conducted on social insects such as termites, bees, wasps and ants. A good example is a beehive. However the logic can also be extended to other insects withsimilarbehaviour.Anantcolonyandaflock of birds can be categorised as “a swarm”. The Particle Swarm Optimisation (PSO) Algorithm was developed based on the social behaviour of flocks of birds or schools of fish. Some of other algorithms developed are Ant Colony, Wasp Nests and Firefly Algorithms. An artificial Bee Colony Algorithm is a population-based swarm intelligence optimisation technique developed by Karaboga in 2005 [5]. This algorithm is based on the behaviour of honey bees when foraging for food. The honey bees use different methods such as a waggle dance to locate optimal food sources and reaching new ones [6].

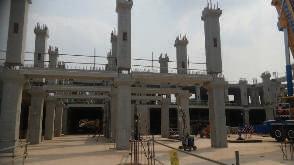
The Eastgate Centre & Office block in Central Harare, Zimbabwe, is modelled after the local termite (Macrotermes michaelseni) mounds. It is ventilated and cooled entirely by natural means. Air is continuously drawn from the open space by fans on the first floor and pushed up vertical supply sections of ducts located in the central spine of each of the two buildings. The fresh air replaces stale air which rises and exits through exhaust ports on the ceiling of each floor. Ultimately this stale air enters the exhaust section of the vertical ducts before it is flushed out via chimneys.


Eficient Design: Use more from less
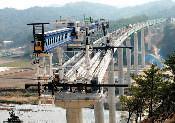
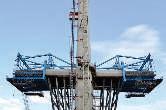
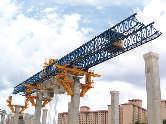
Solid circular columns are very popular for bridge pier designs, due to simplicity of construction and because its strength characteristics under wind and seismic loads, are similar in any direction. Circular elements are also used extensivelyascolumnsinbuildingsoraspilesforfoundations.
Hollow core circular concrete members are used less structurally than solid circular cross sections. However, these can be found in concrete chimneys, concrete pipes and elevated water tanks, as well as in large bridge columns and offshore platforms.
Some savings can be obtained when using hollow core circular columns. The economical convenience in the use of hollow columns is due to the cost saving afforded by the reduced section area (up to 70%). Furthermore, hollow columns are more efficient than solid ones from a structural pointof view. When the weight of the vertical members is relevant in the performance of the entire structure, a significant reduction in the seismic mass may be attained by using this structural type.
Even though shear transfer mechanisms are qualitatively well known, there is no agreement on the quantification of the shear strength of concrete members. Shear stress distributions on solid and hollow core circularcross-sections are very different. Whereas in the first, shear stresses are mainly vertical, in the second, shear stresses are assumed to act parallel with the boundaries of the section. In the former, shear crack pattern will be contained in a plane. In the latter, the crack pattern will not be contained in a plane but willform a helix of constant pitch in the space, and will form a straightline in the surface of the unfolded cylinder.


This statement has been proven theoretically and is experimentally correct [7].

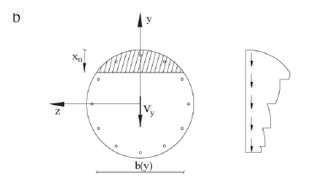
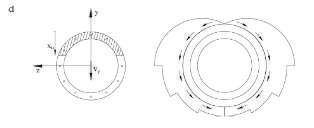
The fact that shear stresses have a different orientation in both section types, linked to the fact that the shear reinforcement does have the same geometry for both structural types, leads to the evidence that the stirrups or spiral reinforcement are not equally effective in solid and hollow core circular sections. Transverse reinforcement will be more efficient in those section types where shear stresses better align with the shear reinforcement. Circular or spiral stirrups will be more efficient in hollow core circular specimens than in solid ones [7].
3. Closing the loop design through Ecological Engineering
Ecological Engineering Principles.
EcologicalEngineeringisdefinedasthedesignofsustainable ecosystems that integrate human society with its natural environment for the benefit of both [8]. The design consists of Energy Augmentation Self-organisation/self-design and adaptation [9].
a. Energy Signature: The set of energy sources or forcing functionswhichdetermineecosystemstructureandfunction.
Energy Sources that affect an ecosystem are:
• Sunlight as primary energy source of the ecosystem
• Organic inputs, which is detritus concept in stream ecology and estuaries
• Auxiliary energies (apart from sunlight and organic matter) which reduce the cost of internal selfmaintenance and increase the amount of other energies which can be converted to production.
The augmentation of energy through design by existing appropriate energy signatures to support the ecosystem being created. The subsidies are water, fertiliser, aeration or turbulence for encouraging wetland species by adding these to the source of water. Stressors can be added, such as pesticides to limit the development of the ecosystem (i.e. adding herbicides to control invasive, exotic plant species).
b. Self-organisation: The selection process through which ecosystems emerge in response to environmental conditions by filtering of genetic inputs (seed dispersal, recruitment, animal migrations etc.). Self-organisation is the process in which species composition, relative abundance distributions and network connections develop over time. The mechanism of self-organisation is a form of natural selection of these species which reach a site through dispersal. The species in the ecosystem has found a set of favourable environmental conditions to support a population of sufficient size for reproduction.
Self-organisation helps to guide self-design by allowing natural selection to organise the systems. The best species can be preferentially seeded into a particular design or Nature can be allowed to choose the appropriate species. Excess seeding of many species is provided and self-design occurs automatically.
c. Pre-adaptation: The phenomenon of adaptation that arises through natural selection for one set of environmental conditions just happen also to be adaptive for a new set of environmental conditions that the organism has not been previouslyexposedto.Self-organisationcanbeaccelerated by seeding with species that are preadapted to the special conditions of the intended system. It requires the knowledge ofdesignconditionsoftheecosystemtobeconstructedand the adaptation of species. Adaptation by species occurs through Darwinian evolution along environmental gradient.
Pre-adaptation by design is done by taking advantage of the principle of biodiversity prospecting and knowledge of the niche concept. New systems developing with pollution are sources of preadapted species for treatment ecosystems. Invasive exotic species are successful due to preadaptation to human disturbance and the seed sources through ecological engineering.
Application
The principles are then adopted in the design of the ecosystem in the improvement of water quality [10].
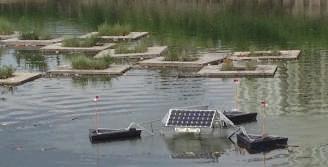
The energy augmentation through solar aerators allows for self-organisation or self-design and the vertiver plants adapted for the present environment thrive in the pond ecosystem.
Engineers need to play more active roles in the use of renewable resources of nature for a balance approach to development. There is a need to be resilient and innovative as well as to design for impact-proof and to take the noregrets options route. Sustainability design will achieve the objectives by adopting the approaches presented, namely:
• Long-term design through biomimicry
• Structural optimisation through using less materials
• A close system, not unlike ecosystem, to be used through ecological engineering for a closed-loop approach.
[1] Wackernagel, M., N. B. Schulz, D. Deumling, A. Callejas, M. Jenkins, V. Kapos, C. Monfreda, J. Lohi, N. Myers, R. Norgaad, J. Randers (2002). Tracking the ecological overshoot of the human economy, Proceedings of the National Academy of Sciences, 99, 14, 9266-9271.
[2] Brundtland Commission Report. (1987). Our Common Future, World Commission on Environment and Development.
[3] McKeag, T. How Termites Inspired Mick Pearce’s Green Building, Greenbiz., Zygote Quarterly, 2009.
[4] Baykasoglu Adil, Ozabakir Lale, Tapkan Pinar, “Artificial Bee Colony and its Application to Generalised Assignment Problem”, I-Tech Education and Publication, 2007.
[5] D Karaboga, Technical Report-TR06, “An Idea Based on Honey Bee Swarm for numerical Optimization”, Erciyes University, 2005
[6] Kamalam B, Karnan M, “A Comprehensive review of ABC Algorithm”, IJCT, Volume 5, No:1, 2013.
[7] Turmo J, et al., Shear truss analogy for concrete members of solid and hollow circular cross section. Engineering Structures (2008).
[8] Mitsch J and S.E. Jorgensen (eds). Ecological Engineering, John Wiley & Sons, New York.
[9] Kangas, P.C.Ecological Engineering: Principles and Practice, Lewis Publishers, 452p.
[10] Ruslan, H, amd Azman A, River of Life (ROL) Project Report, Sg. Klang 7th. Initiative, 2014.
Title: 30th Annual General Meeting of Building Services Technical Division, IEM 13 August 2016
Organisedby :BuildingServicesTechnicalDivision Time :11.00a.m.–1.00p.m.
CPD/PDP :2
Title: Pre AGM Talk & 12th AGM of Project Management Technical Division, IEM 20 August 2016
Organisedby :ProjectManagementTechnicalDivision Time :9.00a.m.–1.00p.m.
CPD/PDP :Applying
Kindly note that the scheduled events below are subject to change. Please visit the IEM website at www.myiem. org.my for more information on the upcoming events.


The recent heat wave that hit Peninsular Malaysia from February to May 2016 resulted in a 100% hike in electricity consumption per household as more people switched on air-conditioners to make their homes more comfortable. While accepting that energy cost would be proportionate to the amount used, what house owners had not expected was that Lembaga Letrik Negara (LLN) would impose a tariff hike if the electricity consumed was above average. There was a huge uproar and lots of complaints via the media.


In his press statement released on 26 April 2016, IEM President Ir. Tan Yean Chin, called for a reexamination of this issue of high energy cost attributed to climate change. What kind of collective action is required to reduce electricity costduetohighconsumptionofair-conditioning? Why collective action?
Without doubt, the recent heat wave is a phenomena of extreme environmental degradation experienced in various parts of the world which includes flooding (south China), cyclones (United States and Australia) and forest fires (United States, Australia and Canada), etc. Closer home, as recently as 2014, the whole of Kota Baru and many parts of Kelantan, Terengganu and Pahang were submerged in flood waters for days. The calamity resulted in huge losses in assets. On 19 September 2015, Dato’ Ir. Lim Chow Hock, former IEM President, said the advent of climate changes had brought untold miseries to mankind due to our poor adaptation, but added that the root cause could be traced to irresponsible activities of mankind themselves. Uncontrolled deforestation, for instance, might have contributed to the flooding in Kota Baru. “The whole data set needs to be revised in assessing the flood occurrence,” Dato’ Ir. Lim pointed out. Is the building of more terrace houses in urban areas an act of irresponsibility?
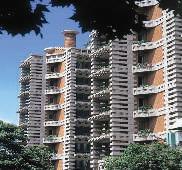
A number of studies conducted in the past, concluded that large urban centres that were geographically wide-spread with landed properties (such as Los Angeles, United States) emitted more greenhouse gas (GHG) than urban centres with vertical high-rise buildings (such as Hong Kong and Singapore). See (Sullivan 2015). The logic in effect, is easy to explain. Typically,
the roof/envelop area of a terrace house is 2.5 times larger than a unit of eight-storey high-rise apartment (Straube 2006). As a result, it emits more heat into the immediate environment after absorbing heat from the sun. To compound the issue, residents of terrace houses in Los Angeles and Kuala Lumpur had a tendency to drive cars to work and this resulted in more GHG emitted per person. On the other hand, high rise city dwellers in either Hong Kong or Singapore, usually took public transport to work, contributing less GHG per person.
Given the gravity of the situation, a large amountofresearchhasbeendoneinUCLAsince 1981 on climate changes in Los Angeles (Boxall 2016). Climate scientists at UCLA’s Institute of the Environment and Sustainability (IoES) predicts a rise of 3-5oF in southern California in the next 30 years. And mind you, one can expect the temperature to exceed 950F (32oC).
Unfortunately, the Greater Kuala Lumpur is in the same category as Los Angeles in terms of energy utilisation, though on a smaller scale. According to the 11th Malaysian Plan, 25% of the total residential houses in Greater Kuala Lumpur comprise terrace houses. It’s the same situation in Los Angeles where 26% of total residential houses are landed properties.
During the hot season, as in February-May 2016, 24.7% of residents of terrace house in Greater Kuala Lumpur switched on 8-12 hours of air-conditioning a day at home to create a more conducive indoor environment (Pang 2016) and 61.8% of terrace house dwellers turned on the air-conditioning for 4 hours or more a day (Pang 2016). This meant the national grid line was put under acute stress during that period since it had not anticipated that 50% of the optimum capacity would be used by household consumers alone (Pang 2016). What then are the mitigation measures implementable in terrace houses?
Very little effort is evident as M.M.Tahir (2010) remarked: “The liveability index for terrace housing in Malaysia, in this respect, has never been analysed. Mundane design, inflexibility of spaces, ad-hoc renovations as well as poor ventilation, lighting and thermal comfort have resulted in an unacceptable housing culture in urban and sub urban community areas in Malaysia.”
A passive cooling system is one that will cool a building to an acceptable temperature without the use of mechanical means such as air-conditioning. The concept of a passive cooling system is achieved in two ways: To prevent heat from entering a building or to eliminate heat that enters a building (Choudhary et al., 2014).
To do this, one way is to use better materials of lower U-values. The second is to consider the function of a heat sink so that excess heat is transferred to a heat sink. For example, if the outside air is cooler, heat is transferred outside through convection.
We will discuss briefly some of the materials commonly used to prevent heat entering a building (walls, roofs, and windows, as these materials can relate to our daily experience) as well as a more holistic way of viewing heat flow.
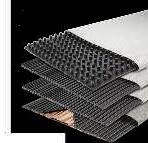
Using lower U-values materials: For walls, materials having lower U-values are more resistive to heat flow. Figure 1 shows that softwood is better than lightweight concrete (Wong & Chan 2012). So a terrace house with a large panel of glazing is hardly a good choice. More findings from Mallick (1996), Tenorio (2002), and Mahlia et al., (2007).
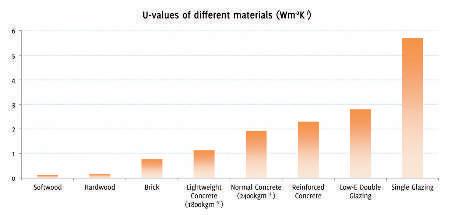
Source: Wong and Chan (2012)
For the roof, Quick’s (2012) new roofing system includes a passive ventilation system that pulls air that has gone inside the house from the underbelly of the attic, up into an inclined air space above the roof so it can be carried up and out. It also features controls for radiation, convection and a foiled covered polystyrene insulation. See Figure 2. More findings from Straube (2006), Bahrami (2008), Ahmad Al-Yacouby et al., (2011), and Lau et al., (2008).
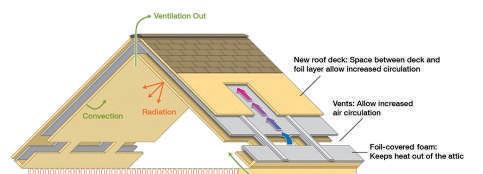
Source: Quick (2012)


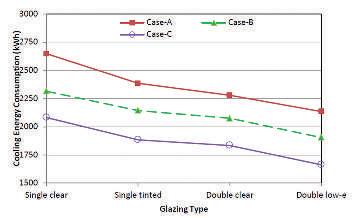
For windows, Figure 3 shows that replacing single clear glass with single tinted glass reduces the annual cooling energy consumption by 7% to 9.5%. In addition, using double clear glass results in reduction of about 10% to 13.5% in energy consumed. More findings from Moorjani (2014), and Kim et al., (2012). This also explains the large number of cars in Malaysia fitted with tinted glass.
Holistic way of viewing heat low: Why holistic? If we focus on savings derived from individual components (walls, roofs, and windows), this may mar us from seeing the big picture.
The energy crisis of 1970s promoted the development of environmentally friendly buildings that took the style of passive thermal designs, energy efficient buildings, and green buildings (Zhu & Lin 2004). However, these concepts were not applied to the local scene for terrace houses due to high initial capital costs (Pang 2016). House-owners who do, however, may be amply rewarded in the long-run in terms of reduced operating costs (Choudhary 2014; Markus & Morris 1980; Santamouris et al., 1998).
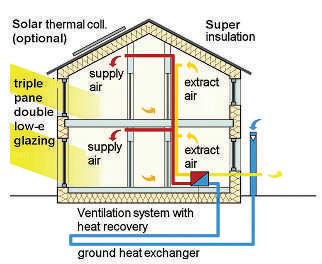
If one relaxes the criteria for passive cooling systems to include installing a heat exchanger, a more pleasant indoor environment may be created (Ludeman 2008). See Figure 4. In a similar vein, the “Passivhaus” design standard proves its effectiveness in the West as the ultra-low-energy buildings provide excellent indoor ventilation (Puckett 2016).

For research in this area in Malaysian context, see Arif (2010), Asif (2006), and Zaki et al., (2012). Clearly, more research and more promotion by stakeholders such as consultants, developers, and the State in this area are required.
How did residents of terrace houses in Greater Kuala Lumpur cope with the heat wave? Did they understand that materials and house design could have an impact on indoor air quality?
According to Yuan (1987, cited in M.M. Tahir et al., 2010), the main causes of climatic stress in Malaysia are high temperatures, solar radiation, humidity and glare. Yuan (1987) also noted that to achieve thermal comfort in our warm,humidclimate,solarheatgainbythebuildingandthe human body must be minimised while heat dissipation from the body must be maximised by ventilation and evaporative cooling.
In a survey conducted in Greater Kuala Lumpur in 2015, survey questionnaires were sent to 100 terrace house residents by mail to solicit their response on the level of comfort (Pang 2016). Of these, 81 responded. See Figure 5.
Awareness about the Thermal Problem/Heat Discomfort within the Terrace House and the Relation between Plant, Shading and its Function to Increase the Level of Outdoor Thermal Comfort within their Housing Area
Avoid East/West facing house
Aware of the coolness of North/South facing house
Enough space/area for landscaping with view to reduce heat
Know how to arrange plant/trees to increase outdoor thermal comfort
Important to use plant (trees & shrubs) to reduce outdoor thermal problems in east and west directions
Important to have a lot of shading devices/curtains
Aware shading can reduce outdoor thermal problem
Heard about thermal problem in terrace house
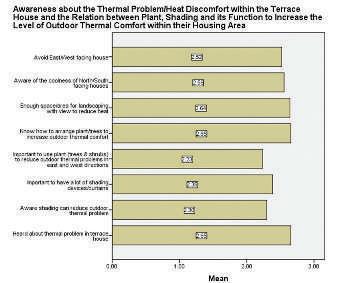
Source: Pang (2016)
From the survey, it appeared that most terrace house residents understood the factors affecting thermal comfort (example, mean score of 2.65 about thermal problem in terrace houses). But as houses were purchased from developers, there was little they could do about the design. Therefore, any approach to mitigate climate change where terrace houses play a part, necessitates the participation of developers.
Separately, a panel of 10 experts from the built environment industry was asked about the current issues with respect to climate change and its impacts on residents of terrace houses (Pang 2016).
These experts shared the same view as the 81 residents in at least five areas. First was that more vent blocks would improve cross ventilation. Second, window design should preferably be in the direction of the wind. Third, a large overhang will shield the house from the sun’s rays. Fourth, the internal layout should allow cross ventilation. Fifth, a “stack effect” can be achieved in the presence of a courtyard or
air well (James 2007). Sadly, most terrace houses no longer incorporate this feature in their designs to produce a stack effect. See Figure 6.
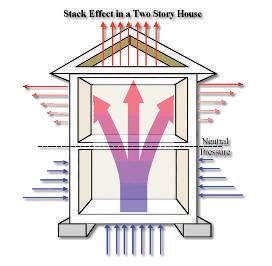
James (2007)
Asmentioned,mostdeveloperswentforaestheticsrather than function, so most terrace houses were uncomfortable for the inhabitants.
The term “collective action” may be new to the average reader. To an economist, it refers to the rational behaviour expected in the use of general, public goods. Public goods belong to the state; they are not private-owned. Examples of public goods are the air that we breathe, the water that we get from rivers and neighbourhood parks where residents can spend their leisure hours. Unlike private goods (such as cars and houses), public goods are often subjected to abuse, waste and under investment for obvious reasons.
Since local air quality is a form of public goods, it calls for extraordinary effort by all stakeholders to keep temperatures from rising beyond control, which is the focus of this article.
If terrace houses are private goods or private properties, the excessive use of air-conditioning by the inhabitants raises the pertinent question about the latter’s role in development. There must be ways to reduce the use of air-conditioning in terrace houses, especially during a heat wave and the ability to create a local quality environment calls for solutions beyond materials used and design as proposed by developers.
The key, among others, is the behaviour of stakeholders such as consultants, developers and residents of terrace houses. How can less air-conditioning be used in terrace houses?
In the common pool resources (CPR) literature, public goods, such as air, are CPR. The most well-known theoretical framework that helps researchers investigating the CPR is Ostrom’s (2005, cited in Poteete, Janssen, and Ostrom, 2010, p. 41) institutional analysis development (IAD) framework, where four determinants are studied: Context, nature of products, attributes of the community and rules of use.
First, when terrace houses are dominant in urban settings such as in Greater Kuala Lumpur, more sensitivity is required. Should we build less terrace houses? Second, the public policy on the use of air-conditioning must be re-defined. Should a surcharge be imposed? Third, since occupants of terrace houses belong to the middle income group, how can they be made more sensitive about climate change and the use of air-conditioning? Obviously, a new approach to education must be introduced.
Fourth, while formal rules to curb the use of excessive airconditioningappeartomakelittlesense,informalconstraints must be promoted. We should cultivate a new culture with regards to the use of air-conditioning. To put it differently, a new paradigm shift where there is less use of air-conditioning in terrace houses, must be promoted.
Given the monstrous tasks that challenge our ability to manage climate change due to excessive use of airconditioning in terrace houses, a new understanding about our habitat, which is formed by terrace houses, must be further researched. To allow the unlimited use of electricity “as long as one can afford it” is clearly an act of irresponsibility. We ought to move upwards, and hopefully be more enlightened to place society’s greater interest above our personal comfort in keeping a conducive indoor environment. Climate change means global warming. As it is, there are signs that the trend is becoming irreversible.
[1] Al-Yacouby, AM, Khamidi, MF, Nuruddin, MF, Idrus, A, Farhan, SA & Razali,AE, 2011,‘AReview on Thermal Performance of Roofing Materials in Malaysia’, in Proceedings of the International Building and Infrastructure Technology, Penang, Malaysia.
[2] Arif, IZ, 2010, ‘Effects of Variation of Construction Materials on Thermal Comfort Using CFD Simulation’, Thesis, University Teknikal Malaysia Melaka, viewed 3 August 2015, Melaka, Malaysia.
[3] Asif, ASA, 2006, ‘Thermal Comfort of Low-Cost Housing in Hot’, Department of Civil Engineering, Bachelor thesis, Universiti Teknologi Malaysia, viewed 25 October 2015.
[4] Bahrami, S, 2008, ‘Energy Efficient Buildings in Warm Climates of the Middle East: Experience in Iran and Israel’, International Institute for Industrial Environment Economics (IIIEE), Sweden.
[5] Boxall, B, 2016, Climate Change Won’t Dry Up Southern California, Los Angeles Times, viewed 26 June 2016, <http:// www.latimes.com/science/sciencenow/la-sci-sn-climate-changeprecipitation-southern-california-20141211-story.html>.
[6] Choudhary, S, Thakur, MS & Dogne, N, 2014, ‘Passive Cooling Techniques, Design Concept and Ventilation Techniques’, in AICMT: National Conference on Alternative & Innovation Construction Materials & Techniques, Gwalior.
[7] Hassan, AS & Al-ashwal, NT, 2015, ‘Impact of Building Envelope Modification on Energy Performance of High-Rise Apartments in Kuala Lumpur’, International Transaction Journal of Engineering, Management, & Applied Sciences & Technologies, vol. 6, no. 3, pp. 91–105.
[8] James, F, 2007,Windows Orientation and Shading,viewed 13 August 2015,<http://www.fsec.ucf.edu/en/consumer/buildings/ homes/windows/shading.htm>.
[9] Kim, JT, Shin, JY & Yun, GY, 2012, ‘Prediction of Discomfort Glares from Windows: Influence of the Subjective Evaluation of Window Views’, Indoor and Built Environment, vol. 21, no. 1, pp.92–97.
[10] Lau, KK, Salleh, E & Lim, CH, 2008,‘Thermal Performance Evaluation of Roofing Systems and Materials in Malaysian Residential Development’, Humanity and Technology.
[11] Ludeman, C, 2008,Passive House (Passivhaus) Standard for Energy Efficient Design, viewed 5 July 2015, <http:// www.100khouse.com/2008/04/10/passive-house-passivhausstandard-for-energy-efficient-design/>.
[12] Mahlia, TMI, Taufiq, BN & Ismail, HH, 2007,‘Correlation between Thermal Conductivity and the Thickness of Selected Insulation Materials for Building Wall’, Energy and Buildings, vol. 39, no. 2, pp.182–187.
[13] Mallick, FH, 1996, ‘Thermal Comfort and Building Design in the Tropical Climates’, Energy and Buildings, vol. 23, no. 3, pp.161–167.
[14] Markus, TA & Morris, EN, 1980,Buildings, Climate and Energy, Pitmen Publishing, London.
[15] M. M. Tahir et al., 2010, ‘The Concept of Raised Floor Innovation for Terrace Housing in Tropical Climate’, Journal of Surveying, Construction & Property, vol. 1, issue 1.
[16] Moorjani, VB, 2014, ‘Assessing the Effects of Glazing Type on Optimum Dimension of Windows in Office Buildings’, in 50th ASC Annual International Conference Proceedings.
[17] Quick, D, 2012, ORNLRoof-and-Attic System Keeps Houses Cool in Summer, Warm in Winter, viewed 13 July 2015, <http://www. gizmag.com/ornl-roof-and-attic-system/24083/>.
[18] Ostrom, E, 2005, Understanding Institutional Diversity, Princeton UniversityPress, California.
[19] Pang, HN, 2016, ‘A Study on the Material Effectiveness of Terrace Housing in terms of Thermal Comfort’, Bachelor thesis, Department of Quantity Surveying and Real Estate, Tunku Abdul Rahman University College, Malaysia.
[20] Poteete, AR, Janssen, MA, &Ostrom, E,2010, Working Together: CollectiveAction, the Commons and Multiple Methods in Practice, Princeton University Press, Princeton and Oxford.
[21] Puckett, K, 2016, ‘A Sign of Times’, Modus, vol. Q2, 2016, pp. 3840.
[22] Santamouris, M, Allard, F& Alvarez, S, 1998,Natural Ventilation in Buildings: A Design Handbook, James and James (Science Publishers) Ltd, London.
[23] Straube, J, 2006,Energy Efficiency In Buildings,viewed 10 June 2015,<https://sites.google.com/site/reeetech/energy-efficienthome/green-building-design>.
[24] Sullivan, M, 2015, Heat Waves Becoming More Prominent in Urban Areas, viewed 26 June 2016, <http://www.environment. ucla.edu/newsroom/heat-waves-becoming-more-prominent-inurban-areas-research-reveals/>.
[25] Tenorio, R, 2002, ‘Dual-Mode Cooling House in the Warm-Humid Tropics’, Solar Energy, vol. 43-57, no. 73, pp. 1.
[26] Wong, WS & Chan, HW, 2012, Energy and Use of Energy: Calculation and Application of OTTV and U-value,Hong Kong Institute of Architects.
[27] Yuan, LJ, 1987, ‘The Malay House: Rediscovering Malaysia’s Indigenous Shelter System’, Institute Masyarakat, Kuala Lumpur.
[28] Zaki, WRM, Nawawi, AH & Ahmad, SS, 2012, ‘Environmental Prospective of Passive Architecture Design Strategies in Terrace Houses’, Procedia - Social and Behavioral Sciences, vol. 42, no. 2012, pp. 300–310.
[29] Zhu, Y & Lin, B, 2004, ‘Sustainable Housing and Urban Construction in China’,Energy and Buildings, vol. 36, no. 12, pp.1287–1297.

Ir. Dr Oh Seong
Por is Director of Manufacturing, Samsung SDIEM. He has 25 years working experience in high volume production of Lithium Ion Battery and in electronic industry and manufacturing. He is involved in the commissioning of machines, improving process, product reengineering and product quality improvement.
Green Technology, as deined by the Ministry of Energy, Green Technology & Water, is the development and application of products, equipments and systems used to conserve the natural resources and environment, thereby reducing the negative impact on humans.
The key approaches in green technology are:
a) To eradicate or replace ways of doing things, which can pollute the environment.
b) To reduce waste such as excessive consumption of materials or ineffective utilisation of energy that contributes to global warming.
After the industrial revolution, the rapid development and mass production of a variety of goods had exponentially increased the use of raw materials and energy. As more products are manufactured, more residual waste is generated, posing a greater risk of damage to the environment. While efforts to reduce waste help to improve product competitiveness, these also contribute a positive spillover effect to protect the environment. As such, responsible manufacturers are adopting total waste reduction product management or industrial ecology. It involves total product life cycle thinking, starting with product design and ending with its disposal at the end of its operational life.
Total waste reduction means designing, manufacturing and distributing products in a way that utilises less materials, less energy and, if possible, a high proportion of recycled materials without comprising intended function or quality of the product. One such green technology in product development is the Lean Product Design.
Lean Product Design or LPD was established using the lean principle as mooted by James Womack. It is a systematic approach to identify and eliminate waste or non-valueadded design features embedded in a product, with the objective to save resources, therein improving product competitiveness. It aligns to the green technology initiative
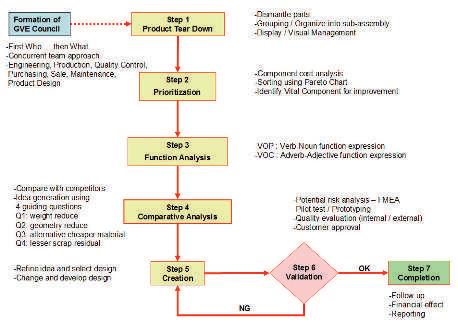
in product designs which strive to conserve resources like material, human effort, energy and space while speedily creating product value that excites customers. LPD consists of 7 steps in which the design engineer can gather valuable information about the product, interpret it into technical attributes with an acceptable lean level and later integrate it into the manufacturing of product.
This article has been prepared to illustrate LPDflowdevelopedbyOh(2011).Itisorganised in 2 sections. Section 1 describes the 7 steps of LPD while Section 2 demonstrates the case study of a major electronic manufacturing company in the country which enjoys higher product competitiveness while at the same time fulfills the corporate vision to adopt green technology to protect environment from excessive pollution and global warming.
The following sub-sections offer a brief description of the 7 steps of LPD.
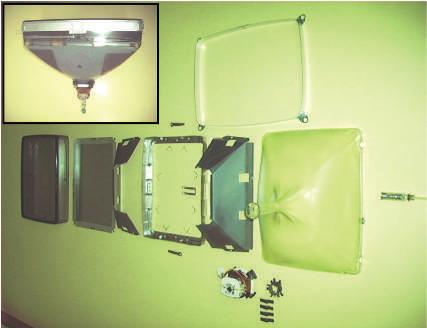
It uses the product tear down technique to dissect completely a product under study, down to every individual component or part. Product tear down serves 3 primary purposes: i. To gather the baseline information pertaining to the evolution of a product and its related components.
ii. To understand how things work.
iii. To exercise competitive benchmarking whereby similar products or components manufactured by competitors are compared, measured and examined. Before this is done, several important preparations are needed. First is to determine the testing sample such as quantity, type, model etc. Next is to identify the best method

of dissecting the product. A non-destructive method is preferred so that components can be reassembled to its original form for further comparative analysis. However, if this is not possible, the raw components (before processing) can be utilised for investigation.
The product tear down also puts stress on visible management. The intention is to have all the dissected individual components displayed in an orderly manner and visible to the design team members. The components are exposed and easily accessible for design team members to hold, feel and examine. The idea here is to create a conducive environment for the team members to use their senses (such as vision and touch) to the fullest, thereby allowing them to generate creative and innovative new design.
Tear down components are numerous and improving them all together poses not only great difficulty but also ineffectiveness. Therefore this step is necessary to prioritise all componentsandtoidentifythemajoronesforimprovement. Since the ultimate goal is to reduce cost associated with material usage, it is natural to prioritise components according to the component cost per unit of product. The statistical tool used for this exercise is the Pareto Chart. Once completely constructed, this chart will display the principle 80/20, which simply states that 80% of the total product cost is contributed by 20% of a few vital components. Focusing on re-designing vital few components is essential in lean product design.
The objective of function analysis is for the design team to understand what and how every vital component works. The verb-noun expression, which originates from “value analysis” is applied to describe “what” is the use of a component and “what” it is designed for. It is the Voice Of Product (VOP). Another accompanying adverb-adjective expression is also used in LPD to assess component function from the customer’s perspective. This is the Voice Of Customer (VOC). It states the customer’s wishes on the function of a component. Three situations involving the relationships between VOP and VOC can occur that will trigger different design improvement approaches.
Case 1: VOP < VOC. Customer expectation is higher than what the component function can provide. Therefore redesigning to improve or add better function is the main priority.
Case 2: VOP = VOC. The component function fulfills the requirements of the customer. New or added functions may not be necessary. However re-designing the component to reduce the cost or resources of creating the function can be applied, for example, using alternative lower cost materials or recycled materials to make the component while maintaining the same function and quality level.
Case 3: VOP > VOC. There is excessive or non-valueadded design in the component which does not serve the needs of the customer. This is a good opportunity to seek out the excessive design and conserve resources while driving
PRETECH (MALAYSIA) SDN. BHD . 28, Jalan 7/108C,Taman Sungai Besi, 57100 Kuala Lumpur.
Tel: +603-7980 2728
Fax: +603-7980 5662 www.epmsb.com.my (184774-P)
down cost, for example, using thicker material to make component although a thinner dimension is sufficient to serve the same purpose required.
2.4
Comparative analysis is adopted from the Tear Down Design concept. Here, similar products from rival competitors are dismantled, exposing all the components (see Step 1). The tear down components which correspond to the vital ones, are compared so that new breakthrough improvement ideas can be developed fast. Four probing questions are used as guidelines in comparative analysis. These are:
Q1. What feature can be reduced/removed to cut down weight or processing resource like energy or water?
Q2. Is there any design geometry that can be minimised or simplified to reduce material consumption or human effort to make?
Q3. Is there a cheaper alternative material to replace existing material or can existing material be recycled without causing degradation to the basic function of the component?
Q4. Is there an alternative method which can be applied to cut down raw material scrap residual without incurring high investment?
This is where design targets generated from the comparative analysis study, are put into practical design attributes of component. Every idea is thoroughly discussed, debated and scrutinised before the final design is picked for implementation. The decision is mainly influenced by the following factors:
i. Four guiding questions related to the reduction of weight or processing resources, minimisation of geometry or simplification of shape, replacement with cheaper material or recycling material and effective manufacturing method to make component with minimal scrap residual.
ii. Ability of supplier to manufacture the proposed new design of component.
iii. Acceptance of customer to use new component in the product.
iv. Adaptation of the proposed new design to the existing machine, process and method of production without incurring high cost.
2.6
Thisisthedesignrefinephasetovalidatethedesignattributes.
The results of the validation conclude the integration of design attributes into the manufacturing of the product. As such, strict procedures are to be observed, such as:
i. Identifyingorpredictingthewaysinwhichthenewdesign can fail and prioritising an action plan to reduce the risk by using Failure Mode and Effect Analysis or FMEA.
ii. Conducting a pilot production using sample new design components to build the prototype. This is to verify the actual performances against the design intended functions.
iii. Drafting and finalising the specifications needed to govern the “effective” usage of the new design component in the process and production lines. The main specifications are:
a) Standard working manual for operators to handle product.
b) Process and machine setting specifications of each work station.
c) Incoming quality control specification of new design component.
The verification of real life prototype running data from internal and external sources is another important task of validation. Essential internal data is quality reliability, defect rate, incoming quality (CpK value) of new components, process specification and overall machine efficiency. Important external data is fallout rate at customer line. The above validation procedures are illustrated in Figure 1.
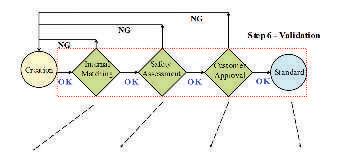
Internal Matching
-Identify possible failure when applied to machine and process
-Apply FMEA
-Take preventive action
-Verify product function and quality requirement
Safety Assessment -Fulfillment of safety requirement as stipulated by the safety hazard regulatory body -Obtain Certificate of Fitness for User.
-Feedback safety test result for continuous improvement
Customer Approval
-Confirmation of product performance as applied at the customer line.
-Gather VOC for improvement -Obtain customer consent
Standard -Drafting, revising and issuing of standard operating documents. -Finalizing specifications for new design component, process and machine settings.
In this final phase of the LPD, two major tasks are required, namely follow-up and reporting. The main follow-up areas are:
i. Consistency of supplier in supplying new component that complies to new design specification.
ii. Adaptability and suitability of component being used in the work stations for making finished product.
iii. Final product quality performance at customer side. The completion of the project needs to be documented and reported to the management. The contents of the report comprisse design changes, appointed suppliers, financial impact gained from product leaning, investment, quality performance of the product and impact to environment. Figure 2 summarises the 7 Steps of Lean Product Design.
Product Component Redesigned Attributes
Glass PanelExcessive design. Reduced center thickness : 13mm 9.5mm Unit weight reduced by 600g.
Steel Mask Replaced harder invar material with aluminum killed steel.
Filming Solution
Benchmarked competitor. Replaced filming solution B74 BFE.
Steel Frame Excessive thickness design. Reduced raw material cold rolled carbon steel : 1.0mm 0.8mm.
Deflection YokeRedundantfunction part. Removed balance copper coil which function can be cover by cheaper existing ferrite sheet.
Rare Earth Red Phosphor
Steel Part Lubricant
Complete Display Product
Excessive high spec mixing of phosphor solution. Changed mixing recipe to fit for reclaimed phosphor application.
Benchmarked from competitor. Replaced lubricant for steel part press forming with vegetable based oil.
Reduction in weight with slim geometry shape.
Reduction in process heating time and temperature by 33min and 15 degree Celsius
Eliminated redundant heat treatment process for invar.
.
Eliminated baking process to diffuse filming coating.
Reduction in scrap residual weight from the frame press forming process : 70g/unit.
Reduction in copper material consumption.
Reduction in the usage of fresh red phosphor material.
Vegetable oil based lubricant easily diffused thru heat treatment process. Eliminated the usage of TCE to degrease steel parts.
Reduction in water usage to wash and process product.
Complete Display Product Slim geometry shape and size.Increased the stuffing quantity of display product into 40ft container: 1344 units 1512 units. Required container unit to transport product reduced.: 893 units 794 units.
CompanyA(nottheactualname) was a major electronics company which had been manufacturing display components for television sets since 1991 but it restructured its business operations in 2012. The company has now embarked on LPD to innovate its products, with the aim to improve product cost competitiveness as well as meet the organisation’s green policy to protect the environment by reducing waste and conserving resources such as energy and water. Table 1 describes the new design attributes created through the rigorous execution of LPD and its contributions to manufacturing and environment advantages.
Gained energy cost saving by 5.5%.
Gained energy cost saving by 1.3%.
Screen process lead time reduced by 2hrs. Gained energy cost saving by 0.9%.
Unit price reduction. Gained cost saving by 15%.
Unit price reduction. Gained coat saving by 6.25%.
Gained cost saving through reclaim and reuse of phosphor.
Shortened steel part processing time by 45min (no degreasing). Gained cost saving.
Reduction in water consumption by 9.7%.
Gained cost saving.
Gained transportation cost saving by 6.7%.
Reduction in energy consumption by 1.925 million kW/month.
Waste reduction by 108,500kg/month.
Conservation of copper raw material.
Reduction in slurry waste discharge to waste treatment pond by 3000kg/month.
Eliminated the usage of TCE, ozone depleting chemical/ Protect environment.
Reduction in water usage by 34,920 m3/month
Conservation of water.
Reduction in the number of container used contributes to lesser gas emission to environment.

Lean product design, which incorporates lean principles to eradicate design waste and create better value products for customers, is a noble approach that strives to not only improve business competitiveness but also to support the green technology initiative by effectively utilising energy and conserve resources. It fits in well with the lean thinking adage of “do more and more, using less and less while becoming closer to what customer wants”. Therefore it is worthwhile to pursue the lean product design.
[1] Gupta, P. (2005). The Six Sigma Performance Handbook, McGraw-Hill, New York, pp 421- 450.
[2] Fiore, C. (2005). Accelerated Product Development, Productivity Press, New York.
[3] Iyer, S.S. (2000). Value Engineering, New Age International (P) Ltd. Publisher, Delhi, pp 24.
[4] Nicholas, J. M. (1998). Competitive Manufacturing Management. McGraw-Hill Singapore
[5] Oh, S.P. (2011). Lean Product Design Concept, PhD thesis, University Technical Malaysia Melaka.
[6] Seba, T. (2014). Clean Distruption of Energy and Transportation, Clean Planet Ventures, Silicone Valley, California, USA.
[7] Womack, J.P. & Jones, D.T. (1996). Lean Thinking – Banish Waste and Create Wealth in Your Organization, Simon & Schuster, London.
IEM DIARY OF EVENTS
Title: Pre AGM Talk & 18th AGM of Agricultural & Food Engineering Technical Division, IEM
3 December 2016
Organisedby :Agricultural&FoodEngineeringTechnicalDivision
Time :9.00a.m.–1.00p.m.
CPD/PDP :Applying
Kindly note that the scheduled events below are subject to change. Please visit the IEM website at www.myiem.org.my for more information on the upcoming events.


by Ir. Shum Keng Yan
Ir. Shum Keng Yan is a chemical engineer and a certiied accident prevention and safety practitioner. He advises on EHS in the chemical, fast moving consumer goods, heavy metal manufacturing and building services industries across Asia Paciic and beyond. He regularly delivers talks at conferences, forums and universities.
In this the last part of the “Our Journey” exercise, let us see how we can move participants to the Acceptance phase.
The final lap, moving participants towards Acceptance, is to let them feel an actual situation that they might have gone through. At this stage, use stories again. We can easily link Our Journey to Driving Safety. It has all the elements for how to ensure a safe journey. At this stage, ask the participants’ what is the most precious item that they have transported in real life?
Some may be able to make a link between the item in the exercise with their loved ones whom they drive around on a regular basis. Ah, the light bulb moment!
Now invite each one in the group to share his/her story of an incident experienced when transporting the “item”! As the sharing begins, the participants will, inwardly, begin to feel their minds moving from Acknowledgement to something closer to Acceptance.
As I have discussed earlier, Acceptance is strongest when the person does it. Wrap up the workshop by asking participants to come up on stage to share the one thing they will do after the workshop! Since the participant is sharing “publicly” with friends/ colleagues, his/her commitment will be higher.
For a nice, appropriate souvenir, offer a small photo frame for the car where participants can place a photograph of their loved ones. This will be the Mental Hook. Each time the participant sees the photo, he/she will get a flashback of the Engagement Safety Training and the safety message will be reinforced.
Reinforce the lesson with reminders such as posters with pictures of the participants during the training or follow up with lessons on vehicle inspection to keep the engagement going. Invite some of the participants to be Driving Safety Champions to influence their own networks. It takes a bit of effort to keep the momentum going.
You do not need to show too many slides during the training. Much of the learning will be through activities and self-discoveries during the workshop. This is more fun than sitting through and listening to a lecture format.
I hope that the above example has clearly demonstrated the concepts on how to use a story/role play in designing Engagement Safety Training. We have used the 3As concept as well as planted some Mental Hooks along the way.
Are you ready to create some Engagement Safety Trainings of your own? If you want to discuss your ideas, contact me at: pub@iem.org.my.
The real journey starts after the end of the lesson.
The
BY CYRIL NOVEL, SENIOR SOFTWARE ENGINEER, BENTLEY SYSTEMS
The evolution of computing power over the past decade has advanced the development of photogrammetry software to the point where it can turn a set of photos of an object or an area into a 3D model. These software products compete with laser scanners, which are widely used throughout design, construction, and operations of infrastructure assets due to their fast acquisition time and remarkable accuracy. We can assess the accuracy of photogrammetry reconstruction by comparing outcomes when capturing and processing various scenes using Bentley’s ContextCapture software and laser scannergenerated point clouds.
For years, laser scanners have been widely used to capture existing conditions because they are fast, versatile for surveying purposes, and are accurate within millimeters. However, the scanning process can be tedious and the technology requires highly skilled, well-trained individuals in order to obtain a virtual 3D representation of the real world. In contrast, producing an accurate 3D model using photogrammetry requires only a camera of reasonable quality. Photogrammetric software can then automatically build the model using multiple pictures of the same object.
To assess the accuracy of photogrammetric reconstruction, wecompare3DmodelsreconstructedusingContextCapture with a 3D model created from terrestrial LiDAR point clouds. All of the datasets discussed were captured to determine whether photogrammetry can be used professionally to digitally document the types of complex projects usually completed with laser scanners.
The Penne Castle in the south of France was selected for comparison. The pictures for the reconstruction were taken with a typical digital camera, and the LiDAR data was captured using a terrestrial laser scanner. Gerpho, a team of professional aerial photographers, captured pictures of the castle from a plane at a distance of roughly 400 meters. The team used a Nikon D800 camera with a 36MP full frame CMOS sensor and a Nikon 70-200 lens. The photographers took 249 pictures with a focal length ranging from 139 millimeters and 201 millimeters. The picture dimensions were 7,360 by 4,912 pixels.
To perform the laser scanning data collection, Sompayrac Cianferani Prieu, a professional land surveyor, acquired a LiDAR point cloud processed by Geovast 3D. The 3D model features approximately 1 billion points after data uniication. A Leica HDS 7000 scanner was used with a ranging error within 2 millimeters. The surveyor registered 46 different scans – all within a maximum constraint of 6 millimeters deviation.
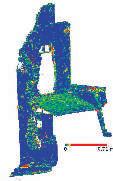
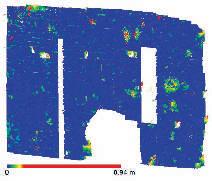
Using traditional laser scanning, the castle structure was captured in three parts:
• The corner wall with 4,991,330 points in the point cloud.
• A wall and a rooftop viewed from the bottom of the castle tower. This point cloud contained 27,831,695 points.
• Another wall from the tower in a point cloud containing 9,802,203.
Alternatively, Gerpho used ContextCapture to reconstruct ordinary digital photographs into a 3D model. The parameters for the aerotriangulation process (to compute the orientation and position of the pictures) were set to the defaults, and the parameters for the 3D reconstruction were set to “highest.” All 249 pictures were used for the reconstruction. The aerotriangulation functionality of the software made it possible to estimate the pixel resolution of the pictures – also called ground sample distance. The pixel resolution ranged from 8 millimeters to 1.5 centimeters, which meant that a pixel was roughly equal to 1 centimeter.
The images were georeferenced using seven ground control points established by Geovast 3D. The results of the photogrammetric processing was good; the model did not have holes and there were no other obvious errors in the reconstruction of the castle.
The results of the 3D photogrammetric reconstruction and the LiDAR point cloud were compared using CloudCompare. The 3D photogrammetric model was set as the reference and CloudCompare computed the distance from each point of the LiDAR point cloud to the surface mesh of the 3D model. The mesh (M) is made up of interconnected triangles (t), and the distance between a point (p) and the mesh (M) is computed as: dist(p, M) = mint triangles (dist(p,t)) where the ∋
distance between a triangle and a point is deined by the distance between the plane containing the triangle and the point.
There was no attempt to align the point cloud and the 3D model directly, both of which were georeferenced in the RGF93 CC43 coordinate system. The alignment was instead made using the seven control points. The photos and the point cloud were not captured at the same time, which led todifferencesbetweenthetwodatacaptures.Someobjects had moved, and there was “noise” featured in the LiDAR data, but not the photographs. Also, objects like planks had been moved, and there were other outliers in the scan data due to the weather and various material properties.
For these reasons, the comparison between the photogrammetric 3D model and the LiDAR data was made on the parts of the structure that were the same between the two captures, enabling the elimination of noise and other artifacts such as moving objects.
When comparing the ContextCapture mesh with the point cloud, the average deviation between them was 2.5 centimeters, or the equivalent of just 2 pixels of the input photography. So, the conclusion is that the precision of photogrammetric reconstructions produced with ContextCapture is dependent upon the resolution of the input imagery and can be calculated as approximately 2 times the pixel size of the imagery.
ACQUISITION AND PROCESSING DURATION
The time required to reconstruct the castle using LiDAR versus photogrammetry was also compared, and the results showed that:
• The 46 LiDAR scans required four hours of labor and an additional two hours of labor for processing to complete scan registration. The total labor required to produce the complete point cloud was six hours.
• Using photogrammetry, the light time needed to acquire the pictures involved one hour of labor and the production of the 3D model required 20 minutes of labor plus two hours and 30 minutes of computer processing time.
This comparison indicates that photogrammetry enables faster production of 3D models – and with 80% less labor and much less expensive equipment required. Moreover, the results found photogrammetry to be a more viable method for generating useful site surveys and documentation. Although LiDAR point clouds produce accurate models they require more time and more sophisticated, expensive, and dificult-to-operate equipment than the photogrammetric reconstruction. Photogrammetric reconstructions achieve accuracy similar to point clouds when very high-resolution photography is captured. Photogrammetry also allows for quicker data acquisition and easier processing because users do not need any particular training to do it. Lastly, photogrammetry produces a photo-textured mesh that is
Disclaimer:
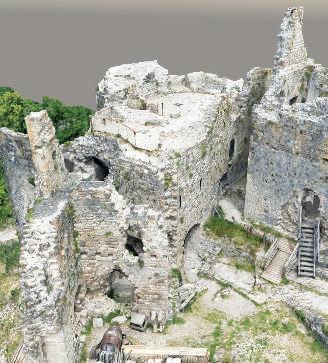
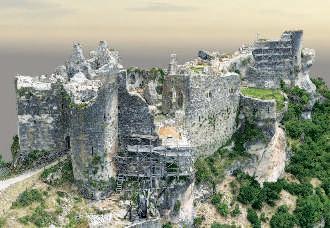
much more visually understandable. Reality meshes are also easier for CAD and GIS applications to analyze and process since they contain a real shape and information on existing conditions.
These beneits make photogrammetry a viable and cost-effective option for large and small projects that could beneit from 3D models of existing conditions and sites. Now, smaller projects that would not warrant the costs of a pointcloud capture can be captured using a digital camera.
For more information please visit www.bentley.com/contextcapture or call +603-7940 3400

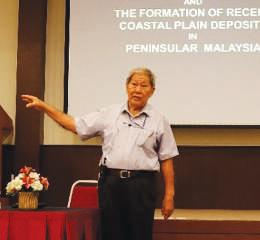
On 24 March 2016, Professor Tjia Hong Djin (Photo 1), Professor Emeritus of Geology at Universiti Kebangsaan Malaysia, presented the evening talk on Evidence of Past Sea-Level Change and the Formation of Recent Coastal Alluvial Deposits in Peninsular Malaysia at the Tan Sri Ir. Prof. Chin Fung Kee Auditorium, Wisma IEM, Petaling Jaya. The talk started at 5.30 p.m. and had an attendance of 35 participants.
Prof. Tjia pointed out that the landmass of the peninsula had been stable, elevation-wise, for the last 20,000 years with no earth crustal movement, so any indication of sea levels alongthecoastlinerepresentthetruesealevels threat.
He used paleoshoreline indicators like abrasion benches and marine-life fossils such as oysters, molluscs and barnacles as markers of past sea surface levels. Radio meteric dating was used to establish the age of the shoreline indicators. There are more than 80 such datings. Land surfaces above sea level would experience erosion.
Along the coast, the sea would carve into the rocky cliff and leave erosion features which indicated whether the sea level had been at a constant level for a long period of time or otherwise.
Prof. Tjia said that 18,000 years BP (Before Present; with zero year BP = 1950 AD) the sea level was at its lowest, 130m below the present day sea level) and after which had risen to the maximum of about 5m above the present day level 4,400 years BP as shown in Photo 2. Thereafter, the sea subsided in 2 quick episodes before rising again to the present level about 400 years BP.
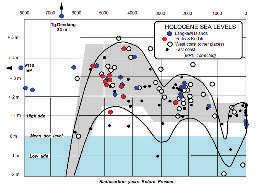
Theindustrialrevolution/age,whichmarked the beginning of large scale human related emission of greenhouse gases, dated back to just 1,800 years AD (less than 200 years BP) yet the sea level had been rising long before this. Changes in sea level causes the shoreline to change and changing shorelines are indicative of climate change. Prof. Tjia left it to the audience to judge for themselves if human activities had caused the changes in the climate and sea level.
He also presented the graph of sea level variations up to 800,000 years from present (Photo 3). It showed cycles of sea levels
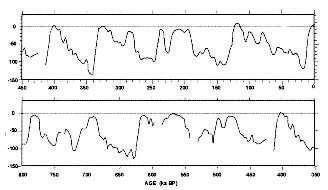
dropping to the lowest and rising to the highest about once every 110,000 years. The sea levels always rose considerably faster than the descending rates.
Previously dry land surfaces which were in undated by the sea, would be buried over by marine sediments from the sea water.
About 5,000 years ago, the sea submerged all the current coastal plains of the peninsula. The presence of marine sediments along coastal plains is the result of this submergence.
Such sediments present considerable challenges to construction activities and completed facilities.
Afterhistalk,Prof.Tjiawasengagedinaveryenthusiastic discussion with the audience. However, he declined to comment on the possible connection between global temperature changes and sea level changes, saying that it was outside his field of expertise.

The IStructE Malaysia Regional Group Young Structural Engineering Professional Award 2016 is now open for entries to Engineers residing in Malaysia.
We want to promote the accomplishments of YOU, the young structural engineers – showcasing the diverse and skilled individuals who are drivingtheprofessionforward.Winningtheawardisauniqueopportunity to be marked out as “one to watch” among the Institution’s global membership, and an internationally recognised mark of achievement in structural engineering.
Structural engineering is an exciting career and that is why winners of this award have the opportunity to act as an ambassador for the Institution and the profession – showcasing the crucial role engineers play in shaping the built environment and providing identiiable role models for young people interested in engineering.
The scheme is open to Engineers Registered with the Board of Engineers aged 30 years or under. To enter the competition, complete your submission and send to: The Honorary Secretary, IStructE Malaysia Regional Group at “istructe.md@gmail.com” by midnight Monday 31 October 2016
To conclude the evening’s event at 7.20 p.m., Dr Ooi Teik Aun presented a certificate of appreciation and a memento to Prof. Tjia on behalf of IEM. n (Prof. Tjia passed away in his sleep on 9 June 2016).
Tjia, H.D and Syed, S.M.A. (2013). Sea Level Changes in Peninsula Malaysia: A Geological Record. Penerbit Universiti Kebangsaan Malaysia.
Title: Pre AGM Talk & 4th AGM of Public Sector Engineering Special Interest Group, IEM 27 August 2016
Organisedby :PublicSectorEngineeringSpecial InterestGroup
Time :9.00a.m.–1.00p.m.
CPD/PDP :Applying
Title: Pre AGM Talk & 31st AGM of Mechanical Engineering Technical Division, IEM 15 October 2016
Organisedby :MechanicalEngineeringTechnical Division
Time :9.00a.m.–1.00p.m.
CPD/PDP :Applying
Kindly note that the scheduled events below are subject to change. Please visit the IEM website at www.myiem. org.my for more information on the upcoming events.
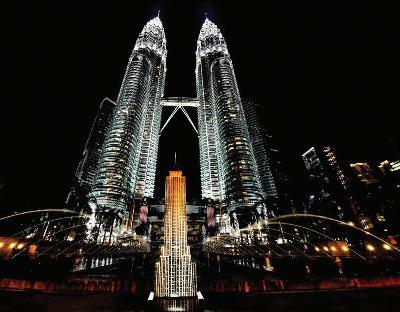
THE SUBMISSION MUST INCLUDE:
• 250 word opinion piece on what structural engineering means to you.
• Poster presentation. You may submit up to four posters in pdf format (A1 size) about three projects that you have been involved in. The posters should show the technical aspects of the design, and also shout about your own input into the project. It is up to you to decide how you split up the posters – focus more heavily on one project or equally across the three.
• Video recorded presentation (max. 5 minutes). At the end of your presentation, please answer the question “what does structural engineering mean to you?” (This is based on your opinion piece and should last no more than 20 seconds).
• CV
• Endorsement from your employer (max. 300 words). Entries will be reviewed by the judging panel against the following criteria:
I. Creativity and originality
II. Personal involvement on one speciic project
III. Knowledge of structural engineering and the profession
IV. Quality of written and verbal communication
V. Clarity of presentation

Dr Siow Chun Lim B. Eng (Electrical & Electronic) and Ph.D. (Univ. Putra Malaysia), is a lecturer at the School of Engineering, Taylor’s University, and Associate Editor of Journal Of Engineering Science & Technology.
Energy costs eat up a sizeable portion of the total costs bearable by telecom operators. Energy efficiency (or rather energy inefficiency) is one of the major culprits.Assuch,variousengineeringefficiency related policies have been put into practice since 1973, resulting in a credible reduction in worldwide energy consumption by 56% (IEA, 2007a). This was the main highlight of the talk by Ir. Noor Iziddin Abdullah bin Ghazali, the Regional Head of Electrical System in the edotco Group of companies specialising in integrated telecommunications infrastructure services.
In line with the focus on enhancing energy efficiency, telecom operators have had to ride on the technological evolution of energyrelated equipment which can be categorised into energy generation or energy storage. Due consideration has to be given when it comes to deciding which energy source to tap from. These can typically be diesel generator, fuel cell, wind, solar or even hybrid system. This decision is largely influenced by cost, onsite conditions as well as local regulations. Deployment of AC or DC diesel generators, transportation of fuels to the fuel cells, wind speed and partial shading of solar cells are some of the issues which a telco engineer has to deal with pertaining to energy generation at the tower site.
Fromtheperspective of storagetechnology in the context of telecommunication service
operators, self-healing silicon batteries, sodium metal hydride batteries, lithium ion batteries, sodium sulfur batteries, T-gel batteries and AGM batteries are some of the additions to the traditional lead acid batteries which telco engineers can choose from. The main criteria which aid in the decision-making process are the depth of discharge, charging time and battery lifecycle. Lithium ion battery is a more attractive option over lead acid battery due to its higher depth of discharge, shorter charging timeaswellaslongerlifecycle.Insomecountries where theft of lead acid battery is prevalent, the use of lithium ion battery also makes more sense, economically.
The design of the tower site has also evolved over the years. Table 1 depicts such comparison.
Indoor type equipment (cabins)Outdoor type equipment (cabinets)
Air conditioners for coolingEmphasis on free cooling/fan cooling/ intelligent ventilation system
Distributed Generators to serve as backupIncreased utilisation of batters as backup
Limited deployment of renewable energy sources
Aesthetic value is not emphasised
Increased deployment of renewable energy sources
Aesthetic value is emphasised with attempts to blend the tower design into ecosystem
Upon realising the available technologies for the operation of telco towers, engineers must then design the energy system. As mentioned, the total cost plays a pivotal role when it comes to designing the optimum system. One approach which engineers can use is the Total Cost of Ownership (TCO) approach which provides a comprehensive method to evaluate different components when designing for a particular site.
Key considerations when using Total Cost of Ownership (TCO) approach are:
• Initial CAPEX Cost of Components
• Installation/Civil works costs associated with components
• Maintenance cycles and costs associated with components
• Manpower costs for operations and maintenance associated with components
• Lifetime/life cycles of components/equipment
• Ambient temperature and humidity have effect on lifetime
• Cost of fuel (diesel/octane/hydrogen/methanol) and grid
• Operational parameters of components (charging rate/fuel consumption)
• Economic factors (inflation rate, duties and taxes)
As one examines these factors further, it can be seen that proper selection of equipment is important as every single piece will affect the direct and indirect cost of the service which buyers have to pay as estimated by the TCO. In turn, this will affect the competitiveness of the telco provider.
All in all, designing an energy system for a telco tower is an arduous task as many factors have to be taken into account with energy efficiency and cost being two of the most challenging ones. The TCO approach may be of great help from the economical side of the project. n
21-23 NOVEMBER 2016
Pullman Hotel, Kuching, Sarawak, Malaysia

Aeroacoustics and aerodynamics
Astrophysical fluid mechanics
Boundary layer flows
Compressible flows and gas dynamics
Computational fluid dynamics
Combustion
Environmental and natural fluid mechanics
Fluid machinery and industrial fluid mechanics
Flow control and measurement
Registration Open NOW!!
Contact IEM Secretariat
Tel: 03-79684024
Email: norfarehan@iem.org.my or log in to http://fet.mmu.edu.my/~acfm/ for more information and registration
Jointly with:

Flow induced noise and vibration
Flow visualization
Geophysical fluid mechanics
Membrane and porous media flows
Multi-phase and reacting flows
Non-Newtonian flows
Unsteady flows and rotating flows
Other topics related to fluid mechanics
Organised by:


The Agricultural and Food Technical Division (AFETD) organised a visit to SEPEN Engineering Sdn. Bhd. in Rawang, Selangor, on 23 April 2016 for 11 participants.
The introduction session started with a briefing on the company which was incorporated in 2008. As a licensed Unfired Pressure Vessel (UPV) manufacturer, its core business activities are mainly in design and fabrication of processing equipment in the food based industries, larger scale bulk storage tank(s) which require in-situ erection and installation, general steel structures for machineries and buildings and the provision of maintenance shutdown services for various plants upon request.
Theparticipantswerebriefedoncompany organisation and the various licences obtained, including those for Unfired Pressure Vessel (UPV) manufacturer issued by Jabatan Keselamatan and Kesihatan Pekerja (JKKP), Construction Industry Development Board, Malaysia (CIDB), Halal, Good Manufacturing Practice (GMP) and others.
SEPEN director Mr. Wong Kah Poh explained about the design process flow and the fabrication process, particularly the storage tank, mixing tank, silos and spray dryer as well as the fabrication and installation method of all kinds of stainless steel auger conveyor, chimney, ducting and piping work and erection of stainless steel structures and platform.
In particular the fabrication and installation of food process plants’ sanitary tubing, valve, fitting and Clean in Place (CIP) systems, fabrication and installation of reactor, vessels and deodoriser, polishing works (hairline, mirror and etc.,) and maintenance shutdown works for plants, machinery parts and equipment were also discussed.
The company’s clients are mainly from the chocolates, yoghurt, palm oil, sauces and oil and gas based industry.
Mr. Wong talked about the challenges faced during the delivery of the finishing products, particularly on the issue of mobilisation and transportation of heavy vessels with large diameter and dimensions.
At the factory floor, production lines were segregated into two different sections: Food based equipment and non-food based equipment. It was observed that goodfinishing epoxy flooring was used at the foodbased equipment manufacturing line so as to produce safe and hygiene products.
At the end of the technical visit, a token of appreciation was presented to Mr. Wong Kah Poh on behalf of IEM. n
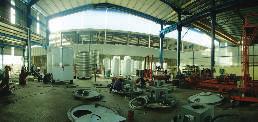

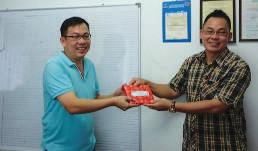
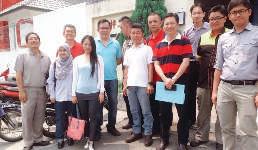
Reported by Ir. Assoc. Prof. Hayati Abdullah, Immediate Past Chairman, Southern Branch
The IEM Southern Branch has been working closely with the Johor Health Department to fight dengue. Realising that engineers can play a role in this fight, its Executive Committee formed a Special Committee On Dengue last October 2015 with Ir. John Cheah Kam Loong as its chairman.
The other committee members are Ir. B.K. Teoh, Ir. Mohd Salehuddin bin Abdul Hamid, Ir. Derek Cheah Kong Yew, Ir. Tay Tuck Puang, Ir. Lam Ah Hang, Ir. Dr Stephan Tan Boon Kean, Ir. Goh Kae Wan, Ir. Thayala Selvadurai and Mr. Lim Chin Chuan.
Prior to the formation of the committee, an International Conference On Dengue Situation And Its Control was jointly organised by the Southern Branch, Rotary International and Universiti Teknologi Malaysia (UTM) at UTM in September 2014.
Johor Chief Minister YAB Dato’ Mohamed Khaled Bin Nordin, who officiated at the conference, was happy that engineers were promoting awareness of the disease. He believed that with the appointment of Ir. John Cheah as IEM representative in the Jawatankuasa Khas Tindakan Denggi Peringkat Negeri Johor, engineers, especially those in Johor, would be encouraged to play a positive role in helping the Government to combat the disease. (The proceedings of this conference is available upon request).
Engineers in Johor have been recognised for the role they play in combating dengue, especially in the Gotong Royong – Search & Destroy method. The followingawardshavebeen presented to engineers:
• Anugerah Aspirasi Combi Harapan Negeri Johor 2015 Award, presented by the speaker of Johor State Assembly, Tan Sri Mohammed bin Haji Aziz, on behalf of the Johor Chief Minister on 18 October, 2015, at Combi Convention, Pasir Gudang, Johor.

• Warga Kota Prihatin Award, presented by Chief Minister YAB Dato’ Mohamed Khaled Bin Nordin on 3 January, 2016, at Hotel Paragon, Johor Bahru. Four engineers have been appointed district representatives in the Jawatankuasa Tindakan Wabak Denggi Daerah of Johor. They are Ir. John Cheah (Johor Bahru), Ir. Tay Tuck Puang (Batu Pahat), Ir. Lam Ah Hang (Segamat) and Mr. Lim Chin Chuan (Kulai).
Ir. Thayala also successfully organised and led a GotongRoyong – Search & Destroy event at Majidee Park, Johor, in September 2015. According to him, there is now “zero incidence” at the previous hotspot areas.
A past chairman of southern branch, Ir. Joseph Puen, also successfully organised a Gotong-Royong & Dengue Campaign at Orkid Flat, Desa Cemerlang, Johor Bahru in April 2016. At the same time, he donated two fogging machines to Combi Desa Cemerlang.
Ir. John Cheah spoke on “Methods of Vector Control On Dengue Eradication” during a session on Dengue Control & Its Situation at the Rotary International District 3310 Conference in Chiang Mai, Thailand in May 2016.
Theengineerswillcontinuetoplayactiverolestocombat and eradicate dengue. n


Ir. Chin Mee Poon www.facebook.com/ chinmeepoon
Ir. Chin Mee Poon is a retired civil engineer who derives a great deal of joy and satisfaction from travelling to different parts of the globe, capturing fascinating insights of the places and people he encounters and sharing his experiences with others through his photographs and writing.

We are pleased to announce that a travel coffee-table book, published by IEM, is now available for purchase at the Secretariat:
“A Globe-Trotting Engineer’s Footprints” by Ir. Chin Mee Poon
The selling price is as follows:
Members : RM50 Non-Members : RM55
All proceeds will go to the IEM Building Fund.
For more information, kindly contact IEM Secretariat via telephone 03-7968 4001 and email address at : sec@iem.org.my
Thank you.
In Juneau, the capital of Alaska, my wife and I visited the worldfamous Mendenhall Glacier 19km away, one of the most easily accessible glaciers in the world.
A 45-minute bus ride brought us from downtown Juneau to the junction between Mendenhall Loop Road and Glacier Spur Road, where we alighted and walked 2kmalongGlacierSpur Road that cuts through Tongass National Forest totheglaciercar-park.TheMendenhallGlacier Recreation Area is part of the Tongass National Forest. We took an hour to cover the 2km walk because I spent much time photographing the mushrooms we saw on the way.

The Glacier Visitors Centre provides a superb view of the glacier and the lake as well as Nugget Falls nearby. Seven hiking trails radiate from the Centre. Because of our slow pace, we only had time to walk two of them – the 800m round-trip Photo Point Trail and the 3.2km round-trip Nugget Falls Trail. Both are very easy trails.
The Photo Point Trail led to a viewing platform for an unobstructed view of the magnificent glacier and waterfalls across the lake. The longer trail took us through some interesting landscape and vegetation before we ended up in front of the waterfalls and the glacier. Other than more mushrooms to add to my photograph collection, we also saw a porcupine busy feeding on a high branch of a Sitka spruce tree.
The 22km Mendenhall Glacieris one of the glaciers originating from the Juneau Icefield. The lake in front of the glacier was first formed in 1958. It has since grown to its present size as the glacier keeps retreating.
Aglacierwillretreatiftheamountofsnowfall in winter is less than the amount of snow and ice melted away in summer. It will advance if the snowfall is more than the meltwater. The difference between the snowfall and the meltwater is known as mass balance. A glacier

with a negative mass balance retreats and a glacier with positive mass balance advances. Thenegativemassbalanceofglaciersisastrong indicator of the effects of global warming.
Mendenhall Glacier has retreated 2.8km since 1958, and it will continue to retreat due to global warming, just like Franz Josef Glacier in New Zealand and many other glaciers in the world. Some of these retreating glaciers may eventually reach a new equilibrium and stop retreating, but others will continue to retreat until they disappear altogether. The loss is irreversible.
KepadaSemuaAhli,
Tarikh:19Julai2016
Berikut adalah senarai calon yang layak untuk menduduki TemudugaProfesionalbagitahun2016.
Mengikut Undang-Undang Kecil IEM, Seksyen 3.8, nama-nama sepe i te se a ai e ikut dite itka se agai alo - alo a g la aku tuk e jadiAhliI situsi,de ga s a at aha a e eka lulusTemudugaProfesionaltahun2016.
Sekiranya terdapat Ahli Korporat yang mempunyai bantahan te hadap a a- a a alo a g didapai idak sesuai u tuk menduduki Temuduga Profesional, surat bantahan boleh dike ukaka kepadaSeiausahaKeho at,IEM.Su at a taha hendaklah dikemukakan sebulan dari tarikh penerbitan dikeluarkan.
Ir. Yam Teong Sian Seiausaha Kehor at, IEM, PERMOHONAN BARU NamaKelayakan
KEJURUTERAAN AWAM
MOHD SUHAIRI BIN RAMLIBE HONS (UiTM) (CIVIL, 2006)
KEJURUTERAAN BANGUNAN
MOHAMMED IZRAI BIN ABD RAZAKBE HONS (UiTM) (COSNTRUCTION, 2015)
KEJURUTERAAN KIMIA
NGOH GEK CHENG BE (BELFAST) (CHEMICAL & FOOD, 1990) PhD (BELFAST) (1995)
ROZITA BINTI YUSOFF BE (NOVA SCOTIA) (CHEMICAL, 1992) MSc (MANCHESTER) (1996) PhD (UMIST) (2004)
KEJURUTERAAN ELEKTRIKAL
AHMAD JAZIM BIN ZAKARIABE HONS (USM) (ELECTRICAL & ELECTRONIC, 1999)
AZRA DAHIYAH BINTI ALIASBE HONS (UTP) (ELECTRICAL & ELECTRONICS, 2009)
GANESAN A/L KADIRGAMA BSc (WESTERN MICHIGAN) (ELECTRICAL, 1999)
MOHAMAD FARHAN BIN YUSOFBE HONS (UTM) (ELECTRICAL, 2009)
MOHD FIRDAUS BIN MOHD FAUZIBE HONS (UiTM) (ELECTRICAL, 2009)
MOHD YA'ACOB BIN SIRONBE HONS (UTM) (ELECTRICAL-INSTRUMENTATION & CONTROL, 2001)
ZEENATHUL BASHEERA BINTI MOHAMED ALI BE HONS (USM) (ELECTRICAL & ELECTRONIC, 2001) ME (UTM) (ELECTRICAL-POWER, 2011)
KEJURUTERAAN ELEKTRONIK
AIDA RAZANA BINTI OMAR BE HONS (UiTM) (ELECTRICAL. 2000) MSc (UiTM) (TELECOMMUNICATION & INFORMATION , 2010)
SUADI BIN WAHABBE HONS (UMS) (ELECTRICAL & ELECTRONIC, 2000)
KEJURUTERAAN MEKANIKAL
LEW HENG MUNBSc (ALABAMA) (MECHANICAL, 2000)
MUHD NOR RIDHWAN BIN ZAINAL ABIDIN BE HONS (UTM) (MECHANICAL, 2008)
KEJURUTERAAN SUMBER MINERAL TANG @ TAN HAI HONGBE HONS (USM) (MINERAL RESOURCES, 1999)
PERPINDAHAN AHLI
No. Ahli NamaKelayakan
KEJURUTERAAN AWAM
35604AZEEZUL HAKIIM BIN AB KARIMBE HONS (MALAYA) (CIVIL, 2003)
55819LEE LAI HAABE HONS (UKM) (CIVIL, 2007)
20013LIM CHIN CHIATBE HONS (UKM) (CIVIL & STRUCTURAL, 1998)
33522NORLIZA BINTI MOHAMAD RASOL BE HONS (UiTM) (CIVIL, 2009)
56557RAZALI BIN KASSIMBE HONS (UTM) (CIVIL, 2007)
54981 SITI AMINAH BINTI ABBAS BE HONS (UTP) (CIVIL, 2009)
26515SYAIFUL ISKANDAR BIN YAHAYABE HONS (UiTM) (CIVIL, 2003)
24576TAN POH SOONBE HONS (USM) (CIVIL, 2004)
23752TANG SOONG HWANGBE HONS (UTHM) (CIVIL, 2005)
24576TAN POH SOONBE HONS (USM) (CIVIL, 2004)
23752TANG SOONG HWANGBE HONS (UTHM) (CIVIL, 2005)
KEJURUTERAAN AUTOMOTIF
81306MOHD YUSOP BIN MOHAMADBE HONS (IIUM) (MECHANICAL-AUTOMOTIVE, 2007)
KEJURUTERAAN PEMBINAAN
51278 ALBERT VIVIAN A/L THOMAS PATRICK BE HONS (COVENTRY) (CIVIL, 1998) ME (UTM) (CIVIL, 2011)
KEJURUTERAAN ELEKTRIKAL
53709AMIERUL HISYAM BIN MOHAMED BE HONS (UTM) (ELECTRICAL-INSTRUMENTATION & CONTROL, 2008)
49252 KOO KUAN YONG BE HONS (USM) (ELECTRICAL, 2010)
38329MD. HAJUPERI BIN MD. ALIBE HONS (USM) (ELECTRICAL, 2006)
33923MOHD SHAFIEE BIN ALMUNIR BE HONS (UiTM) (ELECTRICAL, 2007) ME (MALAYA) (POWER SYSTEM, 2014)
56486MOHD ZAIDDY BIN MAT RAJALIBE HONS (UNITEN) (ELECTRICAL POWER, 2007)
58697MUHAMMAD ZAIDI BIN MAHMOOD BE HONS (UTM) (ELECTRICAL, 2012)
48031TANG JUN HUATBE HONS (UTAR) (ELECTRICAL & ELECTRONIC, 2012)
58012WONG HOWE NGIINGBE/ME HONS (LEEDS) (ELECTRONIC & ELECTRICAL, 2011)
KEJURUTERAAN ELEKTRONIK
27568MOHD FARED BIN ABDUL KHIRBE (YAMAGATA) (ELECTRICAL & INFORMATION, 1996)
KEJURUTERAAN KIMIA
62040 AZLIN SUHAIDAAZMI BSc (WIDENER) (CHEMICAL, 1998)
42242LOO KHENG HOOIBE HONS (UTAR) (CHEMICAL, 2012)
61115 SARINA BT SULAIMANBE HONS (UPM) (CHEMICAL, 2004)
KEJURUTERAAN MEKANIKAL
70465FRANCIS VINCENT ARIFFIN JNRBE HONS (UTM) (MECHANICAL, 2001)
61154KHOO ENG SHYUANBE HONS (UniMAP) (MECHANICAL, 2012)
29105MHD FAREED FAHMY MHD YUNIN BE HONS (UTM) (MECHANICAL-MANUFACTURING, 2006)
40908MOHAMAD KAMARUL BIN SHAMSUDDIN BE HONS (UMP) (MECHANICAL-AUTOMOTIVE, 2010)
30327MOHAMAD SAIFUL BIN ABDUL RANI BE HONS (UiTM) (MECHANICAL, 2008)
50126MOHD ISRAQ HAFRIZ B KHAMISBE HONS (UPM) (MECHANICAL, 2009)
81850 ONG TENG CHUAN BSc (NATIONAL TAIWAN) (MECHANICAL, 2005)
59178 YUEN TIAN YI ME HONS (IMPERIAL COLLEGE LONDON) (MECHANICAL, 2012)
37670LEOW CHEE HUANBE HONS (UTAR) (MECHANICAL, 2011)
KEJURUTERAAN PEMBUATAN
17338MOK SOON HONGBE HONS (CNAA-COVENTRY POLYTECHNIC) (MECHANICAL, 1991)
PERMOHONAN BARU/PEMINDAHAN MENJADI AHLI KORPORAT
KEJURUTERAAN ELEKTRIKAL
19207AZLAN BIN MD. SHARIPINBE HONS (UMIST-MANCHESTER, ELECTRICAL & ELECTRONIC, 1997)
Title: Conference of the ASEAN Federation of Engineering Organisations (CAFEO 34)
21 - 24 November 2016
Venue :CitystateAsturiasHotel,PuertoPrincesa, Palawan,Philippines
Kindly note that the scheduled events below are subject to change. Please visit the IEM website at www. myiem.org.my for more information on the upcoming events.
IEM ENGINEERING HALL OF FAME AWARD 2017
The Su -Co itee of E gi ee i g Hall of Fame under the auspices of the Standing Co itee o P ofessio al P a i e is p oud to i ite o i aio s fo the IEM E gi ee i gHallofFa eA a d .
It is i el a d e pedie t to i du t a d to recordtheaccomplishmentsofengineersin the ou t hoha eo hadde o st ated pa i ula l outsta di g p ofessio al a hie e e ts a d p o ided e elle t se i es to the I situio , the e gi ee i g i dust a dtheNaio .
The IEM E gi ee i g Hall of Fa e is esta lished ith the ai to o fe e og iio a d to ele ate the accomplishmentsofmembersoftheIEM:
• Who have demonstrated outstanding
professionalachievements.
• Whoha e adesig ii a t o t i uio s to the engineering profession, the I situio of E gi ee s, Mala sia IEM a dtheNaio .
• Who have rendered valuable service to theCommunity.
The E gi ee i g Hall of Fa e ill se e as the fo al poi t o sho ase of outsta di g Mala sia e gi ee s,pasta dp ese t, ho hado ha e adeg eat o t i uio stothe engineeringprofessionandtothequalityof life in Malaysia. Engineers honoured in the E gi ee i g Hall of Fa e ill also se e as a beacon and as role models for young e gi ee s as ell as eate g eate i te est i e gi ee i g i ge e al a d a a e ess
of the o t i uio s ade outsta di g engineersinthecountry.
No i aio s fo the A a d a e ope to Mala sia iize s ho a e o ha e ee CorporateMembersoftheIEM.
The losi g date fo e eipt of o i aio s fo IEM E gi ee i g Hall of Fa e A a d is 30 September 2016.
Pleasesu it o i aio sto:
Hon. Secretary
The I situio of E gi eers, Mala sia Ba gu a I ge ieur, Lots & Jala / , Petali g Ja a, Sela gor.
The o i aio fo a e do loaded f o the IEM e site at www.myiem.org.my
AWARD FOR CONTRIBUTIONS TO THE ENGINEERING PROFESSION IN MALAYSIA 2017
To encourage an interest in engineering and to recognise important services or o t i uio s to e gi ee i g i Mala sia, the IEM A a d fo Co t i uio to the Engineering Profession in Malaysia is to be p ese tedtothepe so s , hohas:
• Contributed to the advancement of engineeringinMalaysia,and/or
• Designed and constructed an original engineering device or system of merit andapplicabilitytoindustry.
This A a d is ope to all Mala sia iize s andpermanentresidents.
• No i aio s ill ei iteda uall .The losi g date fo e eipt of o i aio s foreachyearis30September.
• No i aio s shall e ade th ough a e e of the I situio . Ea h e e is est i tedtoo e o i aio peryear.
• Ea h o i aio shall e a o pa ied a ief ite up of the se i es e de ed o o t i uio s ade o system designed and/or constructed togethe ith ele a tphotog aphsa d otherdocuments.
• TheA a d is to e ade theCou il upo e o e daio the A a ds Co itee.
• The A a d shall o p ose a etal plaque,ascrollandasumofRM1,000. The losi g date fo o i aio s is 30 September 2016. Pleasesu it o i aio sto:
Hon. Secretary
The I situio of E gi eers, Mala sia Ba gu a I ge ieur, Lots & Jala / , Petali g Ja a, Sela gor.
The o i aio fo a e do loaded f o the IEM e site at www.myiem.org.my
The IEM Outstanding Engineering
A hie e e t A a d is eated to o fe e og iio to a o ga isaio o od fo outstanding engineering achievements ithi Mala sia. The a a d ill e gi e to a o ga isaio o od espo si le fo an outstanding engineering project in the country.
The asis fo the a a d shall e an engineering achievement that demonstratesoutstandingengineeringskills hi h has ade a sig ii a t o t i uio to the profession and to the quality of life i Mala sia. I aki g the sele io , the follo i g ite ia ill e gi e spe ial o side aio :
1. Co t i uio tothe ell- ei gofpeople a d o u iies,
2. Resourcefulnessinplanning,
3. C eai it i the soluio of desig problems,
4. Pioneering use of materials and methods,
5. I o aio s i pla i g, desig a d o st u io ,
6. U usualaspe tsa daesthei alues.
E gi ee i g a hie e e ts hi h i lude, i te alia,thefollo i g a esu itedfo
o side aio :
• B idges,Tu els,Wate a sSt u tu es, Roads
• Tele o u i aio s of aio al/ i te aio al ha a te , Po e T a s issio a dT a spo taio
• Da sa dPo e Staio s
• Po tsa dHa ou s
• BuildingandStructures
• Airports
• WaterSupply,WasteDisposalProjects
• Military projects such as bases, lau hi gu its,ha ou fa iliies
• D ai age, I igaio a d Flood Co t ol Projects
• Local design and manufacture of high technologyproducts
• E e g ,Heat,MassT a sfe
• Outsta di g o k i e gi ee i g research anddevelopment
• Che i al p o essi g of i dige ous a resources such as rubber, palm oil and variousotherlocalplants
• I o ai e use of lo al e gi ee i g materials
• Outsta di g o t i uio i e gi ee i g edu aio
• Original discovery of useful engineering theory
No i aio sa ei itedf o all e e sof the I situio . Ea h o i aio su ited should o tai a iefsu a / ite-upof the p oje t i app o i atel , to , o dstogethe ithfull ele a t epo tso the p oje t a d th ee opies of suppo i g do u e taio i ludi g photog aphs. A p oje t o o po e t pa t the eof hi h has e ei ed a ea lie a a d, f o IEM does ot ualif fo o i aio .
• Thea a di thefo ofa etalpla ue, naming the achievement shall be given to the o ga isaio o od espo si le fortheprojectforpermanentdisplay.
• The a a d shall e p ese ted ith due e e o at a app op iate fu io of theIEM.
The losi g date fo o i aio s is 30 September 2016. Pleasesu it o i aio sto:
Hon. Secretary
The I situio of E gi eers, Mala sia Ba gu a I ge ieur, Lots & Jala / , Petali g Ja a, Sela gor.
The o i aio fo a e do loaded f o the IEM e site at www.myiem.org.my
Theo je i eoftheA a distoe ou age interest in engineering and to recognise pote ial a o g ou g e gi ee s i Mala sia. The A a d ill e p ese ted to the pe so ho has sho outsta di g a ilit a dleade ship ualiies, either i. i the desig a d/o o st u io of an engineering device or system of merit; or ii. in the research and development or teachingofengineering.
I a o e ea , the A a d a e ade in either one or both of the categories e io ed a o e. If the A a d is to e adei o l o eofthet o atego a
e adei the ea .TheA a disope to a didate hoa e:
i. Registe ed e e ith the Boa d of Engineers, Malaysia and under 35 yearsofage
ii. Mala sia iize s o pe a e t residentsofMalaysia
iii. Graduate or Corporate Members of IEM.
TheProposermayormaynotbeamember of IEM. Ho e e , ea h o i aio shall e suppo ted a ief e o e daio f o t o Refe ees ho a e Co po ate members of IEM. If the Proposer himself isaCo po ate e e ofIEM o highe ,
the he a also a t as o e of the t o requiredReferees.
The A a d ill o p ise a ash p ize of RM500.00, a scroll and plaque, to be p ese ted ith due e e o to ea h e ipie toftheA a d.
The losi g date fo o i aio s is 30 September 2016.
Pleasesu it o i aio sto:
Hon. Secretary
The I situio of E gi eers, Mala sia Ba gu a I ge ieur, Lots & Jala / , Petali g Ja a, Sela gor.
The o i aio fo a e do loaded f o the IEM e site at www.myiem.org.my
The p i a o je i e of the A a d is to e og ise the o t i uio s o e e gi ee s. This A a d a also incidentally encourage interest i e gi ee i g a o g o e a d e ou agethe tost i eto a dsg eate e elle e. The A a d ill e p ese ted to the o a e gi ee ho has sho outstanding ability and leadership ualiies, o has ee a pio ee i a o eofthefollo i ga eas:
• I the desig a d/o o st u io of an engineering device or system, structural system, planned development, environmental improvementsor,
• In the research and development of engineering device, systems, processes and/or materials, pu li aio ofpape o ,
• Intheteachingofengineeringor,
• In the management of engineering projects,
• Entrepreneurship in the commercial sector.
I aki g the sele io , the follo i g ite ia ill egi e spe ial o side aio :
• Co t i uio to the ell- ei g of peoplea d o u iies
• Resourcefulness in planning and in thesoluio ofdesig p o le s
• Pioneering in use of materials and methods
• I o aio s i pla i g, desig a d o st u io
• U usualaspe tsa daesthei alues
The A a d is ope ed to a didates ho are:
• Registered members of the Board of Engineers,Malaysia,
• Mala sia iize s o pe a e t residentsofMalaysia,
• Graduate or Corporate Members of TheI situio ofE gi ee s,Mala sia.
The Proposer may or not be a member of IEM o BEM, o a e gi ee . Ho e e , ea h o i aio shall e suppo ted a ief e o e daio f o t oRefe ees
ho a e G aduate o Co po ate e e of IEM. If the Proposer is herself either a Corporate or Graduate member of IEM o highe , the she a also a t as o e ofthet o e ui edRefe ees.
The A a d shall o p ise a ash p ize of RM800.00, a scroll and and plaque, to be p ese ted ith due e e o to ea h e ipie toftheA a d.
The losi g date fo o i aio s is 30 September 2016.
Pleasesu it o i aio to:
Hon. Secretary
The I situio of E gi eers, Mala sia Ba gu a I ge ieur, Lots & Jala / , Petali g Ja a, Sela gor.
The o i aio fo a e do loaded f o the IEM e site at www.myiem.org.my
CONTRIBUTIONS TO WISMA IEM BUILDING FUND

RM 2,876,058.48 contributed by IEM Members and Committees RM 744,332.19 contributed by Private Organisations
CHAI ZHENG HOW 1ST YEAR (UTAR) (CHEMICAL)
CHANG KAI YAN1ST YEAR (UTAR) (CHEMICAL)
CHEAM WAI CHONG 1ST YEAR (UTAR) (CHEMICAL)
CHIA MIN YAN3RD YEAR (UTAR) (CHEMICAL)
78721CHIAN XIN NI 1ST YEAR (UMP) (CHEMICAL)
CHOO CHEE WEI LUN 3RD YEAR (UTAR) (CHEMICAL)
CHOOI CHEE YOONG2ND YEAR (UTAR) (CHEMICAL)
CHUA MU YIN3RD YEAR (UTAR) (CHEMICAL)
CHUEN WEN ZHE, WILLIAM 1ST YEAR (UTAR) (CHEMICAL)
78581DHIJEEDTHIRAN NAIDU 3RD YEAR (UMP) (CHEMICAL)
78521ENGKU NORFATIMA BINTI ENGKU DAHALAN 4TH YEAR (UMP) (CHEMICAL)
78499FADWA SAMEEHA BINTI ISMAIL 4TH YEAR (UMP) (CHEMICAL)
78564FARAH SYAHIRAH BINTI YAHYA 4TH YEAR (UMP) (CHEMICAL)
78602FARAHIN BINTI M MIZI 1ST YEAR (UMP) (CHEMICAL)
78727 FATEN AZWANI BINTI ABD. AZIZ 1ST YEAR (UMP) (CHEMICAL)
78505 FATIMAH AZ ZAHARAH BINTI MOHAMAD 4TH YEAR (UMP) (CHEMICAL)
FATIMAH MAHIRAH BINTI ABU HASSAN ASHAARI 4TH YEAR (UITM) (CHEMICAL)
FATIN LIYANA BT MAMAT @ ARIFFIN 4TH YEAR (UITM) (CHEMICAL)
FOO JIAN QI 1ST YEAR (UTAR) (CHEMICAL)
78696FOO KATHLEEN 1ST YEAR (UMP) (CHEMICAL)
GAN HONG KEAT 3RD YEAR (UTAR) (CHEMICAL)
78565 GAVSALYAA/P THILLAI VILLALLAN 1ST YEAR (UMP) (CHEMICAL)
GOH EU-NICE 2ND YEAR (UTAR) (CHEMICAL)
78613GOO BOON CHIN 3RD YEAR (UMP) (CHEMICAL)
78567GURVINDER SINGH A/L SUKHCHARAN SINGH 3RD YEAR (UMP) (CHEMICAL)
HAFIFAH AMIRAH BT AKHAWAN 4TH YEAR (UITM) (CHEMICAL)
HAH HUAI HUI 1ST YEAR (UTAR) (CHEMICAL)
HAIRIL HASYIMI BIN OMAR 4TH YEAR (UITM) (CHEMICAL)
HALIMAH BT MUHAMMAD SALLEH 4TH YEAR (UITM) (CHEMICAL)
HANANI HASSIM 4TH YEAR (UITM) (CHEMICAL)
HANI SYAKIRA BINTI NORDIN 4TH YEAR (UITM) (CHEMICAL)
HANIRA BINTI RAMLI 4TH YEAR (UITM) (CHEMICAL)
78709HANIS NAZURA BINTI MOHD TAMIZI 1ST YEAR (UMP) (CHEMICAL)
78570 HARIDASS A/L MH. GANASAN 3RD YEAR (UMP) (CHEMICAL)
78586 HARIITARAAN A/L FATMANATHAN 2ND YEAR (UMP) (CHEMICAL)
78555HARIPRASATH MARIMUTHU 1ST YEAR (UMP) (CHEMICAL)
78626 HARRYDASS A/L ALLAPAN 2ND YEAR (UMP) (CHEMICAL)
HASANAL HASFADHLI AL-ESRIL BIN
HASANALAKRAM 4TH YEAR (UITM) (CHEMICAL)
78632 HEAMAMALINI A/P PARATHETHASAN 2ND YEAR (UMP) (CHEMICAL)
78655HOO POH YING1ST YEAR (UMP) (CHEMICAL)
IRRA NABILAH BINTI MD ISA 4TH YEAR (UITM) (CHEMICAL)
78730 IVINASHAA/P NARAYANAN 2ND YEAR (UMP) (CHEMICAL)
IZZATIE BINTI MD. JANI 4TH YEAR (UITM) (CHEMICAL)
78584JAGATHEES KUMAR A/L SANNA MOURTHY 2ND YEAR (UMP) (CHEMICAL)
78638 JASMIN A/P TRAMARAJH 3RD YEAR (UMP) (CHEMICAL)
78698JASMIN BINTI ILYAS SUSAI DEVAS 1ST YEAR (UMP) (CHEMICAL)
78571JEETENRAJ SINGH RANDAWA 3RD YEAR (UMP) (CHEMICAL)
78676JESSY LYNN JASPIN 2ND YEAR (UMP) (CHEMICAL)
JOERBENSON FRANCIS LODUNGI 2ND YEAR (UMS) (CHEMICAL) JONG CHAO YUAN1ST YEAR (UTAR) (CHEMICAL)
78595 KAMALANATHAN A/L NARAYANAN 2ND YEAR (UMP) (CHEMICAL)
78617 KAMESHVARAN A/L PERUMAL 1ST YEAR (UMP) (CHEMICAL)
78729KANCHANA2ND YEAR (UMP) (CHEMICAL)
78547 KATHIRAVAN A/L MURUGAYAH 2ND YEAR (UMP) (CHEMICAL)
78636 KAVITAA/P VELOO 1ST YEAR (UMP) (CHEMICAL)
78591KEE KEING LEE 1ST YEAR (UMP) (CHEMICAL)
78597 KESHVINI A/P SHERMAN 1ST YEAR (UMP) (CHEMICAL)
KHADIJAH BINTI MOHAMAD ARIS 4TH YEAR (UITM) (CHEMICAL)
78619KHAIRUNNISA BINTI MOHAMAD 4TH YEAR (UMP) (CHEMICAL)
LAI YUEN YEE1ST YEAR (UTAR) (CHEMICAL)
LARENNA JEFFRESON 4TH YEAR (UITM) (CHEMICAL)
78604LEE CHEA HUI 3RD YEAR (UMP) (CHEMICAL)
LEE CHEE FATT 1ST YEAR (UTAR) (CHEMICAL)
LEE WENG LOON 1ST YEAR (UTAR) (CHEMICAL)
LEE XIN 1ST YEAR (CURTIN) (CHEMICAL)
LEONG CHAI LIN, CHARLENE 1ST YEAR (UTAR) (CHEMICAL)
LEOW LEI YIN2ND YEAR (UTAR) (CHEMICAL)
78497LIM LIT WOON 3RD YEAR (UMP) (CHEMICAL)
78680LIM SIN ER 2ND YEAR (UMP) (CHEMICAL)
LIM YEE CHUEN3RD YEAR (UTAR) (CHEMICAL)
LIM YONG HIAN1ST YEAR (UTAR) (CHEMICAL)
LING JIA SHEN 1ST YEAR (UTAR) (CHEMICAL)
78658LOONG PUI WEN 1ST YEAR (UMP) (CHEMICAL)
LOW MENG LAI 3RD YEAR (UTAR) (CHEMICAL)
LOW SER CHYEN 2ND YEAR (UTAR) (CHEMICAL)
Note: Remaining list would be published in the September 2016 issue. For the list of approved “ADMISSION TO THE GRADE OFSTUDENT”, please refer to IEM web portal at http://www.myiem.org.my.
Pengumuman yang ke-94
Institusi mengucapkan terima kasih kepada semua yang telah memberikan sumbangan kepada tabung Bangunan Wisma IEM. Ahli-ahli IEM dan pembaca yang ingin memberikan sumbangan boleh berbuat demikian dengan memuat turun borang di laman web IEM http://www.iem.org.my atau menghubungi secretariat di +603-7968 4001/5518 untuk maklumat lanjut. Senarai penyumbang untuk bulan Jun 2016 adalah seperti jadual di sebelah:
NO. NO. AHLINAMA
120562ABD. RAHMAN BAKAR @ OMAR
259192ABDUL RAZAK BIN YAKOB
315963AHMAD ZAINI BIN ABDUL KARIM
415542 BORHAN BIN ADAN
501569CHAN PENG CHEE
611946 CHEW YEE CHUAN
708592CHIEW HUEY SHENG
829053 CHIN KOK YOU
922293CHING SOON JIN
1002828CHOO KOK BENG
11 08385DHILEEPAN RAMAN NAIR
1229769HA KIM ON
1302030ISHAK BIN HAJI ARSHAD
1409391ISMAIL BIN ABDUL RAHMAN
1513756KAMARUDDIN BIN ISMAIL
1628067 KHAIRULANWAR BIN A. RAZAK
1707160KOH JIT HUAT
1802289 LEE CHING TONG
1914846LEE SHAW MING
2020091 LEE TIAN SIN
2120929LIM KAH GHEE
2210697LOH FOOK GUAN
2313339MAZLAN BIN SHAMSUDDIN
2429729 MEGAT AJIB BIN ABD HAMID
2519200MEGAT SAIDI BIN NIK NGAH
2626740MHD. SHUKREE BIN SHAHABUDIN
2704526MIOR SHAHAR BIN MIOR NAZRI
2801793 MOHAMAD AFIFI BIN ABDUL MUKTI
2911614MOHAMAD RAZIP BIN HAJI A. SAMAD
3008536MOHAMED AMIN BIN KASIM
3100670MOHAMED KHALID BIN DIN
3206538MOHAMED YAKUB BIN ISMAIL
3320097MOHD FAUZI BIN SHAFIE
3402107MOHD NOOR BIN SALLEH
3524170MOHD SALLEH BIN NGAH MAT DRUS
3607326MOHD. NOR BIN ABD. BASAR
3723029NG CHEE KIONG
3814396 PHUA FOO YONG
3920014POH HEON KHOON
4047064 PRABHU A/L MURUGESU
4110176SENTHIRAJAH RAJARATNAM
4212239SOH CHOR CHIEW
4308930 SOH THIAM BENG
4404803 TAN AI TONG
4506172TAN HOON KEONG
4600042 TAN YORK HING
4743962VOON FOOK HIN
48 11811 WONG KIM SIEW
4901412YAACOB BIN SHARIFF
5024712YAP MENG SOON, TONY
5120921 YAP YIK YEN