J.W. Gassett, K.R. Blevins, & S.A. Williams September 1, 2025
A research study designed to:
• Determine attitudes of stakeholder groups most impacted by wildlife crime,
• Describe the motivational factors and potential deterrents that influence poachers,
• Reduce judicial and prosecutorial barriers to wildlife crime,
• Assess the levels of detection and conservation impacts associated with wildlife crime, and
• Provide solutions to improving detection, prosecution, and conviction rates, including an objective, defensible, and proportional legal framework.
Suggested Citation: Gassett, J.W., Blevins, K.R., and Williams, S.A. (2025). Reducing the Illegal Take of Wildlife by Investigating the Motivators, Evaluating the Associated Conservation Costs, and Improving Detection Rates of Poaching.
This report was funded by the Multistate Conservation Grant Program (Grant: F22AP00699), which is jointly managed by the U.S. Fish and Wildlife Service - Wildlife and Sport Fish Restoration Program and the Association of Fish and Wildlife Agencies.
Executive Summary
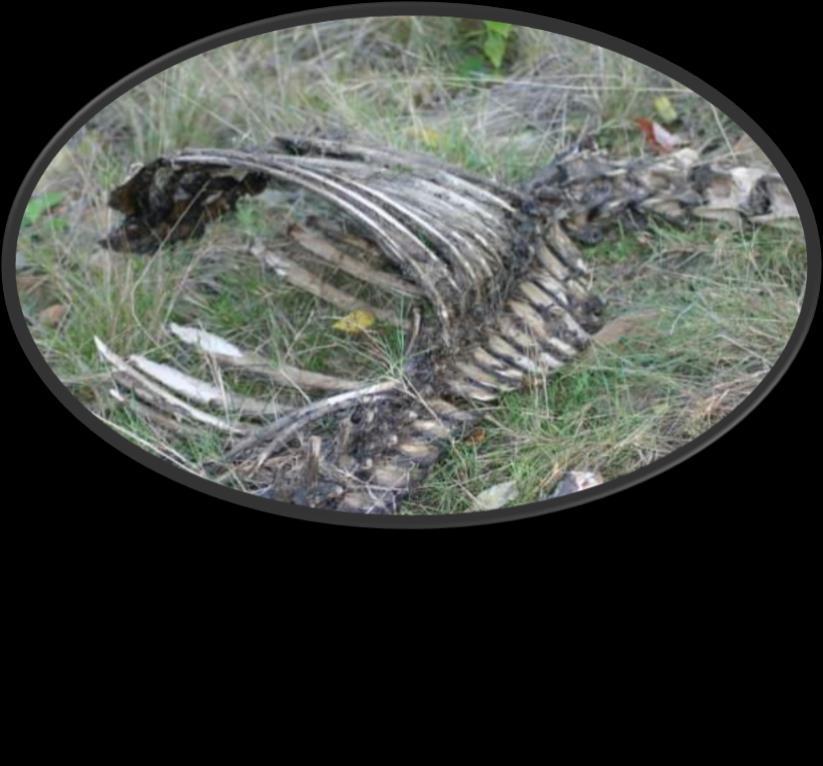
Illegal take of big game, or poaching, undermines both the biological integrity of wildlife populations and the social foundations of the North American Model of Wildlife Conservation. It also poses a substantial threat to wildlife conservation in the United States. Tragically, the visibility and notoriety of poaching also exacerbate the tendency of the public to equate “poaching” with “hunting,” further degrading the positive conservation benefits derived from lawful, regulated hunting.
Unlike other crimes, wildlife offenses often occur in remote areas with limited witnesses, resulting in extremely low detection rates. Poaching undermines regulated hunting, erodes public trust, reduces funding streams critical to state wildlife agencies, and causes direct fiscal and biological harm to wildlife populations. Despite longstanding laws and penalties, enforcement and prosecution remain inconsistent, restitution is rarely collected, and penalties often fail to deter the offenders. Given these extremely low rates of detection, accurately estimating the number of undetected violators is equally problematic.
This executive summary synthesizes the findings of a landmark study conducted under the Boone and Crockett Club’s Poach & Pay Program. This comprehensive study is structured around seven integrated research phases: stakeholder attitudes, offender typologies, judicial barriers, detection rates, conservation costs, deterrence strategies, and the development of best management practices to curb the illegal taking of wildlife. It draws on historical context, stakeholder input, criminological theory, and empirical data to explore the multifaceted issue of wildlife poaching, with the aim of quantifying its impacts, understanding offender motivations, and improving detection and prosecution mechanisms.
Stakeholder Attitudes
Hunters, landowners, and conservation officers view poaching as a serious and widespread problem. All groups emphasized its social impacts, particularly its negative effect on the public perception of lawful hunting. Surveys across eight demographically and geographically representative states found overwhelming concern among hunters, landowners, and officers regarding poaching’s social and conservation impacts. Stakeholders consistently rated illegal take as a significant biological and social threat, especially in rural areas with high wildlife use. Detection and prosecution rates were viewed as low, and there was broad support for increasing fines, restitution, and enforcement measures.
Offender Typologies
Poachers are not a homogenous group of people. This study identified nine primary categories of poachers: trophy, commercial, subsistence, backdoor (convenience), recreational, protective, tradition/protest, challenge, and thrill-kill. Motivations range from ego, greed, and cultural norms to food needs and thrill-seeking, with many offenders justifying their actions through rationalization.
Judicial & Prosecutorial Barriers
This study demonstrated systemic barriers to the effective adjudication of illegal take cases, primarily due to prosecutorial and judicial unfamiliarity with wildlife crimes. Prosecutors cited a lack of training, statutory clarity, and dedicated resources as major challenges, whereas conservation officers expressed frustration with inconsistent outcomes. These weaknesses reduce deterrence and erode the morale of officers. Additionally, in many cases, wildlife crimes are often treated as low-priority, “victimless” offenses, resulting in dismissals or minimal penalties. Restitution frameworks also vary widely by state, with little standardization, and recovery rates through court-ordered replacement costs are low Although replacement costs vary widely across states, prosecutors indicated that license revocation, equipment confiscation, and incarceration were more effective than monetary penalties
Detection Rates & Conservation Costs
A central element of this study was quantifying the “dark figure” of undetected wildlife crime. Using Bayesian models informed by survey data, citation records, and telemetry studies, the analysis estimated true detection rates of 2–7%, which was far lower than stakeholder perceptions. This means that approximately 95% of poaching incidents are likely to go undetected. Such low detection rates represent a profound enforcement gap, making the certainty of apprehension a more critical deterrent than statutory severity. The cumulative losses from illegal take are substantial. By applying wildlife replacement values to detection estimates, state wildlife agencies and the public lose at least $1.44 billion annually in uncollected fines and replacement costs. On average, each state loses $28.7 million per year, exceeding the Wildlife Restoration (Pittman–Robertson) excise tax apportionments for 68% of states and hunting license revenue for 78% of states. Fiscal impacts are linked to reduced agency revenue, underfunded management priorities, and diminished federal conservation funding through the Pittman-Robertson program. These losses compound broader societal costs by eroding the public’s trust and stewardship.
Detecting and Deterring Poaching
The certainty of detection, not penalty severity, is the most effective deterrent. Conservation officers and stakeholders identified increased manpower, tip hotlines, rewards for reporting, and public education as the most effective tools for addressing poaching. License suspensions, equipment forfeiture, and the reclassification of serious poaching offenses as felonies were rated as stronger deterrents than fines or restitution alone. Public education and offender shaming were also seen as key tools for reducing the social acceptance of poaching and clarifying the distinction between lawful hunting and wildlife crime.
Finally, this study proposes a set of Best Management Practices designed to reduce the levels of big game poaching in the U.S. The proposed approach is holistic and focuses on increasing the detection rates of illegal activities, establishing punitive measures that discourage these activities, and increasing public awareness of the differences between poachers and legal hunters, as well as the public’s role in detecting, reporting, and deterring these heinous conservation crimes.
1.3. Target Neutralization Techniques with Public Education and Messaging ........................
1.4. Deploy Technology to Enhance Detection
1.5. Increase Legal and Social Costs of Violation................................................................
BMP 2: Wildlife Crime Policy and Regulation ................................................................
2.1. Strengthen and Simplify Statutory Language
2.2. Implement Robust and Consistent Penalties
2.3. Enhance the Interstate Wildlife Violator Compact
2.4. Refine Replacement Cost
2.5. Promote Equitable Comparison to Non-Wildlife Crimes
BMP 3: Prosecutorial Engagement in Wildlife Crime
3.1. Improve Prosecutorial Awareness and Training
3.2. Strengthen Communication Between Conservation Officers and Prosecutors ................
3.3. Support Effective and Proportionate Penalties.............................................................
3.4. Reduce Social Acceptability of Wildlife Crime
BMP 4: Increasing Public Awareness of Wildlife
4.1. Develop Comprehensive Public Education Campaigns ................................................
4.2. Encourage Public Reporting of Violations ....................................................................
4.3. Utilize Social
4.4.
5.1.
5.2.
5.3.
List of Tables
Table 1. Summary of the degree of concern among hunters regarding the illegal take of wildlife for certain geographic locations. ................................................................................................... - 27 -
Table 2. Summary of the degree of concern among hunters regarding negative impacts that the illegal take of wildlife has for certain biological or social factors. - 28 -
Table 3. Summary of the degree of concern among landowners regarding the illegal take of wildlife for certain geographic locations. - 30 -
Table 4. Summary of the degree of concern among landowners regarding negative impacts that the illegal take of wildlife has for certain biological or social factors. - 31 -
Table 5. Summary of the degree of concern among conservation officers regarding the illegal take of wildlife for certain geographic locations. .................................................................................. - 32 -
Table 6. Summary of the degree of concern among conservation officers regarding negative impacts that the illegal take of wildlife has for certain biological or social factors. ................................. - 34 -
Table 7. Legend for heat maps indicating levels of concern or agreement among hunters, landowners, and officers for various geographic, biological, and social factors........................ - 35 -
Table 8. Aggregate percentages of stakeholder groups reporting Serious Concern regarding illegal take at various geographic levels. - 36 -
Table 9. Aggregate percentages of stakeholder groups reporting Broad Concern regarding illegal take at various geographic levels. - 36 -
Table 10. Aggregate percentages of stakeholder groups reporting Some Concern regarding illegal take at various geographic levels.
Table 11. Aggregate stakeholder perceptions of the relative seriousness of illegal take of wildlife for certain biological and social factors. ........................................................................................ - 38 -
Table 12. Conservation officer responses (n=1,019) when asked to estimate the percent of several poacher typologies responsible for incidents involving the illegal take of wildlife......................- 43 -
Table 13. Conservation Officer (N=1,052) satisfaction levels with prosecutors in handling illegal take of big game cases..................................................................................................................... - 53 -
Table 14. Conservation Officer (N=1,054) satisfaction levels with judges/magistrates in handling illegal take of big game cases. - 54 -
Table 15. Conservation Officers (n=995) ranking of factors from (5) most effective to (1) least effective in their potential to increase conviction rates for illegal take. - 55 -
Table 16. Rating of the importance of factors regarding the defendant that prosecutors take into account when prosecuting an illegal take case. - 58 -
Table 17. Relative importance of prosecutorial priorities as they relate to their caseload. - 59 -
Table 18. Motivators or information that surveyed prosecutors indicated would increase their prioritization of wildlife crime prosecution. - 60 -
Table 19. Factors ranked from least important (1) to most important (7) that surveyed prosecutors consider when prosecuting a wildlife crime case. - 61 -
Table 20. Penalty components for illegal take of wildlife the surveyed prosecutors consider likely to reduce recidivism for wildlife crimes. ....................................................................................... - 61 -
Table 21. Convenience sample responses of persons committing acts of illegal take of wildlife. - 68 -
Table 22. Subset of 63 persons from self-report survey who committed acts of illegal take of wildlife....... - 68 -
Table 23. The state-by-state data on illegal take citations including the number of officers, hunters, and citations for illegal take written for each year of the study. ................................................. - 69 -
Table 24. By region, the percentage of illegal take that each Stakeholder Group believes goes undetected in their state of residence. - 70 -
Table 25. By region, the percentage of illegal take that each Stakeholder Group believes are detected but goes unreported in their state of residence. - 71 -
Table 26. Estimates of non-detection rates (dark figure) of wildlife crimes calculated from stakeholder responses. - 72 -
Table 27. Percentage of respondents that witnessed, were made aware of, reported, or were involved in incidents of illegal take in their state of residence from 2017-2021. ...................................... - 73 -
Table 28. The average number of incidents of illegal take that respondents indicated they personally witnessed or of which they were aware occurring in their state of residence from 20172021. - 73 -
Table 29. Illegal take detection rates reported in the literature from other studies.....................................- 80 -
Table 30. Various radio-telemetry research studies where the illegal take rates for big game were determined...............................................................................................................................- 83 -
Table 31. Key metrics for estimating detection rates of illegal take by state...............................................- 85 -
Table 32. Comparison of liberal and conservative Bayesian models for illegal take of big game. - 90 -
Table 33. Nominal (Minimum, Maximum, and Range) replacement costs for big game individuals illegally taken in the U.S. for 2024-25. - 92 -
Table 34. Average annual U.S. losses (based on the national average of minimum replacement costs), from loss of fines and replacement costs for illegal take of big game at varying detection levels. ....................................................................................................................... - 93 -
Table 35. Average annual losses per state (based on the national average of minimum replacement costs), from loss of fines and replacement costs for illegal take of big game at varying detection levels. ....................................................................................................................... - 93 -
Table 36. Wildlife restoration (PR) final apportionments, agency gross hunting license revenue, and agency operating budgets for 2023.* ........................................................................................ - 95 -
Table 37. Factors ranked by Conservation Officers (n=1,019) from least effective (1) to most effective (9) that they indicate have significant potential to increase illegal take discovery rates...........- 105 -
Table 38. Support for possible incentives or actions taken to improve the detection of the illegal take of wildlife in the respondent’s state of residence. (Hunters: n=13,675; Landowners: n=4,003). ................................................................................................................................ - 106 -
List of Figures
Figure 1. Prosecutors’ rank of the relative seriousness of six selected crimes, including "Illegal shooting of wildlife." - 56 -
Figure 2. General prosecutorial attitudes of respondents toward prosecuting wildlife crime.....................- 58 -
Figure 3. Posterior probability distributions of detection rate estimates for the illegal take of wildlife using a conservative prior (5%), empirical updates, and enforcement data. - 85 -
Figure 4. Alternate Bayesian models incorporating self-reports and stakeholder perception survey data using a conservative prior (5%). - 87 -
Figure 5. Posterior probability distributions of detection rate estimates for the illegal take of wildlife using a liberal prior (24.8%) with empirical and enforcement data. - 88 -
Figure 6. Alternate Bayesian models incorporated self-reports and stakeholder perceptions with a liberal prior (24.8%).................................................................................................................... - 89 -
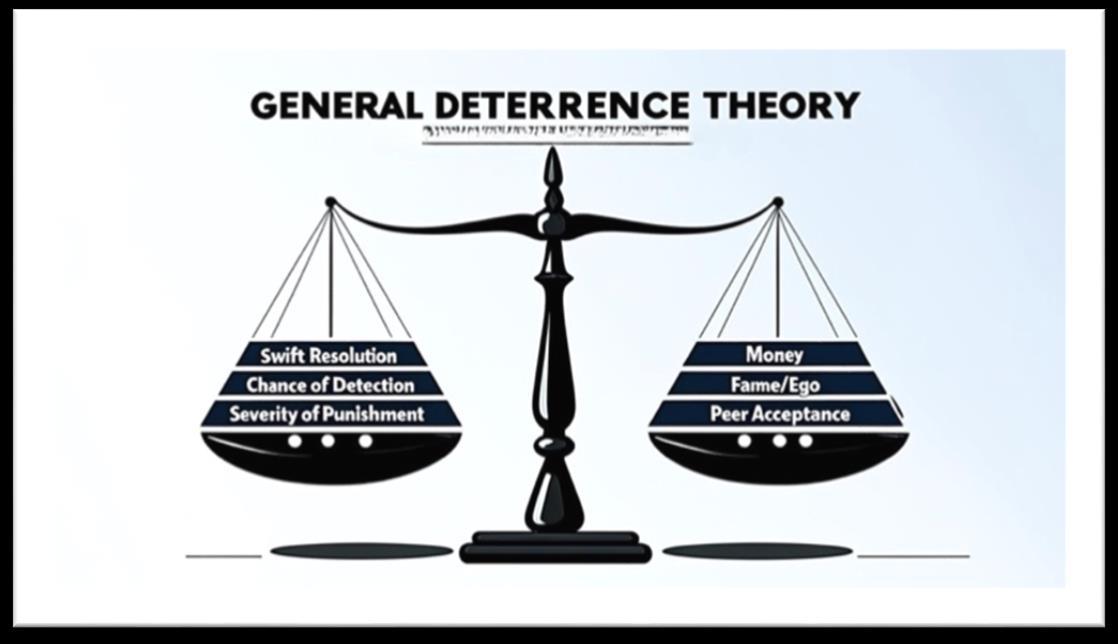
Figure 7. General Deterrence Theory posits that criminals weigh collective risks against collective rewards before deciding to commit a crime..............................................................................- 100 -
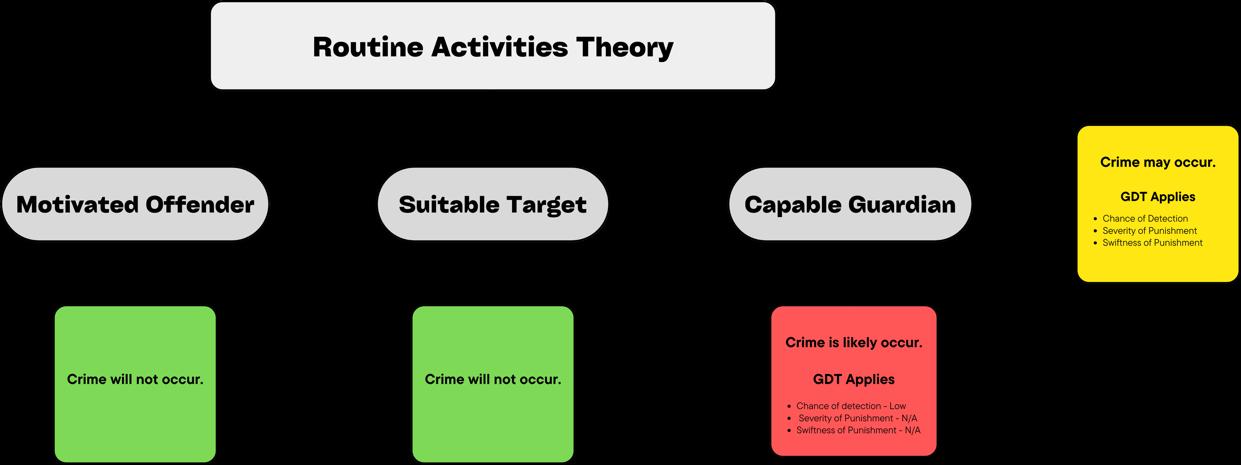
Figure 8. Decision-tree for determining whether to commit a crime based on Routine Activities and General Deterrence Theories. .................................................................................................. - 102 -
Figure 9. Relative Effectiveness of Agency Methodologies for Reducing the Rates of Illegal Take of Wildlife by Poacher Typology. - 107 -
Figure 10. Relative Effectiveness of Deterrents for Reducing the Rates of Illegal Take of Wildlife by Poacher Typology. - 109 -
THIS PAGE INTENTIONALLY LEFT BLANK.
Chapter 1: A Comprehensive Study of Illegal Take of Big Game
Wildlife management in the U.S. has undergone a profound transformation during the past 175+ years. In Colonial America, unregulated harvest and widespread market hunting led to severe population declines and, in some cases, the extirpation of big game species in areas populated by settlers (Eliason, 2012a; Organ & McCabe, 2018). The initial absence of statutory protections and adequate guardians, combined with the commercial exploitation of wildlife, has resulted in the substantial degradation of many public trust resources. Modern wildlife law began to take shape in the late 19th and early 20th centuries, and foundational statutes are grounded in the belief that wildlife collectively belongs to all citizens for their use and enjoyment. This premise, known as the Public Trust Doctrine (PTD), shifted the perception of wildlife from a commodity for private use to a publicly owned resource held in trust by government institutions. Within this framework, federal and state agencies act as trustees with a legal and ethical obligation to manage wildlife resources for the benefit of current and future generations (Batcheller et al., 2010; Batcheller et al., 2018; Geist et al., 2001; Jacobsen et al., 2010; Leopold, 2018b; Organ, 2018; Organ et al., 2012; Organ & McCabe, 2018).
Citizen Conservationists and the North American Model
In response to these early declines in wildlife populations, a network of influential conservation organizations emerged in the late 1800s and the early 1900s to champion science-based wildlife management that they felt should form the basis of sound policy and law. Groups such as the Boone and Crockett Club (B&C), Wildlife Management Institute (WMI), Ducks Unlimited (DU), and National Wildlife Federation (NWF) have played pivotal roles in advocating for legislative reforms, helping to secure dedicated conservation funding through mechanisms such as the PittmanRobertson (PR) and Dingell-Johnson (DJ) Acts, and strongly supporting the establishment of effective enforcement frameworks. Such organizations continue to work alongside state and federal wildlife agencies to advocate for sound conservation practices. State fish and wildlife agencies, along with federal entities such as the U.S. Fish and Wildlife Service (USFWS), the Bureau of Land Management (BLM), and the National Park Service (NPS), serve as the operational core of contemporary wildlife management. These entities are charged with enforcing wildlife laws, protecting species, and establishing conservation priorities.
Wildlife conservation in the U.S. follows the tenets of the North American Model of Wildlife Conservation (NAMWC). The 7 tenets of the NAMWC are explained in detail in Appendix A, including important standards such as basing wildlife policy relating to species population and habitat on sound, scientific evidence. Additionally, the NAMWC includes provisions that wildlife is allocated by law, can only be taken for legitimate purposes, and cannot be commercialized. Furthermore, citizens who are in good legal standing, purchase the required licenses and tags, and operate within the parameters of the law shall be allowed to hunt these animals (Organ, 2018; Organ et al., 2012 Organ & McCabe, 2018). Another important tenet of the NAMWC is the PTD framework, with states (trustees) managing wildlife for the public’s benefit. Stakeholders, including hunters, anglers, outdoor recreation and nature enthusiasts, and landowners, are beneficiaries of
this trust, contributing through license purchases, excise taxes, and increased public advocacy. Effective conservation requires not only the authority of trustees but also active collaboration with stakeholders (Batcheller et al., 2010; Decker et al., 2014). However, both management and enforcement efforts are sometimes impeded by issues such as limited agency resources, inconsistent application of penalties, and a lack of judicial prioritization of wildlife crimes (Eliason, 2011a; Filteau, 2012; von Essen et al., 2015; Weisheit, 2016; Weisheit & Wells, 1996; Wellsmith, 2011). This has resulted in a group of bad actors who, for various reasons, act on their impulses to illegally take wildlife with minimal risk of repercussions if they are caught. As illegal take continues to erode biological and institutional progress, strong alignment between trustees, conservation organizations, stakeholders, and the public is critical to maintaining the integrity of wildlife governance and the public’s trust in conservation efforts in the U.S.
The Boone and Crockett Club: Poach and Pay
The development and enforcement of wildlife laws during the last 175+ years, along with strict compliance by hunter and angler conservationists, are largely credited with the success of wildlife management in the past century. Unfortunately, few studies have explored the overall conservation impact of illegal wildlife take or poaching. These impacts often include the loss of desirable indviduals, declines in certain populations, reduced opportunities for hunters, and decreased revenue for the agencies. Fortunately, the B&C recognized some of the potential consequences of illegal take and decided to take action to learn more about the crime, its cost to conservation, and how to best address the problem.
The B&C is one of the oldest conservation organizations in North America. Since its founding, it has been a consistent and influential advocate of public ownership of wildlife and the principle of fair chase. Fair chase, as defined by the B&C is “the ethical, sportsmanlike, and lawful pursuit and taking of any free-ranging wild game animal in a manner that does not give the hunter an improper or unfair advantage over the game animals” (Calabi, 2020 B&C, 2021). Both the public ownership of wildlife and the concept of fair chase have been central to the successful restoration and conservation of the nation’s native big game species.
Regrettably, the visibility and media coverage of certain instances of illegal take of big game often exacerbate the public’s tendency to conflate “poaching” with legitimate “hunting,” thereby undermining the conservation benefits associated with regulated harvest. This confusion between lawful and unlawful take is unfortunate because legal hunters are not poachers, and “poachers are thieves” (B&C, n.d.b.) who steal publicly owned resources. In fact, legal hunters are often the complainants who take the time to report suspected instances of illegal take.
In 2016, the B&C launched a comprehensive effort to combat illegal wildlife take and reinforce the distinction between lawful, regulated hunting and wildlife crime. As a first step in this initiative, the B&C commissioned a study to evaluate state restitution systems associated with the illegal take of big game species. The study found that 42 states had enacted adequate penalties, fines, and restitution frameworks that reflected both the severity of the offense and the value of the illegally taken wildlife. However, the study also revealed that wildlife agencies widely perceive the judicial
system as a primary obstacle to the successful prosecution and punishment of poachers. Contributing factors included a general lack of prioritization of wildlife crimes by the courts, inconsistent application of penalties, frequent dismissal of cases, limited understanding of wildlife laws, and an overall failure to impose meaningful monetary penalties (Edwards, 2017).
Despite ongoing efforts to curb poaching, empirical data on the motivations behind illegal take in the U.S. are limited. Understanding these motivations is critical for developing targeted deterrents and effective enforcement strategies to combat poaching. Furthermore, while most states have the statutory authority to impose fines and restitution for illegal take, the effectiveness of the penalties hinges on their consistency, evidentiary foundation, and equitable enforcement by law enforcement officers, prosecutors, and judges. Further complicating enforcement, evidence suggests that detection rates for poaching are exceedingly low (Decker et al., 1980; Green, 2002; Green et al., 1988; Kaminsky, 1974; McMullan & Perrier, 2002; Smith, 1982; Vilkitis, 1968; Wellsmith, 2011; Wyatt, 2013), making it difficult to quantify the undetected violations. Additional detection data are essential for understanding the full impact of illegal take on public trust resources.
Findings from B&C’s initial study (Edwards, 2017) led to the development of the Poach & Pay Program, a collaborative initiative involving B&C, WMI, and Southern Wildlife Resources (SWR). While the original 2017 study focused on statutory reviews, penalty assessments, and law enforcement perspectives on the judiciary, the Poach & Pay Program represents a broader, ongoing research effort designed to assess, quantify, and address illegal wildlife take across the U.S.
The Poach & Pay initiative comprises 7 integrated research phases:
1. Assessing attitudes and perceptions of hunters, landowners, and conservation officers on the illegal take of big game.
2. Describing the typologies and behaviors of people who illegally take big game.
3. Identifying factors affecting prosecution and restitution for the illegal take of big game.
4. Estimating the undetected rates of the illegal take of big game.
5. Calculating the conservation impacts of the illegal take of big game.
6. Detecting and deterring the illegal take of big game.
7. Recommending Best Management Practices for reducing the illegal take of big game.
Assessing Stakeholder Attitudes and Opinions
It is crucial to comprehend the impacts of wildlife crime on ecological systems and stakeholder groups whose experiences, stewardship, and perceptions are directly affected. These impacts include the biological, social, and experiential consequences of illegal take on hunters, landowners, and the public. Three groups of stakeholders were chosen for this study including hunters, landowners, and conservation officers. Each was selected with the expectation that they were among those most likely to have an interest in illegal take or to encounter poachers whether while hunting, managing private lands, or patrolling in the course of official duties.
Understanding stakeholder perspectives is critical for assessing the broader consequences of poaching, particularly in terms of how it affects trust in wildlife management institutions, perceptions of fairness, and compliance with conservation laws. Past research has emphasized that poaching can erode social norms that support lawful behavior and diminish the perceived legitimacy of regulations (Eliason, 2003a; Forsyth & Marckese, 1993b). Moreover, ethical hunters may feel demoralized when illegal activities go unpunished or when the distinction between legal hunting and poaching is blurred. Likewise, landowners may become less inclined to support wildlife conservation when poachers damage their property or undermine wildlife stewardship on private lands. Conservation officers, who are tasked with enforcing wildlife laws, offer a unique frontline perspective on detection challenges, judicial barriers, and public cooperation.
By gaining a better understanding of the perceptions of these three stakeholder groups, we aimed to further ascertain the true costs and effects of illegal take on wildlife populations, hunter experiences, landowner trust, and non-hunter perceptions of regulated hunting and wildlife governance.
Typologies, Motivations, and Deterrents of Poaching Behavior
Few studies have delved into the motivational factors driving individuals to illegally take wildlife in the U.S., with existing research primarily focusing on poacher typologies and the occupational responses of conservation officers (Blevins & Edwards, 2009; Carter, 2004; Clifford, 1998; Eliason, 2003a, 2003b, 2004, 2007, 2008; Falcone, 2004; Forsyth et al., 1998; Green, 2002; Green et al., 1988; Lanham, 2013; Muth & Bowe, 1998; Serenari & Peterson, 2016; Shelley & Crow, 2009; Sherblom et al., 2002; Weisheit et al., 2006). The extant literature indicates that trophy poaching, misunderstood individual rights to take wildlife, convenience or opportunity, commercialization of poached products, and subsistence are potential motivators for committing wildlife crimes.
Recent studies suggest that poachers are not a homgeneous group. Instead, they fall into distinct behavioral categories, such as opportunistic, habitual, commercial, and subsistence violators, each with different motivations and justifications for illegal take (Eliason, 2003a; Carter, 2004). For example, some violators act out of tradition, economic necessity, or cultural identity, while others deliberately circumvent game laws for personal gain or perceived injustice. Moreover, offenders often rationalize their behavior using techniques of neutralization, minimizing harm, denying responsibility, or condemning the condemners (Eliason, 2004; Clifford, 1998).
Understanding these motivations is critical for deterring wildlife crime. General criminological theory suggests that offenders tend to weigh the certainty of apprehension, severity of penalties, and swiftness of punishment before committing a crime, principles that likely apply to poachers as well (Nagin, 2013; Pratt et al., 2006). However, in the context of wildlife crime, moral perceptions and social acceptance often override the fear of punishment. When hunters, landowners, or the public view poaching as a low-level offense or a “victimless” crime, enforcement becomes more difficult and deterrence is less effective (Muth & Bowe, 1998; Weisheit et al., 2006).By investigating why some individuals choose to willfully violate fish and wildlife laws while others do not, this research contributes to a foundational understanding of how enforcement strategies, penalties,
and social norms can be better aligned to reduce wildlife crime. Beyond legal costs, factors such as the risk of detection, speed of adjudication, real or perceived morality of the crime, public disapproval, and an accurate understanding of conservation impacts may serve as specific deterrents that decrease the willingness to commit wildlife crimes. These insights are essential for formulating actionable strategies for agencies, courts, and conservation groups.
Identifying Judicial and Prosecutorial Barriers
Understanding the complex challenges that prosecutors face in adjudicating wildlife crimes is vital for improving outcomes and increasing the effectiveness of wildlife law enforcement. Although all states have statutory provisions for illegal take that have associated penalties, and most (84%) have adequate restitution for illegally taken wildlife, the implementation and enforcement of these provisions vary widely. Interviews previously conducted with judges and prosecutors reveal that leniency, inconsistent statutory language, and difficulties in calculating or collecting restitution contribute to reduced deterrent effects and undermine the credibility of enforcement systems (Edwards, 2017; Serenari & Peterson, 2016; Wellsmith, 2011). Without the consistent and proportional application of penalties and replacement costs, the overall legal framework fails to deliver consequences that reflect the true biological and economic harm caused by wildlife crimes. This segment of the study aimed to explore and define what constitutes fair and proportional penalties while examining the institutional and statutory barriers that impede successful prosecution.
Estimating the Undetected Rates of the Illegal Take of Big Game
Although enforcement agencies and wildlife officials can identify and document some instances of illegal big game take, the true scale of poaching in the U.S. remains largely hidden. Like many victimless crimes, wildlife violations frequently go undetected and unreported, preventing accurate assessments of their prevalence and impact. Unlike other criminal offenses that rely on victims or witnesses to report violations, wildlife crimes often occur in remote areas, are not witnessed, or are committed by individuals who blend unlawful acts with legal hunting. As a result, the true scope of poaching is largely unknown and is only partially reflected in official citation and conviction data (Decker et al., 1980; Green, 2002; Green et al., 1988; Kaminsky, 1974; McMullan & Perrier, 2002; Muth et al., 1998; Smith, 1982; Vilkitis, 1968; Wellsmith, 2011; Wyatt, 2013).
Despite widespread concerns among wildlife professionals about the “dark figure” of wildlife crime, few peer-reviewed studies have attempted to quantify undetected violations or estimate national detection rates. To address this knowledge gap, we compiled and analyzed a range of data sources, including published studies, stakeholder surveys, radio telemetry data, and citation records from eight states, to derive an estimate of the true detection rate for the illegal take of big game. These data were evaluated using a Bayesian statistical framework to improve accuracy and account for uncertainty.
Understanding the magnitude of the “dark figure” is essential not only for enforcement and resource allocation, but also for assessing the real costs of wildlife crimes. If, for example, 95% of poaching incidents remain undetected, as some models suggest, the financial and ecological impacts are far more severe than citation records would indicate. This section explores how researchers can estimate undetected illegal take using indirect methods and demonstrates the value of integrating stakeholder perceptions, enforcement data, and independent animal monitoring tools into one coherent analytic model.
Conservation Impacts of the Illegal Take of Big Game
The illegal take of big game is more than just a criminal justice issue. This is a critical conservation challenge with far-reaching ecological and financial consequences. Unlike many other government agencies, state fish and wildlife agencies rely heavily on voluntary funding through license and permit sales (Batcheller et al., 2018; Organ, 2018). These revenues form the backbone of conservation programs, habitat restoration, research, and public outreach. When poaching depletes big game populations and degrades the quality of legal hunting opportunities, it threatens both wildlife and the long-term financial stability of the agencies tasked with their protection.
Despite the seriousness of these offenses, most poaching incidents remain undetected. The previous segment of this study examining detection rates for the illegal take of big game indicates that they are alarmingly low, creating a large “dark figure ” These undetected violations translate into millions of dollars in lost replacement costs, fines, and penalties resources that could otherwise support wildlife conservation. In addition to these direct financial losses, undetected poaching diminishes public trust, reduces hunting participation, and undermines federal conservation funding derived from excise taxes on outdoor-related equipment. This segment of the study quantifies the conservation costs of undetected poaching by applying current replacement cost figures and fine structures to the estimated detection rates. By comparing these losses to key fiscal benchmarks, such as annual Wildlife Restoration apportionments, gross revenue from license sales, and state agency operating budgets, we illustrate the profound and measurable impact of illegal take on the conservation landscape across the United States.
Detecting and Deterring the Illegal Take of Big Game
Understanding and reducing the illegal take of big game requires more than just stronger penalties; it demands a thorough examination of the cognitive, behavioral, and situational factors that influence poacher decision-making. Criminological theory provides a powerful framework for analyzing wildlife crimes and guiding the development of proactive enforcement and deterrence strategies. Among these frameworks, General Deterrence Theory, Routine Activities Theory, and Neutralization Theory offer key insights into why individuals choose to commit wildlife crimes and how to prevent them (Cohen & Felson, 1979; Crow et al., 2013; Eliason, 2012b; Pratt, 2006; Sykes & Matza, 1957).
While some wildlife violations are driven by cultural and social norms or subsistence needs, many are deliberate and rational decisions made when the perceived benefits outweigh the risks. As the data from this study show, poachers often act with confidence that they will not be detected and rationalize their actions using familiar psychological justifications. Enhancing the perceived certainty of apprehension through increased enforcement visibility, anonymous tip lines, and targeted patrols may be more effective than simply increasing penalties.
This segment of the study integrates theoretical models with empirical findings from surveys and interviews with hunters, landowners, conservation officers, and convicted poachers to present a comprehensive approach to preventing wildlife crime. It also evaluates the perceived effectiveness of various enforcement and outreach strategies, drawing on the lived experiences of those most likely to witness or deter poaching incidents. Taken together, these data provide a set of practical, evidence-based recommendations for reducing the illegal take of big game.
Summary
The 7 phases of this study were designed to collectively gather, analyze, and interpret data using modern statistical, scientific, and sociological methodologies aimed at effectively reducing poaching rates in the U.S. These efforts yielded a comprehensive set of findings that not only illuminate the multifaceted nature of poaching in the U.S. but also present practical, data-informed strategies in the form of best management practices (BMPs) organized and presented in strategic areas to mitigate illegal take. BMPs address both the structural and behavioral dimensions of wildlife crime. Together, they form a practical roadmap for improving deterrence, streamlining prosecution, and fostering community co-stewardship in wildlife conservation. Collectively, BMPs aim to enhance conviction rates, increase the application of meaningful sanctions, and strengthen the integrity of wildlife law enforcement systems nationwide. Effective wildlife crime prevention and enforcement require more than traditional deterrence strategies; they demand empirical evidence and adaptive decision-making built on consistent, comprehensive, and comparable data. Although some state wildlife agencies maintain detailed citation and enforcement databases, others operate with limited or incomplete information, lacking access to narrative reports, judicial outcomes, or undetected incident estimates. This inconsistency restricts the ability to implement and evaluate evidence-based interventions on a large scale.
To fully understand the drivers, detection rates, and judicial outcomes of the illegal take of big game, data systems must evolve to include both direct and indirect indicators of poaching. The strategic collection and analysis of these data will allow agencies to document the scope of wildlife crime and measure the effectiveness of interventions, such as increased patrol presence, public outreach campaigns, and emerging technologies, such as drones or decoys. Furthermore, standardized, accessible, and actionable data will provide a foundation for outcome and process evaluations, ensuring that strategies are not only implemented but also monitored and improved based on their real-world performance.
THIS PAGE INTENTIONALLY LEFT BLANK.
Chapter 2: Attitudes and Opinions of Hunters, Landowners, and Conservation Officers on the Illegal Take of Big Game
Background
Wildlife management in the U.S. is based on a grantor/trustee relationship, whereby the government holds and manages wildlife on behalf of and for the benefit of the public (Batcheller et al., 2010; Geist et al., 2001; Geist & Organ, 2004; Organ et al., 2012; Organ & McCabe, 2018). This makes all stakeholders vested in the ownership and responsible conservation of fish and wildlife resources. All these collective “owners” of wildlife benefit either directly or indirectly from healthy and sustainable fish and wildlife populations and habitats. The nature of the relationships among stakeholders and trustees varies significantly based on their interests, motives, and involvement in the protection and management of wildlife populations and habitats (Jacobsen et al., 2010). For example, hunters, anglers, recreational shooters, and boaters provide direct financial support for conservation actions by trustees through the purchase of hunting and fishing licenses and permits, as well as excise taxes on products (firearms, ammunition, archery equipment, fishing tackle, and boat fuel) (USFWS, n.d.b). Of these groups, hunters and anglers are most directly tied to the conservation model because they also pursue sustainable numbers of certain wildlife populations for food, recreation, and other purposes. While landowners can sometimes appear conflicted over the private versus public aspects (e.g., public wildlife using private lands) of the PTD (Watson, 2012), they are also tied closely to the model because most wildlife species reside or spend significant time on private land, especially in the eastern U.S.
Elected and/or appointed officials of the government, the federal and state legislative bodies, as well as executive branch leadership, are the trustees charged with resource protection. However, the operational aspects of this trust responsibility are almost always delegated to professional wildlife managers who are responsible for the day-to-day care and protection of these resources. Managers often include state and federal wildlife biologists, land management professionals, law enforcement officers, and other wildlife agency staff (Decker et al. 2015; Smith, 2011). In most cases, resource protection from illegal take is relegated to law enforcement divisions of state fish and wildlife agencies. Conservation officers or game wardens within these divisions have the primary responsibility of enforcing laws designed to conserve and protect wildlife, habitats, landscapes, and other natural areas across the U.S. (Forsyth, 2008; Hall, 1992; Lanham, 2013; Paz & Heffelfinger, 2018; Shelley & Crow, 2009).
The impacts of wildlife poaching on stakeholders are crucial to comprehend, encompassing not only the biological effects but also the experiential and social impacts on key stakeholder groups, including hunters, landowners, and the public. As PTD beneficiaries, stakeholders play a significant role in shaping wildlife conservation policies. While trustees are tasked with resource management and protection, stakeholders must provide input, demand accountability, and ensure that conservation efforts align with societal values and expectations (Decker et al., 2015; Duffy et al., 2016).
Objectives
1. To determine and evaluate stakeholder opinions on the real or perceived impacts of illegal take in specific geographic areas (results reported in this section)
2. To determine and evaluate stakeholder opinions on the real or perceived impacts of illegal take on certain biological or social factors (results reported in this section).
3. To assess stakeholder opinions on the levels of detection, reporting, and resolution of illegal take crimes (results reported in the detection section)
4. To delineate stakeholder ideas on potential deterrents for wildlife crimes (results reported in the deterrents section).
Methods
For this segment of the study, we developed and administered a comprehensive survey to three groups of respondents (hunters, landowners, and conservation officers) across eight subject states. The eight states were selected based on variability in geographic region, population density (urban vs. rural), land ownership patterns (public vs. private land), and availability of big game species. The states participating in the study were Maine, Michigan, Missouri, Nevada, North Carolina, Ohio, Oregon, and Pennsylvania. States were grouped regionally for analysis as follows: Oregon and Nevada (West), Ohio and Michigan (Midwest), Pennsylvania and Maine (Northeast), and Missouri and North Carolina (Southeast). This ensured that each of the four major U.S. regions was represented by two states.
Sampling and Respondents
The impacts of illegal take of big game often include the loss of desirable genetic material, declines in certain populations or population age-classes, reduced opportunities for hunters, and decreased revenue for agencies. The impacts of these wildlife crimes encompass not only biological effects but also experiential and social impacts on hunters, landowners, and the public. We selected two stakeholder groups (hunters and landowners) and one trustee group (state wildlife agencies – represented by conservation officers) to determine their perceptions of the impacts associated with the illegal take of wildlife, specifically big game species.
Hunters
We distributed an email-based survey to 80,000 licensed hunters residing in the subject states (10,000 per state). Hunters were randomly selected from pools of individuals who had purchased hunting licenses in each of the five years preceding the survey. This selection ensured that the respondents were active hunters with recent experience and familiarity with wildlife regulations.
Landowners
We distributed an email-based survey to 80,000 landowners across the subject states (10,000 per state). Lists of landowners were acquired from Exact Data® and prescreened to include owners of recreational or agricultural lands (farms, fields, pastures, ranches, barren lands, open lands, etc.). Because of the limited potential respondent pools in Nevada and Maine, adjacent states (Utah for
Nevada; Massachusetts and New Hampshire for Maine) were used to supplement the sample and meet the 10,000-subject quota per state.
Conservation Officers
We distributed surveys to all 1,206 active state conservation officers in the eight subject states using contact lists that were provided directly by state wildlife agency law enforcement divisions. These surveys included both the core set of stakeholder questions and additional questions on workload, supervision, patrol methodology, area of coverage, deterrents, and judicial interactions.
Survey Instrument
The survey instrument included a combination of Likert scale questions, closed-ended multiplechoice items, rank-order items, and open-ended response options.
• Likert scale items measured respondent perceptions on either a five-point scale (e.g., extremely serious, very serious, somewhat serious, not so serious, not at all serious) or a seven-point scale (ranging from strongly disagree to strongly agree).
• The questions were structured to capture the biological, experiential, and social impacts of poaching, as well as views on deterrents, detection, motivations, and judicial outcomes.
• Ranked-choice questions allowed respondents to prioritize lists of factors central to the issue of detecting, reporting, and resolving illegal take activities (e.g., deterrent methods, reasons for not reporting, etc.)
• Open-ended questions allowed respondents to provide examples of poaching, enforcement challenges, or judicial shortcomings.
• Officer-specific surveys included quantitative workload questions (e.g., number of patrol hours and citations issued) and qualitative items on perceived barriers to enforcement.
The surveys were administered via the SurveyMonkey® web platform and were fielded three times during the study period to increase participation and reduce sampling error. Definitions were standardized across all surveys. For example, “illegal take” (poaching) was defined as the deliberate shooting or killing (or attempting to shoot or kill) of any native, wild big game species as recognized by B&C, but with the inclusion of wild turkeys (classified as big game in some states).
Application Across Research Chapters
Because the surveys were comprehensive, the results are reported throughout multiple segments in this report. To avoid redundancy, the methodology is described here in full, with references back to this section in subsequent segments, as described here:
1. Assessing attitudes and perceptions of hunters, landowners, and conservation officers on the illegal take of big game - Questions on perceptions of hunters, landowners, and officers on the seriousness, impacts, and acceptability of poaching
2. Describing the typologies and behaviors of people who illegally take big gameQuestions to stakeholders on the perceived motivations of poachers (e.g., subsistence, trophy, thrill-seeking) are analyzed in typology development.
3. Identifying factors affecting prosecution and restitution for the illegal take of big gameQuestions regarding judges, prosecutors, and the judicial system are presented in the context of judicial outcomes and barriers to effective adjudication.
4. Estimating the undetected rates of the illegal take of big game - Questions on frequency of witnessing or reporting poaching events are analyzed alongside citation data.
5. Calculating the conservation impacts of the illegal take of big game - (no survey components used in this segment).
6. Detecting and deterring the illegal take of big game - Questions on support for fines, restitution, license suspensions, and other penalties are incorporated into deterrent effectiveness models.
Stakeholder and Trustee Focus
The three groups (hunters, landowners, and conservation officers) were selected with the expectation that they are most likely to encounter poachers directly: hunters while afield, landowners on their property, and officers while patrolling. By combining the perspectives of grantors (hunters and landowners) and trustees (conservation officers), this study provides a comprehensive assessment of poaching’s biological, experiential, and social impacts. By gaining a better understanding of the perceptions of these impacts, we hoped to further ascertain the true costs and effects of these crimes on wildlife populations, hunter experiences, and non-hunter perceptions.
Definitions of Violations
The enforcement responsibilities of conservation officers can be broadly categorized into three areas: 1) conservation (e.g., hunting and fishing law enforcement), 2) boating safety, and 3) general policing. For the purposes of this research, we concentrated on conservation-related offenses. States also differ in their definitions of what actions constitute illegal wildlife take. In this study, we defined the illegal take, or poaching, of big game as the deliberate shooting or killing (or attempting to shoot or kill) of any native, wild, big game species as recognized by B&C, but with the inclusion of wild turkeys (classified as big game in some states). Illegal take offenses were further categorized into three types, both for clarity and to minimize the potential for overestimation of conservation impact. These categories were:
1. Intentional take: Shooting or killing wildlife out of season, outside legal hours, over bait (where prohibited), using illegal devices, or without the required licenses/permits.
2. Accidental take: Legally shooting or killing one animal but inadvertently causing the death of another, lack of awareness of property or hunt area boundaries, etc.
For the purposes of this research, replacement costs were only assigned to offenses in the intentional take category, while accidental take and technical violations were categorized as general fish and wildlife violations, with minimal fines and no replacement costs assigned.
Geography & Scale Impacts
To assess the geographic level of concern that hunters, landowners, and officers have for poaching activities, the respondents were asked to evaluate the seriousness of illegal take at different spatial levels. For hunters and landowners, these included the following:
1. Hunting lands in state of residence.
2. State of residence in general.
3. Hunting lands in other states.
4. The U.S. in general.
Conservation officers were asked similar questions but were only provided with response options for their state of residence (Option 2) and the U.S. in general (Option 4). Participants rated their level of seriousness for each factor on a 5-point Likert scale (ranging from Extremely Serious to Not at All Serious) that we designated as Direct Response Categories. Responses were analyzed by region (West, Midwest, Northeast, Southeast) with statistical comparisons between each region denoted by superscript letters (see Appendix B for detailed results). To summarize regional attitudes, we designated three Aggregated Response Categories as follows:
• Serious Concern = Extremely Serious responses.
• Broad Concern = Extremely Serious + Very Serious responses.
• General Concern = Extremely Serious + Very Serious + Somewhat Serious responses.
Biological & Social Impacts
To assess the biological and social levels of concern that hunters, landowners, and officers have regarding poaching activities, the respondents were asked to evaluate the seriousness of illegal take for various biological and social factors. Specifically, we asked them to provide their opinions on six key factors.
1. Wildlife populations.
2. Hunt quality.
3. Hunt opportunity.
4. Access to land for hunting.
5. Personal perception of hunting.
6. Public perception of hunting.
For the biological and social impact questions, participants rated their agreement with statements on a 7-point Likert scale (ranging from Strongly Agree to Strongly Disagree) that we designated as Direct Response Categories. Responses were analyzed by region (West, Midwest, Northeast, Southeast), with statistical comparisons among regions denoted by superscript letters (see
Appendix B for detailed results). To summarize regional attitudes, we designated three Aggregated Response Categories as follows:
Hunters were extensively surveyed as part of this research project for several reasons. Importantly, law-abiding hunters are primarily the paying customers (stakeholders) of the state wildlife agencies (trustees) charged with wildlife management, and therefore have long been the primary funding source for conservation in the U.S. Through their actions, hunters are also likely to have a vested interest in and understanding of the subject matter surrounding wildlife crime. The activities of hunters also place them in situations (hunting, scouting, etc.) that likely allow them to become familiar with the timing and circumstances associated with illegal wildlife poaching. Finally, while the public suffers losses when wildlife crimes are committed, hunters are most often the tip of the spear for that impact, frequently being improperly lumped together with poachers by the nonhunting public, who often struggle to differentiate between lawful hunting and illegal acts of poaching. We received 13,640 responses (17% response rate) from hunters across the 8 subject states.
Geographic Impacts
In this study, hunters indicated Serious Concern for the negative impacts associated with the illegal take of wildlife, which was approximately double that expected from random chance (random chance = 20%). Of the responding hunters, 38.3% indicated this level of concern for lands where they hunt in their state of residence, 41.1% indicated this level for hunting lands in other states, 38.6% indicated this level for their state of residence in general, and 40.4% indicated this level of concern for the U.S. in general (Table 1).
At the Broad Concern level, most hunters (57.7%) indicated that the impact of illegal take on lands where they hunt in their state of residence was an issue (Table 1). Hunters had similar response levels for their state of residence (65.8%), lands where they hunted in other states (66.2%), and the U.S. generally (68.8%).
We found that hunters generally felt that illegal take was less of a problem as the geographic scale narrowed, with 74.5% indicating that illegal take was of General Concern for lands where they hunted in their state of residence. Regarding their perceptions on a greater geographic scale, 89.8% of hunters reported that illegal take was of General Concern for their state of residence, and 87.9% reported General Concern for the impacts on hunting lands in other states. At the national level, 92.1% reported General Concern about the impact of illegal take (Table 1).
Table 1. Summary of the degree of concern among hunters regarding the illegal take of wildlife for certain geographic locations.
Biological & Social Impacts
Overall, the hunters surveyed indicated a Strong Agreement that illegal take of wildlife may have detrimental biological and social impacts, ranging from 40.0% of respondents indicating that it would affect wildlife populations to 56.3% of respondents indicating that illegal take would negatively affect public perception of hunting. Similarly, close to half of the hunters reported Strong Agreement that hunt quality (46.7%), hunt opportunity (42.4%), and access to hunting lands (48.7%) were all concerns, with the majority either moderately or strongly agreeing that poaching has a detrimental impact on these factors. Regarding their personal perception of hunting, 32.1% of hunters indicated Strong Agreement that illegal take was an issue (Table 2).
Except for how illegal take impacts their personal perception of hunting, most hunters from all regions indicated Broad Agreement that there are significant negative biological and social impacts associated with the illegal take of wildlife (Table 2). While hunters had lower levels of Broad Agreement about self-perception (46.3%), they were much more concerned about how the nonhunting public perceived them, with 74.0% indicating Broad Agreement that these illegal actions have a negative impact on public perception. The social impact on public perception that results
from the illegal take of wildlife cannot be overstated. Negative public perception can cause lawabiding hunters to be targeted by anti-hunting organizations; however, a greater concern is the inability of the non-hunting public to differentiate between lawful, regulated hunting and illegal take or poaching.
A strong majority (>75%) of hunters indicated General Agreement on the impact on wildlife populations (West), hunt quality (West, Midwest, Southeast), hunt opportunity (West, Midwest, Southeast), land access for hunting (West, Midwest, Southeast), and public perception of hunting (All). While all regions indicated a majority response for personal perception of hunting (59.8%), it was lower than the impact on public perceptions of hunting (83.3%), meaning that they were much more concerned about how other people feel about hunting than how they may feel themselves (Table 2).
Table 2. Summary of the degree of concern among hunters regarding negative impacts that the illegal take of wildlife has for certain biological or social factors.
Biological or Social Factor Region
Table 2. Summary of the degree of concern among hunters regarding negative impacts that the illegal take of wildlife has for certain biological or social factors.
or Social Factor
Landowner Perceptions on Illegal Take of Wildlife
Landowners were chosen as a representative stakeholder group for this project for several reasons Importantly, the lands where poaching occurs are often privately held in many cases. In addition, landowners tend to be aware of activities, illegal or otherwise, that may be occurring on their properties. Through their actions, landowners are also likely to have a vested interest in and understanding of the subject matter surrounding wildlife crime. Landowners’ activities are also likely to place them in situations that allow them to become familiar with the timing and circumstances associated with illegal wildlife activities. Ultimately, we received 4,003 responses (5% response rate) from landowners across the 8 subject states.
Geographic Impacts
In this study, landowners indicated Serious Concern for the negative impacts associated with illegal wildlife take that were higher than expected from random chance (random chance = 20%) Landowner responses ranged from 32.8% for lands owned in their state of residence to 35.1% for the U.S. in general. Of the responding landowners, 34.9% indicated this level of concern for lands they owned other than in their state of residence, and 33.8% indicated this level for their state of residence in general (Table 3).
At the Broad Concern level, many landowners (48.4%) indicated that the impact of illegal take on lands they own in their state of residence was an issue (Table 3). Landowners had significantly higher response levels for their state of residence (63.2%), lands they owned in other states (61.0%), and the U.S. generally (66.1%).
We found that landowners generally felt that illegal take was less of a problem as the geographic scale became narrower, with 60.9% indicating that illegal take was of General Concern for lands they owned in their state of residence. Regarding their perceptions from a greater geographic scale, 88.4% of landowners reported that illegal take was of General Concern for their state of residence generally, and 84.0% reported General Concern for the impacts on lands they own in other states. At the national level, 91.0% reported General Concern about the impact of illegal take of wildlife (Table 3).
Table 3. Summary of the degree of concern among landowners regarding the illegal take of wildlife for certain geographic locations.
Biological & Social Impacts
Overall, the landowners surveyed indicated Strong Agreement that illegal take of wildlife may have detrimental biological and social impacts, ranging from 33.5% of respondents indicating that it would affect their personal perception of hunting to 43.7% of respondents indicating that illegal take would negatively affect public perception of hunting. Likewise, more than double the number of landowners than expected by random chance (random chance = 14.3%) reported Strong Agreement that hunt quality (38.0%), hunt opportunity (34.9%), and access to hunting lands (40.2%) were all concerns, with the majority either moderately or strongly agreeing that poaching has a detrimental impact on these factors. Regarding their perspectives on the impacts on wildlife populations, 36.8% of landowners indicated Strong Agreement that illegal take was an issue (Table 4).
Many landowners indicated Broad Agreement that there are significant negative biological and social impacts associated with the illegal take of wildlife (Table 4). Most landowners expressed Broad Agreement on concerns regarding impacts on populations (58.0%), hunt quality (58.6%), hunt opportunity (56.7%), and lands accessible for hunting (58.6%). While landowners had lower levels of Broad Agreement about self-perception (49.9%), they were much more concerned about
how the non-hunting public, with 63.5% indicating Broad Agreement that these illegal actions have a negative impact on public perception. The social impact on public perception that results from the illegal take of wildlife cannot be overstated. Negative public perception can cause lawabiding landowners to be targeted by anti-hunting organizations, but a greater concern is the inability of the non-hunting public to differentiate between lawful, regulated hunting and illegal take, or poaching.
Most landowners (>50%) indicated General Agreement for impacts on wildlife populations (68.3%), hunt quality (69.0%), hunt opportunity (69.2%), land access for hunting (68.2%), personal perception of hunting (62.5%), and public perception of hunting (73.9%). Generally, landowners appear to be much more concerned about how other people feel about hunting than how they feel about it (Table 4).
Table 4. Summary of the degree of concern among landowners regarding negative impacts that the illegal take of wildlife has for certain biological or social factors.
Biological or Social Factor Region
Table 4. Summary of the degree of concern among landowners regarding negative impacts that the illegal take of wildlife has for certain biological or social factors.
or Social Factor
Officer Perceptions of Illegal Take of Wildlife
Conservation officers were surveyed extensively as the representative “Trustee” for this project, as they represent the front line in the battle to reduce the illegal take of wildlife in the U.S. We received 1,107 responses (92% response rate) from officers across the 8 subject states.
Geographic Impacts
In this study, officers indicated Serious Concern for the negative impacts associated with illegal wildlife take that were higher than expected from random chance (random chance = 20%). Officer responses ranged from 32.7% for their state of residence to 35.0% for the U.S. in general. Officers were not asked the companion questions offered to hunters and anglers that measured responses at the two land ownership levels (Table 5). At the Broad Concern level, most officers (80.0%) indicated that the impact of illegal take on lands in their state of residence was an issue. Officers generally had significantly higher response levels for their state of residence (82.4%). We found that officers generally felt that the illegal take problem was more similar across the geographic scale than either hunters or landowners, with 98.5% indicating that illegal take was of General Concern for their state of residence in general, and 99.1% reporting that illegal take was of General Concern for the U.S. generally (Table 5).
Table 5. Summary of the degree of concern among conservation officers regarding the illegal take of wildlife for certain geographic locations.
Table 5. Summary of the degree of concern among conservation officers regarding the illegal take of wildlife for certain geographic locations.
Biological & Social Impacts
Both the operational area and state of residence are presented in Table 6 However, responses from officers were similar in almost all categories, strengthening the idea that most feel that illegal take is an issue that is uniform and widespread. The following analysis is for the officers’ responses to their state of residence, but similar conclusions can be drawn from examining their responses when restricted to their area of operation.
Overall, the officers surveyed indicated a Strong Agreement that illegal take of wildlife may have detrimental biological and social impacts, with only slightly more respondents (18.3%) than expected by random chance (random chance = 14.3%) indicating that it would affect their personal perception of hunting compared to 36.7% of respondents indicating that illegal take would negatively affect public perception of hunting. Similar to their responses for personal perception of hunting, almost twice the number of officers as that expected by random chance reported Strong Agreement that hunt quality (27.7%), hunt opportunity (22.0%), and impacts on wildlife populations (23.9%) were impacted by illegal take. Regarding access to hunting lands, 32.1% of officers indicated Strong Agreement that illegal take was an issue (Table 6).
For all factors except hunt opportunity and personal perception of hunting, most officers indicated Broad Agreement that there were significant negative biological and social impacts associated with the illegal take of wildlife (Table 6). Some officers reported Broad Agreement with the impacts on hunting opportunities (49.1%) and personal perceptions of hunting (35.8%). Most officers expressed Broad Agreement with concerns about the impacts on populations (51.4%), hunt quality (58.9%), lands accessible for hunting (60.2%), and public perception of hunting (66.2%). The social impact on public perception that results from the illegal take of wildlife cannot be overstated. While officers had lower levels of Broad Agreement about the self-perception of hunting (35.8%), they were much more concerned about how the non-hunting public perceived hunting, with 66.2% indicating Broad Agreement that these illegal actions had a negative impact on public perception.
A strong majority (>75%) of officers indicated General Agreement on the impacts on wildlife populations (77.4%), hunt quality (81.5%), hunt opportunity (76.3%), land access for hunting (82.7%), and public perception of hunting (85.4%). A small majority (54.9%) of officers felt that illegal take negatively impacted their personal perception of hunting. Generally, officers appeared
to be much more concerned about how other people feel about hunting than how they may feel about it themselves (Table 6).
Table 6. Summary of the degree of concern among conservation officers regarding negative impacts that the illegal take of wildlife has for certain biological or social factors.
Factor
quality
In many cases, responses to geography and scale, as well as biological and social factors, were similar among hunters, landowners, and officers. Overall, the three groups may have had
significantly different experiences and motivations. We attribute many of the similarities found in this study to a common interest in hunting (i.e., those who hunt are more likely to respond to surveys on this subject than those who do not hunt). We observed a general escalation in concern or agreement from all groups on most factors at a level that exceeded what would be expected by random chance. To summarize the perceived impact of illegal take across stakeholders as it relates to geographic, scale, biological, and social factors, we developed heat maps to graphically display the most concerning factors indicated by each stakeholder group. Because conservation officers were not asked about the lands where they hunt (either in or out of state), those cells were not included for that group.
Discussion
The following heat maps are color-coded based on the level of concern or agreement for the combined stakeholder results. For the geographic and scale questions, a 5-point Likert Scale was used, meaning that the random chance of any one response being selected was equal to 20%. For the biological and social questions, on a 7-point Likert scale, each option would be randomly chosen about 14.3% of the time (Table 7).
Table 7. Legend for heat maps indicating levels of concern or agreement among hunters, landowners, and officers for various geographic, biological, and social factors.
Geographic Impacts
The percentage of respondents reporting Serious Concern regarding the geographic impact of illegal take is shown in Table 8. For lands hunted or owned within their state of residence, hunters (38.3%) and landowners (32.8%) had slightly elevated levels of Serious Concern about the impacts of illegal take of wildlife. Similarly, for their state of residence in general, hunters considered the illegal take of wildlife to be a Serious Concern at a higher rate (38.6%) than landowners (33.8%) or officers (32.7%), but all were only slightly elevated (Table 8). For lands hunted or owned in other states, hunters (41.4%) exhibited moderately elevated levels of Serious Concern, although the percentage of landowners (34.9%) was lower and only slightly elevated. For the U.S. in general, hunters reported illegal take as a Serious Concern at a moderately elevated level (40.4%), which was higher than the slightly elevated levels of landowners (35.1 %) and officers (35.0 %).
Table 8. Aggregate percentages of stakeholder groups reporting Serious Concern regarding illegal take at various geographic levels.
The percentage of respondents reporting Broad Concern for the geographic impact of illegal take is shown in Table 9. For lands hunted or owned within their state of residence, hunters (57.7%) and landowners (48.4%) had moderately elevated levels of Broad Concern about the impacts of illegal take of wildlife. Similarly, for their state of residence in general, officers considered the illegal take of wildlife to be a Broad Concern at an extremely elevated level (80.0%), which was higher than the highly elevated landowners (63.2%) or hunters (65.8%). For lands hunted or owned in other states, both hunters (66.2%) and landowners (61.0%) exhibited highly elevated levels of Broad Concern, although landowners were slightly lower than hunters. For the U.S. in general, officers reported extremely elevated levels of Broad Concern at 82.3%, which was higher than the highly elevated levels of hunters (68.8 %) and landowners (66.1 %).
Table 9. Aggregate percentages of stakeholder groups reporting Broad Concern regarding illegal take at various geographic levels.
Finally, for the respondents reporting Some Concern about the impacts of lands hunted or owned in their state of residence, both hunters (74.5%) and landowners (60.9%) exhibited higher response rates (Table 10). For the state of residence in general, all reported extremely elevated rates, with 98.5% of officers, 89.8% of hunters, and 88.4% of landowners reporting Some Concern for this factor. Both hunters (87.9%) and landowners (84.0%) reported extremely elevated levels of concern regarding the impact of illegal take on lands hunted or owned in other states. Finally, for the U.S. in general, all groups reported extremely elevated rates of Some Concern, with 99.0% of officers, 92.1% of hunters, and 92.1%, and 91.0% of landowners reporting this level.
Table 10. Aggregate percentages of stakeholder groups reporting Some Concern regarding illegal take at various geographic levels.
Stakeholder
Biological & Social Impacts
The percentage of respondents who reported Strong Agreement on the biological and social impacts of illegal take is shown in Table 11. Regarding the impact on populations, hunters (40.4%) and landowners (36.8%) had moderately elevated levels of Strong Agreement about the impact of the illegal take of wildlife, while officers (23.9%) had only slightly elevated levels. Similarly, for the impact on hunt quality, hunters reported highly elevated levels of concern (46.7%), compared to the moderately elevated landowners (40.0%) and the slightly elevated officers (27.7%). Regarding the impact of illegal take of wildlife on hunt opportunity, hunters (42.2%) and landowners (34.9%) indicated Strong Agreement at moderately elevated levels, compared to officers, who indicated only a slightly elevated level (22.0%). Regarding access to land for hunting, hunters (48.7%) exhibited highly elevated levels of Strong Agreement, while landowners (40.2%) and officers (40.2%) were lower and only moderately or slightly elevated. When asked how illegal take might affect their personal opinions of hunting, both hunters (32.1%) and landowners (33.5%) reported moderately elevated levels of concern, whereas officers (18.3%) reported only slightly elevated levels. Finally, regarding the impact on the public’s perception of hunting, hunters (56.3%) reported highly elevated levels of concern, while landowners (43.7%) and officers (36.7%) reported lower, moderately elevated levels of concern.
The percentage of respondents reporting Broad Agreement on the biological and social impacts of illegal take is shown in Table 11. Regarding the impact on populations, hunters (61.9%) had extremely elevated levels of Broad Agreement about the impacts of the illegal take of wildlife, while landowners (58.0%) and officers (51.4%) were lower with highly elevated levels. Similarly, for the impact on hunt quality, hunters (66.9%) and landowners (60.6%) reported extremely elevated levels of concern, compared to the highly elevated response levels from officers (58.9%).
Regarding the impact of illegal take of wildlife on hunt opportunities, hunters (63.8%) and landowners (56.6%) indicated Broad Agreement at extremely elevated levels compared to officers at only a highly elevated level (49.1%). Regarding access to land for hunting, both hunters (66.3%) and officers (60.2%) exhibited extremely elevated levels of Broad Agreement, while landowners (58.6%) were lower and only highly elevated. When asked how illegal take might affect their personal opinions of hunting, both hunters (46.3%) and landowners (50.0%) reported highly elevated levels of concern, whereas officers (35.8%) reported only moderately elevated levels. Finally, regarding the impact on the public’s perception of hunting, hunters (74.0%), landowners (63.5%), and officers (66.2%) reported extremely elevated levels of concern.
Finally, the percentage of respondents reporting General Agreement regarding the biological and social impacts of illegal take is shown in Table 11. All three groups demonstrated extremely elevated levels of agreement for impacts on wildlife populations, hunt quality, hunt opportunity, access to lands for hunting, and the public’s perception of hunting. The only exception was the impact on personal perceptions of hunting, where hunters (59.6%) and officers (54.9%) were highly elevated, while landowners (62.6%) remained extremely elevated. Regarding impacts on wildlife populations, hunters (73.7%) indicated General Agreement, landowners reported 68.3%, and officers reported 77.4%. Regarding the factors affecting hunt quality, hunters, landowners, and officers reported levels of 77.5%, 71.0%, and 81.5%, respectively. Regarding the impact of illegal take of wildlife on hunt opportunities, hunters, landowners, and officers reported 77.4 %, 69.2%, and 76.2% General Agreement, respectively. Regarding access to land for hunting, hunters (76.3%), landowners (68.3%), and officers (82.7%) reported extremely elevated levels of General Agreement. Regarding the impact on their personal opinions of hunting, hunters (59.6%) and officers (54.9%) reported lower levels of concern than landowners (62.6%), who reported higher levels. Finally, regarding the impact on the public’s perception of hunting, hunters (83.3%), landowners (73.9%), and officers (85.4%) reported extremely high levels of concern.
Table 11. Aggregate stakeholder perceptions of the relative seriousness of illegal take of wildlife for certain biological and social factors.
Table 11. Aggregate stakeholder perceptions of the relative seriousness of illegal take of wildlife for certain biological and social factors.
or Social Factor
Table 11. Aggregate stakeholder perceptions of the relative seriousness of illegal take of wildlife for certain biological and social factors.
or Social Factor
To many, the poaching of wildlife may seem inconsequential because of the abundance of wildlife populations inhabiting North America. However, both the removal of animals beyond what is socially or biologically justifiable and the removal of high-quality animals through illegal means may have significant biological impacts. Additionally, people committing illegal acts often create a corresponding negative public perception of hunters participating in lawful activities.
Chapter 3: Typologies and Behaviors of People who Illegally Take Big Game
The illegal take of big game and other domestic poaching activities have received increased attention from researchers in recent years (Leavitt et al., 2021; McFann & Pires, 2018; Steinmetz et al., 2014). Such increased awareness is important, but wildlife crimes are distinct from most other categories of crime in that they typically occur in isolated rural areas, where it is uncommon for witnesses to be present (Eliason, 2008; Falcone, 2004; Forsyth, 1993, 2008; Forsyth & Marckese, 1993a; Knapp, 2012; Wyatt, 2013). Additionally, conservation officers are sometimes responsible for covering thousands of square miles (Eliason 2011b, 2017, 2020; Logan et al., 2023; Patten, 2012), and witnesses unfamiliar with hunting laws are unlikely to report events if they are not sure that a crime has been committed (Green, 2016).
Studies investigating poacher demographics report that most offenders are male, white, young, tend to have lower income and educational levels, and may work alone or with others (Arnold, 2005; Crow et al., 2013; Gray & Kaminski, 1994; Green et al., 1988; Sawhill & Winkell, 1974). Of course, these statistics include only known poachers. It is possible that older, more experienced poachers or those with better resources have more polished skills that help them evade detection or apprehension (Eliason, 2013; Forsyth, 2008). Based on interviews with wildlife law enforcement officials and poachers, researchers have postulated that some violators have characteristics and behaviors that make them easier to identify and apprehend.
Objectives
1. To examine the current scientific literature on the motivating factors that lead individuals to engage in wildlife crimes and other comparable crimes akin to the illegal taking of wildlife.
2. To identify the motivating factors driving wildlife violators to commit these offenses by conducting surveys and interviews with convicted individuals.
3. To formulate a set of recommendations aimed at reducing motivational factors and enhancing deterrents to wildlife crimes, thereby diminishing the overall compulsion or necessity to engage in such activities.
Methods
Existing studies on poacher typologies are generally based on interviews with a small number of individuals. Our intent was to develop a more complete understanding of motivations for illegal take of big game by interviewing a larger number of known or convicted poachers. To identify potential candidates for typology interviews, we requested data for adult individuals (18 years of age) from the 8 study states who had been reported to the Interstate Wildlife Violators Compact (Appendix D) as being license-ineligible due to a conviction for illegal wildlife activities. We then sent letters to these individuals, inviting them to participate in a confidential interview. Initially, participants were offered a $25 gift card for their participation, which was increased to $50 in the
second mailing and $75 in the third and final mailing. Despite these efforts, participation rates remained extremely low, with only 14 individuals agreeing to be interviewed.
Our second approach involved creating a brief three-question survey distributed on social media sites and chat rooms frequented by hunters across all 50 states. This survey inquired whether respondents had committed a detected or undetected act of illegal wildlife activity and whether they would be willing to participate in a confidential phone interview for a $25 gift card. A total of 247 individuals responded to the survey, but only 19 met the criteria (e.g., committed a detected or undetected act) and agreed to be interviewed. However, none of the participants completed their interviews.
Ultimately, we relied on data obtained through the conservation officer surveys described in Chapter 2, as well as information gathered through a comprehensive literature review and content analysis of all available published studies on individuals involved in wildlife crimes. We also reviewed similar studies on other environmental offenses and similar crimes. These data were used to develop a more complete understanding of possible typologies based on the motivations of wildlife violators. This information was used to create recommendations for more effectively deterring such crimes by addressing or mitigating the violators’ motivations.
Results
Individuals violate wildlife laws for various reasons. Previous research has identified different profiles or typologies of poachers who committed a range of illegal take offenses involving various animals (McSkimming & Berg, 2008). Some offenders may be one-time or occasional poachers, whereas others may be chronic and experienced. Furthermore, some poachers may exclusively disobey wildlife laws, while others may be linked to a range of other types of criminal activities (Sawhill & Winkell, 1974; von Essen et al., 2014).
Based on our preliminary literature review of typologies, conservation officers were asked what they thought motivated poachers (Table 12) to commit acts of illegal take. They were asked to estimate the percentage of illegal take cases they investigated that involved specific motivations for the crime. Generally, officers believed that trophy and opportunistic poaching were the most common motivations for the illegal take of big game, as indicated by the higher-than-expected reporting levels for the 21-40% and 41-60% ranges. The respondents felt that subsistence and commercial poaching were the least common typologies, with higher-than-expected levels at the 0% and 1-20% of cases ranges. Estimated percentage of cases motivated by peer pressure (greater than expected for the 1-20% range), family/cultural, backdoor, and ego typologies (greater than expected at the 1-20% and 21-40% ranges). When examining the upper three response categories (41-60%, 61-80%, and 81-100%), responding officers indicated that trophy poaching (57.6%) was the most common, followed by opportunistic (51.1%), ego (43.9%), family/cultural reasons (37.7%), back-door poaching (37.6%), peer pressure (13.9%), commercial/market poaching (5.0%), and finally subsistence poaching (3.3%).
Table 12. Conservation officer responses (n=1,019) when asked to estimate the percent of several poacher typologies responsible for incidents involving the illegal take of wildlife.
Trophy - poaching wildlife specifically for nonedible parts
Peer-pressure - poaching wildlife because others did it
Subsistence - poaching wildlife for food or clothing
Opportunistic - poaching wildlife as it becomes available
Family/Cultural - poaching as a tradition/because family does it
Backdoor - poaching wildlife on their own or nearby property
Ego - poaching to show off for friends.
Commercial/Market - poaching wildlife for financial gain
Aside from the typologies listed in the table, officers had the opportunity to add their own “other” categories or additional information. Several officers mentioned that there has been a substantial decline in subsistence poaching because of the increased number of public assistance programs. Additionally, many officers specifically stated thrill killing as a motivation for illegal take. Other officers described poaching as a game for offenders who enjoy the excitement of potentially committing the crime without getting caught or outsmarting property owners or legal authorities.
While authors and practitioners have described various types of poachers in many ways, results from the conservation officer survey, as well as the completed review of all available extant literature regarding motivations for illegal take and poacher typologies, we suggest that the following nine typologies accurately describe and encompass most types of poachers:
• Trophy Poachers
• Commercial Poachers
• Subsistence Poachers
• Backdoor Poachers
• Recreational Poachers
• Protective Poachers
• Tradition or Protest Poachers
• Challenge Poachers
• Thrill-Kill Poachers
Notably, these typologies are based on violators who poach intentionally and not “accidental poachers,” (e.g., individuals who make an honest mistake, such as using the wrong size broadhead while attempting to hunt legally). Additionally, these typologies are not always mutually exclusive; a poacher could fall into more than one of these categories, even when committing the same wildlife violation, as discussed below.
Discussion
Trophy Poachers
The primary motivation for the Trophy Poacher is ego. Trophy Poachers illegally take wildlife for the primary purpose of securing trophy animals for personal satisfaction, bragging rights, notoriety, or exhibition. Trophy animals are generally considered to have larger body sizes, horns, or antlers (Eliason, 2012b; Muth & Bowe, 1998). Television shows, social media stories, and pictures of these “biggest and best” specimens are often shared among sportspersons, on social media and sometimes in sporting and industry magazines and websites (Kalof & Fitgerald, 2003). While trophy animals are often taken legally, Trophy Poachers use illegal means, such as spotlighting after legal shooting hours, trespassing on private or public property, killing out of season, using illegal weapons, or not having the necessary licenses or tags (Blevins & Edwards, 2009; Eliason, 2008; Green, 2002). This type of poacher may commit several wildlife violations while hunting trophy animals, but monetization is not usually a factor. Most of these poachers keep the illegally obtained trophies for themselves, but some poach to supply clients who are willing to pay large
amounts of money for trophies. Trophy Poachers who provide specimens to others for money cross over into the Commercial Poacher typology (Eliason, 2012b). In some cases, Trophy Poachers consistently produce trophy animals to satisfy supporters or sponsors, produce television shows or clips, or generate social media excitement. While they may not be directly compensated from the sale of an illegal trophy, we consider those individuals as both Trophy Poachers (for the ego aspect) and Commercial Poachers (for the compensation aspect).
Trophy poaching is likely the most familiar typology known to the public because cases tend to receive more media coverage. The extra attention given to trophy poaching cases may occur for several reasons. First, illegally taken trophy animals may be well known, and sometimes even named, among local community members and tourists. Examples include an elk known as “Samson,” illegally taken in Colorado in 1995 (Holdt, 2015), the “Hollywood Buck” poached in Virginia in 2023 (Hall, 2024), and another white-tailed deer known as “King Louie” poached in New York in 2024 (Vila, 2024).
Second, some trophy poachers are serial poachers who have illegally taken many specimens over time. For instance, a 2010 case involving white-tailed deer poaching in Kentucky and Tennessee resulted in the recovery of 41 trophy racks and mounts in the possession of poachers who had been illegally killing the animals, taking the trophies, and leaving the meat behind (Brantley, 2011). Finally, trophy poachers often make the news because of the penalties they receive if they are convicted. Some states have enhanced penalties and replacement costs for trophy animals. Replacement costs are sometimes thousands of dollars and are often calculated based on the features that make an animal a trophy specimen.
Commercial Poachers
The primary motivation for the Commercial Poacher is financial reward. Commercial Poachers illegally take wildlife to monetize animals or their parts. In some cases, commercial poaching is small-scale, wherein the money is used primarily for the basic needs of the offenders’ families (Forsyth et al., 1998), but large-scale or trophy poaching for profit may result in substantial financial gains (Musgrave et al., 1993). While poaching for financial reward is often seen as an international problem affecting populations in countries such as South Africa, the less-publicized illegal wildlife trade in the U.S. alone accounts for millions of dollars each year (Muth, 1998; Muth & Bowe, 1998; Poten, 1991; Sosnowski et al., 2022). Commercial poaching occurs across the U.S. but may be more prolific for big game in the West because of the high demand for illegally taken moose, bighorn sheep, mountain lions, elk, and grizzly bears (Musgrave et al., 1993). Whether animals are illegally harvested and sold for consumption, pelts or hides, mounts, medicinal purposes (e.g., black bear paws and gallbladders), or jewelry or decoration (e.g., alligator teeth or skin, bear teeth), poachers may earn thousands of dollars for each specimen they poach. For example, bighorn sheep skulls or mounts may sell for $10,000 or more, and bald eagles may bring the seller more than $2,000 (Muth & Bowe, 1998; Musgrave et al., 1993; Poten, 1991).
Commercial Poachers may work alone or may be involved in larger criminal networks that specialize in wildlife offenses (Muth & Bowe, 1998) and sometimes other types of crimes that often
include weapons and drugs (Balázs, 2016). Profits derived from some commercial poachers outweigh the average financial sanctions if they are convicted of poaching. In these instances, Commercial Poachers are unlikely to be deterred by current criminal penalties or replacement costs (Musgrave et al., 1993).
Subsistence Poachers
The primary motivation for the Subsistence Poacher is food consumption. Subsistence Poachers illegally take wildlife to provide food for themselves, their family members, neighbors, or other individuals close to them. Although their methods are contrary to applicable laws, this type of poaching usually involves wildlife that provides desirable meat, such as deer, elk, moose, turkey, and occasionally bears (Brymer, 1991; Muth & Bowe, 1998; Sawhill & Winkell, 1974; Scialfa, 1992). While most simply use the meat for their families, there are some cases in which they sell or trade the meat to acquire other types of food. Still, they tend to “kill for the table” (Jacoby, 2014).
Subsistence Poachers often live in rural areas and are likely to live in low-income households (Musgrave et al., 1993). In a study of deer poachers in Missouri, 30% were unemployed at the time of arrest, and 59% of poachers in the sample supported at least one other individual (Glover & Baskett, 1984). In general, providing meat for subsistence is the most common reason given by offenders (Forsyth et al., 1998). Many conservation officers believe that offenders provide this information simply to justify their actions (Eliason, 2003b), but some officers and members of the public have empathy for subsistence poaching. Subsistence Poachers are less likely to be reported to authorities by witnesses than other types of poachers (Leavitt et al., 2021), and officers are sometimes lenient with poachers who are truly doing it for survival (Forsyth et al., 1998).
Backdoor Poachers
Temptation is the primary motivation for Backdoor Poachers. Backdoor Poachers illegally take wildlife when tempted by animals that reside or regularly pass through their yards, fields, adjacent woodlots, or nearby property where the animal is easily observed and can be reasonably secured without detection. Backdoor Poachers are difficult to detect and apprehend because they are often secluded and may not have to leave their property to commit the act(s) (Eliason, 2008). Those exhibiting this typology often act impulsively or opportunistically and do not involve others outside the family. Backdoor Poachers may also cross over to at least one other poacher typology. For example, they may be illegally taking animals on their property as trophies, to provide food for their families, to sell the animal or parts of the animal, or they may intend the act to be compensation or retaliation for real or perceived damage caused by the animal.
Recreational Poachers
The primary motivation for the Recreational Poacher is greed. Recreational or “fear of missing out” poaching describes acts committed by violators who illegally take wildlife while participating in an otherwise legal hunting framework, usually with friends, when they cannot or choose not to secure the appropriate licenses, permits, or permissions. Recreational Poachers may also take more animals than allowed by regulations or harvest animals outside of legal hunting hours or seasons.
They may also misreport the location from which a harvest was taken to avoid exceeding the bag limits in certain hunting zones (Millions & Swanson, 2006).
Generally, Recreational Poachers report experiencing the same types of feelings as outdoor persons who practice hunting legally; they enjoy companionship, challenge, excitement, woodcraft, and being in nature (Muth & Bowe, 1998). Recreational poaching occasionally involves trophy animals and is often an opportunistic social activity that occurs during regular hunting seasons or hours on the same land or areas where poachers are otherwise hunting legally (Green et al., 1988; Muth & Bowe, 1998; Sawhill & Winkell, 1974).
Protective Poachers
The primary motivation for the Protective Poacher is to protect. Protective Poachers illegally take wildlife to defend persons or property from attack or damage but knowingly fail to comply with applicable laws while doing so. In some states, landowners or their designees are allowed to kill wildlife, even out of season, if they cause damage or threaten to damage their property, crops, livestock, or other elements of their livelihood (Muth & Bowe, 1998). For example, landowners may dispatch deer or elk if they are destroying crops or bears if they are preying on young livestock. However, there are procedures that must be followed if wildlife is taken for this purpose. For instance, Kentucky requires approval for landowners or tenants experiencing damage by deer to take the animals out of season or over bag limits, and any kills must be reported to a conservation officer within 24 hours. If landowners do not follow these laws after taking an animal to protect their property, they have taken the animal illegally and can be prosecuted.
Tradition or Protest Poachers
The primary motivation for the Tradition or Protest Poacher is rebellion. Protest Poachers illegally take wildlife because they believe they have the right to do so, based on tradition or past behavior from their family, friends, or community members. Generally, these types of poachers believe that they have the right to take animals from the land without interference from laws implemented and enforced by the government. They believe they have the “right” to hunt and do not accept the restrictions that interrupt their traditions (Brymer, 1991; Knapp, 2012; Peterson et al., 2017). They are averse to additions or changes in laws and modifications in land designations that used to be available for hunting. For example, a great deal of illegal bear hunting occurs in the Great Smoky Mountains National Park, even though it is no longer allowed after the land was designated as a national park (Muth, 1998; Muth & Bowe, 1998).
The actions of Protest Poachers may be considered a type of “folk crime,” which is often associated with local or cultural customs and norms and is considered by the community to be less serious than other types of crimes. Furthermore, individuals who commit these offenses are typically not as morally condemned as other types of criminals and are therefore still welcomed as community members (Filteau, 2012; Forsyth, 2008; Forsyth & Marckese, 1993a; Forsyth et al., 1998; Gibbons, 1972; Hagan, 1977; Muth & Bowe, 1998; Peterson et al., 2019; Rizzolo et al., 2017; Scialfa, 1992; Serenari & Peterson, 2016; Stretesky et al., 2010; von Essen et al., 2014). Protest Poachers comply with hunting laws only to the degree that they are in harmony with their
internalized traditional norms (von Essen et al., 2014). According to the literature, some criminality, including techniques and values related to poaching, is learned through socialization at an early age from family and acquaintances and is influenced by local cultures (Eliason, 2012b; Eliason & Dodder, 1999; Forsyth & Marckese, 1993a; Green, 1990; Sawhill & Winkell, 1974; Sutherland, 1934; von Essen et al., 2014). These subcultures often distrust government agencies, and some rural hunters believe they have more knowledge about the ethics and methods of wildlife conservation than policymakers (Serenari & Peterson, 2016; von Essen & Hansen, 2018).
Challenge Poachers
The primary motivation for the Challenge Poacher is competition and/or superiority. Challenge Poachers illegally take wildlife for the primary purpose of outwitting, outsmarting, or eluding detection by landowners, legal hunters, or law enforcement. Especially for chronic poachers, the actions can become a sort of game in which poachers are hunted by conservation officers. Some poachers view it as a game of “cat and mouse,” and are motivated by the challenge, fun, and excitement of not getting caught (Forsyth et al., 1998; Forsyth & Marckese, 1993a, 1993b). This may be especially true if a poacher has had negative interactions with wildlife officers in the past, as defiance is more likely to occur when someone perceives a previous sanction as unfair or illegitimate (Filteau, 2012). Challenge Poachers may “play the game” broadly, or they may specialize in species that are illegal to hunt and/or in areas that are completely closed to hunting, such as parks, refuges, or other posted land (Forsyth et al., 1998; Muth & Bowe, 1998). This activity is considered an exciting challenge for poachers (Irby et al., 1989; Muth, 1998; Muth & Bowe, 1998), and they may use technology and dynamic tactics to play the game with authorities (Brymer, 1991).
Thrill-Kill Poachers
The primary motivation for the Thrill-Kill Poacher is depraved excitement. It should be explicitly noted that the term “thrill,” as used here, should not be confused with the phrase “the thrill of the hunt,” which is often used by legitimate hunters to describe the excitement they experience from a successful legal hunt. Thrill-Kill Poachers illegally take wildlife because they enjoy the act, or the emotional or psychological thrill of the kill itself, which may cause undue distress for the animal. Typically, neither the animal nor its parts are taken for meat, mounts, or financial rewards from the poaching location. They have been referred to as psychopathic or mentally imbalanced killers, and they sometimes kill as many animals as possible (Muth & Bowe, 1998). In a study on deer spotlighting in Georgia, 8% of deer poachers indicated that they shot the animals to see if they could hit them and did not retrieve any part of the animals for consumption or any other purpose (Sawhill & Winkell, 1974). This type of poacher kills animals and leaves them to rot (Muth & Bowe, 1998). An example of a newspaper article containing a recent example of thrill-kill poaching from Wisconsin states:
Associated Press – December 4, 2020.
MARSHFIELD, Wis. (AP) Two groups of juveniles from Clark County are responsible for fatally shooting more than 40 deer and a horse which the Wisconsin Department of Natural Resources said were “thrill kills.” DNR law enforcement supervisor Lt. Robin Barnhardt said that, early in
November, people started reporting large numbers of deer being shot and left behind. The DNR and Clark County Sheriff's Office determined two separate groups of juveniles were suspected in the killings, the Marshfield News Herald reported. Barnhardt says the juveniles spotlighted the deer in fields at night, shot them and left the carcasses.
It is important to note that the proposed list of typologies is not exhaustive, and as already mentioned, typologies are not mutually exclusive because a poacher may have a variety of different motivations for committing illegal take events. However, a greater understanding of poacher motivations and typologies can be used to develop policies, practices, and investigative techniques that may ultimately lead to increased detection, apprehension, and possibly penalties.
THIS PAGE INTENTIONALLY LEFT BLANK.
Chapter 4: Factors Affecting Prosecution and Restitution for the Illegal Take of Big Game
The prosecution of wildlife crimes, such as illegal take, faces numerous challenges across legal, social, and logistical domains. Previous research has revealed that conservation officers frequently perceive judicial leniency and receive limited support for imposing severe penalties, particularly in regions where wildlife crimes are not a priority for the court system (Decker et al.,1980; Eliason, 2011a; Filteau, 2012; von Essen et al., 2015). A major hurdle in prosecuting wildlife crimes arises when these cases are deprioritized compared to other criminal cases. Judges and prosecutors, especially those with limited knowledge of wildlife issues, may not fully comprehend the ecological and societal impacts of these crimes, leading to lighter sentences or case dismissals. This lack of understanding diminishes the perceived value of wildlife and can weaken the effectiveness of deterrents, such as restitution or replacement costs.
Edwards (2017) surveyed law enforcement leadership from state fish and wildlife agencies, who identified state court systems as a potential barrier to the successful prosecution of wildlife violators, with 33 of the 38 states (87%) indicating that court systems posed significant obstacles in successfully convicting poachers. Additionally, many wildlife agencies are understaffed, with officers dispersed across vast, often remote territories, leading to resource constraints that impede the development of robust cases. This logistical issue, coupled with insufficient enforcement time, a lack of specialized wildlife prosecutors, inadequate public education on the importance of wildlife laws, and local political pressures, significantly detracts from an officer’s ability to pursue and convict offenders.
The lack of attentiveness to wildlife crimes is also evident in some statutory penalties, as punishments for wildlife violations have traditionally been minor, even compared to some other “victimless” crimes (Knapp, 2012). Surveys have shown support for increased sanctions (e.g., larger fines) and the loss of hunting privileges to deter wildlife violations (Decker et al., 1980; Filteau, 2012; Gray & Kaminski, 1994; Hall, 1992; Mayer et al., 2013). Restitution for illegal take has proven to be a partial deterrent, especially when consistently enforced (Haines et al., 2016; Mayer et al., 2013). Restitution amounts vary significantly by state, species, and nature of the wildlife taken (trophy or non-trophy). For example, states such as Ohio and Texas employ detailed scoring systems, such as the B&C criteria, to assign higher restitution values to trophy animals (Edwards, 2017). Some states calculate restitution using complex formulas that consider biological and recreational impacts, as well as economic value. This approach helps assign a financial value that reflects both the biological and social values of wildlife. Some states impose minimum fines, while others set restitution values at the judges’ discretion, leading to variability in restitution payments even within the same jurisdiction. Filteau (2012) noted that poachers may see restitution alone as insufficient to deter them; instead, they often respond more strongly to non-monetary consequences such as the loss of hunting rights, loss of equipment, or the public stigma of conviction. This finding underscores the potential value of multifaceted penalties, aligning with Mayer et al. (2013), who found that violators in North Carolina suggested that stricter penalties,
such as jail time or publicizing of convictions, would have a stronger deterrent effect on potential offenders.
In the initial Poach & Pay study, Edwards (2017) interviewed agency law enforcement leaders and discovered that the court systems often posed the most significant challenge to the effective adjudication of wildlife crimes. Responses to these perceived obstacles were intricate and frequently prompted multifaceted reactions. However, most respondents did not specifically cite issues with the court system itself; rather, they felt that the courts were often overburdened, and judges and prosecutors were less familiar with wildlife crimes and their consequences than with more common crimes against individuals or easily identifiable victims. Respondents identified several strategies that could be explored to help mitigate some of the obstacles presented by the court system Examples mentioned by the respondents included the following:
• Enforcement staff residing in the community where they work to build trust with the public, prosecutors, and judges.
• Establishing a wildlife prosecutor award to recognize those who aggressively pursue wildlife crimes.
• Implementing a systematic program to educate state legislators and garner support for enforcement activities.
• Hiring a contract or full-time agency attorney to assist the courts in prosecuting wildlife cases.
• Allocating specific time on the court docket to hear only natural resource cases.
Objectives
1. To identify consistent, justifiable, and proportional penalties and restitution for the illegal taking of wildlife.
2. To develop Best Management Practices for state wildlife agencies that build and enhance their relationships with local prosecutors and judges.
3. To make recommendations based on the results from the target states that encourage additional states to adopt sufficient language for penalties and restitution concerning the illegal taking of wildlife.
Methods
After reviewing state wildlife statutes and a sample of case citations and dispositions, survey questions were designed to ask conservation officers, prosecutors, and judges about factors affecting prosecution and restitution rates, as well as other potential judicial issues associated with the illegal take of big game. This information was used to formulate recommendations aimed at educating and informing officials’ perspectives on wildlife crimes.
The survey items for conservation officers were included in the larger officer survey described in Chapter 2. Additional surveys were specifically designed for judges and prosecutors. The judges’ survey was disseminated to the Executive Director (or equivalent) of each state's Administrative Office of the Courts and to the State Supreme Court Chief Justice, requesting that they share the
survey link with member judges and encourage their participation. However, after reviewing the survey questions, both the Administrator and Chief Justice from all 50 states declined to respond, citing concerns about maintaining the separation of powers among the executive, legislative, and judicial branches of state government. Consequently, no data from judges were available for this study.
We distributed our prosecutor survey to the Executive Director (or equivalent) of all 50 state prosecutors’ associations, requesting that they share the survey link with their members and encourage participation. We received 104 responses from prosecutors across 8 of the 50 states. The states represented were Georgia, Kentucky, Maine, Nebraska, Nevada, Ohio, Oregon, and West Virginia. These responses were aggregated to conduct a national (generalized) evaluation of the opinions of state-level prosecutors to understand and describe their current attitudes towards prosecuting and penalizing individuals charged with wildlife crimes.
Results
Conservation Officer Surveys
Overall, the findings suggest that conservation officers were generally satisfied with the work of prosecutors in handling illegal take of cases involving big game, with 50.0% expressing that they were “satisfied” or “very satisfied,” compared to 27.6% who reported being “dissatisfied” or “very dissatisfied” (Table 13). Nonetheless, there were slight regional differences in satisfaction levels regarding prosecutors' performance, with the western region exhibiting lower satisfaction rates (44.2%) than the Midwest (56.2%), Northeast (49.6%), and Southeast (47.1%) regions. Similarly, the West reported higher dissatisfaction rates (31.8%) than the Midwest (26.8%), Northeast (26.9%), and Southeast (27.3%). Different superscript letters indicate significant differences at the p ≤ 0.05 level among regions within the response category (satisfaction level).
Table 13. Conservation Officer (N=1,052) satisfaction levels with prosecutors in handling illegal take of big game cases.
A similar positive response was observed regarding officer satisfaction with judges or magistrates, with 54.7% expressing that they were "satisfied" or "very satisfied," compared to 20.0% who reported being "dissatisfied" or "very dissatisfied" with judicial officials (Table 14). Minor regional variations in satisfaction rates were also noted, with the Midwest (64.2%) and Northeast (58.9%) showing slightly higher satisfaction rates than the West (41.1%) and Southeast (48.5%) regions. Similarly, the western (21.7%) and southeastern regions (23.6%) were slightly less satisfied than their midwestern (14.7%) and northeastern (20.5%) counterparts.
Table 14. Conservation Officer (N=1,054) satisfaction levels with judges/magistrates in handling illegal take of big game cases.
Conservation officers were also asked to rank a list of factors from most effective (5) to least effective (1) in their potential to increase conviction rates for illegal take. Regionally, we observed differences in the ranking of these possible mitigating factors. For "Educating the Public on Wildlife Crime," officers in the West reported the highest level of support, compared to those in the Southeast, although both were similar to reports from officers in the Midwest and Southeast regions (Table 15). Regarding "Establishing Court Dockets Dedicated to Wildlife or Environmental Crimes," officers in the Southeast expressed higher levels of support than those in the Northeast, with both being similar to reports from the West and the Midwest. For the third strategy, "Hiring Specialized Prosecutors Dedicated to Prosecuting Wildlife or Environmental Crimes," officers in the Southeast reported higher support levels than those in the West or Midwest, but similar rates to those in the Northeast. Officers in the West reported lower support levels than those in the other three regions. Officers in the West and Midwest showed higher support for "Educating Judges/Magistrates on Wildlife Crime" than those in the Northeast and Southeast. For the final factor, "Educating Prosecutors on Wildlife Crime," officers in the Northeast reported higher support levels than those in the other three regions (Table 15). Overall, officers identified public education as likely the most effective factor in boosting conviction rates for illegal take. This was followed by the establishment of court dockets dedicated to wildlife or environmental crimes and the hiring of specialized prosecutors to focus on these offenses. Educating prosecutors and judges/magistrates about wildlife crime was ranked as the least effective factor.
Table 15. Conservation Officers (n=995) ranking of factors from (5) most effective to (1) least effective in their potential to increase conviction rates for illegal take.
Establishing courts/dockets
Prosecutor Surveys
To assess the relative importance assigned to wildlife crimes, each prosecutor was asked to rank a list of misdemeanor offenses based on their perceived significance. The primary crime of illegal wildlife shooting, prosecutors were also asked to rank “Criminal Trespass,” “Possession of Drugs (marijuana, etc.),” “Domestic Animal Abuse,” “Theft by Unlawful Taking,” and “Disorderly Conduct.” As illustrated in Figure 1, more prosecutors (44.7%) considered Domestic Animal Abuse the most serious of the five crimes presented. In contrast, only 3.2% of respondents identified “Illegal Shooting of Wildlife” as the most serious crime.
Figure 1. Prosecutors’ rank of the relative seriousness of six selected crimes, including "Illegal shooting of wildlife."
Should Illegal Take of Wildlife Be a Felony?
The prosecutors' open-ended responses to some survey items offered valuable insights into the levels of punishment and restitution associated with wildlife crimes. For instance, when we informed them that the current replacement cost of more iconic wildlife species (e.g., deer, elk, bear) in the U.S. almost always exceeds $2,500 and can surpass $25,000 in some cases, 48.0% agreed that the illegal shooting or killing of these animals should be treated as felony theft by unlawful taking of a public resource, while 35.3% indicated it should not be classified as felony theft. The remaining 16.7% provided their thoughts in open-ended statements such as the following:
“…state law where many of those animals are found require the use of a licensed guide or outfitter to hunt, meaning that the financial loss related to a poached Alaskan coastal brown bear is easily in the tens of thousands of dollars. Second, many of those animals…have fecundity rates and live in habitats that combine to make the loss of a single animal detrimental to the state management plan. Were my state to have such animals, I would agree that our offenses should be felonies; however, that is not the case. While we should certainly not suborn poaching, we need to limit the numbers of deer on the landscape and thus a felony is not appropriate for this species. The illegal taking of a black bear should be a felony or misdemeanor...”
“I agree with basing the severity of the offense on the value of the game taken unlawfully. It shouldn't always be treated as a felony, but if the value of the game taken exceeds a felony threshold for theft, then it should be treated as such.”
“I feel there should be a range depending on species and number of animals killed that it could be prosecuted a misdemeanor but upgraded to a felony in certain situations.”
Domestic Animal Abuse
Theft by unlawful taking Possession of Drugs (marijuana, etc.)
Illegal shooting of wildlife
Disorderly Conduct Criminal Trespass
“I think it depends on whether the animal is endangered or likely to become endangered and the precise nature of the crime at issue. If we're talking about killing an animal outside of its regular hunting season, then no, I would not support that being a felony offense unless we're dealing with a recidivist. If there's an absolute prohibition on killing an animal and the animal is never subject to a hunting season, then yes, felony treatment could be appropriate. Additionally, the method of killing is significant. If we’re talking about activities of normal hunting, either with rifle or bow or something similar, then I would tend to not treat that as a felony unless, again, there's an absolute prohibition on killing the animal or we’re dealing with a recidivist. But if the perpetrator is torturing the animal or not killing the animal in a humane manner, then yes, I think that could always be handled as a felony offense.”
“The level of the crime (i.e. misdemeanor or felony) should be based on the rarity of the animal killed. I don't think killing an animal with sufficient population should be a felony. There is no reason why restitution cannot be sought for the replacement cost of the animal, or why a misdemeanor can't have an enhanced fine schedule. Blindly making this crime a felony may be a misplaced idea creating more convicted felons.
“In my state, however, an offender can be ordered to pay liquidated damages for each game animal illegally taken, up to $25,000 in the case of an illegally taken bighorn sheep. These liquidated damages are appropriate and should be sought by the State if an animal is illegally taken.”
“There should be opportunities for prosecutors to use discretion. For example, there is a difference between someone who is poaching animals and someone who is hunting w/ valid permits, but for whatever reason, takes an animal that may not meet the state's regulations. I don’t think those two scenarios should be treated the same, as the poacher is the more culpable of the two.”
Other respondents indicated several issues associated with classifying the illegal take of wildlife as a felony. These included:
• “I think more should be considered than the theoretical cost of replacement of an animal.”
• “If killing for profit or multiple offenses.”
• “It depends on the animal. Some animals warrant a felony while others warrant a misdemeanor.”
• “In some cases, I do. Depends on species and economic impact.”
• “Maybe, depending on the species.”
• “Not sure. Depends on circumstances.”
• “That's for the legislature to decide, not me.”
When asked about their views on prosecuting crimes, including the illegal taking of wildlife, nearly all prosecutors (99.0%) expressed their support for prosecuting nonviolent offenses. Among them, 95.0% regarded wildlife crimes as important for prosecution. The majority (69.0%) believed that sentences for wildlife crimes were consistent with statutory limits, and 71.0% endorsed mandatory minimums for certain serious wildlife offenses (Figure 2).
Do you generally support the prosecution of nonviolent offenses?
Do you consider wildlife crime important for prosecution?
Does sentencing of those convicted of wildlife crimes align with the statutory limits?
Would you support mandatory minimums for certain serious wildlife crimes?
Figure 2. General prosecutorial attitudes of respondents toward prosecuting wildlife crime.
Factors Influencing Prosecution of the Defendant
When prosecutors were asked about the factors influencing their prosecution priorities concerning defendants, they identified "Harm or Injury to the Public" as their top priority (Table 16). This was followed by the "Likelihood that the Defendant will Offend Again," commonly referred to as recidivism. Factors related to the defendant's behavior and past criminal history were assigned lower priority levels. Finally, the defendant's ties to the community were considered the least important priority for prosecutors.
Table 16. Rating of the importance of factors regarding the defendant that prosecutors take into account when prosecuting an illegal take case.
Table 16. Rating of the importance of factors regarding the defendant that prosecutors take into account when prosecuting an illegal take case.
Prosecutorial Priorities
Table 17 presents the findings from a survey item that inquired about prosecutorial priorities regarding wildlife crimes. Nearly three-quarters (74.0%) of the respondents considered reducing recidivism to be very or extremely important. Approximately two-thirds of the respondents indicated that both the accurate application of penalties and restitution for wildlife crimes (67.4%) and the successful prosecution of such crimes (65.4%) were extremely or very important. Fewer than half (46.5%) of the prosecutors regarded public perception of the adjudication of wildlife crimes as extremely or very important.
Table 17. Relative importance of prosecutorial priorities as they relate to their caseload.
Public Perception of How Wildlife
Adjudicated
Opportunities to Prioritize Illegal Wildlife Take
When prosecutors were questioned about factors that might elevate their focus on prosecuting wildlife crimes, many noted that they already regarded these offenses as high priority and pursued them accordingly. However, their most frequently cited needs were a better understanding or awareness of wildlife crime for themselves (39.4%) and the advantage of having personnel specifically dedicated to or trained in environmental and conservation issues (37.5%). Additionally, 31.7% of prosecutors expressed a need for educational resources, while approximately a quarter (23.1%) believed that shifting public opinion could enhance the prioritization of wildlife crime prosecution (Table 18).
Table 18. Motivators or information that surveyed prosecutors indicated would increase their prioritization of wildlife crime prosecution. Motivator
Among the prosecutors who selected the “Other” option and provided open-ended responses, several highlighted the need for better education of judges or an increase in prosecutorial resources for wildlife crime. Some offered more detailed insights into the challenges of prosecuting wildlife crime. For example, one respondent stated:
“It is difficult to explain to other prosecutors, defense attorneys, judges, lay witnesses, and the general public why these crimes are important. The perception of wildlife crimes is often that they are far less severe in terms of criminal cases than most any other type of case. Oftentimes, these groups perceive the time and energy spent on these cases with the attitude that it should be spent elsewhere (i.e. ‘catching real criminals’) as some would say.”
Another participant indicated the following:
“Success in jury trials/bench trials could be increased with changes in public opinion. I feel that my local Wardens do an excellent job of informing me regarding the importance of cases and providing me with the educational materials I may need to prosecute.”
And…
“We need more effective ways to prove the value of illegally taken wildlife.”
And…
“Wildlife officers need to be better trained, as most are clueless when it comes to preparing a case for prosecution.”
Factors Considered When Prosecuting a Case
Table 19 presents the results from a survey item in which prosecutors were asked to rank seven different considerations from least to most important when prosecuting wildlife crime cases. The factor deemed most important by the highest percentage of respondents was prosecution witness testimony (28.4%), followed by the type of animal illegally taken (26.1%), and the potential recidivism of the defendant (17.2%). When analyzing the average rankings of the factors, the number of animals taken illegally, witness testimony, and the potential recidivism of the defendant ranked highest. The three least important factors were the value of animals illegally taken, the motivations of the defendant, and the defendant’s criminal history.
Table 19. Factors ranked from least important (1) to most important (7) that surveyed prosecutors consider when prosecuting a wildlife crime case.
Factor
When asked to identify penalties they believed would effectively reduce recidivism for wildlife crimes, most prosecutors selected the confiscation of equipment used in the crime (60.6%) and suspension or revocation of hunting licenses (56.7%) as the most effective measures (Table 20). In contrast, fines (39.4%) and replacement costs (31.7%), which are commonly applied penalties for wildlife crimes, were not considered effective by more than 60.0% of the respondents.
Table 20. Penalty components for illegal take of wildlife the surveyed prosecutors consider likely to reduce recidivism for wildlife crimes.
Penalty Response
Table 20. Penalty components for illegal take of wildlife the surveyed prosecutors consider likely to reduce recidivism for wildlife crimes.
The open-ended responses from prosecutors selecting the "Other" option in this survey item offered valuable insights into the significance of wildlife crimes and the corresponding levels of punishment and restitution. For instance, when questioned about the adequacy of fines and replacement costs, the participants provided the following responses:
“Those states where replacement cost of the animal enhanced or only applied to trophy class animals has met with mixed success by those western states which apply it. Most poachers are motivated by trying to get away with something; most violators have made a simple mistake. True poachers do not often alter their behavior in fear of replacement costs. The low-income hunter is unable to make the restitution and know that they can't. The wealthy poacher often sees such restitution as an associated risk worth taking. For these to be effective, they must be truly burdensome financially (in the tens of thousands of dollars). Incarceration is a much better tool.”
“My state does not keep a sufficient data base to report hunting and fishing violations. If a violation triggers a suspension of hunting/fishing privileges, we have no way to track it the same way we would track the suspension of one's driving privileges.”
“Prosecutors should be given as many tools as possible to address criminal conduct.”
“I think getting repeat offenders to change their habits requires tailored punishment. It's not a one size fits all.”
We provided the following preface to the final survey question for prosecutors:
“From our research, we know the detection rate for wildlife crime is around 2%. The replacement cost to your state for the more iconic species (e.g. deer, elk, bears) is in the thousands of dollars. The economic loss to the state (and the public) is often several times that replacement cost.”
The final question was as follows:
“Hypothetically speaking, if theft of wildlife was elevated to the equivalent of felony theft of public property in your state, would you be more or less inclined to recommend suspension, diversion, dismissal, or reduction of the penalties?”
Less than half of the respondents (42.7%) stated that this would not alter their current recommendations regarding suspension, diversion, dismissal, or penalty reduction. Meanwhile, 24.1% expressed that they would be less inclined to suggest sentence reductions, and 31.2% indicated a greater inclination to recommend them.
Discussion
Recent research on wildlife crime in Kentucky over a 12-year span seems to confirm the concerns about the judicial system. Blevins and Gassett (2018) analyzed statewide citation and court data from 2006 to 2017 to assess the economic impact of fish and wildlife crimes in Kentucky. Their aim was to provide empirical evidence to help educate agencies and the public about the financial repercussions of such crimes. The study, using only the minimum fines and restitution, estimated that the annual fiscal impact of all detected fish and wildlife violations in the state was approximately $1.1 million, with nearly 80% ($864,778) attributed to poaching. Unfortunately, the state wildlife agency managed to recover only an average of 12.5% ($94,981 in fines; $13,634 in restitution) of these costs annually. The Kentucky study suggests that proportional restitution for wildlife crimes occurs in only a small fraction of cases, even when existing laws require restitution.
Although the B&C study by Edwards (2017) showed that the majority (42) of states have restitution language for replacing poached wildlife, there is a noticeable lack of standardization in restitution costs, both within individual states and across different states. In all states, criminal penalties are typically linked to the severity of the crime (e.g., 1st degree misdemeanor, 4th degree felony) and are aligned with crimes of similar gravity. These classifications often establish limits for criminal penalties, preventing them from reaching a level that reflects true restitution. Restitution-specific language is much less consistent or even absent in some instances due to the challenge of assigning a value to a specific animal or group of animals. This issue is further complicated by the combination of criminal and civil restitution provisions across states and the flexibility most states allow for judicial discretion.
It is necessary to develop and present language that is consistent, fair, enforceable, and proportional to lawmakers, prosecutors, judges, and other officials to establish and consistently enforce appropriate penalties and restitution costs for the violators. Moreover, consideration should be given to implementing mandatory minimum provisions, such as those for serious drug or weapons convictions, which prevent prosecutors and judges from dismissing or reducing statutory fines and restitution. Finally, consideration should be given to transitioning current civil restitution statutes to criminal restitution to ensure that the costs associated with collecting proportional restitution do not become prohibitively burdensome for state wildlife agencies.
While restitution programs serve as valuable deterrents, particularly when combined with other penalties, such as the revocation of hunting privileges, their effectiveness is often undermined by judicial and enforcement challenges, as well as a lack of standardization in restitution and financial penalty amounts nationwide. The existing literature in this field advocates for standardized restitution frameworks across jurisdictions to ensure consistency in penalties and convey a clear, unified stance against wildlife crime (Musgrave et al., 1993). Nearly three-quarters of the prosecutors surveyed in this study supported mandatory minimum penalties for certain wildlife crimes, and more than half believed that confiscating equipment used in the crime or suspending/revoking hunting licenses are sanctions that could help reduce recidivism among illegal take offenders. Furthermore, almost half of the respondents thought that the illegal take of
big game should be treated as felony theft of a public resource, especially if the animal's value exceeds the state's felony threshold.
Expanding specialized judicial training in wildlife law, as suggested by Geist and Organ (2004), may further enhance judges, prosecutors, and jurors’ understanding of the ecological impact of wildlife crimes. Such education should encompass potential societal impacts, including the value of wildlife and how the illegal take of big game harms the community. Given that "harm or injury to the public" was the top factor cited by prosecutors in this study, and almost 40% of them expressed a need for better understanding or awareness in prosecuting wildlife crimes, greater comprehension of the impacts of wildlife crime may reduce light sentencing or case dismissals. Programs such as Indiana’s Relevancy Project, discussed by Edwards (2017), in which conservation officers directly engage legislators and judges to raise awareness about wildlife law enforcement, exemplify how outreach can bridge knowledge gaps in the judicial process. Such educational initiatives may lead to greater judicial consistency and support for imposing meaningful restitution values, as wildlife crimes are recognized as public and environmental issues.
Additionally, several prosecutors mentioned the need to better educate judges and increase prosecutorial resources for wildlife crimes, noting that they could benefit from personnel dedicated to and trained in environmental and conservation matters. Haines et al. (2016) proposed the development of standardized "wildlife crime dockets" to prioritize these cases in high-caseload court systems, potentially increasing both conviction rates and the perceived severity of wildlife crimes. Conservation officers surveyed for this project agreed with initiating such specialized dockets and also believed that educating the public is the most effective strategy for increasing conviction rates for illegal take. Citizens should be more aware of the true impact of wildlife crime, which would make them more willing to testify if they witness a poaching event. Such testimony is crucial for developing robust cases against poachers, and prosecutors ranked witness testimony as the overall top priority when considering the prosecution of wildlife crime cases.
Chapter 5: Estimating the Undetected Rates of the Illegal Take of Big Game
Wildlife crimes are often under-detected and under-reported for several reasons. For example, the environments where most illegal big game hunting occurs are often vast, uninhabited, and difficult to access, with few potential witnesses present. These conditions, coupled with the limited number of conservation officers patrolling large areas, make it rare for law enforcement to directly observe these crimes (Eliason, 2008; Falcone, 2004; Forsyth, 1993, 2008; Forsyth & Marckese, 1993a; Wyatt, 2013). The same factors that characterize the settings of wildlife crimes also reduce the likelihood of witnesses, aside from those accompanying the offender. In the absence of law enforcement or other witnesses willing to report the incident, illegal activity is likely to be uncovered only if an informant who learns of the crime after it occurs reports it (Forsyth, 2008). Informants can assume various roles, such as someone to whom the offender has boasted, someone who has been shown an illegally taken animal, or professional meat processors and taxidermists who may question the legality of an animal brought to them for processing or mounting.
The cryptic nature of wildlife crimes and the unfamiliarity of potential witnesses with wildlife laws make estimating their detection rates a daunting task. This has resulted in a paucity of peerreviewed research on this subject. Therefore, to develop an estimate of the levels of illegal wildlife take, we compiled a variety of research papers, reports, and survey data along with ancillary datasets from studies where the undetected rate could be estimated, inferred, or where sufficient data existed to calculate a detection/non-detection percentage. While some of these reports directly investigated the levels of illegal take, most were designed for other purposes, requiring additional transformations or use in combination with other datasets to provide information useful for calculating the undetected rate of illegal take. The data, surveys, and research projects used in this analysis included the following:
• The 2024 National Crime Victimization Survey (NCVS).
• A poacher self-report survey.
• A stakeholder perception and experience survey (Chapter 2).
• Citation, manpower, and big game population parameters from the 8 subject states.
• Direct research reports on illegal wildlife take.
• Radiotelemetry studies involving big game species.
Objectives
1. To evaluate existing literature, telemetry studies, citation data, and stakeholder perceptions were used as sources for estimating detection rates.
2. To apply a Bayesian statistical framework to develop a range of detection estimates and assess the uncertainty surrounding them.
3. To estimate the undetected (dark figure) rate of illegal take of big game using empirical and modeled data.
4. To quantify the implications of low detection rates for wildlife conservation, enforcement, and resource management planning.
Methods
National Crime Victimization Survey
According to the latest NCVS data (Tapp & Coen, 2024), only 41% of violent crimes and 32% of property crimes were reported to the police in 2023. The reporting rates for these crimes varied significantly.
• Aggravated assault: 57.1% reported
• Rape and sexual assault: 46.0% reported
• Burglary: 42.7% reported
• Robbery: 42.4% reported
• Simple assault: 40.9% reported
• Larceny/theft: 24.8% reported
Although none of the reported crimes were directly related to the illegal take of big game, we felt that the estimate for larceny/theft (theft of property outside a dwelling or home) could act as a surrogate for the illegal take of big game (theft of public property outside a dwelling or home) to provide an initial starting value for our analysis.
Poacher Self-Report Survey
A brief three-question screening survey to solicit interviews with those previously convicted of illegal take was distributed across social media platforms and chat rooms popular among hunters in all 50 states. The survey inquired whether respondents had ever committed an act of illegal take and been detected, whether they had committed such an act without detection, and whether they would be willing to participate in a confidential phone interview for a $25 gift card. Essentially, these screening questions served as self-report surveys, offering us additional valuable data for estimating the undetected rate of illegal take of big game. We also conducted follow-up interviews with individuals convicted of wildlife crimes, particularly poaching, to ascertain the types and rates of crimes committed by respondents that went unreported or unprosecuted by the authorities. However, the sample size was extremely small, yielding limited information on detection rates.
Stakeholder Perception & Experience Surveys
Hunters and landowners were surveyed (Chapter 2) regarding the specific number of incidents they were aware of each year and how many were reported to law enforcement. This ratio helps us gain a clearer understanding of the frequency with which crimes witnessed by individuals other than the perpetrator(s) are reported to the authorities. We also created and administered a similar but more extensive survey for conservation officers. This survey explored similar aspects gathered from the hunters and landowners but also included the types and rates of wildlife crimes known to the officers, but where they lacked sufficient evidence to issue citations or make arrests.
Citation, Manpower, and Population Parameters
We evaluated citation, manpower, and big game population data as surrogate measures for assessing illegal take. These data include the number of licensed hunters, the number of conservation officers, the area covered by these officers, the population estimates of big game species, and the annual number of big game poaching citations issued. All data were collected and analyzed from the eight subject states in this study to account for factors such as limited law enforcement coverage and the ratios of illegal to legal take of big game
Direct Research Reports on Illegal Take of Big Game
A thorough review of the literature yielded only six direct research reports investigating the illegal take of big game in the U.S. However, these studies had small sample sizes and limited or dated methodologies. Taken alone, they lack sufficient power and robustness for the accurate estimation of detection rates. However, the Bayesian methodology used in this study is effective in combining numerous small datasets to arrive at a more reliable estimate.
Big Game Telemetry Studies
Using these data, we estimated the rates of undetected big game poaching and those incidents that were detected but not prosecuted. We then used these estimates, along with current penalties and replacement costs for lost animal value, licenses, permits, and federal wildlife assistance grants, to calculate the true fiscal cost of undetected wildlife crimes at the state, regional, and national levels.
This study employed a Bayesian statistical framework to estimate the detection rates of illegal take using diverse datasets from various published research papers, along with citation, hunter, and officer numbers from eight subject states, survey responses from perpetrators, enforcement statistics, hunter landowner reporting, and wildlife telemetry studies.
Results
These reporting rates act as proxies for detection, although they do not reflect the proportion of reported cases that lead to arrest or conviction. Nonetheless, even at the lower end (larceny/theft at 24.8%), the potential for detection is significantly higher than that reported for the illegal taking of wildlife in other studies.
National Crime Victimization Survey
It is important to note that all crimes monitored by the NCVS involve human victims who can selfreport incidents. In contrast, wildlife crimes lack a direct human complainant, with the "victim" being the collective citizenry and broader public trust. This structural difference inherently suppresses detection and, consequently, reporting, which helps explain why illegal take is underreported by orders of magnitude more than any human crime category tracked in national victimization surveys.
Poacher Self-Report Survey
A total of 247 individuals responded to the survey, of which 63 indicated that they had engaged in illegal taking, whether detected, undetected, or both. Of these, only 19 met the criteria of having committed a detected or undetected act, agreed to an interview, and provided their contact information (Table 21). However, none of the participants completed an interview.
Table 21. Convenience sample responses of persons committing acts of illegal take of wildlife.
Action (n=247)
Yes No
Interview?
Performed Act of Illegal Take - Detected Only 3.2% (8)2 agreed (0 provided contact info)
Performed Act of Illegal Take - Not Detected Only 18.6% (46)20 agreed (15 provided contact info)
Performed Act of Illegal Take - Detected & Not Detected 3.2% (8) 70.4% (174) 6 agreed (4 provided contact info)
Performed Act of Illegal Take - Detected/NR 0.4% (1) 4.0% (10) -
Total
(63)
(184) 19 agreed and provided contact info
Among the 63 respondents (25.6%) who reported involvement in detected or undetected incidents of illegal take, or both, 73.0% stated they had never been detected, resulting in a detection rate of 27%. Additionally, 12.7% reported involvement in both detected and undetected events, with an overall non-detection rate of 85.7% (detection rate of 14.3%). Lastly, 12.7% of the respondents indicated involvement in a detected event but not in an undetected event, while 1.6% reported involvement in a detected event but did not respond to the question regarding undetected events (Table 22).
Table 22. Subset of 63 persons from self-report survey who committed acts of illegal take of wildlife.
Action (n=63)
Both Detected and Undetected Incidents
Incidents Only
Detected Incidents Only
Positive Responses Detection Rate
(8) -
(46)
(8)Detected & No Report on Undetected
(1) -
Table 22. Subset of 63 persons from self-report survey who committed acts of illegal take of wildlife.
Citation, Manpower, and Population Parameters
We collected and analyzed citation data, officer complement, hunter numbers, and geographic size of the states for our 8 target states to develop additional data for the Bayesian model describing illegal take rates (Table 23).
Table 23. The state-by-state data on illegal take citations including the number of officers, hunters, and citations for illegal take written for each year of the study.
Stakeholder Perception & Experience Surveys
In this study, we conducted extensive surveys of stakeholders (hunters and landowners) and trustees (conservation officers) on a range of issues related to the illegal take of wildlife. These groups were chosen because of their close ties to the locations and situations where these crimes occur. For instance, most law-abiding hunters have a vested interest in and understanding of wildlife crime issues, and their activities often place them in situations (such as hunting or scouting) where they become familiar with the timing and circumstances of illegal wildlife activities. Similarly, landowners are generally aware of legal or illegal activities occurring on their properties. Their actions also suggest a vested interest in and understanding of wildlife crime issues, as they are often in situations that allow them to recognize the timing and circumstances of illegal wildlife activities in their areas. Conservation officers were extensively surveyed as the
representative "Trustee" for this project, as they are on the front lines of the effort to reduce the illegal take of wildlife in the U.S.
Some questions in these surveys specifically asked respondents about their opinions on the levels of detection and reporting of illegal take at various geographic scales. Measures of distribution and dispersion indicate that the responses for each of the three groups are within the range to be treated as normal distributions (Appendix C). Responses from hunters and landowners ranged from 0% to 100%, and conservation officers selected 0% to 99%. The mean, median, and mode for all three groups were close to 50%. In other words, the survey respondents generally believed that approximately half of all illegal take incidents were detected or known by someone other than the perpetrator(s).
Although the exact percentage of illegal take events remains unknown, limited studies on the subject indicate a very low detection rate (Decker et al., 1980). The higher detection rates reported by survey respondents may stem from uncertainty, as participants might not be aware of the actual percentage of illegal wildlife take detected. Research has demonstrated that when respondents are uncertain about a survey item and lack the option to indicate their lack of knowledge, they often choose the midpoint of a scale or index (Hurd, 2009; Pavlova, 2025).
Table 24 presents the average percentage of illegal take that survey respondents believe goes undetected in their state, categorized by stakeholder group and region. Different superscript letters in Table 24 and Table 25 indicate significant differences (p<0.05) among regions for each stakeholder group, while identical superscript letters suggest no differences among the associated regions.
On average, hunters in the sample estimated that 49.9% of illegal take in their state went undetected. Regionally, this average ranged from 49.5% in the Northeast to 50.5% in the Southeast, with no statistical differences among regions. For landowners, the overall average rate of undetected illegal take was 50.6%, with the Midwest reporting the lowest average at 49.6%, significantly lower than the West's 53.0%. No statistical differences were found between landowners in the Northeast and Southeast and those in other regions. Conservation officers, on average, believe that 51.1% of illegal big game take goes undetected. Officers in the Southeast estimated a significantly higher undetected rate of 53.1% compared to 45.2% in the West, with no other regional differences noted.
Table 24. By region, the percentage of illegal take that each Stakeholder Group believes goes undetected in their state of residence.
Table 24. By region, the percentage of illegal take that each Stakeholder Group believes goes undetected in their state of residence.
A follow-up survey question asked participants to estimate the percentage of detected illegal big game hunting that they believed went unreported to law enforcement. Responses from all three stakeholder groups varied from 0% to 100%, with each distribution approximating a normal distribution (Appendix C). The mean percentage reported was approximately 45% for each group (Table 25), while the median and mode for all groups hovered around 50%, possibly indicating uncertainty in responses (Hurd, 2009; Pavlova, 2025). As detailed in Table 25, hunters reported a mean of 45.5% for illegal take they believed went unreported. Although there were no significant regional differences, hunters in the West reported the lowest average (43.3%), whereas those in the Midwest reported the highest average (47.8%) of cases that they believed were not reported. On average, landowners estimated that 45.9% of detected illegal take goes unreported to officials. The regional range for landowners was from 43.5% in the Northeast to 49.4% in the West, with no significant regional differences. Conservation officers believed that, on average, 45.7% of events went unreported to law enforcement, with regional figures ranging from 43.8% in the West to 47.4% in the Southeast, with no differences among regions.
Table 25. By region, the percentage of illegal take that each Stakeholder Group believes are detected but goes unreported in their state of residence. Stakeholder
The "dark figure," as defined in this report, refers to the number of illegal take incidents that remain undiscovered and/or uninvestigated by law enforcement. The elusive nature of wildlife crime often means that detection by anyone other than the perpetrator is rare. However, even when wildlife
crimes are witnessed, the rate at which they are reported to law enforcement remains low, as discussed in the previous sections.
To explore the perceptions of hunters and landowners, the survey instrument sought to differentiate these views by posing two separate questions to respondents: one on estimated levels of detection and the other on estimated levels of reporting. To use this information as an index of illegal take, the data from these questions must be combined. For instance, a witness must not only be aware of an illegal take incident (detection) but must also report it to the law enforcement (reporting). Consequently, the data in Table 24 andTable 25 can be merged (Table 26) to estimate the dark figure using the following formula:
Table 26. Estimates of non-detection rates (dark figure) of wildlife crimes calculated from stakeholder responses. Stakeholder
Personal Experiences of Stakeholders with Illegal Take
Hunters and landowners were also queried regarding whether they had witnessed, been informed of, reported, or been involved in incidents of illegal take in their state of residence from 2017 to 2021 (Table 27). In this table, different superscript letters indicate significant differences (p<0.05) among regions within each stakeholder group.
Over a fifth of the participants (20.4% of hunters, 21.8% of landowners, and 20.7% of the combined groups) reported involvement (awareness, reporting, or direct association) in illegal take. Regionally, a higher percentage (29.7%) of hunters in the Southeast reported involvement in illegal take than hunters in all other regions, whereas a lower percentage of hunters in the West (10.2%) reported involvement than hunters in all other regions. There were no statistically significant differences between the hunters in the Midwest and Northeast. For landowners, the only regional difference was between the Midwest (23.7%) and the West (19.5%); no significant regional differences were found between the Northeast and Southeast regions.
Table 27. Percentage of respondents that witnessed, were made aware of, reported, or were involved in incidents of illegal take in their state of residence from 2017-2021.
Table 28 presents a comparison of hunters' and landowners' responses regarding the circumstances under which illegal take incidents were reported. No significant differences were observed between the two stakeholder groups. Nevertheless, both groups were twice as likely to report incidents they were personally aware of (Hunters = 1.30; Landowners = 1.53) compared to those detected by others (Hunters = 0.63; Landowners = 0.63). This pattern also applied to incidents witnessed by the respondents but reported by someone else (Hunters = 0.88; Landowners = 0.73). A more notable concern is that both hunters and landowners were slightly less inclined to report an incident they witnessed (Hunters = 1.54; Landowners = 1.69) than to report an incident they detected (Hunters = 1.30; Landowners = 1.53).
Table 28. The average number of incidents of illegal take that respondents indicated they personally witnessed or of which they were aware occurring in their state of residence from 2017-2021.
Response
That were both detected and reported by you
That were detected by you but reported by someone else
That were detected by someone else but reported by you
That were detected by you but, to your knowledge, were not reported
Discussion
Using stakeholder surveys, citation records, and empirical models, the study estimated detection rates below 5%, with conservative Bayesian models placing them as low as 2.4%. This implies that more than 95% of poaching incidents are undetected. When adjusted for the average replacement value of poached animals, these undetected crimes account for an estimated national loss of more than 1 billion annually.
When the public seeks information about crime rates for specific offenses, they typically turn to percentages and statistics from official sources such as police crime reports, arrest records, court convictions, or incarceration rates. However, it is crucial to recognize that these official reports often offer a limited perspective on crime issues. For instance, not every reported crime leads to an arrest, not every arrest results in a conviction, and not every conviction results in the incarceration of the perpetrator. Crime rate narratives and statistics are usually presented at the most basic level crimes reported to authorities, regardless of whether they lead to arrests or are resolved differently. Even at this level, some offenses, including violent crimes, go unreported, remain unknown to authorities, and are absent from official reports.
Authorities become aware of crimes through two primary methods. Less frequently, law enforcement officers witness crimes as they occur. More commonly, crimes are reported during or after the fact by victims or witnesses who may be hesitant to get involved for various reasons. Consequently, a significant number of crimes go unrecorded each year. These unreported and undocumented crimes are referred to as the "dark figure" of crime and can significantly impact critical matters such as the allocation of police presence and resources. A high dark figure also diminishes the general deterrent effect for potential offenders who are contemplating crimes (Aljumily, 2017; de Castelbajac, 2014; Narreddy & Shashidhar, 2024; Skogan, 1977; Wellsmith, 2011; Zimmerman, 2003).
In the mid-1900s, both scholars and practitioners recognized the importance of understanding crime levels that were not reported to the authorities. Small-scale self-reports and victimization surveys were employed to gather more information on these crimes. Self-report surveys, also known as offender surveys, were designed to collect data on the prevalence and frequency of crimes committed but not reported by the offenders. Victimization surveys asked citizens about recent crimes and whether they had been reported. Although both types of surveys have potential issues (e.g., offenders' truthfulness, victims' recall, and victims' willingness for full disclosure) (Green et al., 1988), the information they provide is valuable in reflecting the prevalence of certain types of criminal events (Biderman & Reiss, 1967; Skogan, 1977; Thornberry & Krohn, 2000, 2003; van Dijk, 2016).
To date, there has been no nationwide initiative for general self-report offender surveys, but significant progress has been made in general victimization surveys. Recognizing the need for more accurate estimates of the frequency and prevalence of various crimes, the federal governmentinitiated plans for a national survey of potential crime victims in the 1960s. In 1972, the agency now known as the Bureau of Justice Statistics began distributing the National Crime Victimization Survey (NCVS) to a large sample of American households and businesses. Although the NCVS has undergone several revisions and expansions, it remains a crucial tool for estimating crime. The NCVS results consistently reveal high levels of unreported crime. For instance, in 1973, the first year of reporting findings, the results indicated that most crime victims, even those who experienced violent crimes, did not report the incidents. At that time, the reporting rate for simple larceny, a crime most similar to the illegal take of wildlife (or theft of public property), was only 18% (Skogan, 1977). Generally, these patterns have persisted. The 2023 NCVS findings show that 44.7%
of the violent crimes listed in the survey (rape/sexual assault, robbery, aggravated assault, and simple assault) were reported to police. For property crimes included in the survey [burglary, trespassing in structures, which excludes trespassing on land, motor vehicle theft, and other theft], only 29.9% of the victimizations were reported to the police. In other words, 55.3% of violent crimes and 70.1% of property crimes constituted the dark figure and were not reported to law enforcement officials by victims in 2023 (Tapp & Coen, 2024). While insights from victimization surveys are vital to law enforcement policies and planning, these surveys are not without limitations. For example, all victimization surveys, including the NCVS, ask respondents about a limited number of crimes. Additionally, and perhaps more importantly, it is impossible to collect data from victims of events that are considered victimless crimes (Carrington, 2000; Green et al., 1988; Langton et al., 2012).
Although domestic poaching activities have received increased attention over the last few decades (Leavitt et al., 2021; McFann & Pires, 2018; Steinmetz et al., 2014), wildlife offenses, including the illegal take of big game, are typically categorized as victimless crimes. However, poachers steal wildlife, resources, and opportunities from the collective citizenry and potentially from future generations (Haines et al., 2016). However, the true extent of illegal take and other wildlife crimes is unknown (Cowles et al., 1979; Crow et al., 2013; Green et al., 1988; Wellsmith, 2011). These types of crimes are not quantified in national-level reports, such as the Uniform Crime Reports, and there is a consensus that there is a large dark figure of wildlife crimes that is not reflected in official individual state or federal crime statistics concerning the reporting of wildlife crimes (Eliason, 2003a, 2008; Haymes et al., 2018; Wellsmith, 2011).
There are several reasons for the significant underreporting of wildlife crime. The environments where most illegal big game hunting occurs are often vast, uninhabited, and difficult to access, with few potential witnesses. These conditions, coupled with the limited number of conservation officers patrolling large areas, make it rare for law enforcement to directly observe these crimes (Eliason, 2008; Falcone, 2004; Forsyth, 1993, 2008; Forsyth & Marckese, 1993a; Wyatt, 2013). The same factors that characterize the settings of wildlife crimes also reduce the likelihood of witnesses, aside from those accompanying the offender. In the absence of law enforcement or other witnesses willing to report the incident, illegal activity is likely to be uncovered only if an informant who learns of the crime after it occurs reports it (Forsyth, 2008). Informants can assume various roles, such as someone to whom the offender has boasted, someone who has been shown an illegally taken animal, or professional meat processors and taxidermists who may question the legality of an animal brought to them for mounting.
Even when witnesses to wildlife offenses are present, they may hesitate to report incidents to authorities for various reasons. Although the literature specifically on the reporting of wildlife crimes is limited, research on witness reporting of crimes in general reveals consistent factors that witnesses consider when deciding whether to get involved and officially report the event. For instance, studies indicate that individuals are more inclined to intervene or report crimes when there is a low risk of retaliation or danger to the witness and when there is no relationship or close social connection between the offender and witness (Aiello, 2019; Beattie, 1975, 1976; Brewster &
Tucker, 2016; Leavitt et al., 2021). While these concerns are often considered when reporting wildlife crimes, two additional factors from the general crime reporting literature may be particularly relevant: the perceived seriousness of the crime and the level of uncertainty or ambiguity about the observed action.
Witnesses are more inclined to report crimes when they perceive them to be serious events. Unfortunately, research indicates that wildlife crimes are generally viewed as less serious than other types of offenses. A survey comparing perceptions of wildlife offenses—such as spotlighting, lacking a license, taking deer or turkey out of season, and violating size limits with property offenses such as burglary, theft, shoplifting $600 in merchandise, and shoplifting socks, and person offenses including robbery with murder, child abuse, manslaughter by automobile, and arson, revealed that respondents considered wildlife offenses less serious than both property and person offenses. These respondents ranked wildlife offenses significantly lower in terms of seriousness, wrongfulness, and harmfulness (Wagner et al., 2019). Given that perceived seriousness is a known factor influencing reporting, even when witnesses recognize an incident as a crime, they may choose not to report it if they do not deem it serious enough to warrant their involvement.
Witnesses are also more likely to report a crime when they are certain about what they observed and know that the incident was indeed a legal violation. Some crimes, such as assault, are easily recognized as illegal by most people. However, the classification of other offenses may be less clear. For instance, a witness might see property theft but be unaware that the property does not belong to the person who took it. In the case of wildlife offenses, such as the illegal taking of big game, there is significant uncertainty regarding the legality of the observed actions. Some hunting and fishing laws may be confusing even for hunters and anglers (Fisher, 2024, Karlen et al., 2023), and those who do not engage in these activities may be entirely unfamiliar with wildlife laws. Consequently, someone might witness a blatant illegal taking of big game and not report it because they did not realize the act was illegal (Green, 2016), especially since most poaching incidents likely occur during legal hunting seasons (Green et al., 1988; Muth & Bowe, 1998; Sawhill & Winkell, 1974).
Poaching hotline programs provide witnesses with a means to report wildlife crimes, either confidentially or anonymously, potentially alleviating their fears of harm or retaliation due to their involvement in reporting. Depending on the program's design, a poaching hotline can also assist witnesses in determining whether what they observed constitutes a crime and can promote incentives, such as financial rewards for informants, which may encourage reporting (International Consortium on Combating Wildlife Crime, 2019; Kurland et al., 2017).
Leavitt et al. (2021) conducted a survey to assess respondents' willingness to report a deer poaching incident via a poaching hotline. The study tested four randomly assigned hotline factors: 1) government-operated, 2) nonprofit-operated, 3) confidential reporting, and 4) anonymous reporting. The findings revealed that nearly 80% of participants would report deer poaching, regardless of the potential for a reward. Just over 15% of respondents indicated that they would report only if a reward was possible, while about 6% stated that they would not report the crime at
all. It is crucial to consider the methodological issues in this study. First, survey participants received instructions detailing the randomly assigned poaching hotline program, how to use it to report wildlife crimes, and what would happen after reporting. Additionally, the survey's vignette asked respondents to "...imagine you are recreating on public land and come across an individual in possession of a dead deer. The deer appears to have been shot by this individual and you know deer are not in season today...it is illegal to hunt deer today and you are convinced this individual committed a wildlife crime" (Leavitt et al., 2021, p. 1263). While the information provided to respondents is methodologically sound, it may not mirror real-world situations, as potential witnesses might lack knowledge about poaching hotlines or the hunting season's duration. Nevertheless, these results offer optimism for witness reporting and the use of poaching hotline programs if witnesses are informed about these issues and their importance. Other findings regarding witness reports of wildlife crimes highlight differences based on economic status and geographic residency. Notably, individuals in lower income brackets and those living in rural areas two often correlated attributes are less inclined to report such crimes. It has been suggested that witnesses with limited financial resources may be less likely to report wildlife crimes because they might assume that the illegal taking of wildlife is for subsistence (Leavitt et al., 2021).
The consistent yet concerning results show that rural residents are less likely to report wildlife crime. These potential witnesses live in areas where illegal activities are more likely to occur, and many of them engage in hunting and fishing. If they do, they should at least be familiar with basic regulations and would probably recognize certain wildlife crimes. Nevertheless, regardless of reward incentives, rural residents have been shown to be more than three times as likely as others to say that they would not report poaching behavior (Leavitt et al., 2021). This may be because wildlife offenses are accepted as part of a long-standing subcultural folk crime (Filteau, 2012; Forsyth, 2008; Forsyth & Marckese, 1993a; Forsyth et al., 1998; Muth & Bowe, 1998; Peterson et al., 2019; Rizzolo et al., 2017; Scialfa, 1992; Serenari & Peterson, 2016; Stretesky et al., 2010; von Essen et al., 2014), and/or because they prefer to handle matters informally due to distrust in the government (Eliason, 2003a; Eliason & Dodder, 1999; Forsyth & Marckese, 1993a; Scialfa, 1992).
The Dark Figure Estimate
Wildlife crime, particularly the illegal taking of game species, poses a significant challenge to conservation and law enforcement agencies in the U.S. These activities undermine sustainable wildlife management efforts and lead to substantial ecological and economic losses (Nijman, 2017; Wellsmith, 2011). A persistent challenge in addressing wildlife crime is the "dark figure" or the proportion of offenses that remain undetected or unreported. Accurately estimating this figure is critical for developing effective policies, prioritizing enforcement resources, and understanding the true scope of wildlife crime. Unlike crimes against individuals or property, wildlife crimes often occur in remote or unmonitored areas and leave minimal forensic evidence, making detection and enforcement particularly challenging (Gavin et al., 2010).
Bounding Data from NCVS
The NCVS annual report compiles the detection and reporting rates for selected crimes against individuals or property. Crimes against individuals are generally regarded as significantly more severe than the illegal taking of wildlife. However, even serious offenses, such as armed robbery and sexual assault, often have reporting rates around or below 50%. Some property crime data, such as larceny, serve as suitable proxies for the illegal taking of wildlife, which is also a form of property theft. These data provide appropriate "boundaries" for calculating illegal take, as their reporting rates are likely more accurate than those found in existing research, as they are derived from actual victim surveys.
Direct Research
Few studies have been published that directly aim to measure or calculate the unreported rate or dark figure of illegal wildlife take. In our literature review for this study, we identified fewer than 10 studies that specifically examined or reported the detection rate of illegal take of big game. These studies indicated detection rates ranging from 0.67% to 3.33% (Green, 2002; Green et al., 1988; Kaminsky, 1974; McMullan & Perrier, 2002; Smith, 1982; Vilkitis, 1968; Wellsmith, 2011; Wyatt, 2013). However, the conviction rates for offenders apprehended by officials are notably high. While these rates vary by state, they generally average over 90% (Hansen, 1994).
Self-Report Survey
As part of this study, a brief three-question survey was distributed across social media platforms and chat rooms popular among hunters in all 50 states. The survey inquired whether respondents had ever committed an act of illegal take and been detected, whether they had committed such an act without detection, and whether they would be willing to participate in a confidential phone interview for a $25 gift card. Essentially, these screening questions served as self-report surveys, offering us an additional valuable data point on illegal take.
Agency Citation Data, Law Enforcement Manpower, & Population Estimates
An array of related data can also serve as surrogate measures for assessing illegal take. These data include the annual number of illegal take citations issued, the number of licensed hunters, population estimates of big game species, the number of conservation officers, and the area covered by these officers. All these data were collected and analyzed from the eight subject states in this study to account for factors such as limited law enforcement coverage and the ratios of illegal to legal take.
Stakeholder Perceptions of Illegal Take
Because illegal take often lacks identifiable "victims" for a victimization survey, we relied on the perceptions of stakeholders (hunters and landowners) and trustees (officers) to collect additional data on their views regarding the effectiveness of poaching detection and reporting on lands they hunt, own, or patrol. These groups are likely the best firsthand "witnesses" to the crime of illegal take because they live, own, recreate, and/or work in areas that are more susceptible to poaching activities. They also tend to relate more to the issue because of their similar, yet lawful, interests in the management or pursuit of game.
Stakeholder Personal Experiences
Stakeholders were also surveyed regarding the specific number of incidents they were aware of each year and how many were reported to law enforcement. This ratio helps us gain a clearer understanding of the frequency with which crimes witnessed by individuals other than the perpetrator(s) are reported to the authorities. Additionally, we can correlate the number of events reported by the surveyed stakeholders with broader hunting and landowning communities.
Radio Telemetry Studies
Traditional methods for estimating poaching, such as enforcement records, arrest data, and selfreporting surveys, are constrained by inherent biases and underreporting (Eliason, 2003a; Hall, 1992). These approaches capture only a small portion of actual offenses because of the covert nature of wildlife crimes and the limited resources available to law enforcement. Consequently, conservationists have increasingly turned to indirect techniques to estimate illegal take. One such method is radio telemetry, which involves capturing, tagging, and long-term monitoring of individual animals using radio collars or global positioning system (GPS) transmitters. Although primarily designed to estimate demographic parameters such as survival, reproductive success, and movement patterns, radio telemetry also provides valuable data on mortality causes, including those that are human-induced but occur outside legal harvest boundaries. These data can serve as proxies for estimating illegal take rates, particularly for big game species such as deer, elk, and bears.
The Bayesian Approach
Bayesian statistical methods provide a robust framework for making inferences under uncertain conditions, particularly when data are scarce or incomplete. This makes Bayesian approaches particularly well-suited for studying undetected or "dark figure" crimes criminal events that go unreported, unrecorded, or otherwise unnoticed by formal enforcement systems (Biderman & Reiss, 1967; Skogan, 1977). Unlike classical (frequentist) statistics, which depend heavily on large sample sizes and assume fixed parameters, Bayesian analysis incorporates prior beliefs and updates these beliefs as new data become available (Gelman et al., 2013).
This study employed a Bayesian statistical framework to estimate the detection rates of illegal take using diverse datasets from various published research papers, along with citation, hunter, and officer numbers from eight subject states, survey responses from perpetrators, enforcement statistics, hunter landowner reporting, and wildlife telemetry studies. The following sections provide detailed descriptions of each dataset.
The National Crime Victimization Survey: A Reference Point
Estimating wildlife crime violations is challenging for numerous reasons, as previously discussed. The most critical factor is the absence of apparent victims who report these violations to the authorities. To contextualize the notably low detection rate of wildlife crimes, one can compare it to more conventional crimes, where victimization studies, such as the NCVS, provide more reliable estimates of detection and reporting rates. These comparisons emphasize the extent of under-
detection across various criminal behaviors, while also highlighting the unique opacity of wildlife crime, given its non-human victims and remote settings.
Furthermore, while some crimes, such as robbery or burglary, may leave physical evidence and generate immediate consequences that prompt law enforcement involvement, most wildlife crimes occur in remote, uninhabited areas, making proactive detection particularly challenging for law enforcement. This asymmetry underscores the need for a fundamentally different approach to wildlife law enforcement, including investment in surveillance technologies, informant networks and data-driven patrol planning.
The stark disparity between wildlife crime detection rates and those for common crimes illustrates that even society's least-reported offenses among humans still enjoy detection levels ten times higher than those for the illegal taking of wildlife. This context not only underscores the urgency of addressing the "dark figure" in wildlife crime but also provides a comparative framework for communicating these challenges to the public and policymakers, who are accustomed to interpreting more conventional crime data.
Direct Quantitative Research on Illegal Take of Wildlife
Ironically, more is known about international wildlife crimes and trafficking than domestic wildlife crimes in the U.S. On a global scale, only approximately 10% of extensive environmental crimes are reported, with an even smaller fraction of wildlife-specific offenses documented by law enforcement (Wellsmith, 2011). Similarly, evaluations of domestic wildlife crimes reveal that only 1–5% of poaching incidents are reported to the authorities (Leavitt et al., 2021; USFWS, 2011). U.S. studies on big game poaching specifically estimated detection rates ranging from 1.1% for general illegal big game hunting in Idaho (Vilkitis, 1968) to 4.2% for deer spotlighting in California (McCormick, 1968) (Table 29). These data suggest that the undetected (dark figure) rates ranged from 95.8% to 98.9%.
Table 29. Illegal take detection rates reported in the literature from other studies.
Author(s)
Vilitkis (1968)
Vilitkis (1968)
(1974)
Vilitkis (1968)
McCormick (1968)
Smith (1982) in Hall (1992)
Although these studies offer some insights into illegal take rates, they are constrained by small sample sizes and largely rely on outdated methodologies. Nevertheless, the rates reported in each
study can serve as valuable individual components in a more extensive and comprehensive analysis of illegal take rates, such as the one proposed in this study.
Self-Report Survey of Violators
To identify potential candidates for typology interviews, we extended an invitation to participate in a discreet, confidential interview about their personal experiences. These invitations were sent to individuals from the eight subject states reported to the Interstate Wildlife Violators Compact (Appendix D) as being ineligible for a license due to a conviction for illegal wildlife taking. Initially, participants were offered a $25 gift card for their participation, which was increased to $50 in the second mailing and $75 in the third and final mailing. Despite these efforts, participation rates remained extremely low, with only 14 individuals agreeing to be interviewed.
Our second approach involved developing a brief three-question survey, which was distributed on social media sites and chat rooms frequented by hunters across all 50 states. This survey inquired whether the respondent had committed an act of illegal taking and been detected, had committed an act without detection, and whether they would be willing to participate in a discreet, confidential phone interview for a $25 gift card, essentially serving as a self-report survey.
Using Radio Telemetry Studies to Estimate Illegal Take
Telemetry studies offer an empirical account of individual animal outcomes, detailing the time and cause of death, which can be corroborated by field investigations. When legally harvested animals are reported by hunters or identified through agency monitoring, these instances are typically well documented. However, unexplained disappearances of radio-tagged animals, suspicious deaths, and confirmed cases of unreported illegal killings provide insight into the extent and nature of wildlife crimes that might otherwise remain hidden. For instance, researchers have recorded instances where radio-collared animals were shot out of season, not reported despite mandatory check-in rules, or tampered with in ways that suggest concealment efforts (Milner-Gulland & Leader-Williams, 1992). These documented cases, especially when adjusted for sample size and study area, enable researchers to estimate the proportion of the population lost to illegal activities, even if individual offenders are not apprehended.
Telemetry studies are often long-term and cover extensive areas that span multiple jurisdictions, habitats, and regulatory frameworks. This wide coverage allows researchers to identify spatial or temporal patterns in poaching behavior, such as increased mortality near roads during specific seasons or close to private lands. These patterns may indicate enforcement blind spots or cultural norms that facilitate illegal harvesting (Liberg et al. 2012). For example, studies on white-tailed deer in Kentucky (Cox, 2003; Haymes et al., 2018) and Illinois (Storm et al., 2007) have documented non-hunting season deaths that could not be attributed to natural causes or vehicle collisions (Table 30). When accumulated over time and cross-referenced with legal hunting data, such events help quantify an otherwise elusive component of wildlife mortality and reveal the full human impact on wildlife populations.
A significant advantage of using telemetry to estimate illegal take is its independence from law enforcement records and self-reporting. In criminological terms, this method provides a more
direct view of the “dark figure” of crime incidents that go undetected and unreported by traditional surveillance systems (Biderman & Reiss, 1967). While law enforcement statistics often reflect only what is observed or reported, telemetry data are not subject to observational bias. Each collared animal serves as a silent witness, contributing to a broader understanding of population dynamics, legal compliance, and the effectiveness of enforcement. The loss of signal or unexpected death of such individuals often prompts field verification, yielding detailed evidence that enhances the credibility of illegal take estimates derived from these data sets.
Although telemetry studies were not originally intended to measure wildlife crime, they have become a valuable tool for understanding and quantifying the scale of illegal take in North American wildlife populations. By providing independently verifiable data on the fates of marked animals, these studies offer a means to estimate the unrecorded component of human-induced mortality. As conservation agencies strive to refine enforcement strategies and evaluate the efficacy of wildlife laws, telemetry-derived estimates of poaching are a crucial and empirically grounded addition to the wildlife management toolbox. When paired with enforcement data and public perception surveys, telemetry-based inferences help form a triangulated, evidence-based understanding of compliance rates and poaching pressure across species and landscapes in the wild.
Table 30. Various radio-telemetry research studies where the illegal take rates for big game were determined. Author(s)
CA Mtn. Lion
Kasworm & Thier, (1994) MT Black Bear
Kasworm & Thier, (1994) MT Black Bear
& Thier, (1994) MT Black Bear
Lopez et al., (1998) TX Wild Turkey
Wightman et al., (2023) GA, LA, NC, SC Wild Turkey
Lehman et al., (2007) SD Wild Turkey
et al., (1987) MO Wild Turkey
et al., (1998) MS Wild
(2000) PA Wild Turkey
et al., (2010) WA
et al., (2010) WA
et al., (1993) ID
et al., (2018) KY
et al., (2018) KY
et al., (2018) KY
et al., (2023) TN
(2001) AK
Detection Rates for Illegal Take - A Conservative Bayesian Model
The illegal taking of wildlife poses a significant threat to sustainable conservation and the integrity of public trust resource. Understanding the true detection rate of these crimes defined as the probability that someone other than the perpetrator becomes aware of the act is crucial for assessing enforcement effectiveness and deterrence. In this section, we introduce a Bayesian model designed to estimate the detection rate based on field expectations and existing empirical data from various sources.
Given the elusive nature of wildlife crime and its frequent occurrence in remote areas, it is widely accepted that detection levels are very low (Green, 2002; Green et al., 1988; Kaminsky, 1974; McMullan & Perrier, 2002; Smith, 1982; Vilkitis, 1968; Wellsmith, 2011; Wyatt, 2013). The few studies examining the actual detection rates of illegal wildlife take provide estimates of 1.1% to 4.2% (Table 29). Bayesian statistical analyses start with a “prior belief” about the true population parameter and update the “prior” with additional or new data. Although it is slightly greater than most estimates of detection rates for illegal wildlife take or wildlife crime in general, we assumed a prior detection rate of 5% for this analysis. This prior is represented by a (5, 95) distribution, reflecting the belief that few violations are detected by others, including law enforcement (in this case, 5% of events are believed to be detected). The Beta distribution was chosen for its flexibility and intuitive interpretation of binomially distributed processes, such as the detection of illegal acts. Because the true detection rate is unknown, parameters 5% and 95% suggest a moderate level of prior certainty regarding detectability because they are relatively consistent with the results of the small body of research estimating the actual dark figure of illegal take events.
Six independent studies on illegal take detection rates were identified and used to update the prior data (Table 29). These studies reported detection rates of 1.1, 1.2, 2.2, 2.9, 3.1, and 4.2%, respectively. Each study was modeled as a pseudo-binomial observation with 100 trials, reflecting a low base rate and variance in detection events. These empirical values form the basis of an initial likelihood update. Updating the conservative prior with these empirical data yielded a posterior (post-analysis) detection rate of approximately 2.5%, with a 95% credible interval of 1.7%–3.3%. This means that, based on the data used in the analysis, there is a 95% chance that the true value of the detection parameter falls between 1.7% and 3.3%.
To further refine the estimate, a second update incorporated data from 28 radio-telemetry studies (Table 30) and wildlife citation records (Table 31) across the eight subject states. Telemetry studies indicated that approximately 3.3% of collared animals were illegally taken. Table 31 summarizes the key metrics from the eight states used in the model, including citations per 1,000 hunters, officers per 1,000 square miles, and the resulting empirical detection rates. When compared to citations issued for illegal take, scaled by the estimated number of violations implied by hunter populations, the resulting effective detection rate from enforcement sources was approximately 1.46%. Incorporating this enforcement-based data into the model further refined the posterior, narrowing the uncertainty and slightly increasing the mean detection estimate (Figure 3).
After both updates, the posterior distribution yielded a mean detection rate of 3.5% with a 95% credible interval of 2.7%–4.3%. Figure 3 illustrates the prior, posterior (after empirical studies), and
final posterior distributions that incorporate enforcement data. This analysis suggests that the actual likelihood of detecting illegal take incidents is very low, even in areas with a greater law enforcement presence per square mile. These results align with both field experience and the available literature, reinforcing the need for enhanced monitoring strategies and more proactive deterrence measures.
Prior (β(5, 95))
Posterior after Empirical Studies
Posterior + Enforcement Data
Detection Probability
Figure 3. Posterior probability distributions of detection rate estimates for the illegal take of wildlife using a conservative prior (5%), empirical updates, and enforcement data.
Table 31. Key metrics for estimating detection rates of illegal take by state.
Table 31. Key metrics for estimating detection rates of illegal take by state.
Self-Report and Stakeholder Perceptions – A Conservative Bayesian Model
We investigated the impact of alternative data sources on the sensitivity of the Bayesian estimates. Employing the same conservative (5, 95) prior and empirical updates, we examined two extensions. Self-reported survey data from known violators indicated that 73% of their infractions went undetected, and 85.7% involved both detected and undetected illegal take events. This suggests a detection rate of approximately 13%, which we incorporated as a binomial likelihood of 13 out of 100 trials in conservative Alternate Model A A. The resulting posterior produced a mean detection rate of 4.5%, with a 95% credible interval ranging from 3.7% to 5.3% (Figure 4).
Stakeholder perceptions gathered from surveys of hunters, landowners, and officers suggested that detection rates could be as high as 25%. This belief was used to construct a conservative Alternate Model B using an alternative prior of (5, 15), which reflects a 25% detection rate. This prior was updated using the same six empirical studies. The resulting posterior yielded a mean detection rate of 5.0%, with a 95% credible interval of 4.2%–5.8%.
Figure 4. Alternate Bayesian models incorporating self-reports and stakeholder perception survey data using a conservative prior (5%).
Detection Rates for Illegal Take - A Liberal Bayesian Model
In comparison with previous conservative models, we developed a Bayesian model using a liberal prior. Given that illegal wildlife take is conceptually akin to property crimes such as larceny (i.e., theft of a public resource), we chose the 2024 NCVS reporting rate for larceny (24.8%) as the liberal prior. This prior was modeled with a (25, 75) distribution to reflect moderate confidence and allow for flexibility in updating with new data. We updated this detection rate using the same six empirical detection studies, which produced a mean detection rate of 6.0% with a 95% credible interval of 4.0%–8.0%.
To further refine this estimate, we incorporated empirical enforcement data from the 8 subject states (Table 31). These values were combined with those from independent telemetry studies, which indicated that 3.3% of all studied animals were taken illegally (Johnson et al., 2020). The telemetry-based illegal take rate was applied to the population of licensed hunters to estimate the expected number of illegal acts per state. We calculated an average detection rate of 1.46% by comparing this estimate with the actual citation counts.
This enforcement-based detection rate was incorporated as an additional likelihood update for the previous posterior probability. The final posterior from this process revealed a mean detection rate
of 3.5% with a 95% credible interval between 2.3% and 4.7% (Figure 5). A higher initial prior resulted in a slightly elevated estimate, despite the influence of low detection evidence.
Prior (β(25, 75))
Posterior after Empirical Studies
Posterior + Enforcement Data
Detection Probability
Figure 5. Posterior probability distributions of detection rate estimates for the illegal take of wildlife using a liberal prior (24.8%) with empirical and enforcement data.
Self-Report and Stakeholder Perceptions – A Liberal Bayesian Model
To assess the potential impact of alternative data sources, we developed two additional Bayesian models using liberal priors. The first model integrates self-reported survey data as a likelihood update, whereas the second model uses stakeholder perception estimates as an informative prior. In liberal Alternate Model A, 73% of respondents reported that their illegal activities went undetected, and 85.7% admitted to both detected and undetected offenses, suggesting a detection rate of approximately 13%. Incorporating this evidence increased the posterior mean detection rate to 4.5%, with a 95% credible interval of 3.7%–5.3% (Figure 6).
In liberal Alternate Model B, stakeholder perceptions from hunters, landowners, and officers indicated that they believed the detection rate to be close to 50% and reporting near 45%, resulting in an implied detection rate of approximately 23–27%. We modeled this belief as a (5, 15) prior, which reflects approximately one-third of the cases being detected. However, when updated with the same empirical detection studies used previously, the posterior mean detection rate increased
to 5.0%, with a 95% credible interval between 4.2% and 5.8%. These two models demonstrate the value of integrating empirical, perceptual, and self-reported data. Figure 6 compares the final posterior distributions of the original and alternate models, underscoring the influence of different data types on the resulting estimates.
Figure 6. Alternate Bayesian models incorporated self-reports and stakeholder perceptions with a liberal prior (24.8%).
These analyses highlight the importance of integrating various data sources, such as self-report studies, field citations, expert stakeholder perceptions, and independent telemetry, to derive a robust and credible estimate of wildlife crime detection. The low detection rate (~5%) underscores the challenges of enforcement and the need for improved monitoring and deterrence strategies in wildlife protection efforts.
Table 32 summarizes the updated mean detection rates and the lower and upper bounds of the 95% credible interval for the estimates from each Bayesian model. The conservative model updated with only empirical data from the literature produced the lowest estimate of a mean detection rate of 2.5% of illegal take cases. The highest rate of 6.0% of cases detected resulted from the model that began with a detection rate of 25% and incorporated the empirical study only.
Table 32. Comparison of liberal and conservative Bayesian models for illegal take of big game.
Because it is impossible to know the true nationwide detection rate, perhaps taking an average of these 8 different updated models is the best approach to producing a more accurate estimate. As shown in Table 32, the mean estimated detection rate was 4.3% (dark figure=95.7%), with a 95% credible interval of 3.3% to 5.3%. Based on this information, we expect the true detection rate to be approximately 4.3%, with a 95% chance that the true value is between 3.3% and 5.3%. We chose to use the higher end of the credible interval for estimates of conservation impacts and will therefore use a 5% benchmark for the detection rate (95% dark figure) when calculating financial impacts.
Chapter 6: Conservation Impacts of the Illegal Take of Big Game
Unlike many government agencies, most state fish and wildlife agencies are directly dependent on their customers. These customers voluntarily purchase licenses and permits that allow the bearer to pursue and take wildlife within established frameworks and parameters. The illegal taking of big game can degrade the quality of the hunting experience by reducing the quantity and quality of individuals, creating barriers to land access, or from negative public acceptance. When this happens, customers may participate at a reduced rate or choose not to participate at all.
While the opportunity cost associated with the loss of customers is difficult to quantify, we can assess the “conservation costs” associated with undetected illegal take by calculating the fiscal impacts created by the loss of penalties and replacement costs for undetected cases at both the state and national levels. Furthermore, we can use the average per-state fiscal cost associated with undetected poaching incidents to compare those impacts with fiscal benchmarks such as Wildlife Restoration apportionments from excise taxes, gross revenue from license and permit sales, and annual operating budgets for each of the 50 states’ fish and wildlife agencies.
Objectives
1. To calculate the direct financial costs of undetected illegal take of big game at both the state and national levels.
2. To update and apply replacement cost data for big game species in estimating poachingrelated fiscal losses.
3. To compare conservation losses with benchmarks, including Wildlife Restoration apportionments, gross license and permit revenues, and state agency operating budgets.
4. To highlight the potential consequences of sustained under-detection and underenforcement of wildlife conservation programs and funding.
Methods
To determine the conservation impacts of the illegal take of big game, we used the estimated undetected rate calculated in Chapter 5 to develop the potential financial losses at both the state and national levels To improve the accuracy of this calculation, we first updated and expanded the replacement cost data from Edwards (2017) to reflect the current levels for the duration of this project. We then used the undetected rate figure in conjunction with the citation rates during the 5year study period to develop an estimate of the number of big game individuals, by species, lost annually to poaching for each year of the study for the subject states. The number of individuals lost per subject state was multiplied by the updated minimum fines and replacement costs across all 50 states for the illegal take of big game to create both per-state and national-level estimates of conservation costs. Finally, we collected 2023 Wildlife Restoration apportionments, 2023 gross license and permit revenues, and 2022 operating budgets for all 50 fish and wildlife agencies. We compared the average agency losses due to the undetected illegal take of big game to the entire
2023 apportionment and 2023 license revenues, as well as 25% of the 2022 annual operating budget for each agency.
Results
In the previous Poach & Pay study, Edwards (2017) provided replacement costs for certain species by state. We updated the information from that study to include the range of replacement costs for big game species across all 50 states (Table 33). Depending on the species and trophy status, replacement costs ranged from a minimum of $250 to a maximum of $30,000 per animal. However, agencies or prosecutors do not always seek replacement costs, nor do courts always award them, even if the defendant is convicted.
Table 33. Nominal (Minimum, Maximum, and Range) replacement costs for big game individuals illegally taken in the U.S. for 2024-25.
Species Min. (NonTrophy) or Nominal Cost Max. (Trophy) Cost Min. (NonTrophy) or Nominal Range
White-tailed Deer
$2,171
(Trophy) Range
Coues White-tailed Deer
Columbia Black-tailed Deer
Sitka Black-tailed Deer
Wolf
Bison
Muskox
Mountain Lion
$1,000
$2,000
$2,500 - $500-$7,500 -
$4,000 - $500-$7,500 -
$10,000
$2,096 - $250-$7,500Caribou
Mountain Goat
Bighorn Sheep
Grizzly Bear
Pronghorn
Wild Turkey
Black Bear
$3,667 - $1,000-$5,000 -
$4,393 - $250-$10,000 -
$7,464 - $250-$12,000
$8,500 - $2,000-$12,000 -
$923 - $250-$3,000 -
$511 - $25-$2,000 -
$2,171 $3,264 $250-$10,000 $500-$30,000
Assuming a 100% conviction rate and using official citation data from each of the subject states and minimum fines and replacement costs for illegal take of big game from all 50 states allows us to develop a per-state average and a national-level estimate of conservation losses due to the
illegal take of big game. The estimates shown in Table 34 were developed for the illegal take of big game in the U.S. at various detection levels, while Table 35 shows the per-state average loss of fines and replacement costs.
Table 34. Average annual U.S. losses (based on the national average of minimum replacement costs), from loss of fines and replacement costs for illegal take of big game at varying detection levels.
Table
Table 35. Average annual losses per state (based on the national average of minimum replacement costs), from loss of fines and replacement costs for illegal take of big game at varying detection levels.
&
$12,088,976
Discussion
Conservation costs include direct costs in license and permit revenue, as well as fines and replacement costs for animals lost to poaching, but also broader indirect losses to conservation funding (via Pittman-Robertson and Dingell-Johnson Acts) and reduced public trust. Using the minimum fines and replacement costs from each of the subject states and assuming a 100% detection and conviction rate, we found that a minimum of $318.5 million in fines and $1.19 billion in animal replacement costs would have been assessed annually, which is more than $1.5 billion nationwide each year (Table 34) for all big game species taken illegally each year. When the average conservation cost was assessed on a per-state basis, we found that it resulted in more than $30.2 million (almost $6.4 million in fines and more than $23 8 million in replacement costs) for each state annually (Table 35).
Unfortunately, given the low detection rates, a large percentage of these figures are never assessed. If 5% of illegal take cases are detected (95% dark figure), and using the subject state averages, there are minimum nationwide losses of approximately $302.6 million in fines and about $1.13 billion in replacement costs each year. This is a total minimum annual loss of approximately $1.44 billion for the U.S. (Table 34). The same analysis at the state level yielded $28.7 million in conservation costs ($6.1 million in fines and $22.7 million in replacement costs) for each state (Table 35). Even if 30% (70% dark figure) of all illegal take cases were detected, the minimum conservation cost nationwide would still exceed $1 billion annually (Table 34).
It should also be noted that financial losses often vary among states because some states have more opportunities for illegal take than others, as they have more big game species and/or larger populations of these animals. They may also have more suitable opportunities or targets; therefore, there are likely more instances of illegal take. Additionally, the minimum financial penalties for offenders vary by state, and these estimates assume that every illegal take case detected by law enforcement goes through the legal process via pre-payable citations or court appearances (including possible trials), and the outcome of each case requires the offender to pay the minimum fine and applicable replacement costs.
Table 36 examines the 2023 Wildlife Restoration final apportionment and gross revenue from hunting license sales for each state and shows comparisons of these items with the $28.7 million estimated loss of minimum fines and replacement costs at a benchmark 5% detection rate. The average financial loss from illegal take exceeds the 2023 Wildlife Restoration final apportionment for 68% (n=34) of states, as well as the 2023 gross revenue from hunting license sales in 39 (78%) states. In fact, the total calculated conservation cost for the U.S. resulting from the undetected levels of illegal take of big game was more than the 2023 Wildlife Restoration apportionment ($1.185 billion – USFWS, 2025) for all 50 states combined. It is also greater than the total gross revenue from 2023 hunting license sales in the U.S. ($1.015 billion – USFWS, 2025).
Table 36. Wildlife restoration (PR) final apportionments, agency gross hunting license revenue, and agency operating budgets for 2023.*
State
Alabama1,2
Alaska2
Arizona2
Arkansas1,2
California2
Colorado
Connecticut1,2
Delaware1,2
Florida1,2
Georgia2
Hawaii1,2
Idaho1
Illinois1
Indiana1,2
Iowa1,2
Kansas1,2
Kentucky1,2
Louisiana1,2
Maine1,2
2023 Wildlife Restoration Final Apportionment
$27,516,700
$50,459,945
$34,157,164
$19,618,116
$38,858,021
$32,311,971
$8,623,104
$7,176,940
$22,095,534
$37,853,359
$7,176,940
$23,508,743
$23,822,949
$20,304,328
$17,101,181
$22,012,811
$19,980,030
$24,725,389
$13,261,862
2023 Gross RevenueHunting License Sales
$22,940,214
$7,633,211
$20,804,661
$20,039,798
$24,111,812
$76,975,492
$2,194,750
$1,529,047
$7,960,732
$20,684,035
$461,034
$42,924,873
$32,422,324
$12,624,299
$22,462,897
$23,827,799
$22,838,357
$9,796,247
$8,192,139
Table 36. Wildlife restoration (PR) final apportionments, agency gross hunting license revenue, and agency operating budgets for 2023.*
State
Maryland1,2
Massachusetts1,2
Michigan
Minnesota
Mississippi1,2
Missouri2
Montana
Nebraska1,2
Nevada1,2
New Hampshire1,2
New Jersey1,2
New Mexico1,2
New York2
North Carolina2
North Dakota1,2
Ohio1,2
Oklahoma2
Oregon1
Pennsylvania
Rhode Island1,2
South Carolina1,2
South Dakota1,2
Tennessee2
Texas
Utah1,2
Vermont1,2
Virginia1,2
Washington1,2
West Virginia1,2
Wisconsin
Wyoming1
2023 Wildlife Restoration Final Apportionment
$11,426,411
$11,912,373
$34,693,714
$34,417,169
$17,615,555
$31,471,310
$31,070,517
$19,271,867
$22,035,616
$7,176,940
$11,912,373
$24,665,787
2023 Gross RevenueHunting License Sales
$6,337,975
$2,595,473
$37,140,936
$34,064,196
$13,905,264
$26,175,734
$38,533,736
$16,080,559
$7,635,261
$5,064,873
$8,225,334
$19,909,954
$30,531,864 $23,607,124
$33,642,043 $13,165,178
$17,279,717
$12,354,470
$23,565,318 $27,150,761
$28,923,699
$28,513,417
$41,067,392
$13,129,752
$30,371,898
$42,569,391
$7,176,940 $509,799
$16,328,594
$19,847,483
$34,184,309
$10,167,611
$20,853,694
$28,461,780
$55,195,378 $49,035,615
$22,766,741 $21,142,034
$7,176,940
$20,474,229
$4,602,611
$22,681,542
$22,615,536 $19,069,821
$13,177,495
$33,751,346
$8,933,132
$35,839,773
$20,968,464 $35,230,187
Total $1,185,421,624 $1,014,969,189
* 2023 Wildlife Apportionment data do not include the portions for Hunter Education (Section 4) or Enhanced Hunter Education (Section 10). Apportionment and Gross License Revenue are for state wildlife agencies only –possessions and territories have been omitted.
1 Average annual loss at the 5% detection level and minimum fines and replacement costs exceeds 2023 final Wildlife Restoration apportionment.
2 Average annual loss at the 5% detection level and minimum fines and replacement costs exceeds 2023 gross revenue from hunting license sales
The conservation impacts of illegal take of big game in the U.S. are immense. When financial losses are extrapolated using the average minimum fines and replacement costs nationwide, the figures are staggering. To emphasize, if 95% of illegal take incidents go undetected, the total minimum financial loss amounts to approximately $1.435 billion annually across the nation. This figure surpasses the combined total of $1.185 billion from the 2023 Wildlife Restoration apportionment for all 50 states and the $1.01 billion in total gross revenue from 2023 hunting license sales in the U.S. On average, each state faces a loss of $28.7 million. Even if the detection rate for illegal take incidents increases to 30% (leaving a 70% dark figure), the minimum annual loss nationwide still exceeds $1 billion. Furthermore, the average loss of $28.7 million per state at a 5% detection rate is greater than the 2023 Wildlife Restoration final apportionment for more than two-thirds of the states. It also exceeds the 2023 gross revenue from hunting license sales for more than threequarters of the states. To mitigate the conservation impact of the illegal take of big game, it is crucial to implement solutions that enhance both deterrence and detection.
THIS PAGE INTENTIONALLY LEFT BLANK.
Chapter 7: Detecting and Deterring the Illegal Take of Big Game
Theoretical principles that have received support through repeated testing can be very useful in developing applied solutions for various real-world matters. Theoretical frameworks provide pathways for creating effective practices and interventions, even for complex problems such as crime and deviant behavior. Testing criminological theories and evaluating interventions based on the tenets of the theories should be a dynamic and cyclical process that can help generate new knowledge and constantly evolving solutions and theoretical concepts that are constructed on evidence-based practices.
Some behavioral theories are very specific and more applicable to some typologies than others. For example, social learning theory posits, in part, that criminal behavior is learned through associations with others who commit and model the act (Akers, 1973). This theory may be more applicable to tradition or protest poachers than to some of the other typologies described in this report. However, three general criminological viewpoints could be relevant in developing policies and practices to address rational individuals who illegally take big game regardless of their motivations. These theories include General Deterrence Theory (GDT), Routine Activities Theory (RAT), and techniques of neutralization. The components of these theoretical perspectives complement one another and may help develop a better understanding of the attitudes and mindsets of poachers.
Objectives
1. To apply established criminological theories to explain the behavioral and situational dynamics of wildlife offenders.
2. To identify the most effective detection and deterrence strategies based on conservation officer, hunter, landowner, and offender perspectives.
3. To evaluate stakeholder perceptions of the relative effectiveness of detection tools and enforcement resources.
4. To formulate integrated, theory-driven recommendations for reducing illegal take through improved surveillance, public awareness, and law enforcement strategies.
Methods
The information presented in this chapter was developed based on data from a comprehensive literature review and analysis of studies on wildlife crime, as well as other “victimless” crimes, along with an assessment of elements of criminological and behavioral theories that may be used to explain the mentalities of some poachers. This information can help predict when instances of illegal take are most likely to occur. The theoretical integration presented in this chapter is supplemented with statements from poacher interviews conducted as part of this study (Chapter 3) and the surveys of conservation officers, hunters, and landowners described in Chapter 2.
General Deterrence Theory
GDT is based on the rational choice perspective of behavior, which maintains that individuals commit crimes when the rewards outweigh the costs of their actions (Pratt et al., 2006). In short, the GDT suggests that rational humans will weigh the benefits of their actions against the certainty, severity, and celerity (swiftness) of punishment(s) for those actions (Figure 7).
Figure 7. General Deterrence Theory posits that criminals weigh collective risks against collective rewards before deciding to commit a crime.
GDT has led to crime prevention strategies, such as harsher criminal sentences (punishment severity), although research has shown that informal social costs (e.g., loss of respect in the community or professional world) may be as important as legally imposed punishments (Grasmick et al., 1993; Nagin & Paternoster, 1993; Sherman, 1993). However, research on a variety of offenses has revealed that the certainty of punishment is a much more important consideration than the severity or celerity of punishment, and that offenders consider the probability of apprehension rather than the certainty of punishment (Nagin, 2013). Some states have poaching statutes that require mandatory restitution for trophy animals (Eliason, 2012a). However, the literature suggests that even large financial penalties or prison sentences are secondary considerations if potential poachers are primarily concerned about the risk of getting caught.
Detecting poaching and apprehending poachers is more difficult than detecting many other crimes because of the nature of the crime itself. In some cases, the types of devices intended to prevent crimes, such as fences and locked gates, may serve to reduce the risk of detection and poacher
apprehension because wildlife law enforcement agents and other potential witnesses do not have easy access. Scholars have consistently recommended that the best approach to decreasing illegal wildlife take and other wildlife crimes involves decreasing motivation through the first element of GDT by increasing the likelihood of apprehension. Although this requires additional resources for a larger workforce, the highest-rated suggestion for accomplishing this task is the increased visibility of wildlife law enforcement officials. Studies have shown that poachers are often familiar with hunting rules and penalties but only follow laws when enforcement officers are present or nearby (Jacoby, 2014). Research has indicated that a strong law enforcement presence through visible routines and anti-poaching patrols is extremely important in increasing perceptions of risk through the certainty of being apprehended. In addition to patrols, targeted enforcement strategies, such as stings and covert operations using animal decoys and other technologies during peak times, places, and routes used for poaching, are also recommended to increase law enforcement visibility (Crow et al., 2013; Eliason, 2012b; Eliason & Dodder, 1999; Filteau, 2012; Green et al., 1988; Haines et al., 2016; Kahler & Gore, 2012; Kamminga et al., 2018; Kurland et al., 2017; Mayer et al., 2013; Meshe & Haines, 2019; Nelson & Verbyla, 1984; Skidmore, 2021).
Routine Activities Theory and Deterrence
According to the RAT approach (Cohen & Felson, 1979), three basic, commonsense elements are present when most crimes or violations occur. According to Crow et al. (2013) and Eliason (2012b), regardless of poacher typology, RAT requires that three circumstances must be satisfied:
1. A motivated offender.
2. A suitable target.
3. Absence of capable guardianship.
The motivation for poaching may be premeditated or planned, which is often the case with Trophy Poachers. For others, such as Recreational Poachers, the motivation may only come when the opportunity presents itself. That is, some poachers may not plan to poach before “the hunt,” but make the decision to do so when they are given the opportunity. Opportunity is imperative regarding the illegal take of wildlife because it constitutes the second element of RAT for poachers: whether someone is poaching for subsistence or for the challenge, if there is no suitable target in terms of an animal to be taken, there is no opportunity to commit the crime. The final element of RAT, the lack of capable guardianship, refers to someone or something that prevents crime by protecting the target. Guardianship could come in the form of a person who is able to stop the poacher from committing the act or from other types of disincentives (e.g., trail cameras) that could prevent the offense because the poacher becomes concerned about getting caught and the potential consequences if they are apprehended. However, if the poacher is motivated, there is a suitable target, and there is a lack of guardianship, the crime is likely to occur. The guardianship element of RAT can be closely tied to GDT because the lack of some form of guardianship reduces the risks associated with illegal take. If there is no capable guardianship (e.g., conservation officers, other potential witnesses, or technology such as trail or other surveillance cameras) in the
area, potential offenders will have a low perceived certainty of detection. Without detection, concerns about the severity and celerity of official punishments are alleviated (Figure 8).
Unfortunately, it is widely acknowledged among hunters that wildlife crimes are difficult to detect, partially because of the setting in which they often occur rural areas that are sometimes isolated and difficult to access, with few potential witnesses to report the events. Under these circumstances, it is rare for illegal take to be directly observed by conservation officers or others (Eliason, 2008; Falcone, 2004; Forsyth, 1993, 2008; Forsyth & Marckese, 1993a; Knapp, 2012; Wyatt, 2013). Although the perceived risk of detection is already low for most potential poachers, some may reduce it further through increased efforts to conceal themselves or by offending during times (e.g., after dark) when there are fewer witnesses (Green et al., 1988). When the benefits of illegal take outweigh the risk of being detected for a motivated offender and there is a suitable target (the animal), a poaching event is likely to take place (Figure 8).
All convicted poachers interviewed as part of this project perceived a very low certainty of being detected. Even after going through the court process, most were not very concerned with the fines or restitution assessed for their cases (note: there were no trophy animals involved for any of the poachers in this sample). As a group, the poachers were most concerned about having their hunting licenses suspended. The four individuals in the sample who had to forfeit their weapons and one all-terrain vehicle used during their illegal take incidents were much more agitated by the forfeitures than any other part of their penalties, probably because those items were significantly more expensive than the fines and restitution they faced. However, none of them thought about the severity or celerity of penalties during the offenses because they did not think they would be caught. In addition, even though each interview participant admitted that he knew he was breaking
Figure 8. Decision-tree for determining whether to commit a crime based on Routine Activities and General Deterrence Theories.
the law at the time of the offense, some continued to justify or rationalize their actions through techniques of neutralization.
Techniques of Neutralization
Individuals who engage in the illegal take of wildlife often employ psychological strategies known as techniques of neutralization to rationalize their actions and mitigate feelings of guilt or wrongdoing. Originally developed within criminological theory, neutralization techniques help offenders justify deviant behavior by reframing it to minimize personal responsibility, downplay the harm caused, or shift blame onto others. In the context of wildlife crime, these cognitive justifications are critical to understanding offender behavior, as they reveal how individuals navigate the moral conflict between societal norms and illegal actions. Several commonly observed techniques denial of responsibility, denial of the victim, denial of injury, appeal to higher loyalties, and condemnation of the condemners may offer valuable insights into the mindset of those who violate wildlife laws (Sykes & Matza, 1957).
Denial of Responsibility
Denial of responsibility occurs when offenders blame others for their acts or claim that their actions were accidental or beyond their control (Eliason, 2003a; Eliason & Dodder, 1999). Some violators, such as subsistence poachers, may attribute their actions to social conditions (e.g., poverty) and justify their actions based on necessity, such as the need for meat (Eliason, 2003a; Eliason & Dodder, 1999; Scialfa, 1992). One convicted poacher interviewed as part of this study insisted that although he was aware of what was about to happen, he was not responsible for the act because he was only driving the vehicle, which he stopped and allowed the passenger to illegally shoot a buck mule deer [decoy] from the roadway and after legal shooting hours. Another interviewee said that he was legally glassing and spotting animals for his friend who illegally took a mule deer.
Denial of the Victim and Denial of Injury
Denial of the victim occurs when offenders argue that the victim either deserved the harm or that no true victim exists. In the case of wildlife crimes, individuals may claim that animals are not sentient beings capable of victimization or that government agencies, not individual citizens, are the real “owners” of wildlife, thus minimizing perceived harm. This technique allows offenders to frame their actions as justified retaliation or inconsequential.
Similarly, poachers may downplay their actions through denial of injury, portray themselves as victims, or argue that their actions are victimless crimes because they do not harm anyone (Eliason, 2003a; von Essen et al., 2014; Wagner et al., 2019). However, this is a classic example of “The Tragedy of the Commons,” which describes a situation in which individuals act independently and rationally according to their self-interest, ultimately depleting a shared resource, even though this outcome is detrimental to everyone involved. The parable, first articulated by Hardin (1968), illustrates how unrestricted access to common resources leads individuals to maximize personal
gain without regard for sustainability. As everyone seeks personal benefits, the resource becomes overused and eventually collapses, harming the entire community.
Six of the poachers interviewed for this report (convicted of illegally taking white-tailed deer, mule deer, or elk) expressed some denial of the injury. All participants said they typically followed all the laws but made slight exceptions at the time of their offenses. The exceptions included hunting after legal hours, shooting from the road, wrong-sex tags, hunting out of season (one day after), and taking from the wrong hunting zone. Each interviewee justified his actions by making statements such as, “I didn’t hurt anything,” “there’s plenty of deer on that public land,” “I didn’t take anything away from anybody else,” “it’s not like I took a trophy buck,” “the season should’ve been longer anyway,” and “I needed that meat as much as anyone else.”
Appeal to Higher Loyalties and Condemnation of Condemners
Some offenders justify their illegal actions by claiming allegiance to a higher moral code that supersedes the law. In wildlife crimes, this often takes the form of loyalty to family traditions, community expectations, or subsistence needs of the poachers. Offenders may argue that their obligations to provide for their families, maintain cultural practices, or uphold local customs justify actions that would otherwise be considered illegal.
Condemnation of the condemners is another technique of neutralization in which offenders, such as Protest and Challenge Poachers, believe that laws and government officials are unjust, so they feel entitled to break the law. Protest Poachers may also claim to have acted in the best interests of others, such as family members or others in their social groups, because such an appeal to higher loyalties is more important to them than societal laws (Eliason, 1999, 2003a; Eliason & Dodder, 1999; Forsyth & Marckese, 1993a; Scialfa, 1992).
During an interview for this project, a poacher convicted of illegally taking a white-tailed deer explained that he did everything legally except for missing the telecheck deadline. He stated that he recovered his animal shortly before dark, but the hunting camp was more than a mile from any cellular service. Meanwhile, there were small children at the camp, and bad storms and tornadoes quickly moved into the area. According to him, everyone from the camp immediately took shelter in a cave for the entire night, and a conservation officer was with the animal at the camp when they returned the next morning. He thought he would be given some leniency because of the circumstances, but he was cited and convicted despite his expectations. When asked if he would continue to hunt, he replied that he would continue to hunt without regard to licenses or laws. This participant expressed extreme condemnation of the condemners, but unlike some poachers who had this mentality without ever having been detected by officials, he developed this outlook after feeling that he was wronged by both the officer and the courts.
Practical Implications
The theoretical frameworks discussed above are logical and facilitate a more complete understanding of a variety of criminal behaviors, including the illegal take of big game. Additionally, recommendations from responses to items on the surveys of conservation officers, hunters, and
landowners were congruent with the overall theoretical model presented. For example, three items on the conservation officer survey asked them to rank 9 items from most effective (1) to least effective (9) to increase detection, reporting, and apprehension for illegal take incidents. Responses were reverse-coded (e.g., 1 was recoded to 9, 2 was recoded to 8) during data analysis so that larger numbers represented greater perceived effectiveness. The recoded means for these rankings are presented in Table 37
Officers ranked law enforcement manpower as the most effective factor for increasing detection and apprehension and the third most effective factor for increasing reporting. Having a tip or anonymous poaching hotline was ranked as the second most effective category for all three stages of illegal take cases. Officers thought that rewards or financial incentives were the most important for reporting and third for both detection and apprehension. Public education campaigns were the fourth most effective factor for reporting, fifth for detection, and eighth for apprehension. Covert or undercover operations were the fourth most effective for detection and apprehension and sixth most effective for reporting. Task force operations directed at a specific individual, area, or event was the fifth most effective for reporting and apprehension, and sixth for detection. On average, surveillance cameras were ranked as the sixth most effective factor for apprehension, seventh for detection, and eighth for reporting. Searches of Internet/social media/online marketplaces averaged the seventh most effective for reporting and apprehension and eighth for detection. Rankings of the Interstate Wildlife Violator Compact indicate that it is the least important factor for detection, reporting, and apprehension.
Overall, the rank averages for detection, reporting, and citation rates indicated that officers considered law enforcement manpower, anonymous poaching hotlines, rewards or financial incentives, public education campaigns, and covert or undercover operations to be the most important. Each of these factors could help increase the perceived risk of detection. Additional public education campaigns concerning the illegal take of big game could increase reporting by witnesses who were previously unaware of the seriousness of illegal take and potentially reduce the use of neutralization techniques by individuals who learn about the importance of conservation and that poaching is not a “victimless” crime.
Table 37. Factors ranked by Conservation Officers (n=1,019) from least effective (1) to most effective (9) that they indicate have significant potential to increase illegal take discovery rates.
Table 37. Factors ranked by Conservation Officers (n=1,019) from least effective (1) to most effective (9) that they indicate have significant potential to increase illegal take discovery rates.
Task Force operations directed at a specific individual, area, or event.
Similarly, hunters and landowners were asked about the incentives and actions they believed would improve the detection, reporting, and resolution of illegal take in their state of residence (Table 38). Unlike conservation officers, these stakeholders were not asked about detection, reporting, and resolution separately; they were asked to consider all outcomes collectively when ranking the options. Taken together, they ranked poaching hotlines to turn in illegal take of wildlife as the most important factor. The increased presence of law enforcement, monetary incentives, and non-monetary incentives were the next most important factors. They ranked covert antipoaching units and Internet searches for poaching activities as the least important. Again, the actions they considered most important could increase the perceived risk of detection for potential poachers.
Table 38. Support for possible incentives or actions taken to improve the detection of the illegal take of wildlife in the respondent’s state of residence. (Hunters: n=13,675; Landowners: n=4,003).
Discussion
Greater officer manpower and poaching tip hotlines may serve as agency strategies to reduce the instances of illegal take for all types of poachers discussed in this study (Figure 9). Rewards or incentives for those who report illegal take may be effective at reducing the rates of most types of poaching, but might be less effective for subsistence, backdoor, and protective poachers. Public education campaigns will be most effective in decreasing the rates of recreational and protective poaching, while covert operations and Internet/social media searches will probably not be effective in reducing the rates of subsistence, backdoor, or protective poaching. The use of technology (e.g., decoys, drones, and surveillance cameras) could reduce all types of poaching but is likely to be less effective for subsistence, backdoor, protective, and protest poaching. Overall, it appears that subsistence, backdoor, and protective poaching rates are the most difficult to reduce, primarily because of the location where the illegal take occurs on property owned by the poachers or nearby property with which they are familiar.
Figure 9. Relative Effectiveness of Agency Methodologies for Reducing the Rates of Illegal Take of Wildlife by Poacher Typology.
Method to Increase Detection
Incentives
Covert Operations
Use of Tech (Decoys/Drones, Surveillance Cameras,
Social Media/Internet Searches
Figure 9. Relative Effectiveness of Agency Methodologies for Reducing the Rates of Illegal Take of Wildlife by Poacher Typology.
Figure 10 presents data on the relative effectiveness of various deterrent factors for each poacher typology discussed in this study. Generally, existing fines and penalties are not highly effective deterrents for any poacher type, though they might be more impactful for subsistence and backdoor poachers than for others. Similarly, the current replacement costs for animals may deter all poacher types except protective poachers, with the greatest effect on subsistence and backdoor poachers. The threat of incarceration is particularly significant for deterring subsistence, backdoor, and recreational poachers. However, elevating certain illegal activities from misdemeanors to felonies, which may involve mandatory minimum sentences, could deter all poachers. License suspensions might deter all poachers except thrill-kill poachers. However, it is important to note that suspensions in a single state are less likely to deter trophy or commercial poachers, as they often have the means to relocate to other states. Similarly, license suspensions across multiple states are less effective for subsistence and backdoor poachers, who typically engage in illegal activities close to their homes. Public perception and offender shaming may deter all poacher types, but are less effective for subsistence, backdoor, and protective poachers. Community service sentences may or may not deter all typologies from poaching. The confiscation or forfeiture of equipment can be a strong deterrent for all poacher types, although trophy and commercial poachers are less likely to be deterred, as they often have the resources to replace lost equipment. The use of technology, such as decoys, drones, and surveillance cameras, can deter all poacher types, as awareness of such technology increases the perceived risk of detection. However, these methods may be less effective in deterring subsistence, backdoor, and protective poachers, who typically operate on their own property or in areas that are difficult for authorities to access without the poachers' knowledge.
Figure 10. Relative Effectiveness of Deterrents for Reducing the Rates of Illegal Take of Wildlife by Poacher Typology.
Deterrent Factor
Fines & Penalties
Replacement Costs
Incarceration
Degree of Seriousness (Felony/Misdemeanor)
License Suspension (1 State)
License Suspension (All States)
Public Perception (Offender Shaming)
Community Service
Confiscation of Equipment
Use of Tech (Decoys/Drones, Surveillance Cameras, etc.)
THIS PAGE INTENTIONALLY LEFT BLANK.
Chapter 8: Best Management Practices for Reducing the Illegal Take of Big Game
Based on the findings of this study, we propose a set of Best Management Practices organized into six categories: Reducing Illegal Take of Wildlife; Wildlife Crime, Policy, and Regulation; Prosecutorial Engagement in Wildlife Crime; Increasing Public Awareness in Wildlife Crime; Community and Stakeholder Engagement; and Operational Improvements in Wildlife Law Enforcement.
Key proposals include:
• Uniform restitution and penalty schedules based on ecological value and rarity.
• Simplification of statutes for the illegal take of big game.
• Assessment of license suspensions, equipment confiscation, and proportional restitution for all cases for illegal take of big game.
• Deployment of modern enforcement tools, such as surveillance and decoy operations.
• Prosecutorial/judicial training to elevate wildlife crimes to the level of comparable offenses.
• Improvement, modernization, and full implementation of the International Wildlife Violators Compact for poaching offenses.
BMP 1: Reducing the Illegal Take of Wildlife
Effective wildlife poaching reduction requires implementing strategic, evidence-based management practices that consider both offenders’ motivations and the structural weaknesses that allow violations to persist. The following Best Management Practices are derived from existing literature, established criminological theories, field surveys and interviews, and successful enforcement strategies across jurisdictions.
1.1 Integrate Offender Typologies into Enforcement Strategy
• BMP 1.1.1: Train officers and wildlife managers to recognize and classify offender types, keeping in mind that the typologies are not necessarily mutually exclusive (e.g., trophy, commercial, subsistence, backdoor, recreational, tradition/protest, challenge, and thrillkill poachers).
• BMP 1.1.2: Match enforcement and outreach strategies to offender motivation (e.g., education for traditional and recreational poachers and aggressive prosecution for trophy and commercial poachers).
• BMP 1.1.3: Implement adaptive management strategies that adjust interventions based on regional trends and evolving typologies.
1.2. Apply Principles of General Deterrence and Routine Activity Theories
• BMP 1.2.1: Increase the certainty of detection by enhancing officer presence, especially in high-poaching areas (“Boots on the Ground”).
• BMP 1.2.2: Capitalize on the “swiftness of punishment” factor by minimizing the lag between the offense and the consequence and prioritizing efficient legal processing when possible.
• BMP 1.2.3: Enforce severity judiciously, with a particular focus on license suspension, which some poachers report as the most concerning penalty.
• BMP 1.2.4: Reduce opportunities for crime by promoting community vigilance and guardianship (e.g., landowner coalitions and watch groups, emphasizing the importance of reporting events to authorities).
1.3. Target Neutralization Techniques with Public Education and Messaging
• BMP 1.3.1: Create outreach campaigns that dismantle common rationalizations (e.g., “It doesn’t hurt anyone”) by highlighting the biological, social, and ethical consequences of illegal take.
• BMP 1.3.2: Involve trusted messengers (e.g., community elders, veteran hunters, and local conservationists) to address appeals to higher loyalty and traditional practices that are inconsistent with existing laws and regulations.
• BMP 1.3.3: Publicize successful prosecutions to counteract condemnation of law enforcement and reinforce legitimacy based on potential consequences of illegal take of big game.
1.4. Deploy Technology to Enhance Detection
• BMP 1.4.1: Employ remote surveillance tools, including drones, trail cameras, and automated license plate readers, in high-violation areas when possible.
• BMP 1.4.2: Utilize decoys (e.g., robotic animals) to detect and apprehend opportunistic or habitual violators.
• BMP 1.4.3: Establish and promote anonymous Turn-In-a-Poacher (TIP) hotlines and digital reporting tools that allow witnesses to remain anonymous (or at least provide identity confidentiality).
1.5. Increase Legal and Social Costs of Violation
• BMP 1.5.1: Improve compliance with the Interstate Wildlife Violator Compact to ensure license suspensions across jurisdictions.
• BMP 1.5.2: Confiscate weapons, vehicles, and other equipment used in the commission of wildlife crimes, as poachers are often more concerned with the loss of equipment than with fines, replacement costs, or even incarceration.
• BMP 1.5.3: Pursue graduated penalties (e.g., misdemeanors for first offenses, felonies for repeat offenses) to increase accountability.
• BMP 1.5.4: Consider public “naming and shaming” tactics, where legally permissible, to reinforce social deterrents.
1.6. Foster Community-Based Prevention
• BMP 1.6.1: Partner with local communities, tribal entities, and non-governmental organizations to establish co-stewardship roles in monitoring and education.
• BMP 1.6.2: Encourage local ownership of conservation goals through reward programs, participatory monitoring, and shared benefits.
• BMP 1.6.3: Educate the public on the ecological and financial impacts of poaching to foster a conservation-minded community.
BMP 2: Wildlife Crime Policy and Regulation
Sound legal frameworks and regulatory practices are fundamental for deterring wildlife crimes and supporting effective prosecution. The following Best Management Practices are recommended for state and federal agencies to modernize wildlife crime statutes, promote consistency, and ensure that consequences are meaningful and enforceable.
2.1. Strengthen and Simplify Statutory Language
• BMP 2.1.1: Consolidate and simplify wildlife statutes by categorizing offenses into clear and easily prosecutable actions (e.g., 'illegal take of [species] with artificial light').
• BMP 2.1.2: To ensure that enforcement and prosecution are more straightforward, revise statutes to distinguish between actual illegal take and intent or attempt to illegally take.
• BMP 2.1.3: Consider using felony theft statutes for wildlife crimes in which the value of the animal exceeds the state’s felony threshold.
2.2. Implement Robust and Consistent Penalties
• BMP 2.2.1: Establish mandatory license suspensions for illegal take offenses through statutory authority.
• BMP 2.2.2: Elevate penalty levels appropriately (e.g., First Offense: Class A Misdemeanor; Second Offense: Class D Felony).
• BMP 2.2.3: Secure authorization for the confiscation of contraband and equipment used in the illegal take of big game.
2.3. Enhance the Interstate Wildlife Violator Compact
• BMP 2.3.1: Update and maintain the Interstate Wildlife Violator Compact database to ensure centralized, current, and accessible violation records for all official participants.
• BMP 2.3.2: Expand state participation and provide training for officers and courts on accessing and using Interstate Wildlife Violator Compact data.
• BMP 2.3.3: Ensure that license suspensions are enforced across jurisdictions by mandating participation in the Interstate Wildlife Violator Compact.
2.4.
Refine Replacement Cost Standards
• BMP 2.4.1: Develop scientifically defensible replacement costs that are consistent across states and reflect species rarity and ecological value in the jurisdiction.
• BMP 2.4.2: Use familiar public property analogies to communicate the gravity of wildlife theft to the courts and the public.
• BMP 2.4.3: Regularly review and update replacement values to reflect species populations and ecological conditions.
2.5. Promote Equitable Comparison to Non-Wildlife Crimes
• BMP 2.5.1: Align penalties for the illegal take of big game with comparable non-wildlife offenses (e.g., government property theft or Class A/B misdemeanors for first-time offenders).
• BMP 2.5.2: Advocate for penalty enhancements for repeat offenders and egregious violations.
• BMP 2.5.3: Emphasize the consequences, such as loss of equipment, license suspension, replacement costs, and social stigma.
BMP 3: Prosecutorial Engagement in Wildlife Crime
The effective prosecution of wildlife crimes is critical for deterring illegal activities and reducing recidivism. Prosecutors play a central role in ensuring that appropriate penalties are imposed and that individuals who illegally take big game are treated with the seriousness they warrant. The following Best Management Practices are designed to strengthen prosecutorial effectiveness, improve outcomes in court, and elevate the visibility of illegal take within the broader criminal justice system.
3.1. Improve Prosecutorial Awareness and Training
• BMP 3.1.1: Develop targeted education programs for prosecutors on the ecological, economic, and legal implications of the illegal take of big game.
• BMP 3.1.2: Provide pre-trial briefings or written summaries that clearly outline the seriousness and impact of the illegal take of big game, including impacts specific to each case.
• BMP 3.1.3: Incorporate wildlife crime scenarios into continuing legal education programs for district attorneys.
3.2. Strengthen Communication Between Conservation Officers and Prosecutors
• BMP 3.2.1: Provide in-house training for officers on preparing cases for prosecution and testifying effectively as expert witnesses.
• BMP 3.2.2: Establish protocols for early engagement between officers and prosecutors to improve case strength and shared understanding.
• BMP 3.2.3: Encourage ride-along trips or job shadowing opportunities for prosecutors to experience field conditions firsthand.
3.3. Support Effective and Proportionate Penalties
• BMP 3.3.1: Encourage the use of meaningful penalties that have strong deterrent effects, such as equipment confiscation and hunting license suspensions.
• BMP 3.3.2: Advocate for statutory authority to elevate repeated or severe illegal take offenders to felony-level charges.
• BMP 3.3.3: Provide clear guidance and valuation data on restitution and replacement costs to aid in penalty determination.
3.4. Reduce Social Acceptability of Wildlife Crime
• BMP 3.4.1: Promote public awareness campaigns that clarify the criminality and consequences of illegal take.
• BMP 3.4.2: Frame wildlife violations as serious offenses against public trust resources in communications with courts and the public.
• BMP 3.4.3: Collaborate with judges and bar associations to include wildlife law modules in judicial training.
BMP 4: Increasing Public Awareness of Wildlife Crime
Public awareness is a critical component in the fight against wildlife crimes. When citizens understand the difference between lawful hunting and illegal taking and recognize the impacts of poaching, they are more likely to report violations and support enforcement. The following Best Management Practices are recommended to help agencies increase public engagement, improve education, and shift social norms surrounding wildlife crime.
4.1. Develop Comprehensive Public Education Campaigns
• BMP 4.1.1: Launch multi-platform public outreach efforts (e.g., television, social media, podcasts, print) to educate the public on the distinction between legal hunting and poaching; reinforce that illegal take is not associated with the ethical, legal, and sustainable harvest of wildlife that is a positive force for conservation.
• BMP 4.1.2: Emphasize how illegal take harms the public by undermining conservation, reducing wildlife populations, and diverting funding.
• BMP 4.1.3: When possible, incorporate conservation education into public school curricula and community programs to promote long-term awareness.
4.2. Encourage Public Reporting of Violations
• BMP 4.2.1: Expand and publicize anonymous TIP hotlines and digital reporting tools to reduce fear of retaliation.
• BMP 4.2.2: Use clear messaging to explain what constitutes poaching and when and how to report suspicious activities.
• BMP 4.2.3: Build trust in enforcement systems by demonstrating consistent responses to reported violations.
4.3. Utilize Social Norms and Peer Influence
• BMP 4.3.1: After conviction, publicly post details of illegal take cases and display evidence such as confiscated equipment or trophies (e.g., 'Wall of Shame').
• BMP 4.3.2: Issue press releases for all major prosecutions to reinforce that poaching is unacceptable and punishable.
• BMP 4.3.3: Promote conservation values by connecting enforcement actions to public benefits and shared cultural heritage.
4.4. Reframe Wildlife Crime as a Serious Public Offense
• BMP 4.4.1: Use analogies (e.g., drunk driving) to demonstrate that poaching, while once generally tolerated, should no longer be socially acceptable and explain why this is true.
• BMP 4.4.2: Publicize the cost of undetected wildlife crime, including financial loss to agencies, lost revenue, and conservation impacts and setbacks.
• BMP 4.4.3: Train public affairs officers and spokespeople to consistently frame the illegal take of big game as theft of a public resource, not a “victimless” crime.
BMP 5: Community and Stakeholder Engagement
Stakeholders, including hunters, landowners, and other community members, play a critical role in shaping wildlife conservation outcomes. Understanding their perceptions and directly engaging them in conservation and anti-poaching efforts can increase legitimacy, reporting rates, and collective responsibility. The following Best Management Practices aim to improve stakeholder alignment, foster community-based conservation, and increase responsiveness to social and biological concerns related to the illegal take of big game.
5.1. Acknowledge Stakeholder Perspectives at Local and National Levels
• BMP 5.1.1: Incorporate hunter, landowner, and community member input into wildlife management planning to reflect geographical concerns and conservation priorities.
• BMP 5.1.2: Address differences in concern levels by reinforcing the importance of in-state and national-scale impacts of the illegal take of big game.
• BMP 5.1.3: Use data from sources such as surveys and focus groups to inform public messaging that resonates with each stakeholder group’s expressed concerns.
5.2. Emphasize Biological and Social Consequences of Illegal Take
• BMP 5.2.1: Educate stakeholders on the ecological impacts of poaching on wildlife populations and habitat integrity.
• BMP 5.2.2: Frame illegal take as detrimental to hunt quality, access, and opportunity issues strongly supported by hunters and some landowners.
• BMP 5.2.3: Highlight how poaching erodes public perception of hunting and risks longterm social approval levels for legal hunting.
5.3. Promote Shared Responsibility and Proactive Engagement
• BMP 5.3.1: Involve stakeholders in community-level anti-poaching initiatives, such as watch groups and education campaigns.
• BMP 5.3.2: Create advisory boards with representation from hunters, landowners, and other community members to help guide outreach and enforcement priorities.
• BMP 5.3.3: Recognize, publicly celebrate, and possibly reward examples of positive stakeholder engagement and the reporting of violations.
5.4. Communicate Effectively Across Groups
• BMP 5.4.1: Develop communication materials tailored to each group’s preferred media and values (e.g., conservation ethics for hunters and property protection for landowners).
• BMP 5.4.2: Use joint training or town hall meetings to foster understanding between officers and the communities they serve.
• BMP 5.4.3: Ensure transparency in enforcement efforts to build trust and maintain cooperative relationships with key stakeholders.
BMP 6: Operational Improvements in Wildlife Law Enforcement
Operational enhancements in law enforcement and interagency coordination are essential to improve the detection, prosecution, and prevention of illegal wildlife take. While some of these Best Management Practices may have been addressed in earlier sections, their operational alignment may cause them to appear in this section as well. The following recommendations focus on building law enforcement capacity, applying targeted detection strategies, and improving community and prosecutorial relationships to increase the overall effectiveness of anti-poaching efforts.
6.1. Enhance Law Enforcement Capacity and Effectiveness
• BMP 6.1.1: Increase staffing levels and reduce officer patrol areas to improve visibility and presence during peak seasons.
• BMP 6.1.2: Allocate dedicated funding or recovered restitution to support specialized anti-poaching operations.
• BMP 6.1.3: Equip officers with advanced detection technologies, including drones, trail cameras, and AI-powered digital surveillance tools.
6.2. Standardize Enforcement Practices and Penalty Application
• BMP 6.2.1: Establish consistent wildlife valuation metrics across states based on species, sex, and conservation importance.
• BMP 6.2.2: Ensure that license suspensions are entered into the Interstate Wildlife Violator Compact and that out-of-state suspensions are honored.
• BMP 6.2.3: Utilize federal tools, such as the Lacey Act (Appendix E), for interjurisdictional prosecutions when applicable.
6.3. Employ Strategic Detection and Typology-Based Tactics
• BMP 6.3.1: Use offender typologies and known behavioral patterns to target habitual or high-risk violators.
• BMP 6.3.2: Set strategic agency goals to increase detection and prosecution rates for illegal take cases. These goals should not include “quotas.”
• BMP 6.3.3: Monitor, collect data, and evaluate enforcement outcomes to guide future operations based on the most effective tactics
6.4. Build Public Trust and Community Integration
• BMP 6.4.1: Require officers to participate in community outreach programs and partner with local businesses (e.g., taxidermists, outfitters) and conservation non-governmental organizations.
• BMP 6.4.2: Improve access to anonymous reporting tools (e.g., TIP lines and websites) and address public concerns regarding retaliation or law enforcement inaccessibility.
• BMP 6.4.3: Promote the Interstate Wildlife Violator Compact program to hunters as both a deterrent and a tool for cross-state enforcement.
6.5. Improve Judicial Collaboration and Officer Preparedness
• BMP 6.5.1: Provide in-house training to officers on courtroom testimony, expert witness preparation, and professional demeanor.
• BMP 6.5.2: Facilitate partnerships between officers and prosecutors to build shared case strategies.
• BMP 6.5.3: Educate officers on effectively explaining the seriousness of wildlife crimes to judges and juries.
• BMP 6.5.4: Ensure that officers are well trained in building and presenting illegal take cases to prosecutors.
Chapter 9: Future Data & Research Needs for Adaptive Management
Best practice recommendations should be based on empirical evidence, as such data provide objective and credible foundations with reduced subjective opinions and other potential biases. Evidence-based practices reduce the need for experimentation through trial-and-error scenarios by providing insights into what works best based on existing data. Furthermore, policymakers are often more confident in supporting suggestions when they are based on verifiable data, so the resulting recommendations may be more likely to be adopted and implemented.
Collecting and analyzing data related to wildlife crimes, including illegal take of big game, is a vital component in the mission to develop a greater understanding of these offenses. A better understanding of this issue will aid in the development of more effective strategies to combat wildlife crime. Data collection protocols vary widely among state wildlife agencies; some agencies have access to comprehensive datasets on wildlife crimes in their states, while others do not. For example, some agencies only have access to information based on standardized fields on citations; they do not have easy access to citation narratives, reported cases for which a citation was not issued, or the outcome of the case (sometimes housed only by the courts). Ideally, each state agency will eventually have access to an inclusive database that includes all this information, as well as additional variables, including:
• Offender motivation(s) (can be based on officer observations and/or self-reported by the suspect).
• How the case was detected (e.g., officer observed, witness called the authorities, witness reported online).
• Types of patrol, technology (e.g., decoys, drones), and other techniques used to detect or solve the case.
• How a detected event was handled (e.g., warning, citation, or arrest);
• Court outcomes and verdicts for citations issued and arrests (e.g., pre-paid fines, pled guilty in court, found guilty in trial).
• All penalties assessed by the court (e.g., fines, replacement costs, loss of equipment, probation, and incarceration).
These data, along with information from indirect sources, such as telemetry studies for various species, should be analyzed for each state. Overall detection rates are very low, but it is imperative to analyze data for states independently because the opportunity for illegal take varies greatly. Traditional and Bayesian quantitative analyses can help answer important questions such as:
• What is the approximate illegal take detection rate for the state (or smaller geographic area within the state)? Bayesian analysis is highly effective for such estimates, which can help guide important decisions regarding staffing, funding, and resource allocation.
• Do specific types of poaching (e.g., trophy and recreational) tend to cluster in certain geographic areas? If so, specific detection strategies can be targeted in these areas.
• Is there a point where “more boots on the ground” (increased officer presence) significantly increases detection rates? Improving detection rates should increase deterrence by enhancing offenders’ perceptions of risk.
• Are the charges being dismissed or are the charges being altered in court? If so, are there any commonalities among these cases? If not, are statutory penalties consistently assessed by the court? This information can be used to develop strategies specifically designed to improve outcomes through the courts.
Agencies should also collect data about new programs or strategies used to combat illegal take so that process and outcome evaluations can be conducted to determine the effectiveness of the strategies and how they may be improved. For example:
• Are programs designed to educate the public about poaching and how to report events via websites or hotlines producing the desired results? If not, process evaluations may provide recommendations for improving outcomes.
• If new enforcement strategies (e.g., use of decoys or drones) have been implemented in an area, are they effective? Outcome evaluations will show whether there was a statistical increase in detection rates after implementation. If the results are not as expected, a process evaluation can help determine if and where strategic adjustments should be made.
The items mentioned above are only a few examples of the many questions that can be addressed if appropriate data are available. Quantitative methods using empirical data provide more precise measurements, help ensure the accuracy and reliability of the findings, and allow researchers to understand the nuances and complexities of real-world situations. Increased efforts to collect and analyze the types of data described above will lead to more effective and targeted solutions for the illegal take of big game in the U.S.
Chapter 10: Literature Cited
Aiello, M. F. (2019). Should I call for help? Examining the influences of situational factors and bystander characteristics on reporting likelihood. Journal of School Violence, 18(2), 163175.
Akers, R. L. (1973). Deviant behavior: A social learning approach. Wadsworth.
Aljumily, R. (2017). Quantitative criminology: Bayesian statistics for measuring the 'Dark Figure' of crime. Available at SSRN 2999280. https://ssrn.com/abstract=2999280.
Arnold, J. T. (2005). Characteristics of wildlife law violators in Mississippi and their attitudes toward conservation officers. Master’s thesis. Mississippi State University.
Balázs, E. (2016). From poaching to financing terrorism. Thoughts on poaching endangering society. Journal of Eastern European Criminal Law, (1), 190-200.
Batcheller, G. R., Bambery, M. C., Bies, L., Decker, T., Dyke, S., Guynn, D., McEnroe, M., O’Brien, M., Organ, J. F., Riley, S. J., & Roehm, G. (2010). The Public Trust Doctrine: Implications for wildlife management and conservation in the United States and Canada. Technical Review 10-1. The Wildlife Society.
Batcheller, G. R., Decker, T. A., & Lanka, R. P. (2018). Public Trust Doctrine and the legal basis for state wildlife management. In T. J. Ryder (Ed.), State wildlife management and conservation (pp. 24-38). Johns Hopkins University Press, in association with The Wildlife Society.
Beattie, K. H. (1975). Anti-poaching campaigns: A tool of wildlife law enforcement. Proceedings of the Annual Conference of the Southeastern Association of Game and Fish Commissioners, 29, 728-743.
Beattie, K. H. (1976). Evaluative criteria used in anti-poaching campaigns. Wildlife Society Bulletin, 4(1), 29-30.
Benson, J. F., Doughtery K. D., Beier, P., Boyce, W. M., Cristescu, B., Gammons, D. J., Garcelon, D. K., Higley, J. M., Martins, Q. E., Nisi, A. C., Riley, S. P. D., Sikich, J. A., Stephenson, T. R., Vickers, T. W., Wengert, G. M., Wilmers, C. C., Wittmer, H, U., & Dellinger, J. A. (2023). The ecology of human-caused mortality for a protected large carnivore. Ecology, 120(13) 1-11.
Blevins, K. R., & Edwards, T. D. (2009). Wildlife crime. In J. Mitchell Miller (Ed.), 21st Century criminology (pp. 557-563). Sage.
Blevins, K.R., & Gassett, J. W. (2018). The Tragedy of the Commons: Exploring the true cost of fish and wildlife crimes. Transactions of the 83rd North American Wildlife and Natural Resources Conference, 83, 91-100.
Biderman, A. D., & Reiss Jr, A. J. (1967). On exploring the "dark figure" of crime. The Annals of the American Academy of Political and Social Science, 374(1), 1-15.
Brantley, W. (2011). Inside the hunt for trophy poachers. American Hunter https://www.americanhunter.org/content/inside-the-hunt-for-trophy-poachers/
Brewster, M., & Tucker, J. M. (2016). Understanding bystander behavior: The influence of and interaction between bystander characteristics and situational factors. Victims and Offenders, 11(3), 455-481.
Brymer, R. A. (1991). The emergence and maintenance of a deviant sub-culture: The case of hunting/poaching sub-culture. Anthropologica, 33(1/2), 177-194.
Calabi, S. (2020). What is “Ethical Fair-Chase Hunting?” For starters, it’s a worthy dinner-table topic. Conservation Frontlines, II(1).
Carrington, P. (2000). Using police crime surveys to study drug abuse Proceedings of the 4th International Conference on Methodological Issues in Official Statistics, 1-8.
Carter, T. J. (2004). Force against and by game wardens in citizen encounters. Police Quarterly, 7(4), 489-508.
Casalena, M. J. (2000). Turkey research management. Pennsylvania Game Commission.
Clifford, M. (1998). Environmental crime: Enforcement, policy, and social responsibility. Aspen.
Cohen, J. I., & Altman, S. (2021). An historical analysis of United States experiences using stampbased revenues for wildlife conservation and habitat protection. Discover Sustainability, 2(24), 1-16.
Cohen, L., & Felson, M. (1979). Social change and crime rate trends: A routine activity approach. American Sociological Review, 44, 588–608.
Cowles, C. J., Beattie, K. H., & Giles, R. H. (1979). Limitations of wildlife law compliance estimators. Wildlife Society Bulletin, 7(3), 188-191.
Cox, J. (2003). Annual survival and cause-specific mortality of white-tailed deer in southeastern Kentucky. Master’s Thesis. University of Kentucky.
Crow, M., Shelley, T. O. C., & Stretesky, P. (2013). Camouflage-collar crime: An examination of wildlife crime and characteristics of offenders in Florida. Deviant Behavior, 34(8), 635-652.
de Castelbajac, M. (2014). Brooding over the dark figure of crime: The home office and the Cambridge Institute of Criminology in the run-up to the British Crime Survey. British Journal of Criminology, 54(5), 928-945.
Decker, D. J., Brown, T. L., & Dawson, C. P. (1980). Deer hunting violations and law enforcement in New York: The TJs' and ECOs' perspectives. Outdoor Recreation Research Unit. Cornell University.
Decker, D. J., Forstchen, A. B, Organ, J. F., Smith, C. A., Riley, S. J., Jacobson, C. A., Batcheller, G. R., & Siemer, W. F. (2014). Impacts management: an approach to fulfilling public trust responsibilities of wildlife agencies. Wildlife Society Bulletin, 38, 2–8.
Decker, D. J., Forstchen, A. B., Pomeranz, E. F., Smith, C. A., Riley, S. J., Jacobson, C. A., Organ, J. F., & Batcheller, G. R. (2015). Stakeholder engagement in wildlife management: Does the Public Trust Doctrine imply limits? Journal of Wildlife Management, 79(2), 174-179.
DeVivo, M. T., Cottrell, W. O., DeBerti, J. M., Duchamp, J. E., Hefferman, L. M., Kougher, J. D., & Larkin, J. L. (2011). Survival and cause-specific mortality of elk Cervus canadensis calves in a predator rich environment. Wildlife Biology, 17, 156-165.
Ducks Unlimited (DU). (n.d.). About Ducks Unlimited. https://www.ducks.org/about-ducksunlimited.
Duffy, R., St John, F. A., Büscher, B., & Brockington, D. (2016). Toward a new understanding of the links between poverty and illegal wildlife hunting. Conservation Biology, 30(1), 14-22.
Edwards, V. (2017). An overview of state fish and wildlife agency restitution programs for illegally taken big game species. Boone and Crockett Club and Leupold & Stevens.
Eliason, S. L. (1999). The illegal taking of wildlife: Toward a theoretical understanding of poaching. Human Dimensions of Wildlife, 4(2), 27-39.
Eliason, S. L. (2003a). Illegal hunting and angling: The neutralization of wildlife law violations. Society & Animals, 11, 225-243.
Eliason, S. L. (2003b). Throwing the book versus cutting some slack: Factors influencing the use of discretion by game wardens in Kentucky. Deviant Behavior, 24, 129-152.
Eliason, S. L. (2004). Accounts of wildlife law violators: Motivations and rationalizations. Human Dimensions of Wildlife, 9, 119-131.
Eliason, S. L. (2007). From wildlife specialist to police generalist? The scope of nonwildlife violations encountered by conservation officers. Southwest Journal of Criminal Justice, 4, 120-132.
Eliason, S. L. (2008). Wildlife crime: Conservation officers’ perceptions of elusive poachers. Deviant Behavior, 29, 111-128.
Eliason, S. L. (2011a). Policing natural resources: Issues in a conservation law enforcement agency. Professional Issues in Criminal Justice, 6(3), 43-58.
Eliason, S. L. (2011b). Patrolling the peaks and the plains: An examination of big sky game wardens. Criminal Justice Studies, 24(4), 409-418.
Eliason, S. (2012a). From the King's deer to a capitalist commodity: A social historical analysis of the poaching law. International Journal of Comparative and Applied Criminal Justice, 36(2), 133-148.
Eliason, S. L. (2012b). Trophy poaching: A routine activities perspective. Deviant Behavior, 33(1), 7287.
Eliason, S. L. (2013). Policing the poachers in the United States: A qualitative analysis of game wardens and profiling. International Journal of Criminal Justice Sciences, 8(2), 235-247
Eliason, S. L. (2017). Becoming a game warden: Motivations for choosing a career in wildlife law enforcement. Journal of Police and Criminal Psychology, 32, 28-32.
Eliason, S.L. (2020). An examination of game wardens and their social circles. Police Forum, 29(2), 4-13.
Eliason, S. L., & Dodder, R. A. (1999). Techniques of neutralization used by deer poachers in the western United States: A research note. Deviant Behavior, 20(3), 233-252.
Etter, D. R., Hollis, K. M., Van Deelen, T. R., Ludwig, D. R., Chelsvig, J. E., Anchor, C. L., & Warner, R. E. (2002). Survival and movements of white-tailed deer in suburban Chicago, Illinois. Journal of Wildlife Management, 66(2), 500-510.
- 123 -
Falcone, D. (2004). America’s conservation police: Agencies in transition. Policing: An International Journal of Police Strategies & Management, 27, 56-66.
Filteau, M. R. (2012). Deterring defiance: ‘Don’t give a poacher a reason to poach.’ International Journal of Rural Criminology, 1(2), 236-255.
Fisher, F. (2024). State’s new deer tags cause hunters’ confusion. The Post-Journal. https://www.post-journal.com/sports/local-sports/2024/12/states-new-deer-tags-causehunters-confusion/.
Forsyth, C. J. (1993). Chasing and catching “bad guys”: The game warden’s prey. Deviant Behavior, 14(3), 209–226.
Forsyth, C. J. (2008). The game of wardens and poachers. Journal of Rural Social Sciences, 23(2), 43-53.
Forsyth, C. J., Gramling, R., & Wooddell, G. (1998). The game of poaching: Folk crimes in southwest Louisiana. Society and Natural Resources, 11, 25-38.
Forsyth, C. J., & Marckese, T. A. (1993a). Folk outlaws: Vocabularies of motives. International Review of Modern Sociology, 23, 17-31.
Forsyth, C. J., & Marckese, T. A. (1993b). Thrills and skills: A sociological analysis of poaching. Deviant Behavior: An Interdisciplinary Journal, 14, 157-172.
Frese, S. J. (2003). Aldo Leopold: An American prophet. The History Teacher, 37(1), 99-118.
Gavin, M. C., Solomon, J. N., & Blank, S. G. (2010). Measuring and monitoring illegal use of natural resources. Conservation Biology, 24(1), 89–100.
Geer v. Connecticut, 161 U.S. 519 (1896).
Geist, V. (1988). How markets in wildlife meat and parts, and the sale of hunting privileges, jeopardize wildlife conservation. Conservation Biology, 2(1), 15-26.
Geist, V. (1995). North American policies of wildlife conservation. In V. Geist & I. McTaggert-Cowan (Eds.), Wildlife conservation policy (pp. 77-129). Detselig Press.
Geist, V., Mahoney, S. P., & Organ, J. F. (2001). Why hunting has defined the North American Model of Wildlife Conservation. Transactions of the North American Wildlife and Natural Resources Conference, 66, 175-185.
Geist, V., & Organ, J. F. (2004). The public trust foundation of the North American Model of Wildlife Conservation. Northeast Wildlife, 58, 49-56.
Gelman, A., Carlin, J. B., Stern, H. S., Dunson, D. B., Vehtari, A., & Rubin, D. B. (2013). Bayesian data analysis (3rd ed.). CRC Press.
Gibbons, D. C. (1972). Crime in the hinterland. Criminology, 10, 177-191.
Glover, J. M. (1989). Thinking like a wolverine: The ecological evolution of Olaus Murie. Environmental Review, 13(3-4), 29-45.
Glover, R. L, & Baskett, T. S. (1984). Socioeconomic profiles of Missouri deer poachers: Management applications. Transactions of the 49th North American Wildlife and Natural Resources Conference, 49, 104-111.
Grasmick, H. G., Bursik Jr, R. J., & Arneklev, B. J. (1993). Reduction in drunk driving as a response to increased threats of shame, embarrassment, and legal sanctions. Criminology, 31(1), 4167.
Gray, B. T., & Kaminski, R. M. (1994). Illegal waterfowl hunting in the Mississippi Flyway and recommendations for alleviation. Wildlife Monographs, (127), 3-60.
Green, E. K. (2016). Judging the effectiveness of anti-poaching hotlines. Journal of Rural Social Sciences, 31(2), 2.
Green, G. S. (1990). Resurrecting polygraph validation of self-reported crime data: A note on research method and ethics using the deer poacher. Deviant Behavior, 11, 131-137.
Green, G. S. (2002). The other criminalities of animal freeze-killers: Support for a generality of deviance. Society of Animals, 10, 5-30.
Green, G. S., Phillips, H.J., & Black, S.K. (1988). The Georgia deer jacker. Proceedings of the Annual Conference of the Southeastern Association of Fish and Wildlife Agencies, 42, 558-565.
Hagan, J. (1977). Conflict and consensus in the designation of deviance. Social Forces, 56(2), 320340.
Haines, A. M., Webb, S. L., & Mesh, F. (2016). Forty years in the making: A survey of wildlife law enforcement needs. The Wildlife Professional, September/October, 34-36.
Hall, D. L. (1992). Compliance: The mission of wildlife law enforcement. Proceedings of the Annual Conference of the Southeastern Association of Fish and Wildlife Agencies, 46, 532-542.
Hall, T. (2024). Virginia Poacher Who killed famous 'Hollywood Buck' sentenced to six months in jail. Field and Stream. https://www.fieldandstream.com/hunting/hollywood-buck-pochergets-six-months-in-jail.
Hansen, K. (1994). Crimes against the wild: Poaching in California. Mountain Lion Foundation. https://mountainlion.org/wp-content/uploads/2021/01/Crimes-Against-the-Wild.pdf.
Hardin, G. (1968). The tragedy of the commons. Science, 162(3859), 1243–1248.
Haymes, C. A., McDermott, J. R., Jenkins, G. S. W., Bowling, W. E., Hast, J. T., Johannsen, K. L., Cox, J. J. (2018). Survival and cause-specific mortality of white-tailed deer in Southeastern Kentucky. Journal of the Southeastern Association of Fish and Wildlife Agencies, 5, 90-96.
Hicks, M. V. (2001). Deer management report of survey-inventory activities 1 July 1998-30 June 2000. Alaska Department of Fish and Game. 109pp.
Holdt, S. (2015). The legacy of Sampson. Colorado Life. https://www.coloradolifemagazine.com/blog/post/the-legacy-of-samson.
Hurd, M. D. (2009). Subjective probabilities in household surveys. Annual Review of Economics, 1, 543-562.
International Consortium on Combating Wildlife Crime. (2019). Summary of "Wildlife and Forest Crime Analytic Toolkit.” United Nations Office on Drugs and Crime.
Irby, L. R., Swenson, J. E., & Stewart, S. T. (1989). Two views of the impacts of poaching on bighorn sheep in the upper Yellowstone valley, Montana, USA. Biological Conservation, 47(4), 259272.
Jacobsen, C. A., Organ, J. F., Decker, D. J., Batcheller, G. R., & Carpenter, L. (2010). A conservation institution for the 21st century: implications for state wildlife agencies. Journal of Wildlife Management, 74(2), 203-209.
Jacoby, K. (2014). Crimes against nature: Squatters, poachers, thieves, and the hidden history of American conservation. University of California Press.
Johnson, R. D., Smith, A. L., & Kreeger, T. J. (2020). Estimating illegal take of wildlife using radiotelemetry: A multi-state synthesis. Journal of Wildlife Management, 84(6), 1101-1112. https://doi.org/10.1002/jwmg.21894
Kahler, J. S., & Gore, M. L. (2012). Beyond the cooking pot and pocketbook: Factors influencing noncompliance with wildlife poaching rules. International Journal of Comparative and Applied Criminal Justice, 36(2), 103-120.
Kalof, L., & Fitzgerald, A. (2003). Reading the trophy: Exploring the display of dead animals in hunting magazines. Visual Studies, 18(2), 112-122.
Kaminsky, M. A. (1974). Analysis of the spatial and temporal occurrence of deer spotlighting violations in Virginia. Master’s thesis. Virginia Polytechnic Institute and State University.
Kamminga, J., Ayele, E., Meratnia, N., & Havinga, P. (2018). Poaching detection technologies a survey. Sensors, 18(5), 1474.
Karlen, J., Salvo, M., McRoberts, J, Millspaugh, J., Evans, C., & Leath, S. (2023). Analysis of hunting regulation complexity: 50-state analysis. Council to Advance the Hunting and Shooting Sports.
Kasworm, W. F., & Thier, T. J. (1994). Adult black bear reproduction, survival, and mortality sources in Northeast Montana. Bears: Their Biology and Management, 9(1), 223-230.
Knapp, E. J. (2012). Why poaching pays: a summary of risks and benefits illegal hunters face in Western Serengeti, Tanzania. Tropical Conservation Science, 5(4), 434-445.
Kurland, J., Pires, S. F., McFann, S. C., & Moreto, W. D. (2017). Wildlife crime: A conceptual integration, literature review, and methodological critique. Crime Science, 6, 1-15.
Kurth, K. A., Watson, E. M., Gerhold, R. W., Metts, D, L, Miller, B. F., Morin, D. J., Eda, S., Yang, S., & Muller, L. I. (2023). Mortality, survival, and serologic results for elk (Cervus canadensis) in the Cumberland Mountains of Tennessee, USA. Journal of Wildlife Diseases, 59(3), 420-431.
Kurzejeski, E. W., Vangilder, L. D., & Lewis, J. B. (1987). Survival of wild turkey hens in north Missouri. Journal of Wildlife Management, 51(1), 188-193.
Langton, L., M. Berzofsky, C. Krebs, and H. Smiley-McDonald. (2012). Victimizations not reported to the police, 2006–2010. U.S. Department of Justice.
Lanham, C. M. (2013). Occupational roles and practices of Kentucky conservation officers. Master’s thesis. Eastern Kentucky University.
Leavitt, K., Wodahl, E. J., & Schweitzer, K. (2021). Citizen willingness to report wildlife crime. Deviant Behavior, 42(10), 1256-1272.
Lehman, C. P., Flake, L. D., & Rumble, M. A. (2007). Survival and cause-specific mortality of Merriam’s turkeys in the southern Black Hills. Proceedings of the National Wild Turkey Symposium, 9, 295-301.
Leopold, B. D. (2018b). Wildlife Ownership. In B. D. Leopold, W. B. Kessler, & J. L. Cummins (Eds.), North American wildlife policy and law (pp. 27-29). Boone and Crockett Club.
Liberg, O., Chapron, G., Wabakken, P., Pedersen, H. C., Hobbs, N. T., & Sand, H. (2012). Shoot, shovel and shut up: Cryptic poaching slows restoration of a large carnivore in Europe. Proceedings of the Royal Society B: Biological Sciences, 279(1730), 910–915. https://doi.org/10.1098/rspb.2011.1275
Logan L., Osborne, D., Edwards, B., & Stickle B. (2023). Conservation officer perceptions of stress associated with traditional policing duties. Policing: A Journal of Policy and Practice, 17. https://doi.org/10.1093/police/paac058.
Lopez, R. R., Feuerbacher, C. K., Silvy, N. J., Sternberg, M. A., & Burk, J. D. (1998). Survival and reproduction of eastern wild turkeys relocated into the post oak savannah of Texas. Proceedings for the Annual Conference of the Southeastern Association of Fish and Wildlife Agencies, 52, 384-396.
Mayer, J. E., King, T. L., Birendra, K. C., Will, B., & Peterson, M. N. (2013). Evaluating poaching deterrents in the southeast. Journal of the Southeastern Association of Fish and Wildlife Agencies, 1, 146-149.
McFann, S. C., & Pires, S. F. (2018). Taking stock in wildlife crime research: trends and implications for future research. Deviant Behavior, 41(1), 118-135.
McMullan, J. L., & Perrier, D. C. (2002). Lobster poaching and the ironies of law enforcement. Law and Society Review, 36, 679-720.
McCormick, J. B. (1968). A procedure for evaluating the effectiveness of wildlife law enforcement. Proceedings of the Annual Conference of the Western Association of Fish and Wildlife Agencies, 48, 626-639.
McCorquodale, S., Wik, P., Fowler, P., & Owens, T. (2010). Elk survival and mortality factors in the Blue Mountains of Wahington. Washington Department of Fish and Wildlife, Olympia, Washington, USA.
McSkimming, M. J., & Berg, B. L. (2008). Motivations for citizen involvement in a community crime prevention initiative: Pennsylvania's TIP (Turn in a Poacher) program. Human Dimensions of Wildlife, 13(4), 234-242.
Meshe, F. E., & Haines, A. M. (2019). Identification of wildlife law enforcement research needs. Applied Conservation Lab, Department of Biology, Millersville University of Pennsylvania.
Miller, D. A., Burger, L. W., Leopold, B. D., & Hurst, G. A. (1998). Survival and cause-specific mortality of wild turkeys in central Mississippi. Journal of Wildlife Management, 62(1), 306313.
Millions, D. G., & Swanson, B. J. (2006). An application of Manel's model: Detecting bobcat poaching in Michigan. Wildlife Society Bulletin, 34(1), 150-155.
Milner-Gulland, E. J., & Leader-Williams, N. (1992). A model of incentives for the illegal exploitation of black rhinos and elephants: Poaching pays in Luangwa Valley, Zambia. Journal of Applied Ecology, 29(2), 388–401. https://doi.org/10.2307/2404516
Musgrave, R. S., Parker, S., & Wolok, M. (1993). The status of poaching in the United States-Are we protecting our wildlife. Natural Resources Journal, 33(4), 977-1014.
Muth, R. M. (1998). The persistence of poaching in advanced industrial society: Meanings and motivations An introductory comment. Society and Natural Resources, 11, 5-7.
Muth, R. M., & Bowe, J. F. (1998). Illegal harvest of renewable natural resources in North America: Toward a typology of the motivations for poaching. Society and Natural Resources, 11, 9-24.
Muth, R. M., Bowe, J. F., & Sorenson, D. K. (1998). Unreported and unregulated wildlife violations: Implications for enforcing wildlife law. Human Dimensions of Wildlife, 3(3), 62–74.
Nagin, D. S. (2013). Deterrence in the twenty-first century. Crime and justice, 42(1), 199-263.
Nagin, D. S., & Paternoster, R. (1993). Enduring individual differences and rational choice theories of crime. Law and Society Review, 27(3), 467-496.
Narreddy, V., & Shashidhar, E. S. (2024). Wildlife crime: Causes consequences, and countermeasures: A review. International Journal of Science and Research Archive, 11, 1773-1786.
Nelson, C., & Verbyla, D. (1984). Characteristics and effectiveness of state anti-poaching campaigns. Wildlife Society Bulletin, 12(2), 117-122.
Nijman, V. (2017). Orangutan trade, confiscations, and lack of prosecutions in Indonesia. American Journal of Primatology, 79(11), e22652.
Organ, J. F. (2018). Poaching, wildlife trafficking, and North American wildlife conservation: Default on the Public Trust. Transactions of the North American Wildlife and Natural Resources Conference, 83, 108-112.
Organ, J. F., Geist, V., Mahoney, S. P., Williams, S., Krausman, P. R., Batcheller, G. R., Decker, T. A., Carmichael, R., Nanjappa, P., Regan, R., Medellin, R. A., Cantu, R., McCabe, R. E., Craven, S., Vecellio, G. M., & Decker, D. J. (2012). The North American Model of Wildlife Conservation. The Wildlife Society Technical Review 12-04. The Wildlife Society.
Organ, J. F. & McCabe, R. E. (2018). History of state wildlife management in the United States. In T. J. Ryder (Ed.), State wildlife management and conservation (pp. 1-23). John's Hopkins University Press.
Patten, R. (2012). Drunk and angry is no way to enjoy the outdoors: An examination of game wardens and the use of force. International Journal of Comparative and Applied Criminal Justice, 36(2), 121-132.
Patterson, B. R., MacDonald, B. A., Lock, B. A., Anderson, D. G., & Benjamin, L. W. (2002). Proximate factors limiting population growth of white-tailed deer in Nova Scotia. Journal of Wildlife Management, 66(2), 511-521.
Pavlova, L. (2025). Framing effects in consumer expectations surveys. Journal of Economic Behavior and Organization, 231, 1-12.
Paz, G. & Heffelfinger, J. R. (2018). Enforcement of Laws and Policies. In B. D. Leopold, W. B. Kessler, & J. L. Cummins (Eds.), North American wildlife policy and law (pp. 90-101). Boone and Crockett Club.
Peterson, M. N., von Essen, E., Hansen, H. P., & Peterson, T. R. (2017). Illegal fishing and hunting as resistance to neoliberal colonialism. Crime, Law and Social Change, 67, 401-413.
Peterson, M. N., von Essen, E., Hansen, H. P., & Peterson, T. R. (2019). Shoot shovel and sanction yourself: Self-policing as a response to wolf poaching among Swedish hunters. Ambio, 48, 230-239.
Poten, C. J. (1991). America's illegal wildlife trade. National Geographic, 180(3), 106-132
Pratt, T. C., Cullen, F. T., Blevins, K. R., Daigle, L. E., & Madensen, T. A. (2006). The empirical status of deterrence theory: A meta-analysis. In F. T. Cullen, J. P. Wright, & K. R. Blevins (Eds.), Taking stock: The status of criminological theory (pp. 367-395). Transaction.
Rizzolo, J. B., Gore, M. L., Ratsimbazafy, J. H., & Rajaonson, A. (2017). Cultural influences on attitudes about the causes and consequences of wildlife poaching. Crime, Law and Social Change, 67, 415-437.
Sawhill, G. S., & Winkell, R. (1974). Methodology and behavioral aspects of the illegal deer hunter. Proceedings of the Annual Conference of the Southeastern Association of Fish and Wildlife Agencies, 28, 715-719.
Scialfa, T. (1992). An ethnographic analysis of poachers and poaching in northern Idaho and eastern Washington. Master’s thesis. University of Idaho.
Serenari, C., & Peterson, M. N. (2016). A sociopolitical perspective on the illegal take of wildlife in the southeastern USA. International Journal of Rural Criminology, 3, 29-49.
Shelley, T. O., & Crow, M. S. (2009). The nature and extent of conservation policing: Law enforcement generalists or conservation specialists? American Journal of Criminal Justice. 34, 9-27.
Sherblom, J. C., Keranen, L., & Withers, L. A. (2002). Tradition, tension, and transformation: A structuration analysis of a game warden service in transition. Journal of Applied Communication Research, 30, 143-162.
Sherman, L. W. (1993). Defiance, deterrence, and irrelevance: A theory of the criminal sanction. Journal of Research in Crime and Delinquency, 30(4), 445-473.
Skidmore, A. (2021). Uncovering the nuances of criminal motivations and modus operandi in the Russian Far East: A wildlife crime case study. Methodological Innovations, 14(2), 20597991211022015.
Skogan, W. G. (1977). Dimensions of the dark figure of unreported crime. Crime and Delinquency, 23(1), 41-50.
Slabach, B. L., Hast, J. T., Murphy, S. M., Bowling, W. E., Crank, R. D., Jenkins, G., & Cox, J. J. (2018). Survival and cause-specific mortality of elk Cervus canadensis in Kentucky, USA. Wildlife Biology, (1), 1-9.
Smith, C. A. (2011). The role of state wildlife professionals under the Public Trust Doctrine. Journal of Wildlife Management, 75(7), 1539–1543.
Smith, G. (1982). To catch a thief. Colorado Outdoors, 31(5), 5-9.
Sosnowski, M. C., Kim, Y., Petrossian, G. A., & Asner, M. A. (2022). Profiling wildlife crimes prosecuted federally by the United States. Frontiers in Conservation Science. https://www.frontiersin.org/journals/conservationscience/articles/10.3389/fcosc.2021.811516/full.
Steinmetz, R., Srirattanaporn, S., Mor-Tip, J., & Seuaturien, N. (2014). Can community outreach alleviate poaching pressure and recover wildlife in South-East Asian protected areas? Journal of Applied Ecology, 51(6), 1469–1478.
Stretesky, P. B., Shelley, T. O., & Crow, M. S. (2010). Do conservation organizations influence the production of natural resource violations? Organization and Environment, 23(4), 398-416.
Storm, D. J., Samuel, M. D., Van Deelen, T. R., Malcolm, K. D., Rolley, R. E., Frost, N. A., … & Drake, D. (2007). Deer survival and population growth in a Wisconsin chronic wasting disease management zone. Journal of Wildlife Management, 71(8), 2664–2670. https://doi.org/10.2193/2006-525
Sutherland, E. (1934). Principles of criminology. J. B. Lippincott.
Sykes, G. M., & Matza, D. (1957). Techniques of neutralization: A theory of delinquency. American Sociological Review, 22(6), 664-670.
Tapp, S. N., & Coen, E. J. (2024). Criminal victimization, 2023. Bureau of Justice Statistics, U.S. Department of Justice.
Thornberry, T.P. & Krohn, M.D. (2000). The self-report method for measuring delinquency and crime. Criminal Justice 2000, 4, 33-83.
Thornberry, T. P., & Krohn, M. D. (2003). Comparison of self-report and official data for measuring crime. In Measurement problems in criminal justice research: Workshop summary (pp. 4394). National Academies Press.
United States Fish and Wildlife Service. (2011). Reward offered in bald eagle poaching case in Washington. https://www.fws.gov/story/2011-06/reward-offered-bald-eagle-poachingcase-washington.
United States Fish and Wildlife Service. (2025). Funding sources. https://partnerwithapayer.org/funding-sources.
United States Fish and Wildlife Service. (n.d.b). Office of Conservation Investment. https://www.fws.gov/program/office-conservation-investment.
Unsworth, J. W., Kuck, L., Scott, M. D., & Garton, E. O. (1993). Elk mortality in the Clearwater drainage of Northcentral Idaho. Journal of Wildlife Management, 57(3), 495-502.
van Dijk, J. J. M. (2016). Illuminating the dark figure of crime: Victimization surveys and beyond. Criminology in Europe, 15(3), 4-9.
Vila, J. (2024). Trophy buck, known by local hunters as ‘King Louie,’ taken illegally in New York. Outdoor News. https://www.outdoornews.com/2024/12/13/trophy-buck-known-as-kinglouie-taken-illegally-in-new-york/.
Vilkitis, J.R. (1968). Characteristics of big game violators and extent of their activity in Idaho. Doctoral dissertation. University of Idaho.
von Essen, E., & Hansen, H. P. (2018). Policing peers and selves between law and morality: A sociolegal perspective on managing misconduct in hunting. International Journal on Rural Criminology, 4(1), 1-26.
von Essen, E., Hansen, H. P., Källström, H. N., Peterson, M. N., & Peterson, T. R. (2014). Deconstructing the poaching phenomenon: A review of typologies for understanding illegal hunting. British Journal of Criminology, 54(4), 632-651.
-
von Essen, E., Hansen, H. P., Källström, H. N., Peterson, M. N., & Peterson, T. R. (2015). The radicalisation of rural resistance: How hunting counterpublics in the Nordic countries contribute to illegal hunting. Journal of Rural Studies, 39, 199-209.
Wagner, K., Owen, S., & Burke, T. W. (2019). Not wild about wildlife protection? The perceived harmfulness, wrongfulness, and seriousness of wildlife crimes. Society & Animals, 27(4), 383-402.
Watson, R. (2012). Public wildlife on private land: Unifying the split estate to enhance trust resources. Duke Environmental Law and Policy Forum, 23, 291-321.
Weisheit, R.A. (2016). Rural crime from a global perspective. International Journal of Rural Criminology, 3(1), 5-28.
Weisheit, R. A., Falcone, D. N., & Wells, L. E. (2006). Crime and policing in rural and small-town America. Waveland.
Weisheit, R.A., & Wells, L.E. (1996). Rural crime and justice: Implications for theory and research. Crime & Delinquency, 42(3), 379-397.
Wellsmith, M. (2011). Wildlife crime: the problems of enforcement. European Journal on Criminal Policy and Research, 17, 125-148.
Wightman, P. H., Ulery, E. E., Bakner, N.W., Cantrell, J. R., Ruth, C. R., Rushton, E., Cedotal, C. A., Kilgo, J. C., Moscicki, D. J., Pacifici, K., Moorman, C. E., Collier, B. A., & Chamberlain, M. J. (2023). Survival and cause-specific mortality of male wild turkeys across the southeastern United States. Journal of Wildlife Management, 88(2), 1-20.
Wyatt, T. (2013). Wildlife trafficking: A deconstruction of the crime, and victim, and the others Palgrave MacMillan.
Zimmerman, M.E. (2003). The black market for wildlife: combating transnational organized crime in the illegal wildlife trade. Vanderbilt Journal of Transnational Law, 36, 1657-1689.
THIS PAGE INTENTIONALLY LEFT BLANK.
Appendix A: The Rise of the Conservation Movement
Early Americans migrated from England in search of autonomy and freedom from the British Monarchy. At that time, many English laws were rooted in social hierarchy, and wildlife laws and hunting rights were no exception. Most wild game was deemed the property of the King, with laws dictating who could hunt specific animals and the methods of hunting. These restrictions were largely based on social class, with deer hunting privileges reserved for nobles and elites. The king employed gamekeepers, the forerunners of modern wildlife law enforcement agents, to uphold laws related to hunting and to protect wildlife. Poachers and other violators faced severe penalties, including harsh fines, imprisonment, and confiscation of hunting equipment (Eliason, 2012a; Stockdale, 1993). However, these restrictions were rejected by Colonial Americans, who hunted for survival rather than for recreation.
When the first colonies were established, American settlers relied on an assumed inexhaustible supply of wildlife as their primary source of food and clothing. The fur trade soon emerged as a significant enterprise (Organ & McCabe, 2018; Stockdale, 1993), fueled by the colonies' need for furs and commercial demand from Europe. Initially, the colonists resisted regulations and laws concerning the taking of wildlife, adhering instead to a free-taking policy that granted everyone the right to fish and hunt wild game (Eliason, 2012a). While some property owners claimed ownership of the wildlife on their land, early leaders declared that wildlife belonged to the person who killed or captured it rather than to the owner of the property where the game was taken (Leopold, 2018a; Organ & McCabe, 2018). Over time, settlers noticed a decline in the local populations of important game animals, necessitating longer journeys to find them (Paz & Heffelfinger, 2018). The practice of unrestricted hunting has led to the extinction of some species and nearly eliminated others, such as wild turkeys and white-tailed deer (Organ & McCabe, 2018). Eventually, colonists recognized the need for laws and regulations to ensure sustainable harvests and wildlife conservation (Eliason, 2012a; Leopold, 2018a; Stockdale, 1993; Warren, 1992), although some were hesitant to comply with these new rules once they were established.
By the mid-1600s, certain local jurisdictions had started to establish specific deer hunting seasons, imposing fines on those caught hunting out of season (Trefethen, 1975). In the early 1700s, most colonies began to implement wildlife laws and regulations, which mainly included bag limits, designated hunting seasons for certain animals (primarily males), and prohibitions on hunting after dark and on Sundays (Leopold, 2018a; Lund, 1980; Paz & Heffelfinger, 2018). By 1800, all colonies had set regulations for hunting white-tailed deer, although enforcing these restrictions proved challenging (Organ & McCabe, 2018; Trefethen, 1975). Detecting hunting during closed seasons was more straightforward than identifying violations of bag limits (Leopold, 2018a). However, colonial and early state governments lacked the dedicated resources necessary to enforce wildlife laws. Instead, they relied on "deer reeves," typically two per town, who received half the fine imposed on violators caught hunting deer outside the legal season (Organ et al., 2012). Alternatively, "deer wardens," who were local traditional law enforcement agents, often with hunting experience, enforced deer hunting laws alongside their regular municipal duties (Paz & Heffelfinger, 2018).
Public Trust Doctrine
Despite the existence of fish and wildlife laws, challenges regarding wildlife ownership persisted. In the landmark case of Martin v. Waddell (1842), the U.S. Supreme Court determined that no individual could claim ownership of any wildlife species. Instead, it ruled that the government was responsible for maintaining and holding wildlife in trust (Jacobsen et al., 2010; Leopold, 2018b; Organ, 2018; Organ et al., 2012; Organ & McCabe, 2018). Although this case primarily addressed navigable waters and oyster fisheries, the Court reinforced this principle in Geer v. Connecticut (1896), affirming that states have the authority to regulate the harvest and management of wild animals within their borders and hold them in trust for the public (Organ, 2018). The Public Trust Doctrine (PTD) is the principle that serves as the foundation for these cases, establishing a trustee relationship in which the government (the Trustee) holds and manages wildlife for the public's benefit (the Stakeholders). At its core, the PTD asserts that natural resources hold universal importance and that the public should have the opportunity to enjoy these resources through activities such as fishing, hunting, and trapping (Batcheller et al., 2010; Batcheller et al., 2018; Geist et al., 2001).
North American Model of Wildlife Conservation
The North American Model of Wildlife Conservation (NAMWC) is based on a historical analysis of the first century of game management in North America. It evolved from what was initially called the North American System of Wildlife Management. This system originally encompassed three general principles of wildlife conservation (Geist, 1988). By 2001, additional concepts had been incorporated, leading to the development of what is now known as the NAMWC (Geist et al., 2001). The model comprises seven primary principles of wildlife conservation, which have been explained, enhanced, and clarified in recent years (Organ, 2018; Organ et al., 2012; Organ & McCabe, 2018). The seven principles are as follows.
1. Wildlife resources are held in the public trust. The first principle of the NAMWC states that wildlife belongs to the collective citizenry rather than a sovereign entity, with states bearing the responsibility to regulate and preserve these natural resources for future generations (Palmer & Bryant, 1985). The PTD underpins the NAMWC and is regarded as a crucial legal, policy, programmatic, and scientific framework that has facilitated the conservation and restoration of wildlife populations in the U.S. and Canada (Geist et al., 2001; Geist & Organ, 2004). However, the PTD and its support for the NAMWC may be jeopardized by societal shifts, government policies, case law (Organ et al., 2012), and initiatives to commercialize and privatize fish and game resources (Organ & Batcheller, 2010).
2. Markets for game were eliminated. Game markets were eradicated after years of unregulated market hunting that led to significant declines in species hunted for meat, hides, and feathers. Consequently, laws have been enacted and proposed to restrict and, in some instances, completely ban market hunting and poaching (Organ, 2018; Organ & McCabe, 2018). However, the markets for furbearers and certain commercial fisheries are
exceptions to this rule, as they are stringently regulated and adhere to conservation standards that ensure the sustainability of animals and their habitats (Organ et al., 2012; White et al. 2015).
3. Allocation of wildlife is by law. Although states may differ in their regulations concerning certain animals, each state has a legal framework that ensures impartial access to and protection of wildlife (Organ et al., 2012). Access to wildlife is not determined by citizens' social class or status (Geist, 1995; Geist et al., 2001), and it is essential that agencies and all types of stakeholders have the opportunity to contribute to a transparent decision-making process (Decker et al., 2015; Jacobsen & Decker, 2008; Jacobsen et al., 2010).
4. Wildlife can only be killed for legitimate purposes. North American laws and regulations outline the specific circumstances under which wildlife may be killed (Geist, 1995, 1988). State laws detail which animals can be legally taken, the methods by which they can be taken, and the seasons and limits for species that can be harvested. It is important to note that some species are not protected by regulations in certain states (Organ et al., 2012), whereas others are entirely protected from being harvested.
5. Wildlife is an international resource. Conservation leaders in the U.S. and Canada have recognized the necessity of international collaboration for the preservation of migratory species. Subsequently, policymakers acknowledged that international wildlife trade could significantly harm certain species (Organ, 2018; Organ & McCabe, 2018). In 1973, 80 countries signed the Convention on International Trade in Endangered Species of Wild Fauna and Flora (CITES). This international agreement aims to ensure that the global trade of wildlife and plants does not threaten the survival of any species. Currently, the U.S. is among the 184 countries that are CITES contracting parties.
6. Science is the proper tool for discharging wildlife policy. Policymakers and conservation management officials within wildlife agencies must be adept at observing and assessing wildlife populations and understanding how habitats and other factors influence them. They should rely on scientific evidence when forming policy and management decisions and make the rationale behind these decisions accessible to citizens interested in understanding the implementation of specific techniques, policies or regulations. Given that wildlife conservation can be a political issue, the extent to which science is integrated into policy varies across states (Organ et al., 2012).
7. Democracy of hunting is standard. In the U.S. and Canada, hunting is accessible to all citizens who purchase the necessary licenses and tags (Organ et al., 2012). Each state operates a licensing system that permits individuals in good legal standing to hunt wildlife lawfully, although certain species may be subject to tag lotteries (Organ, 2018; Organ & McCabe, 2018).
Conservation Organizations
The resurgence and recovery of America's wildlife stand as a testament to the commitment of early conservationists who recognized the pressing need to safeguard the nation's natural resources. In the late 19th and early 20th centuries, unchecked market hunting, habitat destruction, and rapid industrial growth drove many species to the brink of extinction. In response, a coalition of concerned hunters, naturalists, and policymakers established organizations that championed wildlife conservation through political advocacy, scientific management, and public awareness. Supported by influential outdoor publications and prominent figures, these groups have played a pivotal role in shaping modern conservation policies. From B&C’s efforts in crafting game laws and national parks to WMI’s promotion of science-based conservation, these organizations used their influence to create a framework for wildlife recovery. Similarly, AFWA, Sierra Club, National Audubon Society, and Campfire Club helped galvanize public support and advocated for stronger regulations, demonstrating that conservation is not only a responsibility but also a necessity for future generations.
Boone and Crockett Club
Early hunting laws and regulations in the U.S. were partly established and supported by the efforts of organized clubs and interest groups comprised of hunters (Linder, 1988). Among these was the B&C, founded in 1887 by President Theodore Roosevelt and George Bird Grinnell, who also served as editor and president of Forest and Stream magazine and played a key role in the restoration of Yellowstone bison. The early B&C members were influential, affluent men with political connections who effectively contributed to addressing conservation issues affecting big game (Organ & McCabe, 2018; Ward & McCabe, 1988). In 1897, Roosevelt sponsored Gifford Pinchot, a member of the National Forest Commission, into the B&C. Like Roosevelt, Pinchot advocated for the government’s regulation of public land and resources, guided by sound science. Pinchot went on to lead the Division of Forestry and later became chief of the newly established U.S. Forest Service (B&C, n.d.a). At a time when most people were indifferent to the ethics of hunting, B&C championed ethical hunting under the "fair chase" model for big game, aiming to conserve wildlife for future generations (Paz & Heffelfinger, 2018).
Wildlife Management Institute
Founded in 1911 by sportsmen and businessmen, WMI was established to restore and conserve habitats and wildlife populations, some of which were experiencing significant decline (WMI, n.d.).
Originally known as the American Game Protective and Propagation Association, WMI was formed after H. S. Leonard of Winchester Repeating Arms Company reached out to B&C members, offering financial backing from a consortium of ammunition and firearms companies to specifically tackle the decline of game animals. John Burnham, a B&C member, was the first to lead this organization, with Roosevelt and Grinnell serving as honorary members. Unlike other conservation non-profits, WMI is not made up of large groups of outdoor enthusiasts; instead, it consists of a small group of wildlife professionals who collaborate with state, provincial, and federal agencies, other nonprofits, and outdoor gear manufacturers to enhance wildlife management and conservation
strategies. At WMI’s inaugural North American Wildlife Conference in 1935, B&C member J. N. “Ding” Darling proposed uniting over 6,000 hunting and conservation clubs across the nation. His vision materialized in 1936 with the establishment of the National Wildlife Federation, which was dedicated to promoting conservation ethics and safeguarding wildlife for future generations (B&C, n.d.c). Today, WMI’s monthly newsletter, the Outdoor News Bulletin, keeps readers informed about evolving conservation and wildlife policies, state action plans, and other scientific analyses of contemporary conservation issues (United States Geological Survey, n.d.).
Association of Fish & Wildlife Agencies
In 1887, Michigan pioneered the establishment of the first full-time paid state law enforcement role dedicated to enforcing wildlife statutes. By the early 1900s, numerous other states had followed suit and created their own agencies to uphold wildlife laws (Falcone, 2004). In 1902, the National Association of Game and Fish Wardens, now known as AFWA, was founded (Paz & Heffelfinger, 2018). Although New York had been charging fees for hunting licenses since 1864, several other states introduced systems for resident and non-resident hunting licenses and permits during this period. The revenue generated from these licenses is primarily allocated to fund law enforcement and protect certain game species (Paz & Heffelfinger, 2018).
Sierra Club
Despite their differing views on hunting, Roosevelt was receptive to the ideas and perspectives of leading preservationists. For instance, in 1903, he toured Yosemite with John Muir, known as the "Father of the National Parks." Muir co-founded the Sierra Club in 1892, aiming to restore and protect the environment by educating the public and promoting the responsible use of natural resources (Sierra Club, n.d.). During his visit with Muir, Roosevelt witnessed firsthand the mismanagement of Yosemite's resources by the state and concurred with Muir that the area would be better managed by the federal government (Minteer & Pyne, 2012).
National Audubon Society
The National Audubon Society, founded in 1905 and named after the renowned artist and author John James Audubon, originated from a coalition of state Audubon Societies dedicated to protecting birds and their habitats. Members of the B&C, Frank Chapman and Roy Chapman Andrews, played a crucial role in establishing this organization (B&C, n.d.c), which continues to focus on restoring and conserving ecosystems. A common misconception is that the National Audubon Society opposes bird hunting, but this is inaccurate. As Sundstrom (2017) notes, birders within the Society generally acknowledge that both non-hunting birders and bird hunters share the same commitment and mission to conserve habitats. Moreover, they understand that waterfowl hunters contribute tens of millions of dollars annually to wetland conservation through the purchase of migratory bird stamps.
Ducks Unlimited
Ducks Unlimited emerged as one of the most influential conservation organizations in the early 20th century. Founded in 1937 by a group of waterfowl hunters concerned about the alarming loss of wetlands, which are critical breeding and migration habitats for ducks and geese, Ducks Unlimited has made significant strides in conservation. Primarily funded by hunters and outdoor enthusiasts, the organization employs science-based management techniques to restore and conserve waterfowl habitats and wetlands, which also benefit other wildlife species (Ducks Unlimited, n.d.). Additionally, Ducks Unlimited undertakes large-scale habitat restoration projects across North America, collaborating with private landowners, government agencies, and conservation partners to protect millions of acres of wetlands. The organization has excelled in showcasing the power of grassroots activism, scientific management, and political advocacy to secure the future of America’s natural heritage.
National Wildlife Federation
The National Wildlife Federation was founded in 1936 by Jay Norwood “Ding” Darling, an editorial cartoonist and conservationist who saw the need for a unified voice for conservation in the U.S.
With the backing of President Franklin D. Roosevelt, Darling organized the first North American Wildlife Conference, which brought together sportsmen, scientists, and policymakers to tackle the widespread decline in wildlife populations. This effort led to the creation of the National Wildlife Federation, a national coalition of state-based organizations committed to promoting wildlife conservation, habitat protection, and environmental education (National Wildlife Federation, n.d.). Through its advocacy and public outreach, the National Wildlife Federation has significantly influenced conservation legislation, including the passage of the Federal Aid in Wildlife Restoration Act (Pittman-Robertson, or PR Act), which secured dedicated funding for wildlife restoration through excise taxes on firearms and ammunition.
Camp Fire Club of America
The Camp Fire Club of America was another significant early conservation organization. Both Roosevelt and Pinchot were members of this club, established in 1897 to unite hunters, anglers, naturalists, and other outdoor enthusiasts to promote conservation, hunting, and outdoor skills. The Camp Fire Club of America advocated for "a duty of good citizenship" in conserving natural resources. Initially, Forest and Stream magazine served as the organization's newsletter (Camp Fire Conservation Club, n.d.). Alongside other early outdoor publications, such as American Sportsman, Field and Stream, and American Angler, it played a crucial role in informing stakeholders about contemporary ideas and policies for wildlife and habitat restoration and conservation.
Federal Wildlife Laws & Treaties
In 1900, the Lacey Act (Appendix E) marked the first federal legislation aimed at protecting wildlife by banning the import of harmful species and the interstate shipment of illegally obtained game or its parts (Anderson, 1995; Sosnowski et al., 2022). Roughly a decade later, the Federal Migratory
Bird Law, known as the Weeks-McClean Act of 1913, was introduced. This law, which evolved into the Migratory Bird Treaty Act of 1918 in collaboration with other countries, was designed to regulate the hunting, marketing, and importation of migratory birds and their feathers. In 1934, the Migratory Bird Hunting and Conservation Stamp Act, commonly referred to as the Duck Stamp Act, was implemented to aid in the conservation of wetland habitats for waterfowl by mandating that hunters purchase federal waterfowl hunting stamps (Cohen & Altman, 2021).
Until the 1930s, state wildlife conservation efforts primarily revolved around enforcing laws that focused on bag limits and hunting seasons, with few wildlife management programs in place. Most wildlife professionals were engaged in fishing, hunting, and trapping. Recognizing the need for active strategies to restore wildlife habitats and populations, state agencies began collaborating with universities and hiring specialists to incorporate biological and environmental science into their wildlife management plans (Whalen & Thompson, 2015). For instance, Olaus Murie, known as the “Father of Modern Elk Management,” worked with various state and national agencies and organizations from the 1920s to the 1940s. He and his wife Mardy understood the reciprocal relationship between predator and prey populations and used this insight to offer recommendations for improving wildlife management practices (Glover, 1989).
In 1933, Aldo Leopold, a B&C associate member and esteemed wildlife management expert, assumed the role of Professor of Game Management at the University of Wisconsin-Madison. His extensive experience with the U.S. Forest Service, and as the director of the university's forestry lab, rendered his guidance invaluable to both students and professionals (Frese, 2003). Despite this, many state wildlife agencies faced financial constraints, as they were largely funded by hunting and fishing licenses. Fortunately, in 1937, the passage of the PR Act bolstered agency funding by allocating funds for state wildlife management and restoration, as well as hunter education through excise taxes on firearms and ammunition. Similarly, the Federal Aid in Sport Fish Restoration Act (Dingell-Johnson or DJ Act) was enacted in 1950, directing funds from excise taxes on fishing equipment to assist states in conserving fishery resources (Regan & Williams, 2018). In 1980, the Wallop-Breaux amendment to the DJ Act added a portion of the motor fuel tax to the Sport Fish Restoration account. This amendment was based on the amount of taxable highway fuel sold but used for off-road purposes, aiming to track motorboat fuel usage. These Acts and their amendments are now collectively known as the Wildlife and Sport Fish Restoration Program (WSFR), which operates under the USFWS Office of Conservation Investment.
State Wildlife Agencies
In 1866, Massachusetts and New Hampshire pioneered the establishment of state conservation agencies by forming fisheries commissions. By the late 1870s, the terms "game" and "wildlife" were incorporated into the names of these state agencies. On a federal level, the United States Commission of Fish and Fisheries was established in 1871 to evaluate and offer recommendations for food fish. Over time, as its responsibilities expanded, this agency evolved into the U.S. Fish and Wildlife Service (USFWS) in 1939 (USFWS, n.d.a). By 1880, all existing states had enacted some
form of hunting laws, although these were not widely respected by citizens until the 1890s (Organ & McCabe, 2018).
The growing mission of state wildlife agencies has sparked widespread interest in wildlife conservation and management. Thousands of studies have been conducted on wildlife management, contributing to the development of modern fish and wildlife conservation policies through consultations with or working for state agencies (Organ & McCabe, 2018). Conservation management and wildlife biology programs are now available to anyone interested in wildlife, whether through hunting, trapping, or other outdoor activities (Organ et al., 1998; Organ & Fritzell, 2000). Although many state conservation efforts continue to be funded primarily through hunting and fishing license sales and excise taxes on firearms, ammunition, and fishing equipment (Batcheller et al., 2018; Organ, 2018), contemporary conservation management programs aim to sustain wildlife populations and address issues such as wildlife overpopulation, which could lead to species problems and human-wildlife conflicts (Heffelfinger et al., 2013).
Modern conservation laws and regulations are grounded in the rule of law and public ownership of wildlife. The management of wildlife through the establishment and enforcement of these laws and regulations has led to the protection, recovery, and restoration of numerous species that were once on the brink of extinction before the establishment of fish and wildlife agencies tasked with their care (Organ et al., 2012). Although retrospective rather than prescriptive in nature, the NAMWC clearly impacts hunters, trappers, and anglers, with its aim to conserve wildlife for the benefit of everyone hunters, trappers, anglers, and wildlife watchers alike ensuring its enjoyment by future generations (Brown, 2018). As hunting, fishing, and trapping can directly reduce wildlife populations, a key aspect of the NAMWC's seven principles is to provide sciencebased regulated access to these pursuits. Wildlife management and conservation plans are jeopardized when laws are violated. In most contemporary agencies, conservation law enforcement takes various forms. Officers are often required to work extended hours during periods when hunters, anglers, trappers, and boaters are most active in outdoor pursuits. Furthermore, many states either request or mandate that officers fulfill general policing duties.
Enforcement of Conservation Laws
For many non-wildlife related crimes, implementing some form of guardianship, such as monitored security systems with video surveillance, is a straightforward way to deter potential offenders by increasing the risk of apprehension. However, this approach is not as easily applicable to the illegal hunting of big game, primarily because of the environments in which these activities occur. Many of these non-wildlife crimes involve identifiable human victims, allowing for interviews and data collection from that perspective. Unfortunately, wildlife crimes are often perceived as "victimless" and are taken less seriously, largely because no single individual is directly harmed. The illegal taking of wildlife is akin to the theft of public property, where the "victim" is the collective body of U.S. citizens.
Wildlife crimes, such as illegal take and other breaches of hunting, fishing, and trapping regulations, can significantly harm wildlife populations, diminish the hunting experience, and
affect social acceptance among hunters and non-hunters. Although extensive research has explored the impact of global wildlife trafficking, which generates billions of dollars annually in illegal income for offenders (Kurland et al., 2017; Zimmerman, 2003), only in the past two decades have scholars begun to focus on issues related to domestic wildlife crime. Most publications on domestic wildlife crime concentrate on the typologies or motivations of violators, as well as the occupational reactions and responsibilities of conservation officers (Blevins & Edwards, 2009; Carter, 2004; Clifford, 1998; Eliason, 2003a; 2003b; 2004; 2007; 2008; Falcone, 2004; Forsyth et al., 1998; Green, 2002; Green et al., 1988; Lanham, 2013; Muth & Bowe, 1998; Serenari & Peterson, 2016; Shelley & Crow, 2009; Sherblom et al., 2002; Weisheit et al., 2006). However, few studies have directly explored the impacts on conservation or the financial consequences arising from violations of state fish and wildlife laws.
The Trustees
The NAMWC is based on the PTD, which establishes a trustee relationship in which the government holds and manages wildlife for the benefit of the public (Batcheller et al., 2010; Geist et al., 2001; Geist & Organ, 2004; Organ et al., 2012; Organ & McCabe, 2018). This makes all citizens stakeholders in the ownership and responsible conservation of fish and wildlife resources. All the collective “owners” of our country’s natural resources benefit, either directly or indirectly, from healthy and sustainable fish and wildlife populations and habitats The nature of the relationships among stakeholders and trustees may vary significantly depending on their interests, motives, and involvement in wildlife population and habitat protection and management (Jacobsen et al., 2010). For example, hunters, anglers, recreational shooters, and boaters provide most of the direct financial support for state agency conservation actions through the purchase of hunting and fishing licenses and permits, as well as excise taxes on products (firearms, ammunition, archery equipment, fishing tackle, and boat fuel) (USFWS, n.d.b). Of these groups, hunters and anglers are most directly tied to the conservation model because they also pursue sustainable numbers of certain wildlife populations for food, recreation, and other purposes. While landowners can sometimes appear conflicted over the private versus public aspects (e.g., public wildlife using private lands) of the PTD (Watson, 2012), they are also tied closely to the model because most wildlife species reside or spend significant time on private land, especially in the eastern U.S.
As the elected and/or appointed officials of the government, the federal and state legislative bodies, as well as executive branch leadership, are the trustees charged with resource protection. However, the operational aspects of this trust responsibility are almost always delegated to professional wildlife managers, or trust managers, who are responsible for the day-to-day care and protection of those resources. Trust managers often include state and federal wildlife biologists, land management professionals, law enforcement officers, and other agency staff (Decker et al., 2015; Smith, 2011). In most cases, resource protection from illegal take is relegated to law enforcement divisions of agencies. Conservation officers or game wardens within these divisions have the primary responsibility of enforcing laws designed to conserve and protect wildlife,
habitats, landscapes, and other natural areas across the U.S. (Forsyth, 2008; Hall, 1992; Lanham, 2013; Paz & Heffelfinger, 2018; Shelley & Crow, 2009).
Several significant barriers hinder the effective enforcement of fish and wildlife laws. Often, the law enforcement divisions within an agency are deficient in the resources needed to effectively police areas where illegal take most often occurs. This includes insufficient personnel, lack of equipment, and/or inadequate training. Corruption, while not as common in the U.S. as in developing countries, may also occur at the agency, prosecutorial, or judicial levels. There is also a significant perceived lack of seriousness associated with wildlife crimes by policymakers, the judiciary, and the public. Finally, there is a severe level of underreporting or even a lack of detection (Dark Figure) for fish and wildlife crimes (Wellsmith, 2011).
Under the PTD, trustees, typically government agencies, are charged with the responsibility of managing wildlife resources in trust for the benefit of present and future generations (Batcheller et al., 2010; Geist et al., 2001; Geist & Organ, 2004). This trustee role is essential for ensuring that wildlife remains for the common good, not subject to private ownership, but instead managed for the collective welfare of society (Decker et al., 2015). Trustees must operate with fidelity to the principles of public trust administration, which requires them to make objective, science-based policy decisions while maintaining transparency and public accountability. For instance, state wildlife agencies are primarily responsible for managing game and non-game species under this framework and for implementing policies that balance ecological sustainability with the varied interests of stakeholders (Riley et al., 2018). In the case of migratory or critically imperiled wildlife or fish species, the USFWS and/or the National Oceanic and Atmospheric Administration act as trustees. Other federal and state land management agencies may also function as trustees, depending on specific laws, regulations, and other restrictions. As ecological and societal conditions evolve, trustees must adapt their management approaches while resisting the undue influence of special-interest groups, which could compromise the broader public interest (Jacobson et al., 2010). The effectiveness of trustees in fulfilling their obligations under the PTD depends not only on their adherence to sound governance principles but also on their ability to secure sustainable funding sources and foster public trust in their decision-making processes (Organ & Fritzell, 2000).
State Fish and Wildlife Agencies
State fish and wildlife agencies collectively function as the primary stewards of fish and wildlife resources within their respective jurisdictions (Batcheller et al., 2018; Jacobsen et al., 2010; Organ & Batcheller, 2010; Organ et al., 2012; Organ & McCabe, 2018). These agencies are tasked with conserving, protecting, and enhancing fish, wildlife, and their habitats for the public benefit. Their responsibilities include establishing hunting, fishing, and trapping regulations based on sciencebased population management; protecting critical habitats, such as wetlands and riparian zones; and enforcing state wildlife laws to prevent illegal take and poaching. State agencies administer programs funded through federal excise taxes, such as the PR and DJ Acts, along with state hunting and fishing license revenues (USFWS, n.d.b). They also conduct public outreach and education programs to foster conservation awareness and ensure recreational opportunities for hunters,
anglers and wildlife enthusiasts. Represented nationally by AFWA, state agencies collaborate with federal and regional partners to manage interjurisdictional species and address cross-boundary conservation challenges.
United States Fish and Wildlife Service
The USFWS is the primary federal agency responsible for conserving, protecting, and enhancing threatened, endangered, and migratory fish and wildlife, as well as their habitats, for the benefit of current and future generations (USFWS, n.d.a). The USFWS also oversees the National Wildlife Refuge System and Waterfowl Production Areas, which are a network of lands and waters dedicated to wildlife conservation. The USFWS enforces key federal laws, such as the Endangered Species Act, Migratory Bird Treaty Act, and Lacey Act (Appendix E), to safeguard vulnerable species and ecosystems. Additionally, the agency administers grant programs, including the WSFR Program, which channels excise tax revenues generated under the PR and DJ Acts into state-led conservation efforts.
National Oceanic and Atmospheric Administration Fisheries
The National Oceanic and Atmospheric Administration Fisheries, also known as the National Marine Fisheries Service, is tasked with conserving and managing marine fisheries, ecosystems, and protected species in U.S. coastal waters and beyond (National Oceanic and Atmospheric Administration Fisheries, n.d.). The National Oceanic and Atmospheric Administration Fisheries operates under key mandates, such as the Magnuson-Stevens Fishery Conservation and Management Act, the Marine Mammal Protection Act, and the Endangered Species Act, to promote sustainable fisheries and protect marine biodiversity. This agency works to recover depleted fish stocks, safeguard marine mammals and sea turtles, and monitor oceanic habitats through science-based policies and ecosystem-based management.
United States Forest Service
The United States Forest Service manages 193 million acres of national forests and grasslands, playing a central role in conserving fish and wildlife habitats while supporting public recreation, timber harvest, and watershed protection (United States Forest Service, n.d.). The agency’s mission is to sustain the health, diversity, and productivity of these lands for the benefit of current and future generations. By employing ecosystem-based management strategies, the United States Forest Service prioritizes the restoration of degraded habitats, protection of watersheds, and recovery of fish and wildlife species, including threatened and endangered populations.
Bureau of Land Management
The Bureau of Land Management oversees 245 million acres of public land, primarily in the western United States, with a mission to sustain the health, diversity, and productivity of these lands for present and future generations (Bureau of Land Management, n.d.). The Bureau of Land Management balances the multiple uses of public land, including wildlife conservation, recreation, grazing, and natural resource extraction, while protecting critical habitats for fish, wildlife, and
plant species. Key initiatives include the management of riparian areas, watersheds, and threatened and endangered species, as well as the mitigation of the impacts of resource development.
National Park Service
The National Park Service protects resources within the National Park System, preserving the ecological integrity of landscapes, ecosystems, and species for public enjoyment and education (National Park Service, n.d.). Its mission is to ensure that natural and cultural resources remain unimpaired for future generations, thereby reinforcing public collective ownership of these resources. In addition to habitat protection, the National Park Service emphasizes environmental education and recreational opportunities, thereby promoting an understanding of conservation values.
The Grantors (Stakeholders)
As PTD beneficiaries, stakeholders, including hunters, conservationists, landowners, and the general public, play a crucial role in shaping wildlife conservation policies. While trustees are tasked with resource management, stakeholders provide input, demand accountability, and ensure that conservation efforts align with societal values and expectations (Decker et al., 2015). Public engagement in decision-making is essential because stakeholder perspectives influence regulatory frameworks, funding mechanisms, and conservation priorities. For example, the decline in hunting participation has led to shifts in funding models for wildlife agencies, necessitating broader public investment beyond traditional user fees (Organ & Fritzell, 2000, Pauley et al., 2022). Additionally, increasing urbanization and demographic changes have diversified the range of stakeholders involved in conservation, requiring state agencies to incorporate different perspectives into their management strategies (Riley et al., 2018). However, while active participation enhances democratic governance, it also presents challenges when competing interests arise, necessitating a balance between public input and the need for trustees to make independent, science-driven decisions (Jacobson et al., 2010). Effective stakeholder engagement is fundamental to the PTD’s long-term sustainability, reinforcing the shared responsibility of the government and the public in conserving America’s wildlife heritage.
Hunters and Anglers
Hunters and anglers represent a foundational group of stakeholders that contribute directly to the conservation and management of wildlife and fisheries resources in the U.S. through the purchase of hunting and fishing licenses, as well as the payment of excise taxes on firearms, ammunition, fishing equipment, and motorboat fuel under the PR and DJ Acts. Through their purchases, hunters and anglers provide critical funding that supports habitat protection, population monitoring, and sustainable harvest management of native wildlife and fisheries. These stakeholders have a vested interest in ensuring the long-term health of fish and wildlife populations because their outdoor pursuits rely on the availability of abundant and well managed species. In addition to their economic contributions, hunters and anglers often play an active role as conservation advocates,
participating in habitat restoration projects, species reintroduction efforts, and policy development processes that further align management priorities with ecological sustainability (Kisonak, 2021; Lueck & Parker, 2022).
Private Landowners
Private landowners, including farmers, ranchers, and forest owners, are essential stakeholders in the management of wildlife and fisheries resources, as a significant portion of wildlife and its habitats is found on private lands. These individuals often balance land use for agriculture, forestry, and development with the need to provide habitats for fish and wildlife species. Landowners play a critical role in conservation through voluntary participation in programs such as the Conservation Reserve Program, Wetlands Reserve Program, and other state and federal incentives that support habitat restoration, water quality improvement, and species recovery. Their interest in trust relationships stems from their ability to preserve biodiversity, maintain ecosystem services (e.g., pollination, soil health, and water retention), and ensure that wildlife coexist with productive land use. Collaborative partnerships with government agencies and nonprofits enable landowners to steward their land in ways that benefit both their livelihoods and public trust resources (Kay, 2022).
Benign Conservationists
Benign Conservationists represent a significant, yet often overlooked, group within the broader spectrum of conservation stakeholders. These individuals are characterized by their strong support for environmental protection and conservation efforts despite not actively engaging in outdoor recreation, such as hunting, fishing, or wildlife watching. Their connection to conservation is largely value-driven and rooted in a desire for clean air, clean water, biodiversity preservation, and ecological sustainability (Manfredo et al., 2017).
Unlike direct-use stakeholders, benign conservationists express their advocacy through support for environmental policies, donations to conservation organizations, and voting behavior that aligns with ecological sustainability (Theobald et al., 2015). This group often aligns with the principles of PTD, as they view wildlife and natural resources as shared public goods that must be protected for future generations (Decker et al., 2015). Research suggests that as urbanization increases and direct interactions with nature decline, the proportion of individuals who identify with this category is growing, presenting both opportunities and challenges for conservation initiatives (Peterson et al., 2021). Although they may lack the hands-on involvement of other stakeholder groups, their influence on policy, funding mechanisms, and societal attitudes toward conservation is substantial, making them essential in wildlife management and environmental governance.
Wildlife Watchers
Wildlife watchers encompass a diverse and growing group of stakeholders whose interests lie in enjoying wildlife through activities such as birdwatching, photography, and wildlife observation. Their engagement drives significant economic contributions through expenditures on equipment,
travel, and access to natural spaces. Wildlife watchers value the intrinsic and ecological roles of fish and wildlife species and advocate for their protection and preservation. As stakeholders, they emphasize the importance of biodiversity, habitat connectivity, and the ethical stewardship of public trust resources to ensure that opportunities for viewing and interacting with wildlife remain accessible for future generations. Their collective voice often amplifies support for species recovery efforts, the designation of protected areas, and policies that minimize human impact on natural ecosystems (Kisonak, 2021).
Outdoor and Nature Enthusiasts
Outdoor and nature enthusiasts include individuals and groups who engage in a wide array of recreational activities, such as hiking, camping, kayaking, trail riding, and climbing, all of which are closely tied to healthy and well-managed ecosystems. This group’s interests primarily rely on intact habitats, clean water, and diverse wildlife populations for recreational and outdoor enjoyment. Their activities contribute to local and national economies by driving tourism and outdoor recreation industries, while their advocacy often focuses on protecting access to public land, mitigating environmental degradation, and preserving the ecological integrity of the natural landscape. Outdoor enthusiasts play a key role in fostering public appreciation for fish, wildlife, and their habitats by promoting sustainable outdoor practices and supporting conservation initiatives, thereby ensuring that these resources are maintained for their recreational and aesthetic value (Kisonak, 2021).
General Public
The public serves as the collective “owner” of wildlife and fisheries resources under the PTD, with a shared interest in their protection, access, and sustainable use. As beneficiaries of the ecological, cultural, and recreational services provided by healthy ecosystems, the public relies on the responsible stewardship of fish and wildlife resources to ensure their continued availability. Public interest includes access to outdoor recreation, aesthetic enjoyment of natural areas, and ecosystem services provided by fish and wildlife habitats, such as clean air, water, and climate regulation. The public also supports the conservation of species and habitats because of their intrinsic value, recognizing the interconnectedness between human well-being and ecological integrity. Public engagement in wildlife policy, education, and advocacy strengthens the collective responsibility to hold trustees accountable for managing resources in alignment with the public trust mandate, thereby ensuring equitable and sustainable benefits for current and future generations (Batcheller et al., 2010; Decker et al., 2014).
Literature Cited
Anderson, R. S. (1995). The Lacey Act: America’s premier weapon in the fight against unlawful wildlife trafficking. Public Land and Resources Law Review, 16, 29-85.
Batcheller, G. R., Bambery, M. C., Bies, L., Decker, T., Dyke, S., Guynn, D., McEnroe, M., O’Brien, M., Organ, J. F., Riley, S. J., & Roehm, G. (2010). The Public Trust Doctrine: Implications for
wildlife management and conservation in the United States and Canada. Technical Review 10-1. The Wildlife Society.
Batcheller, G. R., Decker, T. A., & Lanka, R. P. (2018). Public Trust Doctrine and the legal basis for state wildlife management. In T. J. Ryder (Ed.), State wildlife management and conservation (pp. 24-38). Johns Hopkins University Press in association with The Wildlife Society.
Blevins, K. R., & Edwards, T. D. (2009). Wildlife crime. In J. Mitchell Miller (Ed.), 21st Century Criminology (pp. 557-563). Sage.
Boone and Crockett Club (B&C). (n.d.a). B&C member spotlight – Gifford Pinchot. https://www.boonecrockett.org/bc-member-spotlight-gifford-pinchot
Boone and Crockett Club (B&C). (n.d.b). Hunters and poachers are not brothers – Hunt fair chase. https://www.boone-crockett.org/hunters-and-poachers-are-not-brothers-hunt-fair-chase.
Boone and Crockett Club (B&C). (n.d.c). Roots of conservation groups: B&C impact series. https://www.boone-crockett.org/roots-conservation-groups-bc-impact-series
Brown, R. D. (2018). The need for wildlife conservation and policy. In B. D. Leopold, W. B. Kessler, & J. L. Cummins (Eds.), North American wildlife policy and law (pp. 5-17). Boone and Crockett Club.
Bureau of Land Management (BLM). (n.d.). Our mission. https://www.blm.gov/about/our-mission. Camp Fire Conservation Fund. (n.d.). The legacy. https://www.campfirefund.org/about/the-legacy/.
Carter, T. J. (2004). Force against and by game wardens in citizen encounters. Police Quarterly, 7(4), 489-508.
Clifford, M. (1998). Environmental crime: Enforcement, policy, and social responsibility. Aspen. Cohen, J. I., & Altman, S. (2021). An historical analysis of United States experiences using stampbased revenues for wildlife conservation and habitat protection. Discover Sustainability, 2(24), 1-16.
Decker, D. J., Forstchen, A. B, Organ, J. F., Smith, C. A., Riley, S. J., Jacobson, C. A., Batcheller, G. R., & Siemer, W. F (2014) Impacts management: an approach to fulfilling public trust responsibilities of wildlife agencies Wildlife Society Bulletin, 38, 2–8
Decker, D. J., Forstchen, A. B., Pomeranz, E. F., Smith, C. A., Riley, S. J., Jacobson, C. A., Organ, J. F., & Batcheller, G. R. (2015). Stakeholder engagement in wildlife management: Does the Public Trust Doctrine imply limits? Journal of Wildlife Management, 79(2), 174-179.
Decker, D. J., Riley, S. J., Siemer, W. F., & Organ, J. F. (2016). Human dimensions of wildlife management (3rd ed.). Johns Hopkins University Press.
Ducks Unlimited (DU). (n.d.). About Ducks Unlimited. https://www.ducks.org/about-ducksunlimited.
Eliason, S. L. (2003a). Illegal hunting and angling: The neutralization of wildlife law violations. Society & Animals, 11, 225-243.
Eliason, S. L. (2003b). Throwing the book versus cutting some slack: Factors influencing the use of discretion by game wardens in Kentucky. Deviant Behavior, 24, 129-152.
Eliason, S. L. (2004). Accounts of wildlife law violators: Motivations and rationalizations. Human Dimensions of Wildlife, 9, 119-131.
Eliason, S. L. (2007). From wildlife specialist to police generalist? The scope of nonwildlife violations encountered by conservation officers. Southwest Journal of Criminal Justice, 4, 120-132.
Eliason, S. L. (2008). Wildlife crime: Conservation officers’ perceptions of elusive poachers. Deviant Behavior, 29, 111-128.
Eliason, S. (2012a). From the King's deer to a capitalist commodity: A social historical analysis of the poaching law. International Journal of Comparative and Applied Criminal Justice, 36(2), 133-148.
Falcone, D. (2004). America’s conservation police: Agencies in transition. Policing: An International Journal of Police Strategies & Management, 27, 56-66.
Forsyth, C. J. (2008). The game of wardens and poachers. Journal of Rural Social Sciences, 23(2), 43-53.
Forsyth, C. J., Gramling, R., & Wooddell, G. (1998). The game of poaching: Folk crimes in southwest Louisiana. Society and Natural Resources, 11, 25-38.
Frese, S. J. (2003). Aldo Leopold: An American prophet. The History Teacher, 37(1), 99-118.
Geer v. Connecticut, 161 U.S. 519 (1896)
Geist, V. (1988). How markets in wildlife meat and parts, and the sale of hunting privileges, jeopardize wildlife conservation. Conservation Biology, 2(1), 15-26.
Geist, V. (1995). North American policies of wildlife conservation. In V. Geist & I. McTaggert-Cowan (Eds.), Wildlife conservation policy (pp. 77-129). Detselig Press.
Geist, V., Mahoney, S. P., & Organ, J. F. (2001). Why hunting has defined the North American Model of Wildlife Conservation. Transactions of the North American Wildlife and Natural Resources Conference, 66, 175-185.
Geist, V., & Organ, J. F. (2004). The public trust foundation of the North American Model of Wildlife Conservation. Northeast Wildlife, 58, 49-56.
Glover, J. M. (1989). Thinking like a wolverine: The ecological evolution of Olaus Murie. Environmental Review, 13(3-4), 29-45.
Green, G. S. (2002). The other criminalities of animal freeze-killers: Support for a generality of deviance. Society of Animals, 10, 5-30.
Green, G. S., Phillips, H.J., & Black, S.K. (1988). The Georgia deer jacker. Proceedings of the Annual Conference of the Southeastern Association of Fish and Wildlife Agencies, 42, 558-565.
Hall, D. L. (1992). Compliance: The mission of wildlife law enforcement. Proceedings of the Annual Conference of the Southeastern Association of Fish and Wildlife Agencies, 46, 532-542.
Heffelfinger, J. R., Geist, V., & Wishart, W. (2013). The role of hunting in North American wildlife conservation. International Journal of Environmental Studies, 70(3), 399-413.
Jacobsen, C. A., & Decker, D. J. (2008). Governance of state wildlife management: reform and revive or resist and retrench? Society and Natural Resources, 21(5), 441-448.
Jacobsen, C. A., Organ, J. F., Decker, D. J., Batcheller, G. R., & Carpenter, L. (2010). A conservation institution for the 21st century: implications for state wildlife agencies. Journal of Wildlife Management, 74(2), 203-209.
Kay, K. (2022). “Performing developability:” Generating threat and value in private land conservation. Geoforum, 128, 37-45.
Kisonak, L. (2021). Long crises, short Crises, and public investment in state fish and wildlife conservation. Natural Resources and Environment, 35(3), 31-37.
Kurland, J., Pires, S. F., McFann, S. C., & Moreto, W. D. (2017). Wildlife crime: A conceptual integration, literature review, and methodological critique. Crime Science, 6, 1-15.
Lanham, C. M. (2013). Occupational roles and practices of Kentucky conservation officers. Master’s thesis. Eastern Kentucky University.
Lazarus, R. J. (1986). Changing conceptions of property and sovereignty in natural resources: Questioning the public trust doctrine. Iowa Law Review, 71, 631–716.
Leopold, B. D. (2018a). History of wildlife policy and law through colonial times. In B. D. Leopold, W. B. Kessler, & J. L. Cummins (Eds.), North American wildlife policy and law (pp. 19-25) Boone and Crockett Club.
Leopold, B. D. (2018b). Wildlife Ownership. In B. D. Leopold, W. B. Kessler, & J. L. Cummins (Eds.), North American wildlife policy and law (pp. 27-29). Boone and Crockett Club.
Linder, D. O. (1988). Are all species created equal? And other questions shaping wildlife law. Harvard Environmental Law Review, 12, 157-200.
Lueck, D., & Parker, D. P. (2022). Federal funding and state wildlife conservation. Land Economics, 98(3), 461-477.
Lund, T. A. (1980). American wildlife law. University of California Press.
Manfredo, M. J., Teel, T. L., Sullivan, L., & Dietsch, A. M. (2017). Values, trust, and cultural backlash in conservation governance: The case of wildlife management in the United States. Biological Conservation, 214, 36-45.
Martin v. Waddell, 41 U.S. 367 (1842).
Miller, J. A. (2020). Game wardens, property rights, and privacy: The future of the Open Fields Doctrine. Journal of Environmental Law and Litigation, 35(2), 201–235.
Minteer, B. A., & Pyne, S. J. (2012). Restoring the narrative of American environmentalism. Restoration Ecology, 20(1), 1-6.
Muth, R. M., & Bowe, J. F. (1998). Illegal harvest of renewable natural resources in North America: Toward a typology of the motivations for poaching. Society and Natural Resources, 11, 9-24.
National Oceanographic and Atmospheric Administration (NOAA). (n.d.). About our agency. https://www.noaa.gov/about-our-agency.
National Park Service (NPS). (n.d.). About us. https://www.nps.gov/aboutus/index.htm.
National Wildlife Federation (NWF). (n.d.). Who we are. https://www.nwf.org/Outdoors/About
Organ, J. F. (2018). Poaching, wildlife trafficking, and North American wildlife conservation: Default on the Public Trust. Transactions of the North American Wildlife and Natural Resources Conference, 83, 108-112.
Organ, J. F., & Batcheller, G. R. (2010). Toward the state wildlife management institution of the future: key elements. Transactions of the North American Wildlife and Natural Resources Conference, 75, 139-142.
Organ, J. F., & Fritzell, E. K. (2000). Trends in consumptive recreation and the wildlife profession. Wildlife Society Bulletin, 38, 780-787.
Organ, J. F., Geist, V., Mahoney, S. P., Williams, S., Krausman, P. R., Batcheller, G. R., Decker, T. A., Carmichael, R., Nanjappa, P., Regan, R., Medellin, R. A., Cantu, R., McCabe, R. E., Craven, S., Vecellio, G. M., & Decker, D. J. (2012). The North American Model of Wildlife Conservation. The Wildlife Society Technical Review 12-04. The Wildlife Society.
Organ, J. F. & McCabe, R. E. (2018). History of state wildlife management in the United States. In T. J. Ryder (Ed.), State wildlife management and conservation (pp. 1-23). John's Hopkins University Press.
Organ, J. F., Muth, R. M., Dizard, J. E., Williamson, S. J., & Decker, T. A. (1998). Fair chase and humane treatment: Balancing the ethics of hunting and trapping. Transactions of the North American Wildlife and Natural Resources Conference, 63, 528-543.
Palmer, C. E., & Bryant, C. D. (1985). Keepers of the King’s deer: Game warden’s and the enforcement of fish and wildlife law. In Bryant, C. D., Shoemaker, D. W., Skipper Jr., J. K. & Snizek, W. E. (Eds.), The rural workforce: Non-agricultural occupations in America. (pp. 111137). Bergin & Harvey.
Pauley, S. P., Beres, A., Murray, N., Sumners, J. A., Witthaus, K., & Hilgedick, K. (2022). Transformation of a state fish and wildlife agency: Missouri Department of Conservation's effort to remain relevant in a changing world. Conservation Science and Practice, 4(2), e613.
Paz, G. & Heffelfinger, J. R. (2018). Enforcement of Laws and Policies. In B. D. Leopold, W. B. Kessler, & J. L. Cummins (Eds.), North American wildlife policy and law (pp. 90-101). Boone and Crockett Club.
Peterson, M. N., Peterson, T. R., Peterson, M. J., Lopez, R. R., & Silvy, N. J. (2021). Shifting societal baselines and implications for wildlife conservation. Conservation Biology, 35(2), 439–448. https://doi.org/10.1111/cobi.13632
Regan, R., & Williams, S. (2018). Evolution of funding for state fish and wildlife agencies: Promises fulfilled, promises to keep. In T. J. Ryder (Ed.), State wildlife management and conservation (pp. 54-60). Johns Hopkins University Press.
Riley, S. J., Ford, K. J., Triezenberg, H. A., & Lederle, P. E. (2018). Stakeholder trust in a state wildlife agency. Journal of Wildlife Management, 82(7), 1528-1535.
Serenari, C., & Peterson, M. N. (2016). A sociopolitical perspective on the illegal take of wildlife in the southeastern USA. International Journal of Rural Criminology, 3, 29-49.
Shelley, T. O., & Crow, M. S. (2009). The nature and extent of conservation policing: Law enforcement generalists or conservation specialists? American Journal of Criminal Justice. 34, 9-27.
Sherblom, J. C., Keranen, L., & Withers, L. A. (2002). Tradition, tension, and transformation: A structuration analysis of a game warden service in transition. Journal of Applied Communication Research, 30, 143-162.
Sierra Club. (n.d.). About the Sierra Club. https://www.sierraclub.org/about-sierra-club.
Smith, C. A. (2011). The role of state wildlife professionals under the Public Trust Doctrine. Journal of Wildlife Management, 75(7), 1539–1543.
Sosnowski, M. C., Kim, Y., Petrossian, G. A., & Asner, M. A. (2022). Profiling wildlife crimes prosecuted federally by the United States. Frontiers in Conservation Science. https://www.frontiersin.org/journals/conservationscience/articles/10.3389/fcosc.2021.811516/full
Stockdale, M. (1993). English and American wildlife law: Lessons from the past. Proceedings of the Annual Conference of the Southeastern Association of Fish and Wildlife Agencies, 47, 732739.
Sundstrom, B. (2017). Why birders and waterfowl hunters are natural allies: As wetland habitat disappears, both parties share a commitment to conservation. National Audubon Society. https://www.audubon.org/news/why-birders-and-waterfowl-hunters-are-natural-allies.
Theobald, D. M., Reed, S. E., Fields, K., & Soulé, M. (2015). Connecting natural landscapes using a landscape permeability model to prioritize conservation activities in the United States. Conservation Letters, 5(2), 123-133.
Trefethen, J. B. (1975). An American Crusade for Wildlife. New York: Winchester Press. 424
United States Fish and Wildlife Service. (n.d.a). History of the U.S. Fish and Wildlife Service. https://www.fws.gov/history-of-fws
United States Fish and Wildlife Service. (n.d.b). Office of Conservation Investment. https://www.fws.gov/program/office-conservation-investment.
United States Forest Service. (n.d.). Meet the Forest Service. https://www.fs.usda.gov/aboutagency/meet-forest-service.
United States Geological Survey. (n.d.). Wildlife Management Institute - Outdoors News Bulletin. https://www.usgs.gov/programs/cooperative-research-units/wildlife-managementinstitute-outdoors-news-bulletin.
Ward, G. B., & McCabe, R. E. (1988). Trail blazers in conservation: The Boone and Crockett Club’s first century. Records of North American big game (pp. 27-121). Boone and Crockett Club.
Warren, L. S. (1992). Poachers, conservationists, and ecosystems: Local struggles over American wildlife. Transactions of the North American Wildlife and Natural Resources Conference, 57, 711-716.
Watson, R. (2012). Public wildlife on private land: Unifying the split estate to enhance trust resources. Duke Environmental Law and Policy Forum, 23, 291-321.
Weisheit, R. A., Falcone, D. N., & Wells, L. E. (2006). Crime and policing in rural and small-town America. Waveland.
Wellsmith, M. (2011). Wildlife crime: the problems of enforcement. European Journal on Criminal Policy and Research, 17, 125-148.
Whalen, K. G., & Thompson, J. D. (2015). The cooperative research units' model: Enabling past and future-based conservation. Transactions of the North American Wildlife & Natural Resources Conference, 80, 133-141.
White, H. B., Decker, T., O’Brien, M. J., Organ, J. F., & Roberts, N. M. (2015). Trapping and furbearer management in North American wildlife conservation. International Journal of Environmental Studies, 72(5), 756-769.
Wildlife Management Institute (WMI). (n.d.). About the Wildlife Management Institute. https://wildlifemanagement.institute/about
Zimmerman, M.E. (2003). The black market for wildlife: combating transnational organized crime in the illegal wildlife trade. Vanderbilt Journal of Transnational Law, 36, 1657-1689.
This appendix contains additional information, based on direct response categories and regional comparisons from portions the stakeholder survey discussed in Chapter 2. Detailed results from the comprehensive survey of hunters, landowners, and conservation officers across the eight subject states are included to more closely evaluate stakeholder opinions concerning impacts of illegal take across the four regions.
For the items presented in this appendix, participants rated their agreement or level of concern about the impact of illegal take of big game. When asked about perceived seriousness, participants were asked to choose a factor on a 5-point Likert scale (ranging from Extremely Serious to Not at All Serious) that we designated as Direct Response Categories. Responses were analyzed by region (West, Midwest, Northeast, Southeast) with statistical comparisons between each region denoted by superscript letters. At a significance level of p ≤ 0.05, any two regions sharing the same letter were not statistically different. Although statistical comparisons apply only to the non-aggregated data presented in the tables, we designated three Aggregated Response Categories to summarize regional attitudes:
• Serious Concern = Extremely Serious responses.
• Broad Concern = Extremely Serious + Very Serious responses.
• General Concern = Extremely Serious + Very Serious + Somewhat Serious responses.
Similarly, for the items asking for levels of agreement, respondents were provided with a 7-point Likert scale (ranging from Strongly Agree to Strongly Disagree) that we designated as Direct Response Categories. Responses were analyzed by region (West, Midwest, Northeast, Southeast), with statistical comparisons between regions denoted by superscript letters. At a significance level of p ≤ 0.05, any two regions sharing the same letter were not statistically different Although statistical comparisons apply only to the non-aggregated data presented in the tables, we designated three Aggregated Response Categories to summarize regional attitudes:
Hunters were asked about their perceptions of the relative seriousness of illegal take of wildlife for certain geographic locations and about potential negative impacts that illegal take of wildlife has on certain biological or social factors. These results are presented in Tables B1 and B2.
Table B1. Hunter perceptions of the relative seriousness of illegal take of wildlife for certain geographic locations.
Hunting Lands in State of Residence
Land accessed for hunting is often closely monitored by this group because of proximity and interest. For the Direct Response Categories, a significant portion of respondents (38.3%) considered illegal take on lands where they hunt in their state of residence to be Extremely Serious (Table B1). Western hunters (44.9%) reported the highest level of concern, whereas Northeastern hunters (32.9%) expressed the lowest. Midwestern (35.7%) and Southeastern hunters (35.8%) fell in between. An additional 19.4% of the respondents rated illegal take as Very Serious. Concern was highest among Western hunters (22.7%), followed by Midwestern (17.7%), Northeastern (17.5%), and Southeastern hunters (17.7%). A smaller group of respondents (16.9%) considered illegal take to be Somewhat Serious. Western hunters (18.0%) were slightly more likely to select this level than Southeastern hunters (16.0%), while Midwestern (16.2%) and Northeastern (16.5%) hunters reported a level of concern similar to that of the other regions.
The Aggregated Response Categories produced the following results:
• Serious Concern → 38.3%: Western hunters (44.9%) showed the highest level of serious concern, while Northeastern hunters (32.9%) reported the lowest level.
• Broad Concern → 57.7%: Most hunters expressed broad concern, with Western hunters (67.6%) showing the highest level of concern and Northeastern hunters (50.3%) expressing the lowest level of concern among the regions.
• General Concern → 74.5%: A large majority of hunters indicated general concern, with Western hunters (85.7%) showing the highest level of concern and Northeastern hunters (66.8%) reporting the lowest level of concern among the regions.
State of Residence in General
Illegal take of wildlife extends beyond individual hunting areas to impact broader regions within a hunter’s state of residence. Respondents were asked to assess the seriousness of illegal take at the state level, reflecting concerns about wildlife populations, management effectiveness, and overall hunting opportunities.
A substantial proportion of respondents (38.6%) rated illegal take in their state of residence as Extremely Serious for the Direct Response Categories. Concern was highest for Western hunters (44.5%) and lowest for Northeastern hunters (33.3%), with Midwestern (36.2%) and Southeastern (36.0%) hunters in between. An additional 27.2% of the respondents rated illegal take as Very Serious. Southeastern (28.2%) and Western (27.7%) hunters had the highest levels of concern, while Northeastern hunters (25.5%) reported the lowest level of concern, and Midwestern hunters (27.5%) reported a level of concern similar to that of the other three regions. A smaller proportion of respondents (24.0%) viewed illegal take as Somewhat Serious at the state level. Western hunters (19.7%) were the least likely to select this category, whereas Midwestern (26.1%), Northeastern (27.8%), and Southeastern (25.5%) hunters reported a higher level of concern (Table B1)
The Aggregated Response Categories produced the following results:
• Serious Concern → 38.6%: Western hunters (44.5%) showed the highest level of serious concern, while Northeastern hunters (33.3%) reported the lowest.
• Broad Concern → 65.8%: Most hunters expressed broad concern, with Western hunters (72.1%) showing the highest level of concern and Northeastern hunters (58.8%) reporting the lowest level of concern among the regions.
• General Concern → 89.8%: A large majority of hunters expressed general concern, with Western hunters (91.8%) reporting the highest level of concern and Northeastern hunters (86.5%) reporting the lowest level of concern among the regions.
Hunting Lands in other States
Hunting opportunities often extend beyond a hunter’s home state, making illegal take in other states a potential concern for those who travel to hunt. Respondents were asked to assess the seriousness of illegal take on lands where they hunt outside their state of residence, reflecting concerns over game availability, enforcement effectiveness, and out-of-state hunting experiences.
A notable portion of respondents (41.1%) considered illegal take on out-of-state hunting lands to be Extremely Serious for the Direct Response Categories. Western hunters (47.6%) reported the highest level of concern, whereas Northeastern hunters (34.9%) expressed the least concern. Midwestern (37.1%) and Southeastern (38.2%) hunters reported an intermediate level of concern.
An additional 25.1% of the respondents rated illegal take in other states as Very Serious. Concerns were highest among Western hunters (26.5%) and lowest among Northeastern hunters (23.2%), with Midwestern (25.5%) and Southeastern (24.0%) hunters falling in between. A smaller percentage of respondents (21.7%) viewed illegal take in other states as Somewhat Serious. Western hunters (18.1%) were the least likely to select this category, whereas Midwestern (23.2%), Northeastern (25.4%), and Southeastern (23.8%) hunters reported a higher level of concern (Table B1).
The Aggregated Response Categories produced the following results:
• Serious Concern → 41.1%: Western hunters (47.6%) showed the highest level of serious concern, while Northeastern hunters (34.9%) reported the lowest level of serious concern.
• Broad Concern → 66.2%: Most hunters expressed broad concern, with Western hunters (74.1%) showing the highest level of concern and Northeastern hunters (58.0%) reporting the lowest level of concern among the regions.
• General Concern → 87.9%: A large majority of hunters expressed general concern, with Western hunters (92.2%) reporting the highest level of concern and Northeastern hunters (83.4%) reporting the lowest level of concern among the regions.
The U.S. in General
Beyond individual states or hunting locations, illegal take has national implications, influencing wildlife populations, conservation funding, and public perceptions of hunting. Respondents were asked to assess the seriousness of illegal take across the U.S. in general, providing insight into their broader concerns regarding poaching and its impacts.
A substantial portion of respondents (40.4%) rated illegal take in the U.S. as Extremely Serious for the Direct Response Categories. Concern was highest for Western hunters (46.4%) and lowest for Northeastern hunters (34.7%), with Midwestern (37.1%) and Southeastern (38.4%) hunters reporting intermediate levels. An additional 28.4% of respondents considered illegal take in the U.S. to be Very Serious. Midwestern hunters (29.8%) reported the highest level of concern, whereas Northeastern hunters (27.1%) reported the lowest level. Western (28.6%) and Southeastern (28.2%) hunters expressed a similar level of concern as the other two regions did. A smaller proportion of respondents (23.3%) viewed illegal take in the U.S. as Somewhat Serious. Northeastern hunters (27.9%) were the most likely to select this category, whereas Western hunters (18.7%) were the least likely. Midwestern (24.8%) and Southeastern (25.6%) hunters reported moderate concerns (Table B1).
The Aggregated Response Categories produced the following results:
• Serious Concern → 40.4%: Western hunters (46.4%) showed the highest level of serious concern, while Northeastern hunters (34.7%) reported the lowest.
• Broad Concern → 68.8%: Many hunters expressed broad concern, with Western hunters (75.0%) showing the highest level of concern and Northeastern hunters (61.8%) reporting the lowest level of concern among the regions.
• General Concern → 92.1%: A large majority of hunters expressed general concern, with Western hunters (93.7%) reporting the highest level of concern and Northeastern hunters (89.7%) reporting the lowest level of concern among the regions.
Biological & Social Impacts
We evaluated the hunters’ perceptions of the biological, experiential, and social impacts of illegal take in their state of residence. To assess these perceptions, respondents provided their opinions on the same 6 key factors as landowners and conservation officers (Table B2).
Table B2. Hunter perceptions of the negative impacts that illegal take of wildlife has on a given biological or social factor.
Land access for
Personal perception
Table B2. Hunter perceptions of the negative impacts that illegal take of wildlife has on a given biological or social factor.
Wildlife Populations
We defined a negative impact on wildlife populations as any factor that ultimately reduces the number of individuals in a population. A total of 40.0% of respondents selected Strongly Agree in the Direct Response Categories, indicating that illegal take negatively impacts wildlife populations (Table B2). This response was highest for Western hunters (46.0%) and lowest for Northeastern hunters (32.5%), with Midwestern (38.3%) and Southeastern (38.8%) hunters positioned in between the two. An additional 21.9% of respondents selected Moderately Agree, with Northeastern hunters (23.1%) reporting the highest level of agreement and Western hunters (20.1%) reporting the lowest. A smaller percentage of respondents (11.8%) selected Slightly Agree, with Northeastern hunters (14.1%) most likely to slightly agree, while Western hunters (10.4%) expressed the lowest level of agreement.
The Aggregated Response Categories produced the following results:
• Strong Agreement → 40.0%: Western hunters (46.0%) showed the highest level of strong agreement, while Northeastern hunters (32.5%) reported the lowest level.
• Broad Agreement → 61.9%: Most hunters expressed broad agreement, with Western hunters (66.1%) reporting the highest level of agreement and Northeastern hunters (55.6%) reporting the lowest level of agreement among the regions.
• General Agreement → 73.7%: A strong majority expressed general agreement, with Western hunters (76.5%) reporting the highest level of agreement, and Northeastern hunters (69.7%) showing slightly lower levels of agreement among the regions.
Hunt Quality
We defined negative impacts on hunt quality as a reduction in the robustness or health of a huntable animal, as measured by phenotypic characteristics. A total of 46.7% of respondents selected Strongly Agree in the Direct Response Categories, indicating concern over the negative impact of illegal take on huntable animal quality (Table B2). Agreement was highest for Western hunters (54.0%) and lowest for Northeastern hunters (35.4%), with Midwestern (44.6%) and Southeastern (47.5%) hunters positioned in between the two. An additional 20.3% of respondents selected Moderately Agree, with Midwestern (22.5%) and Northeastern (21.4%) hunters reporting the highest level of agreement, while Western hunters (18.4%) expressed the lowest level of agreement. A smaller percentage of respondents (10.5%) selected Slightly Agree, with Northeastern hunters (13.6%) expressing the highest level of agreement and Western hunters (8.4%) the least.
The Aggregated Response Categories produced the following results:
• Strong Agreement → 46.7%: Western hunters (54.0%) showed the highest level of strong agreement, while Northeastern hunters (35.4%) reported the lowest level.
• Broad Agreement → 67.0%: Most hunters expressed broad agreement, with Western hunters (72.4%) reporting the highest level of agreement and Northeastern hunters (56.8%) reporting the lowest level of agreement among the regions
• General Agreement → 77.4%: A strong majority expressed general agreement, with Western hunters (80.8%) showing the highest level of agreement, and Northeastern hunters (70.4%) expressing the lowest level of agreement among the regions.
Hunt Opportunity
We defined the negative impact of hunting opportunities as a decline in the availability of huntable game animals. A total of 42.4% of the respondents selected Strongly Agree in the Direct Response Categories, indicating that illegal take negatively affects huntable animal availability (Table B2). Western hunters (47.7%) reported the highest level of agreement, whereas Northeastern hunters (35.1%) reported a lower level of agreement. An additional 21.4% of respondents selected Moderately Agree, with Midwestern hunters (22.8%) reporting the highest level of agreement and Western hunters (20.4%) the least. A smaller percentage of respondents (13.6%) selected Slightly Agree, with Northeastern hunters (16.3%) most likely to slightly agree, and Western hunters (12.5%) were least likely to select this choice.
The Aggregated Response Categories produced the following results:
• Strong Agreement → 42.4%: Western hunters (47.7%) showed the highest level of strong agreement, while Northeastern hunters (35.1%) reported the lowest level.
• Broad Agreement → 63.8%: Many hunters expressed broad agreement, with Western hunters (68.1%) reporting the highest level of agreement, and Northeastern hunters (56.9%) expressing the lowest level of agreement among the regions.
• General Agreement → 77.5%: A strong majority of hunters expressed general agreement, with Western hunters (80.6%) expressing the highest level of agreement and Northeastern hunters (73.2%) reporting the lowest level of agreement among the regions
Land Access for Hunting
We defined the negative impact on lands accessible for hunting as a decrease in access by private landowners due to illegal activity. A total of 48.7% of respondents selected Strongly Agree in the Direct Response Categories, indicating that illegal take negatively impacts available hunting land (Table B2). Agreement was highest among Southeastern hunters (50.3%), followed by Western (49.7%) and Northeastern (48.4%) hunters, while Midwestern hunters (45.6%) reported a slightly lower level of agreement. An additional 17.6% of respondents selected Moderately Agree, with Northeastern hunters (18.9%) expressing the highest level of agreement and Western hunters (16.7%) the lowest. A smaller percentage of respondents (10.0%) selected Slightly Agree, with Northeastern hunters (10.9%) reporting the highest level of agreement and Southeastern hunters (9.0%) reporting the lowest level of agreement.
The Aggregated Response Categories produced the following results:
• Strong Agreement → 48.7%: Southeastern hunters (50.3%) showed the highest level of strong agreement, while Midwestern hunters (45.6%) reported the lowest level.
• Broad Agreement → 66.4%: Most hunters expressed broad agreement, with Southeastern hunters (67.7%) reporting the highest level of agreement and Midwestern hunters (64.1%) reporting the lowest level of agreement among the regions.
• General Agreement → 76.4: A strong majority of hunters expressed general agreement, with Northeastern (78.1%) and Midwestern (74.7 %) hunters reporting the highest and lowest levels of agreement, respectively
Personal Perception of Hunting
We defined negative impacts on personal perception as any factor that could cause a lawful hunter to perceive themselves or others negatively. A hunter’s personal perception of hunting reflects their attitudes and beliefs about the activity, which can be influenced by illegal take. Many respondents reported that poaching negatively affected their perception of hunting, with significant regional variation.
A total of 32.1% of the respondents selected Strongly Agree in the Direct Response Categories, indicating that illegal take negatively affects their personal perception of hunting. Agreement was highest among Western hunters (36.5%), whereas Northeastern hunters (27.3%) reported the lowest level of agreement. Midwestern (30.7%) and Southeastern (30.5%) hunters were positioned in the middle. An additional 14.2% of respondents selected Moderately Agree, with Northeastern (14.7%) and Southeastern (14.7%) hunters reporting slightly higher agreement than Midwestern (14.3%) and Western (13.7%) hunters. A smaller percentage of respondents (13.5%) selected Slightly Agree, with Western hunters (11.7%) expressing the lowest level of agreement, while Midwestern (14.5%), Southeastern (14.8%), and Northeastern (14.4%) hunters reported slightly higher agreement (Table B2).
The Aggregated Response Categories produced the following results:
• Strong Agreement → 32.1%: Western hunters (36.5%) showed the highest level of strong agreement, while Northeastern hunters (27.3%) reported the lowest level.
• Broad Agreement → 46.3%: Western hunters (50.2%) showed the highest level of broad agreement, and Northeastern hunters (42.0%) reported the lowest level.
• General Agreement → 59.8%: Most hunters expressed general agreement, with Western hunters (61.8%) reporting the highest level of agreement and Northeastern hunters (56.4%) expressing the lowest level of agreement among the regions.
Public Perception of Hunting
We defined negative impacts on public perception as any factor that could cause or has caused the public to perceive hunting and hunters negatively. A total of 56.3% of respondents selected Strongly Agree in the Direct Response Categories, indicating that illegal take negatively affects the public perception of hunting (Table B2). Agreement was highest among Western hunters (60.9%) and lowest among Northeastern hunters (50.6%) An additional 17.7% of respondents selected Moderately Agree, with Northeastern hunters (20.6%) expressing the highest level of agreement and Western hunters (15.7%) the lowest. A smaller percentage of respondents (9.3%) selected
Slightly Agree, with Northeastern hunters (11.2%) most likely to slightly agree and Western hunters (8.0%) least likely.
The Aggregated Response Categories produced the following results:
• Strong Agreement → 56.3%: Most hunters expressed strong agreement, with Western hunters (60.9%) reporting the highest level of agreement and Northeastern hunters (50.6%) reporting the lowest level of agreement among the regions.
• Broad Agreement → 74.0%: A strong majority of hunters expressed broad agreement, with Western hunters (76.5%) expressing the highest level of agreement and Northeastern hunters (71.2%) expressing the lowest level of agreement among the regions
• General Agreement → 83.3%: A stronger majority of hunters expressed general agreement, with Western hunters (84.5%) reporting the highest level of agreement and Northeastern hunters (82.4%) reporting the lowest level of agreement among the regions.
Landowner Opinion & Perception Survey
Landowners also were asked about their perceptions of the relative seriousness of illegal take of wildlife for certain geographic locations and about potential negative impacts that illegal take of wildlife has on a given biological or social factor. These results are presented in Tables B3 and B4.
Table B3. Landowner perceptions of the relative seriousness of illegal take of wildlife for certain geographic locations.
Table B3. Landowner perceptions of the relative seriousness of illegal take of wildlife for certain geographic locations.
Lands Owned in State of Residence
Land owned by stakeholders is often closely monitored by this group because of proximity and interest. For the Direct Response Categories, a significant portion of respondents (32.8%) considered illegal take on lands they owned in their state of residence to be Extremely Serious (Table B3). Western landowners (35.8%) reported the highest level of concern, while Midwestern landowners (30.8%) expressed the least. Northeastern (32.4%) and Southeastern (32.2%) landowners fell in the middle. An additional 15.5% of the respondents rated illegal take as Very Serious. Concerns were highest among Midwestern (17.4%) and Southeastern (17.5%) landowners but lowest among Northeastern landowners (12.8%). A smaller group of respondents (12.5%) considered illegal take to be Somewhat Serious. Southeastern landowners (15.0%) were slightly more likely to indicate this level of concern than Western (11.0%) and Northeastern (11.5%) landowners, whereas Midwestern landowners (12.8%) reported a level of concern similar to the other three regions.
The Aggregated Response Categories produced the following results:
• Serious Concern → 32.8%: Western landowners (35.8%) showed the highest level of serious concern, whereas Midwestern landowners (30.8%) reported the lowest level.
• Broad Concern → 48.4%: Southeastern landowners (49.7%) showed the highest level of broad concern, while Northeastern landowners (46.6%) reported the lowest.
• General Concern → 60.9%: Most landowners indicated general concern, with Southeastern hunters (64.7%) showing the highest level of concern and Northeastern landowners (58.1%) reporting the lowest level of concern.
State of Residence in General
Illegal take of wildlife extends beyond individual hunting areas and impacts broader regions within a landowner’s state of residence. Respondents were asked to assess the seriousness of illegal take at the state level, reflecting concerns about wildlife populations, management effectiveness, and overall hunting opportunities.
A substantial proportion of respondents (38.6%) rated illegal take in their state of residence as Extremely Serious for the Direct Response Categories. Concern was highest for Western landowners (44.5%) and lowest for Northeastern landowners (33.3%), with Midwestern (36.2%) and Southeastern (36.0%) landowners falling in between (Table B3). An additional 27.2% of the respondents rated illegal take as Very Serious. Concerns were highest among Southeastern
(28.2%) and Western (27.7%) landowners, whereas Northeastern landowners (25.5%) reported the lowest level. A smaller proportion of respondents (24.0%) viewed illegal take as Somewhat Serious at the state level. Western landowners (19.7%) were the least likely to select this category, whereas Midwestern (26.1%), Northeastern (27.8%), and Southeastern (25.6%) landowners reported a higher level of concern.
The Aggregated Response Categories produced the following results:
• Serious Concern → 33.8%: Western landowners (39.8%) showed the highest level of serious concern, whereas Northeastern landowners (30.8%) reported the lowest level.
• Broad Concern → 63.2%: Most landowners expressed broad concern, with Western landowners (72.0%) showing the highest level of concern and Northeastern landowners (57.4%) expressing the lowest level of concern.
• General Concern → 88.4%: A large majority of landowners expressed general concern, with Western landowners (92.0%) reporting the highest level of concern and Northeastern landowners (83.6%) expressing the lowest level of concern.
Lands Owned in other States
Hunting opportunities often extend beyond a landowner’s home state, making illegal take in other states a potential concern for those who travel to hunt. Respondents were asked to assess the seriousness of illegal take on lands where they hunt outside their state of residence, reflecting concerns over game availability, enforcement effectiveness, and out-of-state hunting experiences.
A notable portion of respondents (34.9%) considered illegal take on out-of-state lands to be Extremely Serious for the Direct Response Categories. Western landowners (41.1%) reported the highest levels of concern, whereas Northeastern (31.9%), Midwestern (32.3%), and Southeastern (33.1%) landowners reported lower levels of concern (Table B3). An additional 26.2% of the respondents rated illegal take in other states as Very Serious. Concerns were similar for Western (27.1%), Midwestern (27.4%), Northeastern (23.8%), and Southeastern landowners (26.2%). A smaller percentage of respondents (22.9%) viewed illegal take in other states as Somewhat Serious. Western (18.8 %) landowners were the least likely to select this category, whereas Midwestern (25.5%), Northeastern (23.1%), and Southeastern (24.9%) landowners reported a higher level of concern.
The Aggregated Response Categories produced the following results:
• Serious Concern → 34.9%: Western landowners (41.1%) showed the highest level of serious concern, while Northeastern landowners (31.9%) reported the lowest.
• Broad Concern → 61.1%: Most landowners expressed broad concern, with Western (68.2%) and Northeastern (55.8 %) landowners showing the highest and lowest levels of concern, respectively.
• General Concern → 84.0%: A large majority of landowners expressed general concern, with Western landowners (87.0%) reporting the highest and Northeastern landowners (78.9%) reporting the lowest levels of concern.
The U.S. in General
Beyond individual states or hunting lands, illegal hunting has national implications, influencing wildlife populations, conservation funding, and public perceptions of hunting. Respondents were asked to assess the seriousness of illegal take across the U.S. in general, providing insight into their broader concerns regarding poaching and its impacts.
A substantial portion of respondents (35.1%) rated illegal take in the U.S. overall as Extremely Serious for the Direct Response Categories. Concern was highest for Western (40.2%) and lowest for Northeastern (34.2%), Midwestern (32.5%), and Southeastern (32.9%) landowners. An additional 31.0% of respondents considered illegal take in the U.S. to be Very Serious. Midwestern (29.8%), Western (32.2%) and Southeastern (33.0%) landowners reported the highest level of concern while Northeastern landowners (26.9%) reported the lowest. A smaller proportion of respondents (24.8%) viewed illegal take in the U.S. as Somewhat Serious. Western landowners (20.4%) were the least likely to select this category, whereas Midwestern (27.6%), Northeastern (26.6%), and Southeastern (25.1%) landowners reported a higher level of concern (Table B3)
The Aggregated Response Categories produced the following results:
• Serious Concern → 35.1%: Western landowners (40.2%) showed the highest level of serious concern, while Northeastern landowners (32.5%) reported the lowest.
• Broad Concern → 66.1%: Most landowners expressed broad concern, with Western landowners (72.4%) showing the highest level of concern and Northeastern landowners (61.0%) the lowest level of concern.
• General Concern → 91.0%: A large majority of landowners expressed general concern, with Western landowners (92.8%) reporting the highest and Northeastern landowners (87.7%) reporting the lowest levels of concern.
Biological & Social Impacts
We evaluated the landowners’ perceptions of the biological, experiential, and social impacts of illegal take in their state of residence To assess these perceptions, respondents provided their opinions on the same 6 key factors as hunters and conservation officers (Table B4).
Table B4. Landowner perceptions of the negative impacts that illegal take of wildlife has on a given biological or social factor.
Table B4. Landowner perceptions of the negative impacts that illegal take of wildlife has on a given biological or social factor.
Hunt
Personal
Wildlife Populations
We defined a negative impact on wildlife populations as any factor that ultimately reduces the number of individuals in a population. A total of 36.8% of respondents selected Strongly Agree in the Direct Response Categories, indicating that illegal take negatively impacts wildlife populations (Table B4). This response was highest for Western landowners (40.8%) and lowest for Midwestern (32.7%), Northeastern (38.0%), and Southeastern (35.4%) landowners. An additional 21.2% of respondents who selected Moderately Agree were Western (20.3%), Midwestern (22.7%), Northeastern (19.2%), and Southeastern (22.4%) landowners, who reported similar levels of agreement. A smaller percentage of respondents (10.3%) selected Slightly Agree among Western (9.9%), Midwestern (11.4%), Northeastern (9.2%), and Southeastern (10.8%) landowners, reporting a similar level of agreement.
The Aggregated Response Categories produced the following results:
• Strong Agreement → 36.8%: Western landowners (40.8%) showed the highest level of strong agreement, while Midwestern landowners (32.7%) reported the lowest level.
• Broad Agreement → 58.0%: Most landowners indicated broad agreement, with Western (61.1%) and Midwestern (55.5 %) landowners reporting the highest and lowest levels of agreement, respectively.
• General Agreement → 68.3%: A strong majority agreed to some extent, with Western landowners (71.0%) reporting the highest concern and Northeastern landowners (66.4%) showing slightly lower agreement.
Hunt Quality
We defined negative impacts on hunt quality as a reduction in the robustness or health of a huntable animal, as measured by phenotypic characteristics. A total of 38.0% of respondents selected Strongly Agree in the Direct Response Categories, indicating concern over the negative impact of illegal take on huntable animal quality (Table B4). Agreement was highest for Western landowners (41.1%) and lowest for Northeastern landowners (35.8%), with Midwestern (37.0%) and Southeastern (37.7%) landowners in between. An additional 20.6% of respondents selected Moderately Agree, with Midwestern landowners (23.6%) reporting the highest level of agreement, Western (18.4%) and Northeastern (18.9%) landowners reporting the lowest level of agreement, and Southeastern landowners (21.7%) falling in between. A smaller percentage of respondents (10.4%) selected Slightly Agree, with Midwestern landowners (11.5%) expressing the highest level of agreement, while Northeastern landowners (8.5%) had the lowest level of agreement. The Aggregated Response Categories produced the following results:
• Strong Agreement → 38.0%: Western landowners (41.1%) showed the highest level of strong agreement, while Northeastern landowners (35.8%) reported the lowest level.
• Broad Agreement → 58.6%: Most landowners indicated broad agreement, with Midwestern landowners (60.6%) reporting the highest level of agreement and Midwestern landowners (54.7%) indicating the lowest level of agreement.
• General Agreement → 69.0%: A strong majority of landowners indicated general agreement, with Midwestern landowners (72.2%) showing the highest level of agreement and Northeastern landowners (63.2%) expressing the lowest level of agreement.
Hunt Opportunity
We defined the negative impact on hunting opportunities as a decline in the availability of legally huntable game species. A total of 34.9% of the respondents selected Strongly Agree in the Direct Response Categories, indicating that illegal take negatively affects huntable animal availability (Table B4) Western landowners (39.4%) reported the highest level of agreement, while Northeastern (34.4%), Midwestern (32.8%), and Southeastern (32.6%) landowners indicated lower levels of agreement. An additional 21.7% of respondents who selected Moderately Agree were Western (20.2%), Midwestern (23.3%), Northeastern (20.6%), and Southeastern (23.0%) landowners, reporting a similar level of agreement. A smaller percentage of respondents (21.7%) selected Slightly Agree, with Southeastern landowners (15.1%) most likely to slightly agree, and Northeastern landowners (10.4%) were least likely to agree.
The Aggregated Response Categories produced the following results:
• Strong Agreement → 34.9%: Western landowners (39.4%) showed the highest level of strong agreement, while Southeastern landowners (32.6%) reported the lowest level.
• Broad Agreement → 56.7%: Most landowners indicated broad agreement, with Western landowners (59.6%) reporting the highest level of agreement and Northeastern landowners (55.0%) expressing the lowest level of agreement.
• General Agreement → 69.2%: A strong majority of landowners indicated general agreement, with Western landowners (71.5%) expressing the highest level of agreement and Northeastern landowners (65.4%) reporting the lowest level of agreement.
Land Access for Hunting
We defined the negative impact on lands accessible for hunting as a decrease in access by private landowners due to illegal activity. A total of 40.2% of respondents selected Strongly Agree in the Direct Response Categories, indicating that illegal take reduces available hunting land (Table B4) Agreement was highest for Western landowners (43.7%), followed by Northeastern landowners (40.9%), while Southeastern (38.1%) and Midwestern (37.6%) landowners reported a lower level of agreement. An additional 19.8% of respondents who selected Moderately Agree were Western (17.3%), Midwestern (18.3%), Northeastern (18.0%), and Southeastern (20.1%) landowners, expressing a similar level of agreement. A smaller percentage of respondents (9.7%) selected Slightly Agree, with Midwestern landowners (11.7%) reporting the highest level of agreement, and Western landowners (8.3%) indicated the lowest level of agreement.
The Aggregated Response Categories produced the following results:
• Strong Agreement → 40.2%: Western landowners (43.7%) showed the highest level of strong agreement, while Midwestern landowners (39.6%) reported the lowest level.
• Broad Agreement → 58.6%: Most landowners reported broad agreement, with Western landowners (61.0%) reporting the highest level of agreement and Midwestern landowners (55.9%) reporting the lowest.
• General Agreement → 68.2%: A strong majority of landowners indicated general agreement, with Western (69.3%) and Midwestern (67.6 %) landowners reporting the highest and lowest levels of agreement, respectively.
Personal Perception of Hunting
We defined negative impacts on personal perception as any factor that could cause a landowner to perceive themselves or others negatively. A landowner’s personal perception of hunting reflects their attitudes and beliefs about the activity, which can be influenced by illegal take. Many respondents reported that poaching negatively affected their perception of hunting, with significant regional variation.
A total of 33.5% of the respondents selected Strongly Agree in the Direct Response Categories, indicating that illegal take negatively affects their personal perception of hunting. Agreement was highest for Western landowners (36.6%), while Midwestern (31.8%) and Southeastern (30.3%) landowners reported the lowest levels of agreement. Northeastern landowners (34.7%) fell in between the two. An additional 16.5% of respondents selected Moderately Agree, with Western
(15.2%), Midwestern (17.9%), Northeastern (15.1%), and Southeastern (17.7%) landowners reporting a similar level of agreement. A smaller percentage of respondents (12.6%) selected Slightly Agree, with Western (11.2%), Midwestern (13.7%), Northeastern (13.6%), and Southeastern (11.8%) landowners reporting similar levels (Table B4).
The Aggregated Response Categories produced the following results:
• Strong Agreement → 33.5%: Western landowners (36.6%) showed the highest level of strong agreement, while Southeastern landowners (30.3%) reported the lowest level.
• Broad Agreement → 49.9%: Western landowners (51.8%) showed the highest level of broad agreement, whereas Southeastern landowners (48.0%) reported the lowest level.
• General Agreement → 62.5%: Most landowners indicated general agreement, with Northeastern landowners (63.5%) reporting the highest and Southeastern landowners (59.8 %) reporting the lowest level of agreement.
Public Perception of Hunting
We defined negative impacts on public perception as any factor that could cause or has caused the public to perceive hunting and hunters negatively. A total of 43.7% of respondents selected Strongly Agree in the Direct Response Categories, indicating that illegal take negatively affects the public perception of hunting (Table B4) Agreement was highest for Western landowners (48.1%) and lowest for Southeastern landowners (39.6%). An additional 19.8% of respondents selected Moderately Agree, with Southeastern landowners (21.6%) expressing the highest level of agreement and Western landowners (17.8%) the lowest. A smaller percentage of respondents (10.4%) selected Slightly Agree with Western (11.0%), Midwestern (9.3%), Northeastern (9.8%), and Southeastern (11.4%) landowners, reporting a similar level of agreement.
The Aggregated Response Categories produced the following results:
• Strong Agreement → 43.7%: Western landowners (48.1%) showed the highest level of strong agreement, while Southeastern landowners (39.6%) reported the lowest.
• Broad Agreement → 63.5%: Most landowners indicated broad agreement, with Western landowners (66.0%) indicating the highest level of agreement and Southeastern landowners (61.3%) indicating the lowest.
• General Agreement → 73.9%: A strong majority of landowners indicated general agreement, with Western landowners (76.9%) reporting the highest level of agreement and Midwestern landowners (72.2%) indicating the lowest level of agreement.
Conservation Officer Opinion & Perception Survey
Conservation officers were asked similar questions about their perceptions of the relative seriousness of illegal take of wildlife for certain geographic locations and about potential negative impacts that illegal take of wildlife has on certain biological or social factors. The items concerning biological or social factors were assessed based on state of residence and for their personal operational areas. These results are presented in Tables B5, B6, and B7.
Table B5. Conservation Officer perceptions of the relative seriousness of illegal take of wildlife for certain geographic locations.
In State of Residence
Officer respondents were asked to assess the seriousness of illegal take at the state level, reflecting concerns about wildlife populations, management effectiveness, and overall hunting opportunities. Several officers (32.7%) rated illegal take in their state of residence as Extremely Serious for the Direct Response Categories. Concern was highest for Western (47.6%) and Northeastern (40.4%) officers, with Midwestern (25.3%) and Southeastern (28.7 %) officers reporting a lower level of concern. An additional 47.3% of the respondents rated illegal take as Very Serious. Concerns were similar among Western (43.8%), Midwestern (50.9%), Northeastern (43.5%), and Southeastern (48.1%) officers. A small proportion of respondents (18.5%) viewed illegal take as Somewhat Serious at the state level. Western officers (8.7%) were the least likely to select this category, while Midwestern (20.8%), Northeastern (15.6%), and Southeastern (21.2%) officers reported a higher level of concern (Table B5).
The Aggregated Response Categories produced the following results:
• Serious Concern → 32.7%: Western officers (47.6%) showed the highest level of serious concern, while Midwestern officers (25.3%) reported the lowest.
• Broad Concern → 80.0%: A strong majority of officers expressed broad concern, with Western officers (91.4%) showing the highest level of concern and Midwestern officers (76.1%) showing the lowest level of concern.
• General Concern → 98.5%: Almost all officers expressed general concern, with Western officers (100%) reporting the highest level of concern and Southeastern officers (98.0%) reporting the lowest level of concern.
The U.S. in General
Beyond individual states, illegal take has national implications, influencing wildlife populations, conservation funding, and public perception of hunting. Respondents were asked to assess the
seriousness of illegal take across the United States in general, providing insight into their broader concerns regarding poaching and its impacts.
A substantial portion of respondents (35.0%) rated illegal take in the U.S. overall as Extremely Serious for the Direct Response Categories. Concern was highest among Western (42.3%) and Northeastern (43.0%) officers and lower among Midwestern (29.2%) and Southeastern (31.9%) officers. An additional 47.3% of respondents considered illegal take in the U.S. to be Very Serious. Midwestern (49.3%), Western (48.1%) and Southeastern (50.1%) officers reported the highest level of concern while Northeastern officers (41.0%) reported the lowest level of concern. A smaller proportion (16.7%) viewed illegal take in the U.S. as Somewhat Serious. Western officers (8.7%) were the least likely to select this category, whereas Midwestern (20.8%), Northeastern (15.6%), and Southeastern (16.5%) officers reported a higher level of concern (Table B5)
The Aggregated Response Categories produced the following results:
• Serious Concern → 35.0%: Western officers (43.0%) showed the highest level of serious concern, while Northeastern officers (29.2%) reported the lowest.
• Broad Concern → 82.4%: A strong majority of officers expressed broad concern, with Western officers (90.4%) showing the highest level of concern and Midwestern officers (78.5%) indicating the lowest level of concern.
• General Concern → 99.1%: Almost all officers expressed general concern, with Northeastern officers (99.6%) reporting the highest level of concern and Southeastern officers (98.6%) reporting the lowest level of concern.
Biological & Social Impacts – State Level
We evaluated the conservation officers’ perceptions of the biological, experiential, and social impacts of illegal take in their state of residence. To assess these perceptions, respondents provided their opinions on the same 6 key factors as hunters and landowners (Table B6).
Table B6. Conservation Officer perceptions of the negative impacts that illegal take of wildlife has on a given biological or social factor in their state of residence.
Table B6. Conservation Officer perceptions of the negative impacts that illegal take of wildlife has on a given biological or social factor in their state of residence Factor
Land access for hunting (n=1,098)
Personal
Public perception of hunting (n=1,099)
Wildlife Populations
We defined a negative impact on wildlife populations as any factor that ultimately reduces the number of individuals in a population. A total of 23.9% of the respondents selected Strongly Agree in the Direct Response Categories (Table B6) This response was highest for Western officers (50.0%) and lower for Midwestern (20.8%), Northeastern (19.6%), and Southeastern (20.1%) officers An additional 27.5% of respondents selected Moderately Agree, with Western (27.5%), Midwestern (24.8%), Northeastern (29.9%), and Southeastern (27.9%) officers reporting a similar level of agreement. A smaller percentage (26.0%) selected Slightly Agree, with Midwestern (27.3%), Northeastern (24.9%), and Southeastern (30.4%) officers reporting the highest level of agreement, while Western officers (13.8%) reported the lowest level of agreement. The Aggregated Response Categories produced the following results:
• Strong Agreement → 23.9%: Western officers (50.0%) showed the highest level of strong agreement, while Northeastern officers (19.6%) reported the lowest.
• Broad Agreement → 51.4%: Most officers reported broad agreement, with Western officers (77.5%) reporting the highest level of agreement and Midwestern officers (45.7%) indicating the lowest level of agreement.
• General Agreement → 77.4%: A strong majority indicated general agreement, with Western officers (91.3%) reporting the highest level of agreement and Midwestern officers (73.0%) showing the lowest level of agreement.
Hunt Quality
We defined negative impacts on hunt quality as a decline in the robustness or health of a huntable animal, as measured by phenotypic characteristics. A total of 27.7% of respondents selected Strongly Agree in the Direct Response Categories, indicating concern over the negative impact of illegal take on huntable animal quality (Table ). Agreement was highest for Western officers (47.1%) and lowest for Northeastern officers (20.6%), with Midwestern (25.2%) and Southeastern (28.1%) officers in between. An additional 31.2% of respondents selected Moderately Agree, with Western (31.2%), Midwestern (28.0%), Northeastern (32.4%), and Southeastern (33.1%) officers reporting similar levels of agreement. A smaller percentage of respondents (22.6%) selected Slightly Agree, with Midwestern (24.8%) and Northeastern (23.8%) officers expressing the highest level of agreement, while Western officers (15.2%) reported the lowest level of agreement. Southeastern officers (22.6%) were not significantly different from those in other regions.
The Aggregated Response Categories produced the following results:
• Strong Agreement → 27.7%: Western officers (47.1%) showed the highest level of strong agreement, while Northeastern officers (20.6%) reported the lowest.
• Broad Agreement → 58.9%: Most officers reported broad agreement, with Western officers (78.3%) reporting the highest level of agreement and Northeastern officers (53.0%) indicating the lowest level of agreement.
• General Agreement → 81.5%: A strong majority of officers reported general agreement, with Western officers (93.5%) showing the highest level of agreement and Northeastern officers (76.9%) expressing the lowest level of agreement.
Hunt Opportunity
We defined the negative impact on hunting opportunities as a decline in the availability of huntable game animals. A total of 22.0% of the respondents selected Strongly Agree in the Direct Response Categories, indicating that illegal take negatively affects huntable animal availability (Table B6). Western officers (40.6%) reported the highest level of agreement, while Northeastern (19.9%), Midwestern (17.8%), and Southeastern (20.3%) officers indicated a lower level of agreement. An additional 27.1% of respondents selected Moderately Agree, with Western (31.2%), Midwestern (26.8%), Northeastern (26.3%), and Southeastern (26.5%) officers reporting similar levels of agreement. A similar percentage of respondents (27.1%) selected Slightly Agree, with Western (16.7 %) officers reporting the lowest level of agreement, while Midwestern (27.4%), Northeastern (27.8%), and Southeastern (30.4%) officers reported higher levels of agreement.
The Aggregated Response Categories produced the following results:
• Strong Agreement → 22.0%: Western officers (40.6%) showed the highest level of strong agreement, while Midwestern officers (17.8%) reported the lowest level.
• Broad Agreement → 49.1%: Western officers (71.1%) reported the highest level of broad agreement, while Midwestern officers (44.5%) expressed the lowest level of agreement.
• General Agreement → 76.3%: A strong majority of officers reported general agreement, with Western officers (88.4%) expressing the highest level of agreement and Midwestern officers (72.0%) reporting the lowest level of agreement.
Land Access for Hunting
A total of 32.1% of respondents selected Strongly Agree in the Direct Response Categories, indicating that illegal take reduces the available hunting land (Table B6). The highest agreement was observed among Northeastern officers (38.8%), followed by Western officers (35.8%).
Southeastern (28.4%) officers reported levels similar to those of Western and Midwestern officers (29.0%) but lower than those of Northeastern officers. An additional 28.1% of respondents selected Moderately Agree, with Western (32.1%), Midwestern (26.2%), Northeastern (26.0%), and Southeastern (29.8%) officers all expressing similar levels of agreement. A smaller percentage of respondents (22.5%) selected Slightly Agree, with Midwestern (24.6%) and Southeastern (25.9%) officers reporting the highest levels of agreement, while Western (15.3%) and Northeastern (19.2%) officers reported lower levels of agreement.
The Aggregated Response Categories produced the following results:
• Strong Agreement → 32.1%: Northeastern officers (38.8%) showed the highest level of agreement, while Southeastern officers (28.4%) reported the lowest level of agreement.
• Broad Agreement → 60.2%: Western officers (67.9%) showed the highest level of agreement, while Midwestern officers (55.1%) reported the lowest level of agreement.
• General Agreement → 82.7%: Northeastern officers (84.0%) showed the highest level of agreement, while Midwestern officers (79.8%) reported the lowest level of agreement.
Personal Perception of Hunting
We defined negative impacts on personal perception as any factor that could cause an officer to perceive themselves or others negatively. An officer’s personal perception of hunting reflects their attitudes and beliefs about the activity, which can be influenced by illegal take. Most respondents reported that poaching negatively affected their perception of hunting, with notable regional variations. A total of 18.3% of respondents selected Strongly Agree in the Direct Response Categories, indicating that illegal take negatively affected their personal perception of hunting (Table B6) Agreement was highest for Western officers (27.2%), while Northeastern (19.9%) and Midwestern (17.4%) officers reported lower levels of agreement. Southeastern officers (14.5%) reported the lowest level of agreement with this factor. An additional 17.5% of respondents selected Moderately Agree, with Western (20.6%), Midwestern (17.7%), Northeastern (18.1%), and Southeastern (15.6%) officers all reporting similar levels of agreement. A similar percentage of respondents (19.1%) selected Slightly Agree among Western (21.3%), Midwestern (17.4%), Northeastern (18.1%), and Southeastern (20.6%) officers who reported similar levels of agreement.
The Aggregated Response Categories produced the following results:
• Strong Agreement → 18.3%: Western officers (27.2%) showed the highest level of strong agreement, while Southeastern officers (14.5%) reported the lowest.
• Broad Agreement → 35.8%: Western officers (47.8%) showed the highest level of broad agreement, while Southeastern officers (30.1%) reported the lowest level.
• General Agreement → 54.9%: Most officers indicated general agreement, with Western officers (69.1%) reporting the highest level of agreement and Southeastern officers (50.7%) reporting the lowest level of agreement.
Public Perception of Hunting
We defined negative impacts on public perception as any factor that could cause or has caused the public to perceive hunting and hunters negatively. A total of 36.7% of respondents selected Strongly Agree in the Direct Response Categories, indicating that illegal take negatively affects public perception of hunting (Table B6). Agreement was highest for Western officers (45.3%) and lower for Southeastern (35.7%) and Midwestern (33.9%) officers, while Northeastern officers (37.0%) fell in between. An additional 29.5% of respondents selected Moderately Agree, with Western (25.5%), Midwestern (31.7%), Northeastern (29.5%), and Southeastern (29.0%) officers all reporting similar levels of agreement. A smaller percentage of respondents (19.2%) selected Slightly Agree, with Western (17.5%), Midwestern (18.9%), Northeastern (19.2%), and Southeastern (20.1%) officers reporting similar levels of agreement.
The Aggregated Response Categories produced the following results:
• Strong Agreement → 36.7%: Western officers (45.3%) showed the highest level of strong agreement, while Midwestern officers (33.9%) reported the lowest level.
• Broad Agreement → 66.2%: Most officers indicated broad agreement, with Western officers (70.8%) reporting the highest level of agreement and Southeastern officers (64.6%) reporting the lowest level of agreement.
• General Agreement → 85.4%: A strong majority of officers reported general agreement, with Western officers (88.3%) reporting the highest level of agreement and Midwestern officers (84.5%) reporting the lowest level of agreement.
Biological & Social Impacts – Operational Level
Officers were also asked about their perceptions of the biological, experiential, and social impacts of illegal take in their operational (patrol) areas. These results are contained in Table B7.
Table B7 Conservation Officer perceptions of the negative impacts that illegal take of wildlife has on a given biological or social factor in their area of operation.
Table B7. Conservation Officer perceptions of the negative impacts that illegal take of wildlife has on a given biological or social factor in their area of operation
Land
Wildlife Populations
We defined a negative impact on wildlife populations as any factor that ultimately reduces the number of individuals in a population. A total of 23.8% of respondents selected Strongly Agree in the Direct Response Categories, indicating that illegal activities negatively impact wildlife populations (Table B7). This response was highest for Western officers (59.2%) and lower for Midwestern (17.7%), Northeastern (21.3%), and Southeastern (20.2%) officers An additional 27.0% of respondents selected Moderately Agree, with Western (19.4%), Midwestern (27.8%), Northeastern (27.7%), and Southeastern (28.0%) officers reporting similar levels of agreement. A smaller percentage of respondents (25.6%) selected Slightly Agree, with Midwestern (26.0%),
Northeastern (24.1%), and Southeastern (30.3%) officers reporting the highest level of agreement, while Western officers (11.7%) indicated the lowest level of agreement.
The Aggregated Response Categories produced the following results:
• Strong Agreement → 23.8%: Western officers (59.2%) showed the highest level of strong agreement, while Midwestern officers (17.7%) reported the lowest level.
• Broad Agreement → 50.8%: Most officers reported broad agreement, with Western officers (78.6%) reporting the highest level of agreement and Midwestern officers (45.5%) reporting the lowest level of agreement.
• General Agreement → 76.4%: A strong majority indicated general agreement, with Western officers (90.3%) reporting the highest level of agreement and Midwestern officers (71.5%) showing the lowest level of agreement.
Hunt Quality
We defined negative impacts on hunt quality as a decline in the robustness or health of a huntable animal, as measured by phenotypic characteristics. A total of 29.6% of the respondents selected Strongly Agree in the Direct Response Categories, indicating agreement on the negative impact of illegal take on huntable animal quality (Table B7) Agreement was highest for Western officers (50.5%) and lowest for Northeastern (23.3%) and Midwestern (24.7%) officers, with Southeastern officers (32.1%) falling in between. An additional 31.5% of respondents selected Moderately Agree, with Western (30.1%), Midwestern (30.9%), Northeastern (29.2%), and Southeastern (34.1%) officers reporting similar levels of agreement. A smaller percentage of respondents (21.4%) selected Slightly Agree, with Midwestern officers (26.4%) reporting the highest level of agreement, while Western officers (11.7%) reported the lowest level of agreement. The Northeastern (22.1%) and Southeastern (19.7%) officers fell in between, with the Southeastern officers being similar to the Western officers.
The Aggregated Response Categories produced the following results:
• Strong Agreement → 29.6%: Western officers (50.5%) showed the highest level of strong agreement, while Northeastern officers (23.3%) reported the lowest
• Broad Agreement → 61.1%: Most officers indicated broad agreement, with Western officers (80.6%) reporting the highest level of agreement and Northeastern officers (52.6%) indicating the lowest level of agreement.
• General Agreement → 82.5%: A strong majority of officers indicated general concern, with Western officers (92.2%) showing the highest level of agreement and Northeastern officers (74.7%) expressing the lowest level of agreement.
Hunt Opportunity
Negative impacts were defined as a decline in the availability of huntable animals. A total of 22.8% of the respondents selected Strongly Agree in the Direct Response Categories, indicating that illegal take negatively affects huntable animal availability (Table B7). Western officers (45.6%) reported the highest level of agreement, while Northeastern (19.4%), Midwestern (19.4%), and Southeastern (21.2%) officers indicated lower agreement. An additional 27.1% of respondents selected Moderately Agree, with Western (34.0%), Northeastern (29.2%), and Southeastern (26.4%)
officers reporting similar levels of agreement, while Midwestern officers (23.6%) were similar to the Northeastern and Southeastern officers but lower than the Western officers. A similar percentage of respondents (26.0%) selected Slightly Agree, with Western (12.6%) and Northeastern (20.9%) officers reporting the lowest levels of agreement, while Midwestern (29.2%) and Southeastern (31.0%) officers reported higher levels of agreement.
The Aggregated Response Categories produced the following results:
• Strong Agreement → 22.8%: Western officers (45.6%) showed the highest level of strong agreement, while Midwestern (19.4%) and Northeastern (19.4%) officers reported the lowest level.
• Broad Agreement → 49.8%: Western officers (79.6%) reported the highest level of broad agreement, while Midwestern officers (43.1%) expressed the lowest level.
• General Agreement → 75.8%: A strong majority of officers indicated general agreement, with Western officers (92.2%) expressing the highest level of agreement and Northeastern officers (69.6%) reporting the lowest level of agreement.
Land Access for Hunting
We defined the negative impact on lands accessible for hunting as a decrease in access by private landowners due to illegal activity. A total of 32.6% of respondents selected Strongly Agree in the Direct Response Categories, indicating that illegal take reduces available hunting land (Table B7) Agreement was higher for Western officers (40.2%) than for Midwestern officers (27.6%).
Southeastern (32.6%) and Northeastern (35.1%) officers reported levels between those of Western and Midwestern officers, but they were not significantly lower than those of Western officers. An additional 29.6% of respondents selected Moderately Agree, with Western (24.5%), Midwestern (30.4%), Northeastern (31.9%), and Southeastern (28.8%) officers all expressing similar levels of agreement. A smaller percentage of respondents (19.7%) selected Slightly Agree with Western (20.6%), Midwestern (18.2%), Northeastern (21.5%), and Southeastern (19.5%) officers reporting similar levels of agreement.
The Aggregated Response Categories produced the following results:
• Strong Agreement → 32.6%: Western officers (40.2%) showed the highest level of strong agreement, while Midwestern officers (27.6%) reported the lowest level.
• Broad Agreement → 62.2%: Most officers reported broad agreement, with Western officers (64.7%) indicating the highest level of agreement and Midwestern officers (58.0%) reporting the lowest level of agreement
• General Agreement → 81.9%: A strong majority of officers reported general agreement, with Northeastern officers (88.4%) indicating the highest level of agreement and Midwestern officers (76.2%) the lowest level of agreement
Personal Perception of Hunting
We defined negative impacts on personal perception as any factor that could cause an officer to perceive themselves or others negatively. An officer’s personal perception of hunting reflects their attitudes and beliefs about the activity, which can be influenced by illegal take. Many respondents reported that poaching negatively affected their perception of hunting, with significant regional
variation. A total of 18.7% of respondents selected Strongly Agree in the Direct Response Categories that illegal take negatively affects their personal perception of hunting. Western (30.4%), Midwestern (18.2%), Northeastern (20.6%), and Southeastern (14.2%) officers expressed similar levels of agreement. An additional 18.3% of respondents selected Moderately Agree, with Western (21.6%), Midwestern (16.1%), Northeastern (18.3%), and Southeastern (19.2%) officers all reporting similar levels of agreement. A similar percentage of respondents (18.7%) selected Slightly Agree for Western (19.6%), Midwestern (19.9%), Northeastern (16.7%), and Southeastern (18.9%) officers, all reporting similar levels of agreement (Table B7)
The Aggregated Response Categories produced the following results:
• Strong Agreement → 18.7%: Western officers (30.4%) showed the highest level of strong agreement, while Southeastern officers (14.2%) reported the lowest.
• Broad Agreement → 37.0%: Western officers (52.0%) showed the highest level of broad agreement, while Southeastern officers (33.4%) reported the lowest level.
• General Agreement → 55.7%: Most officers reported general agreement, with Western officers (71.6%) reporting the highest level of agreement and Southeastern officers (52.3%) reporting the lowest level of agreement.
Public Perception of Hunting
We defined negative impacts on public perception as any factor that could cause or has caused the public to perceive hunting and hunters negatively. A total of 35.1% of respondents selected Strongly Agree in the Direct Response Categories, indicating that illegal take negatively affects public perception of hunting (Table B7) Agreement was similar for Western (44.1%), Midwestern (33.9%), Northeastern (34.0%), and Southeastern (34.2%) officers. An additional 30.4% of respondents selected Moderately Agree, with Western (27.5%), Midwestern (28.7%), Northeastern (32.8%), and Southeastern (31.1%) officers all reporting similar levels of agreement. A smaller percentage of respondents (20.0%) selected Slightly Agree, with Western (17.6%), Midwestern (24.1%), Northeastern (18.6%), and Southeastern (18.3%) officers reporting similar levels of agreement
The Aggregated Response Categories produced the following results:
• Strong Agreement → 35.1%: Western officers (44.1%) showed the highest level of strong agreement, while Midwestern officers (33.9%) reported the lowest level.
• Broad Agreement → 65.5%: Most officers reported broad agreement, with Western officers (71.6%) reporting the highest level of agreement and Midwestern officers (62.6%) reporting the lowest level of agreement
• General Agreement → 85.5%: Most officers reported general agreement, with Western officers (89.2%) reporting the highest level of agreement and Southeastern officers (83.5%) indicating the lowest level of agreement
Discussion
Hunter Perceptions
Data from hunters indicated they generally believed that illegal take of wildlife has negative impacts at all geographic levels. For states in the West, this concern was significantly higher than that for other regions. While there are several possibilities for this difference, we suspect that it is due to the perceived or real scarcity of opportunities for big game such as elk, moose, sheep, and mule deer in most western states compared to the abundance of white-tailed deer in the Northeast and Southeast. For example, most western states use a quota system for big game species, which may result in hunters waiting multiple years between hunting opportunities. Conversely, many states in other regions offer at least some big game opportunities that can be purchased over the counter (without a drawing or lottery), allowing hunters to participate each year. This inability to consistently participate on an annual basis may cause law-abiding hunters to be more aware of the impact of illegal take on their personal experiences.
Western hunters perceived the illegal take of wildlife as more serious than those in other regions across all geographic, biological, and social levels. While this pattern might initially seem to suggest heightened awareness or stronger conservation values in this region, it is more likely to be attributed to larger states with higher percentages of public hunting land and lower human density. Northeastern hunters consistently reported lower levels of seriousness, which may be driven by land ownership patterns consisting of smaller parcels of private land, as opposed to the vast expanses of public land in the West. The findings may also be indicative of potential cultural, ecological or enforcement-related differences. Midwestern and Southeastern hunters reported moderate levels of agreement, with responses positioned between those of Western and Northeastern hunters.
These results underscore the need for targeted strategies to address hunters’ concerns regarding illegal take. The strong agreement among Western hunters may indicate either a higher awareness or more severe impacts, suggesting that this region could serve as a model for addressing this issue. The lower agreement levels of Northeastern hunters may indicate the need for increased outreach and education to increase awareness about the impacts of illegal take and align stakeholder perceptions with broader and more realistic impacts. Policy decisions and engagement efforts to reduce illegal wildlife take should consider these regional differences to enhance their effectiveness.
Landowner Perceptions
Landowner responses indicate a consensus on the negative impacts of illegal take on wildlife populations, hunting quality, and opportunities, with regional differences in intensity. Western landowners consistently reported the highest levels of agreement across most categories, underscoring their strong recognition of the consequences of illegal take. While acknowledging this issue, the midwestern and southeastern regions exhibited slightly lower agreement levels, potentially reflecting differences in enforcement, cultural attitudes, and ecological conditions.
The findings emphasize the need for region-specific strategies to address landowners’ concerns about illegal take. Tailored outreach, policy interventions, and community engagement programs can help align landowners’ perceptions with conservation goals. These data also highlight the importance of regional context in addressing illegal take’s impact on wildlife and hunting.
Similar to Western hunters, landowners in the western U.S. perceived the illegal take of wildlife as a more serious issue than those in other regions across geographic, biological, and social dimensions. Again, while this perception could reflect stronger conservation values or heightened awareness, it is more likely influenced by factors such as the larger size of western states, greater availability of public hunting lands, and lower human population density. In contrast, landowners in other regions consistently rated the seriousness of illegal take as lower, possibly due to differing land ownership patterns, particularly in the East, where smaller, privately owned parcels are more common than the expansive public lands of the West. These regional differences may also reflect underlying cultural, ecological, or law enforcement variations.
Ultimately, these regional differences in perceptions emphasize the importance of geographically tailored outreach and policy responses. For instance, the heightened concern among Western landowners could support efforts to strengthen enforcement in those areas, while awareness campaigns in the Northeast might help elevate the issue’s visibility. Cross-regional collaboration can also play a critical role in bolstering conservation efforts, particularly in regions where hunters frequently travel across state and regional boundaries to hunt.
Officer Perceptions
Regional disparities in conservation officers’ perceptions of illegal take of wildlife underscore the importance of localized approaches to enforcement, outreach, and policy development. Officers in the western U.S. consistently rated the issue as more serious across geographic, biological, and social dimensions than their counterparts in other regions did. While this heightened concern could reflect stronger conservation values, it is more likely shaped by contextual factors such as the predominance of public lands, lower population densities, and broader enforcement jurisdictions in western states. In contrast, officers in the Midwest, Northeast, and Southeast reported more varied perspectives, potentially influenced by smaller private landholdings, diverse ecological conditions, higher deer densities, and regional differences in public attitudes toward wildlife.
The strong and consistent agreement among Western officers suggests a unified recognition of the negative impacts of illegal take, making the West a potential model for identifying best practices. These may include targeted enforcement strategies, interagency collaboration, and proactive educational campaigns. Drawing on the factors that contribute to the cohesion of perception in the West could inform broader strategies in regions where concerns are less pronounced or more fragmented.
In areas such as the Northeast and Midwest, where officer perceptions are more variable, there is an opportunity to strengthen alignment through regionally relevant outreach and engagement. Public education campaigns tailored to local ecological, cultural, and recreational contexts may
help elevate awareness of illegal take and better align public and professional perceptions. Such initiatives, coupled with data-informed adjustments in enforcement and policy, can ensure that conservation priorities are responsive to real-world threats and to regional stakeholder values.
Ultimately, these findings demonstrate that conservation officers’ views on the seriousness of illegal wildlife take are not uniform across the United States. They highlight the importance of developing region-specific strategies that consider ecological differences, enforcement realities and cultural values. Addressing these regional disparities through tailored enforcement, public engagement, and strategic resource allocation is essential for reducing illegal take and achieving long-term conservation goals.
THIS PAGE INTENTIONALLY LEFT BLANK.
Appendix C. Distributions
of Respondents on Detection and Reporting of Illegal Take
Figure C1. Distribution of responses indicating the percentage of illegal take of wildlife that hunters (n=10,140) believe go undetected.
Figure C2. The distribution of responses indicating the percentage of illegal take of wildlife that landowners (n=2,951) believe go undetected.
Figure C3. Distribution of responses indicating the percentage of illegal take of wildlife that officers (n=1,080) believe go undetected.
Figure C4. The distribution of responses indicates the percentage of illegal take of wildlife that hunters (n=1,749) believe are detected but go unreported to law enforcement.
Figure C5. The distribution of responses indicating the percentage of illegal take of wildlife that landowners (n=563) believe are detected but go unreported to law enforcement.
Figure C6. The distribution of responses indicating the percentage of illegal take of wildlife that officers (n=1,075) believe are detected but go unreported to law enforcement.
Appendix D: Interstate Wildlife Violator Compact
The Wildlife Violator Compact as contained in this section is enacted into law and entered into on behalf of the State of Alaska with any other states legally joining it in a form substantially as follows:
ARTICLE I - FINDINGS, DECLARATION OF POLICY, AND PURPOSES
Section 1. Findings. The party states find that:
(a) Wildlife resources are managed in trust by the respective states for the benefit of all residents and visitors.
(b) The protection of their respective wildlife resources are materially affected by the degree of compliance with state statute, regulation, ordinance, or administrative rule relating to the management of those resources.
(c) The preservation, protection, management, and restoration of wildlife contributes immeasurably to the aesthetic, recreational, and economic aspects of those natural resources.
(d) Wildlife resources are valuable without regard to political boundaries and, therefore, all persons must be required to comply with wildlife preservation, protection, management, and restoration statutes, ordinances, and administrative rules and regulations of all party states as a condition precedent to the continuance or issuance of any license to hunt, fish, trap, or possess wildlife.
(e) The violation of wildlife laws interferes with the management of wildlife resources and may endanger the safety of persons and property.
(f) The mobility of many wildlife law violators necessitates the maintenance of channels of communications among the various states.
(g) In most instances, a person who is cited for a wildlife violation in a state other than the person's home state:
(1) Must post collateral or a bond to secure the person's appearance for a trial at a later date.
(2) If unable to post collateral or a bond, is taken into custody until the collateral or bond is posted; or
(3) Is taken directly to court for an immediate appearance.
(h) The purpose of the enforcement practices described in (g) of this section is to ensure compliance with the terms of a wildlife citation by the person who, if permitted to continue on the person's way after receiving the citation, could return to the person's home state and disregard the person's duty under the terms of the citation.
(i) In most instances, a person receiving a wildlife citation in the person's home state is permitted to accept the citation from the officer at the scene of the violation and continue immediately on the person's way after agreeing to comply with the terms of the citation.
(j) The practice described in (g) of this section causes unnecessary inconvenience and, at times, a hardship for the person who is unable at the time to post collateral, furnish a bond, stand trial, or pay a fine and, therefore, is compelled to remain in custody until another arrangement is made.
(k) The enforcement practices described in (g) of this section consume an undue amount of law enforcement time.
Sec. 2. Policies. The policies of the party states are to:
(a) Promote compliance with the statutes, ordinances, regulations and administrative rules relating to management of wildlife resources in their respective states.
(b) Recognize the suspension of wildlife license privileges of any person whose license privileges have been suspended by a party state and treat the suspension as if it had occurred in their state.
(c) Allow a violator to accept a wildlife citation, except as provided in subsection (b) of article III, and proceed on the person's way without delay whether or not the person is a resident in the state in which the citation was issued if the person's home state is a party to this compact.
(d) Report to the appropriate party state, as provided in the compact manual, any conviction recorded against any person whose home state was not the issuing state.
(e) Allow the home state to recognize and treat convictions recorded for its residents which occurred in another party state as if they had occurred in the home state.
(f) Extend cooperation to its fullest extent among the party states for obtaining compliance with the terms of a wildlife citation issued in one party state to a resident of another party state.
(g) Maximize the effective use of law enforcement personnel and information.
(h) Assist court systems in the efficient disposition of wildlife violations.
Sec. 3. Purposes. The purposes of this compact are to:
(a) Provide a means by which the party states may participate in a reciprocal program to carry out the policies set forth in section 2 of this article in a uniform and orderly manner.
(b) Provide for the fair and impartial treatment of wildlife violators operating within party states in recognition of the persons' right of due process in the sovereign status of a party state.
ARTICLE II - DEFINITIONS
As used in this compact, unless the context otherwise requires:
(a) “Citation” means any summons, complaint, summons and complaint, ticket, penalty assessment or other official document issued by a wildlife officer or other peace officer for a wildlife violation containing an order that requires the person to respond.
(b) “Collateral” means any cash or other security deposited to secure an appearance for trial in connection with the issuance by a wildlife officer or other peace officer of a citation for a wildlife violation.
(c) “Compliance” means the act of answering a citation by appearing in a court or tribunal or the payment of fines, costs, or surcharges, if any.
(d) “Conviction” means a conviction, including any court conviction, of any offense related to the preservation, protection, management, or restoration of wildlife which is prohibited by state statute, regulation, ordinance, or administrative rule, or a forfeiture of bail, bond, or other security deposited to secure the appearance of a person charged with any such offense, or the payment of a penalty assessment or a plea of nolo contendere, or the imposition of a deferred or suspended sentence by the court.
(e) “Court” means a court of law, including magistrate's court and the justice of the peace court.
(f) “Home state” means the state of primary residence of a person.
(g) “Issuing state” means the party state that issues a wildlife citation.
(h) “License” means any license, permit, or other public document that conveys to the person to whom it is issued the privilege of pursuing, possessing, or taking any wildlife regulated by statute, regulation, ordinance, or administrative rule of a party state.
(i) “Licensing authority” means:
(1) in each other party state, the department or division within the party state that is authorized by law to issue or approve licenses or permits to hunt, fish, trap, or possess wildlife; and
(2) in this state, the Department of Public Safety.
(j) “Party state” means any state that enacts legislation to become a member of this compact.
(k) “Personal recognizance” means an agreement by a person made at the time of the issuance of the wildlife citation that the person will comply with the terms of that citation.
(l) “State” means any state, territory, or possession of the United States, the District of Columbia, Commonwealth of Puerto Rico, Provinces of Canada, or any other countries.
(m) “Suspension” means any revocation, denial, or withdrawal of any license privileges, including the privilege to apply for, purchase, or exercise the benefits conferred by any license.
(n) “Terms of the citation” means those conditions and options expressly stated in the citation.
(o) “Wildlife” means all species of animals, including, but not limited to, mammals, birds, fish, reptiles, amphibians, mollusks and crustaceans, that are defined as wildlife and are protected or otherwise regulated by statute, regulation, ordinance, or administrative rule in a party state. Species included in the definition of wildlife vary from state to state and a determination of whether a species is wildlife for the purposes of this compact must be based on local law. In this state, “wildlife” means all species of fish and game as these terms are defined in AS 16.05.940.
(p) “Wildlife law” means any statute, regulation, ordinance, or administrative rule enacted to manage wildlife resources and the use thereof.
(q) “Wildlife officer” means any person authorized by a party state to issue a citation for a wildlife violation.
(r) “Wildlife violation” means any cited violation of statute, regulation, ordinance, or administrative rule enacted to manage wildlife resources and the use thereof.
ARTICLE III - PROCEDURES FOR ISSUING STATE
Issuing state procedures are as follows:
(a) When issuing a citation for a wildlife violation, a wildlife officer shall issue a citation to any person whose primary residence is in a party state in the same manner as if the person were a resident of the home state. The wildlife officer may not require the person to post collateral to secure that person's appearance, subject to the exceptions set forth in paragraph (b) of this article, if the officer receives the person's personal recognizance that the person will comply with the terms of the citation.
(b) Personal recognizance is permissible if: (1) it is not prohibited by local law or the compact manual; and
(2) the violator provides adequate proof of the violator's identity to the wildlife officer.
(c) Upon conviction or failure of a person to comply with the terms of a wildlife citation, the appropriate officer shall report the conviction or the failure to comply to the licensing authority of the party state in which the wildlife citation was issued. The report must be made in accordance with the procedures specified by the issuing state and contain information as specified in the compact manual as minimum requirements for effective processing by the home state.
(d) Upon the receipt of the report of conviction or noncompliance required by (c) of this article, the licensing authority of the issuing state shall transmit to the licensing authority in the home state of the violator the information in the manner prescribed in the compact manual.
ARTICLE IV - PROCEDURES FOR HOME STATE
Home state procedures are as follows:
(a) Upon the receipt of a report of failure to comply with the terms of a citation from the licensing authority of the issuing state, the licensing authority of the home state shall notify the violator and begin a suspension action in accordance with the home state's suspension procedures. The licensing authority of the home state shall suspend the violator's license privileges until satisfactory evidence of compliance with the terms of the wildlife citation has been furnished by the issuing state to the home state licensing authority. Due process rights must be accorded to the violator.
(b) Upon the receipt of a report of conviction from the licensing authority of the issuing state, the licensing authority of the home state shall enter the conviction in its records and consider the conviction as if it had occurred in the home state for the purposes of the suspension of license privileges.
(c) The licensing authority of the home state shall maintain a record of actions taken and make reports to the issuing states as provided in the compact manual.
ARTICLE V - RECIPROCAL RECOGNITION OF SUSPENSION
The party states agree that:
(a) All party states shall recognize the suspension of license privileges of any person by any state as if the violation on which the suspension is based had occurred in their state and would have been the basis for suspension of license privileges in their state.
(b) Each party state shall communicate information concerning the suspension of license privileges to the other party states in the manner prescribed in the compact manual.
ARTICLE VI - APPLICABILITY OF OTHER LAWS
The party states agree that, except as expressly required by the provisions of this compact, nothing included in this compact shall be construed to affect the right of any party state to apply any of its laws relating to license privileges to any person or circumstance or to invalidate or prevent any agreement or other cooperative arrangements between a party state and a nonparty state concerning wildlife law enforcement.
ARTICLE VII - COMPACT ADMINISTRATOR PROCEDURES
The party states agree that:
(a) For the purpose of administering the provisions of this compact and to serve as a governing body for the resolution of all matters relating to the operation of this compact, a board of compact administrators is hereby established. The board must be composed of one representative from each of the party states to be known as the compact administrator. The compact administrator shall be appointed by the head of the licensing authority of each party state and shall serve and be subject to removal in accordance with the laws of the state that the compact administrator represents. A compact administrator may provide for the discharge of the compact administrator's duties and the performance of the compact administrator's functions as a board member by an alternate. An alternate may not serve unless written notification of the alternate's identity has been given to the board.
(b) Each member of the board of compact administrators is entitled to one vote. No action of the board is binding unless taken at a meeting at which a majority of the total number of votes on the board are cast in favor thereof. Action by the board must be only at a meeting at which a majority of the party states are represented.
(c) The board shall elect annually, from its membership, a chair and vice chair.
(d) The board shall adopt bylaws, not inconsistent with the provisions of this compact or the laws of a party state, for the conduct of its business and may amend or rescind its bylaws.
(e) The board may accept for any of its purposes and functions under this compact any donations and grants of money, equipment, supplies, materials, and services, conditional or otherwise, from any state, the United States, or any governmental agency and may receive, use, and dispose of them as it deems appropriate.
(f) The board may contract with, or accept services or personnel from, any governmental or intergovernmental agency, person, firm, corporation, or private nonprofit organization or institution.
(g) The board shall establish all necessary procedures and develop uniform forms and documents for administering the provisions of this compact. All procedures and forms adopted pursuant to board action must be included in the compact manual.
ARTICLE VIII - ENTRY INTO AND WITHDRAWAL FROM COMPACT
The party states agree that:
(a) This compact becomes effective upon adoption by at least two states.
(b) Entry into the compact must be made by a resolution of ratification executed by the authorized officers of the applying state and submitted to the chairman of the board of compact administrators.
(c) The resolution must be in a form and content as provided in the compact manual and include:
(1) A citation of the authority by which the state is authorized to become a party to this compact.
(2) An agreement to comply with the terms and provisions of the compact; and
(3) A statement that entry into the compact is with all states then party to the compact and with any state that legally becomes a party to the compact.
(d) The effective date of entry must be specified by the applying state, except that the effective date must not be less than 60 days after notice has been given by:
(1) The chair of the board of the compact administrators; or (2) The secretary of the board of compact administrators to each party state that the resolution from the applying state has been received.
(e) A party state may withdraw from the compact by giving official written notice to the other party states. A withdrawal does not take effect until 90 days after the notice of withdrawal is given. The notice must be directed to the compact administrator of each party state. The withdrawal of a party state does not affect the validity of the compact as to the remaining party states.
ARTICLE IX - AMENDMENTS TO THE COMPACT
The party states agree that:
(a) This compact may be amended from time to time. Amendments must be presented in resolution form to the chair of the board of compact administrators and may be proposed by one or more
party states.
(b) The adoption of an amendment must be endorsed by all party states and becomes effective 30 days after the date the last party state endorses the amendment.
(c) The failure of a party state to respond to the chair of the board of compact administrators within 120 days after the receipt of the proposed amendment constitutes an endorsement.
ARTICLE X - CONSTRUCTION AND SEVERABILITY
The party states agree that this compact must be liberally construed so as to carry out the purposes stated in the compact. The provisions of this compact are severable and if any phrase, clause, sentence or provision of the compact is declared to be contrary to the constitution of any party state or the United States or the applicability thereof to any government, agency, person, or circumstance is held invalid, the validity of the remainder of the compact is not affected thereby. If this compact is held contrary to the constitution of any party state thereto, the compact remains in effect as to the remaining states and to the state affected as to all severable matters.
ARTICLEXI - TITLE
The party states agree that this compact will be known as the Wildlife Violator Compact.
Jonathan Gassett, Ph.D. – WMI Southeast Field Representative
Dr. Jon Gassett has served as the Southeastern Field Representative for Wildlife Management Institute (WMI) since 2013. He is also the owner of Southern Wildlife Resources, LLC. Jon has more than 25 years’ experience as a biologist, planner, supervisor, and administrator. Prior to joining WMI, he served as the Commissioner for the Kentucky Department of Fish and Wildlife Resources, which included oversight of all agency divisions including strategic planning, personnel management, program oversight, budget development and tracking, and statutory, regulatory, and policy development and implementation. Jon also served as Wildlife Division Director and Big Game Coordinator for Kentucky. Jon has served as President of the Association of Fish and Wildlife Agencies, the Southeastern Association of Fish and Wildlife Agencies, and the Midwest Association of Fish and Wildlife Agencies, and has chaired numerous committees in all three Associations. Jon serves on the Board of Directors of the National Conservation Leadership Institute, and the Northern Bobwhite Conservation Initiative. He has owned and operated Southern Wildlife Resources, a consulting business that provides comprehensive solutions to conservation initiatives and issues at the local, state, regional, and national level, since its creation in 2007. Jon is a graduate of the inaugural class of the National Conservation Leadership Institute and holds Ph.D. and M.S. Degrees in Forest Resources from the University of Georgia and a B.S. Degree in Biology from Kennesaw State University.
Kristie R. Blevins, Ph.D. – Professor of Criminal Justice and Criminology
Dr. Kristie Blevins is a criminologist and Professor in the School of Justice Studies at Eastern Kentucky University. She received her Ph.D. in Criminal Justice from the University of Cincinnati. Her research interests include wildlife crime, crime prevention, and the occupational reactions of wildlife conservation officers and criminal justice employees. Her work can be found in outlets such as the Journal of Offender Rehabilitation, Criminal Justice Policy Review, American Journal of Criminal Justice, Deviant Behavior, and International Journal of Police Science and Management. She teaches upper division and graduate level classes in data analysis, research methodology, and statistics. She previously served as a Professor of Criminology and Criminal Justice for the University of North Carolina – Charlotte and Eastern Tennessee State University.
Steve Williams, Ph.D. – WMI President (Retired)
Dr. Steven Williams is the past President of WMI, a 114-year-old, non-profit conservation organization dedicated to science-based, professional wildlife management. WMI’s mission is to enhance North American wildlife populations, their habitat, and the continent’s hunting heritage. Steve serves on the BlueRibbon Panel Relevancy Working Group (Co-Chair), National Deer Alliance (Co-Vice Chair), American Wildlife Conservation Partners, Council to Advance Hunting and Shooting Sports (Co-Vice Chair), and Board Chair of the National Conservation Leadership Institute. He is a professional member of the Boone and Crockett Club and The Wildlife Society. Prior to joining WMI, Steve served as Director of the U. S. Fish and Wildlife Service, the Kansas Governor’s Cabinet Secretary of the Department of Wildlife and Parks, Deputy Executive Director of the Pennsylvania Game Commission, and both Assistant Director for Wildlife and Deer Project Leader for the Massachusetts Division of Fisheries and Wildlife. He received his B.S. and Ph.D. Degrees from The Pennsylvania State University and an M.S. Degree from the University of North Dakota.