
1. A study is conducted on students taking a statistics class. Several variables are recorded in the survey. Identify each variable as categorical or quantitative.
A. The type of car the student owns
B. The number of credit hours taken during that semester
C. The time the student waited in line at the bookstore to pay for his or her textbooks
D. The home state of the student
ANSWER: A. Categorical, B. Quantitative, C. Quantitative, D. Categorical
2. Researchers are conducting a state-wide survey for the U.S. Postal Service. The survey records many different variables of interest. Which of the following variables is categorical?
a. The county of residence
b. The number of people, both adults and children, living in the household
c. The total household income, before taxes, in 2020
d. The age of the respondent ANSWER: a
3. A particularly common question in the study of wildlife behavior involves observing contests between ―residents‖ of a particular area and ―intruders.‖ In each contest, the residents either win or lose the encounter (assuming there are no ties). Observers might record several variables, some of which are listed below. Which of these variables is categorical?
a. The duration of the contest (in seconds)
b. The number of animals involved in the contest
c. Whether the residents win or lose
d. The total number of contests won by the residents ANSWER: c
4. A description of different houses on the market includes the following three variables. Which of these variables is quantitative?
a. The square footage of the house
b. The monthly gas bill
c. The monthly electric bill
d. All of the above ANSWER: d
5. Jason is buying a smartphone. He is comparing various models using many different variables. These variables will play an important role as he decides which smartphone he will buy. Identify each of the following variables as categorical or quantitative.
A. Does the smartphone have fast-charging capability?
B. How many megapixels does the front-facing camera have?
Copyright Macmillan Learning. Powered by Cognero. Page
C. What operating system does the smartphone use?
D. How much does the smartphone cost?
ANSWER: A. Categorical, B. Quantitative, C. Categorical, D. Quantitative
6. A variable is a characteristic of a:
a. case.
b. label.
c. value.
d. None of the above
ANSWER: a
7. Categorical variables place cases into group(s).
a. one
b. no
c. many
d. numeric
ANSWER: c
8. Variables that take numeric values for which arithmetic operations make sense are called _______.
a. quantitative
b. categorical
c. distributions
d. cases
ANSWER: a
9. Variables on which arithmetic operations do not make sense are called _______.
a. quantitative
b. categorical
c. distributions
d. cases
ANSWER: b
10. Variables take on ________.
a. values
b. cases
c. distributions
d. None of the above
ANSWER: a
11. What are labels used for in data sets?
a. To identify distributions
Copyright Macmillan Learning. Powered by Cognero. Page
b. To identify values
c. To identify cases
d. None of the above
ANSWER: c
12. We have a data set where the cases are college students. One of the variables in the data set is ―gender.‖ The values of gender are 1 if the student is male and 2 if the student is female. What type of variable is gender?
a. Quantitative
b. Categorical
c. Quantitative and categorical
d. None of the above
ANSWER: b
13. We have a data set where the cases are college students. One of the variables in the data set is ―age of the student.‖ What type of variable is age of the student?
a. Quantitative
b. Categorical
c. Quantitative and categorical
d. None of the above
ANSWER: a
14. We have a data set where the cases are college students. One of the variables in the data set is ―hometown.‖ What type of variable is hometown?
a. Quantitative
b. Categorical
c. Quantitative and categorical
d. None of the above
ANSWER: b
15. Units of measurement are an important part of the description of what type of variables?
a. Quantitative
b. Categorical
c. Quantitative and categorical
d. None of the above
ANSWER: a
16. Is the distribution shown below unimodal?
Copyright Macmillan Learning. Powered by Cognero. Page 3

a. No
b. Yes
ANSWER: a
17. Suppose you are interested in comparing the quality of different hospitals based on infections that have occurred from surgery. Which of the following would be the better way to measure such a variable?
a. Rate of infections
b. Count of infections
c. None of the above
ANSWER: a
18. Suppose you own a pizza delivery company and you are trying to determine the best campus on which to sell pizza. What would be the best measurement to make the comparison?
a. Average number of pizzas purchased
b. Count of pizzas purchased
c. Rate of pizzas purchased
d. None of the above
ANSWER: b
19. The first day of class, the professor collects information on each student to make a data set that will be analyzed throughout the semester. The information asked includes hometown, GPA, number of classes, number of siblings, and favorite subject. How many variables are in this data set?
a. 1
b. 2
c. 5
d. None of the above
ANSWER: c
20. The first day of class, the professor collects information on each student to make a data set that will be analyzed throughout the semester. The information asked includes hometown, GPA, number of classes taking, number of siblings, and favorite subject. How many quantitative variables are in this data set?
a. one
b. two
c. three
d. five
ANSWER: c
21. The first day of class, the professor collects information on each student to make a data set that will be analyzed throughout the semester. The information asked includes hometown, GPA, number of classes taking, number of siblings, and favorite subject. How many categorical variables are in this data set?
a. one
b. two
Copyright Macmillan Learning. Powered by Cognero. Page 4
c. three
d. four
ANSWER: b
22. The first day of class, the professor collects information on each student to make a data set that will be analyzed throughout the semester. The information asked includes hometown, GPA, number of classes taking, number of siblings, and favorite subject. What are the cases in this data set?
a. The semester
b. The professor
c. The college students
d. None of the above
ANSWER: c
23. Below is a data set with information on students in a basic statistics class at a local university. Which variable is the label?
a.
b.
c.
d. Major
24. Below is a data set with information on students in a basic statistics class at a local university. What is a key characteristic of the data set?
Copyright Macmillan Learning. Powered by Cognero. Page 5
a. There are 10 students in the data set.
b. The data describe students in a class.
c. There are three variables in the data set.
d. All of the above
ANSWER: d
25. Below is a data set with information on students in a basic statistics class at a local university. How many categorical variables are in this data set?
a. none
b. one
c. two
d. three
ANSWER: d
26. Categorical variables are best displayed by ______.
a. histograms
b. pie charts
c. bar graphs or histograms
d. pie charts or bar graphs
ANSWER: d
27. The distribution of a categorical variable is displayed using _______.
a. letters
b. counts only
c. percents only
d. counts or percents
ANSWER: d
28. When a pie chart id used, the sum of all the percents should be _____.
Copyright Macmillan Learning. Powered by Cognero. Page 6
a. 0
b. 1
c. 100
d. 50
ANSWER: c
29. Quantitative variables are best displayed using _______.
a. stemplots
b. histograms
c. bar graphs or stemplots
d. stemplots or histograms
ANSWER: d
30. Consider the following data, which describe the amount of time in minutes that students spend studying for a quiz:
10, 11, 11, 12, 12, 14, 15, 18, 19, 20, 22, 24, 39, 40, 41, 44, 46, 50, 52, 52, 53, 55, 70
What numbers make up the leaf of the first stem?
a. 0,1,1,2,2,4,5,8,9
b. 0,1,2,4,5,8,9
c. 0,1,1,2,2,4,5,8,9,0,2,4,9,0,1,4,6,0,2,2,3,5,0
d. None of the above
ANSWER: a
31. Consider the following data, which describe the amount of time in minutes that students spend studying for a quiz:
10, 11, 11, 12, 12, 14, 15, 18, 19, 20, 22, 24, 39, 40, 41, 44, 46, 50, 52, 52, 53, 55, 70
What numbers make up the leaf of the last stem?
a. 0,1,1,2,2,4,5,8,9
b. 0,1,4,6
c. 0,2,2,3,5,0
d. None of the above
ANSWER: d
32. Consider the following data, which describe the amount of time in minutes that students spend studying for a quiz:
10, 11, 11, 12, 12, 14, 15, 18, 19, 20, 22, 24, 39, 40, 41, 44, 46, 50, 52, 52, 53, 55, 70 What numbers make up the stem?
a. 1,2,3,4,5,6,7
b. 1,2,3,4,5,7
c. 0,1,1,2,2,4,5,8,9,0,2,4,9,0,1,4,6,0,2,2,3,5,0
d. None of the above
ANSWER: a
Copyright Macmillan Learning. Powered by Cognero. Page 7
33. Consider the following data, which describe the amount of time in minutes that students spend studying for a quiz:
10, 11, 11, 12, 12, 14, 15, 18, 19, 20, 22, 24, 39, 40, 41, 44, 46, 50, 52, 52, 53, 55, 70
What numbers make up the leaf of the first stem if you were splitting the stems?
a. 0,1,1,2,2,4,5,8,9
b. 0,1,2,4,5,8,9
c. 0,1,1,2,2,4
d. 0,1,2,4
ANSWER: c
34. Consider the following data, which describe the amount of time in minutes that students spend studying for a quiz:
10, 11, 11, 12, 12, 14, 15, 18, 19, 20, 22, 24, 39, 40, 41, 44, 46, 50, 52, 52, 53, 55, 70
What numbers would make up the leaf of the last stem if you were splitting the stems?
a. 0,2,2,3,5,0
b. 0
c. 0,2,3,5
d. No leaves on the last stem
ANSWER: c
35. What method is most useful in comparing two distributions using a stemplot?
a. Splitting the stem
b. Trimming the leaves
c. Back-to-back stemplots
d. None of the above
ANSWER: c
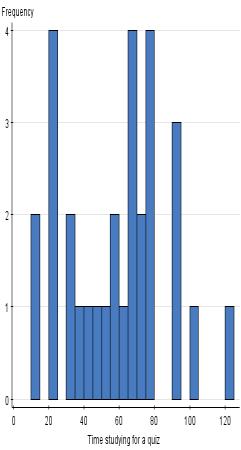
36. Thirty students were asked, ―How much time did you spend studying for the last quiz?‖ The histograms below were all used on the same data; however, the class size was changed for each one. Which histogram below best displays the data?
Copyright Macmillan Learning. Powered by Cognero. Page

Copyright Macmillan Learning. Powered by Cognero. Page


ANSWER: a
37. The stemplot below displays data from 30 students who were asked, ―How much time in minutes do you spend on the Internet?‖ What do you notice about the stemplot? In the stemplot, 3|2 represents 32 minutes.
Copyright Macmillan Learning. Powered by Cognero. Page
a. The stems are split.
b. The stems are not split.
ANSWER: a
38. Large data sets with quantitative variables are best displayed using ________.
a. stemplots
b. histograms
c. stemplots and histograms
d. none of the above
ANSWER: b
39. When histograms are made, the classes ________.

a. should be equal in width
b. do not need to be equal in width
c. should be selected randomly
d. should always be a width of 10
ANSWER: a
40. The histogram below shows data from 30 students who were asked, ―How much time do you spend on the Internet in minutes?‖ How could you improve the histogram to better display the distribution?
Copyright Macmillan Learning. Powered by Cognero. Page
a. Increase the class size.
b. Decrease the class size.
c. Do nothing the histogram is appropriate as is.
d. Add two more data points,
ANSWER: a
41. The histogram below shows data from 30 students who were asked, ―How much time do you spend on the Internet in minutes?‖ Which of the following is a feature of the data?
Copyright Macmillan Learning. Powered by Cognero. Page 14

a. There is a potential outlier.
b. Most values are around 800.
c. The range of values is between 0 and 400.
d. None of the above
ANSWER: a
42. The appearance of a histogram changes when you _______.
a. change the class size
b. add more data

c. remove outliers
d. all of the above
ANSWER: d
43. The tails of a distribution show _______.
a. the center
b. any extreme values
c. the median
d. none of the above
ANSWER: b
Copyright Macmillan Learning. Powered by Cognero. Page
44. When using a histogram to display categorical values, you should make sure the categories are in alphabetical order.
a. True histograms are not useful if the categories are not in order.
b. True histograms can be used on any type of data.
c. False You cannot use histograms to display categorical data.
d. False The categories must not be in alphabetical order when categorical data are displayed.
ANSWER: c
45. When displaying the distribution of quantitative data, it is best to use:

a. pie charts.
b. bar graphs.
c. histograms.
d. stemplots or histograms.
ANSWER: d
46. A sample of employees of a large pharmaceutical company has been obtained. The length of time (in months) working for the company was recorded for each employee. A stemplot of these data is shown below. In the stemplot, 6|2 represents 62 months.
What would be a better way to represent this data set?
a. Display the data in a time plot.
b. Display the data in a boxplot.
c. Split the stems.
d. Use a histogram with class width equal to 10.
ANSWER: c
47. Data are collected from 1100 randomly selected students who graduated between 2018 and 2020 from the University of Florida. Some of the variables that were collected are listed below. Identify each of the following variables as categorical or quantitative.
A. Gender of the student
B. School or college from which the student graduated
C. Annual salary at the first job after graduation
D. Graduation date in terms of semester (e.g., fall 2018, spring 2019, etc.)
ANSWER: A. Categorical, B. Categorical, C. Quantitative, D. Categorical
Copyright Macmillan Learning. Powered by Cognero. Page 16
48. When drawing a histogram, it is important to
a. have a separate class interval for each observation to get the most informative plot.
b. make sure the heights of the bars exceed the widths of the class intervals, so that the bars are true rectangles.
c. label the vertical axis so the reader can determine the count or percent in each class interval.
d. make certain the mean and median are contained in the same class interval, so that the correct type of skewness can be identified.
ANSWER: c
49. In a statistics class with 136 students, the professor records how much money each student has in her or his possession during the first class of the semester. The histogram shown below represents the data collected.

Which of the following description(s) is (are) correct regarding the shape of the histogram?
a. Skewed right
b. Skewed left
c. Symmetric
d. Includes an outlier
e. Unimodal
f. Bimodal
ANSWER: a, d, e
50. The histogram below represents the height (in inches) of the gold medal
winning high jumps for the Olympic Games up until Sydney 2000.
Copyright Macmillan Learning. Powered by Cognero. Page 17
What is approximately the mean height?

a. 75 inches
b. 77.5 inches
c. 82 inches
d. 90 inches
ANSWER: c
51. A consumer agency is testing appliances for a series of articles in their magazine. Currently they are working with cooktops and ranges. They have selected 16 of the most commonly used models. Using a series of tests, the agency will estimate the lifetime of these models. A histogram of these (estimated) lifetimes is shown below.
Copyright Macmillan Learning. Powered by Cognero. Page 18
Select all correct descriptions for the shape of the histogram of the estimated lifetimes of these 16 appliances.

a. Symmetric
b. Unimodal
c. Skewed right
d. Skewed left
ANSWER: b, c
52. During the early part of the 1994 baseball season, many sports fans and baseball players noticed that the number of home runs being hit seemed to be unusually large. Below are separate stemplots for the number of home runs by American League and National League teams based on the team-by-team statistics on home runs hit through Friday, June 3, 1994 (from the Columbus Dispatch, Sunday, June 5, 1994).

Legend: In these stemplots, 2|9 represents 29. What is the median number of home runs for the American League teams?
a. 45
b. 50
c. 50.5
d. 57.5
ANSWER: d
53. During the early part of the 1994 baseball season, many sports fans and baseball players noticed that the
Copyright Macmillan Learning. Powered by Cognero. Page 19
number of home runs being hit seemed to be unusually large. Below are separate stemplots for the number of home runs by American League and National League teams based on the team-by-team statistics on home runs hit through Friday, June 3, 1994 (from the Columbus Dispatch, Sunday, June 5, 1994).

Legend: In these stemplots, 2|9 represents 29. Determine whether each of the following statements is true or false.
A. The American League plot is reasonably symmetric.
B. The National League plot is bimodal.
C. The median number of home runs hit by National League teams for this time period was higher than the median number for the American League teams.
D. The lowest number of home runs hit by any team for this time period is 29.
ANSWER: A. True, B. False, C. False, D. True
54. During the early part of the 1994 baseball season, many sports fans and baseball players noticed that the number of home runs being hit seemed to be unusually large. Below are separate stemplots for the number of home runs by American League and National League teams based on the team-by-team statistics on home runs hit through Friday, June 3, 1994 (from the Columbus Dispatch, Sunday, June 5, 1994).
Legend: In these stemplots, 2|9 represents 29. What is the mean number of home runs for the National League teams?
a. 45
b. 50
c. 50.1
d. 57.5
ANSWER: c
55. During the early part of the 1994 baseball season, many sports fans and baseball players noticed that the number of home runs being hit seemed to be unusually large. Below are separate stemplots for the number of home runs by American League and National League teams based on the team-by-team statistics on home runs hit through Friday, June 3, 1994 (from the Columbus Dispatch, Sunday, June 5, 1994).
Copyright Macmillan Learning. Powered by Cognero. Page 20
Legend: In these stemplots, 2|9 represents 29. What is the maximum number of home runs from a National League team?

a. 7
b. 70
c. 67
d. 48
ANSWER: c
56. The following pie chart provides information on all the majors at a university.

What conclusion can be drawn on the basis of this pie chart?
a. The most popular major is in the ―Other‖ category, so it is not shown.
Copyright Macmillan Learning. Powered by Cognero. Page
b. More than half of the students at this university are majoring in Public Health, French, Business, Computer Science, or Economics.
c. More students are majoring in Education than in French.
d. The smallest major is Mathematics/Statistics
ANSWER: b
57. Consumers Union measured the gas mileage in miles per gallon of 38 automobiles from the 1978–1979 model year on a special test track. The pie chart below provides information about the country of manufacture of the automobiles used in this study.

Which of the following bar graphs represents the same data as the pie chart?
Copyright Macmillan Learning. Powered by Cognero. Page 22

ANSWER: b

58. The time plot below gives the number of burglaries committed each month for a city in Ohio. The plot is for the three-year period of January 1987 to December 1989.

Copyright Macmillan Learning. Powered by Cognero. Page

Determine whether each of the following statements is true or false.
A. The number of burglaries in each month of 1988 was lower than the number of burglaries in each month of 1989.
B. The median number of burglaries per month in 1988 was a little over 25.

C. The total number of burglaries in 1989 was higher than in 1988.
D. The graph is bimodal.
ANSWER: A. False, B. False, C. True, D. False
59. 5 A study of 2007 model automobiles was conducted. In the study the following variables were considered: the Region in which the car was manufactured (Europe, North America, Asia); the Type of automobile (compact, midsize, large); the fuel economy in city driving of the automobile (MPG-City); volume of the engine in liters (EngSize); and the type of Fuel used (regular, premium, diesel).The variables Region, Type, MPG-City, EngSize, and Fuel are, respectively,
a. quantitative, categorical, categorical, quantitative, quantitative.
b. categorical, categorical, quantitative, categorical, categorical.
c. categorical, categorical, quantitative, categorical, quantitative.
d. categorical, categorical, quantitative, quantitative, categorical.
e. This cannot be determined without knowing the values of the various variables.
ANSWER: d
Copyright Macmillan Learning. Powered by Cognero. Page 24