
An Adventure in Statistics: The Reality Enigma
Chapter 1: Why you need science
1. The research process involves a series of steps to systematically reach conclusions about a phenomenon of interest. We observe that there are differences in the salaries of men and women for doing the same job, what is the population of interest that we would need to collect information on to carry out our research?
a) All individuals aged 18 and over in a population
b) Male workers earning more than the average salary
c) All individuals who are at the legal age of working
d) All individuals who have worked at least 1 hour in the last week
Ans: D
Explanation: we are interested in comparing the salaries of men and women who participate in the labour market
2. Which statement best describes a theory?
a) An approach to explain a phenomenon in the real world
b) A set of principles that describe individuals’ behaviours
c) A set of principles specific to the observation or situation of interest
d) A general principle that applies to all populations
Ans: A
Explanation: a theory is a principle or set of principle that we use to explain an observed situation or event (i.e., a phenomenon) that include but is not limited to individuals’ behaviours
3. For the following statements, indicate which ones are non-scientific:
a) Friendship bonds are unbreakable
b) Dogs are better than cats
c) Films are better enjoyed with popcorn
Ans: B
a) Scientific: we can measure the length of any friendship bond, which might or might not last forever
b) Non-scientific: individuals’ preferences for dogs or cats can be measured; however, we cannot have an objective measure of which animal is best.
c) Scientific: we can measure the level of satisfaction of the same people watching a film with and without popcorn and find out whether there are differences in their level of enjoyment.
4. When do we need to draw a random sample?
a) When we have information from all entities of interest
b) When the population is large enough to be representative
c) When the population is too big to collect data for all the entities of interest
d) When we need information about entities that are representative of the population
Ans: C
Explanation: for large populations is not feasible to collect data for all entities (e.g., individuals), so we need to draw a random sample that ensures it is representative of the population
5. We draw 5 samples of 30 young adults aged between 18 and 25 to conduct some research on the number of concerts young adults go to within a year. We find the following averages: 6, 14, 7, 10 and
9. What can we conclude from the given information?
a) The sampling variation would get larger with an additional 5 samples
b) Most samples overestimate the true parameter of the population
c) The sampling error is largest for the sample with an average statistic of 6 concerts a year
d) The best estimate we have of the population parameter is the average of these 5 sample statistics
Ans: D
Explanation: In the absence of knowing the true value of the mean of the population from which have drawn our samples, the best estimate is the mean of our samples means.
6. The assertion that a variable measured in natural conditions causes an outcome to vary is possible under:
a) A longitudinal research design
b) A cross-sectional research design
c) An experimental research design
d) An exploratory research design
Ans: D
Explanation: we could establish a relationship between two variables that have not been manipulated by the researcher (natural conditions). Also, and provided we use a longitudinal research design, we could determine a time sequence between the cause occurring prior to the effect. However, without the possibility of using an experimental design, we would need to rule out any other confounding variables as potentially being the cause.
7. When the results of an experiment can be applied to real-world conditions, that experiment is said to have:
a) Criterion validity
b) Ecological validity
c) Content validity
d) Factorial validity
Ans: B
Explanation: For a research study to possess ecological validity, the methods, materials and setting of the study must approximate the real-life situation that is under investigation
8. Imagine that we find an association between people drowning in a lake and consumption of ice cream. What is the correct conclusion we can draw from this association?
a) The higher intake of ice cream positively affects the chances of drowning
b) A tertium quid variable ‘month of the year’ is influencing both variables
c) We can conclude a cause-effect between ice-cream consumption and drowning
d) The association between intake of ice cream and drowning in a lake is weak
Ans: B
Explanation: The summer season triggers more bathers into lakes, which increases the risk of drowning, while the heat in summer induces more people to consume ice-creams.
9. A variable manipulated by a researcher is known as:
a) An independent variable
b) A dependent variable
c) A confounding variable
d) A discrete variable
Ans: A
Explanation: An independent variable (or predictor variable) is a variable that is thought to be the cause of some effect. This term is usually used in experimental research to denote a variable that the experimenter has manipulated.
10. The purpose of a control condition is to:
a) Show up relationships between predictor variables.
b) Control for participant characteristics.
c) Rule out a tertium quid
d) Allow inferences about a cause.
Ans: D
Explanation: A properly constructed control condition provides you with a reference point to determine what change (if any) occurred when a variable was modified.
11. In a study interested in comparing the effects of owning or not a cat on single adults’ emotional well-being, what statement about the variation is correct?
a) The systematic variation will be bigger than unsystematic variation
b) The systematic and unsystematic will be about the same
c) The unsystematic variation will be greater than systematic variation
d) In this kind of study design the variation is not an issue
Ans: C
Explanation: In independent designs in which we contrast two groups, with or without a cat, we have narrower scope to control for noise, thus we have more variability that is uncontrolled
12. If we want to tackle potential problems of variation in a study using a within-subject design, an efficient strategy would be to:
a) Assign participants of an experiment to random conditions
b) Assign participants with similar characteristics to a different order of tasks
c) Set at least three different conditions
d) Set a randomized order to complete tasks
Ans: D
Explanation: in repeated-measured designs, counterbalancing is implemented to eliminate sources of systematic variation; Latin squares design assign individuals a different order to the conditions established in an experiment. The most efficient way is by randomly assigning a different order to all the subjects.
13. Controlling for compositional characteristics in a randomized experiment is important because:
a) It allows for measuring the amount of systematic and unsystematic variation
b) We can determine the effect of the independent variable
c) We can be certain that differences within entities are due to systematic variation
d) It allows for avoiding problems with ethical issues
Ans: B
Explanation: If we control for the differences in, for instance, sex, age, social class, artistic skills, we reduce the noise from unsystematic variation, and, thus, we can be more certain about the effect of the manipulation of the cause (i.e., the manipulation of the independent variable) on the outcome.
14. In general, as the sample size (N) increases:
a) The confidence interval gets wider.
b) The confidence interval gets narrower.
c) The confidence interval is unaffected.
d) The confidence interval becomes less accurate.
Ans: B
Explanation: with a larger sample size, the sample resembles more closely to the population of interest which allows for a better estimation of the range of values that the true value of the population is likely to fall.
15. Confidence intervals:
a) Can be used instead of conventional statistics based on point estimates.
b) Are not frequently used in research articles because they can mislead the reader.
c) Are constructed using subjective evaluations of confidence.
d) None of these options are correct.
Ans: A
Explanation: the point estimate sits in the middle of the confidence interval.
16. An interval estimate represents:
a) The size of the effect of the computed statistic
b) A range of values containing the population value
c) A range of values indicating the sampling variability
d) A range of values within which the population value is expected to fall
Ans: D
Explanation: interval estimates set the limits within which the true value of the population is likely to be found.
Chapter 2: Reporting research, variables and measurement
1. What is a scientific journal?
a) A piece of scientific research that has not yet been published.
b) A collection of articles written by scientists that have been peer-reviewed.
c) A notebook kept by scientists containing important details of all their own experimental research for future reference.
d) A collection of articles written by scientists that have not yet been reviewed by other scientists in the field.
Ans: A
Explanation: Scientific journals contain articles that have been peer-reviewed, in an attempt to ensure that articles meet the journal’s standards of quality and scientific validity.
2. Which of the following statements is correct about working out the result of an equation?
a) We should resolve multiplications after divisions
b) The last order in the calculations is always the subtraction
c) The order of multiplication or division depends on their position in the equation
d) The exponent takes precedence over the parenthesis
Ans: C
Explanation: multiplications and divisions are resolved as encountered first when going from left to right.
3. Short questions:
a) what represents y6?
b) What represents 2 2x ?
c) What represents x?
Ans:
a) The outcome for person 6
b) The score of the entity (e.g., a person) 2 to the power of 2
c) A predictor variable
4. In what circumstances is indicated to use reverse phrasing in a questionnaire?
a) In the need of constructing nominal scales
b) A construct with several items ordinally scored
c) To obtain balanced scores in summing up different items
d) With constructs that are likely to yield high scores
Ans: B
Explanation: in questionnaires with several questions related to a construct, adding reverse-phasing is a method to avoid response bias.
5. Read the following list of variables and decide which ones can be directly observed and which are constructs:
a) Religion
b) Happiness
c) Size of the industry sector
d) Confidence
Ans:
a) Variable
b) Construct
c) Variable
d) Construct
6. Which level of measurement applies to the following examples of the disposable income of households?
Code Description
1 <10,000
2 10,001–20,000
3 20,001–30,000
4 30,001–40,000
5 >40,001
a) Interval
b) Ordinal
c) Nominal
d) Ratio
Ans: B
Explanation: the categories of income have an order (i.e., an explicit hierarchy) ranging from less than 10,000 to over 40,001
7. A variable with a true value of 0 is considered:
a) A variable that provides a valid scale of measurement
b) A more reliable variable of the thing measured
c) A variable that can take the absence of the thing measured
d) An interval scale variable
Ans: C
Explanation: a ratio variable has a meaningful 0 point that indicates the absence of the property being measured.
8. The discrepancy between the numbers used to represent something that we are trying to measure and the actual value of what we are measuring is called:
a) Variance
b) The ‘fit’ of the model
c) Reliability
d) Measurement error
Ans: D
Explanation: This is because, it’s one thing to measure variables, but it’s another thing to measure them accurately.
9. Of the following variables, which ones would you need to operationalize?
a) Emotional wellbeing
b) Hours worked per week
c) Academic achievement
d) Water consumption
Ans: A
Explanation: only emotional wellbeing is a construct that is not directly measurable. We can use a series of questions to approximate to measure it.
10. What scale of measurement is a variable with hierarchical categories?
a) Ordinal
b) Nominal
c) Interval
d) Binary
Ans: A
Explanation: an ordinal variable as ordered categories, but it does not require that the intervals between categories are equal such is the case for interval or ratio scale.
11. Imagine we are interested in doing research on the importance of family in the life of people (10 being very important and 1 being not important at all). We interview 20 people asking them to rate attitudes towards family. The average we obtain is 8.5 in the importance of family in people’s life. What can we conclude about this variable?
a) The average can lead to a wrong conclusion about people’s importance of family
b) It is a discrete variable treated as a continuous one
c) The difference between categories is not equal
d) Someone scoring 4.25 attributes half the importance about family than the average
Ans: B
Explanation: self-reported data measured in scales, often from 1 to 10, are treated as continuous. The interval between categories is not of equal magnitude.
12. In a study about the deficiency of Vitamin D in young children and its relationship with growth, we obtained data for 100 children over 5 years. What is expected to happen to the measurement error?
a) It would increase over time
b) I would decrease over time
c) It would stay the same
d) It would be larger for measuring vitamin D than growth
Ans: C
Explanation: taking measures of Vitamin D and growth should not be affected by who takes the measurement or where it is taken. Thus, we would expect no changes in the measurement error over time.
13. In a study on the mental health status of mothers of children younger than 10, the variable wellbeing is measured using a 12-item questionnaire. Some mothers are interviewed in January and others in July. How should we ensure to measure the variable accurately?
a) We should make sure to take measures of all mothers at these two times points
b) We should use different methods to record answers on mental health at each time point
c) We should include women with no children
d) We should form a control group by age of the mother at each time point
Ans: A
Explanation: time of the year can affect moods; by interviewing mothers at these two-time points we would be able to decrease measurement error as we control for factors other than mental health.
14. Imagine we are comparing subjective appraisal of happiness between two countries with distinct cultural and religious values. What type of validity should we be concerned about?
a) Face validity
b) Criterion validity
c) Predictive validity
d) Content validity
Ans: B
Explanation: criterion validity is concerned about the degree to which interpretations and descriptions based on test scores or other measures match behaviour. In two cultural distinct settings, we would need to make sure interpretations of happiness match behaviour in a similar fashion.
15. A failure in a test to account for content validity means:
a) The test does not accurately capture an analogous dimension
b) The test is not related to some outcome in the real world
c) The test fails to account for all relevant dimensions of the construct
d) The test is a mismatch between observed behaviours and reported attitudes
Ans: C
Explanation: content validity is whether the items in a test or instrument include all relevant and adequate dimension that makes up the domain.
16. Reliability of a measure is expected to be higher if:
a) The measure is tested under different environments
b) The measure is recorded several times across different populations
c) The measure is recorded with the same instrument
d) The measure randomly uses different items each time
Ans: C
Explanation: using the same tools or instruments to measure a test would lead to higher chances of obtaining similar results.
17. Imagine we have conducted a study with a group of individuals aged between 15 and 17 on their preferences of three types of music (rock, jazz and kid’s music) 10 years ago and now. Some differences are observed in the scores of the type of music they like. What can we conclude about this change?
a) The instrument to measure their musical preferences is not reliable
b) The changes in the scores fall within the expected
c) The validity of the answers 10 years ago has changed over time
d) We don’t have enough information to assess the reliability of the instruments
Ans: B
Explanation: it is expected that preferences of music at the age of 5 and 15 experience a large transformation.
Chapter 3: Summarizing data
1. Using the information provided in the table about the self-rated general health of a sample of adults, answer the following questions:
a) What is the frequency of having ‘fair’ health?
b) What is the relative frequency of ‘very good’ health?
c) What is the value of N?
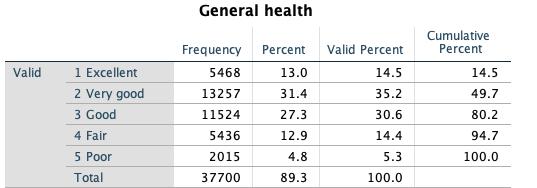
Ans: Short answers
a) 5,436
b) 35.2%
c) 37,700
2. What can we conclude about the left-right political ideology given the table below?
Left
a) The largest percentage of people are right-winged
b) Less than a quarter situates themselves between totally left and four points in the left-right scale
c) There are as many people that situate themselves in the right scale as in the left scale
d) More than a third situate themselves neither left nor right
Ans: D
Explanation: The percentage at five on the scale is 34.9%, which is a little over a third.
3. Which one of the following statements is accurate about frequency tables?
a) They can only be used for ordinal or interval variables
b) They exclude cells with 0 counts
c) The sum of relative frequencies sums up to 1
d) They cannot include ranges of values
Ans: C
Explanation: relative frequencies are the proportion of cases divided by the total number of cases. The sum of all these proportions will always be 1.
4. In a table showing a frequency distribution we find that 25, = f what can we conclude about it?
a) The average number of participants is 25
b) The total sum of the scores is equal to 25
c) The rows of the variable contain information for 25 entities
d) The sum of relative frequencies is 25
Ans: C
Explanation: it is the total sum of the frequencies in each of the rows of the frequency table.
5. Using the following table of frequencies, work through the questions below.
Table: Life satisfaction by sex of respondent
a) What is the relative frequency of males ‘mostly satisfied’ with their life?
b) Calculate the cumulative percentage of both males and females up to somewhat dissatisfied.
c) What is the percentage of females who are completely dissatisfied?
Ans: Short answers:
a) 0.41
b) 24.5%
c) 4.2%
6. What of the following statements is correct about class interval widths?
a) The first class interval should start in 0
b) Class intervals must have equal width
c) Class intervals Include decimal points
d) The lowest score might not be the first score in the data
Ans: D
Explanation: the first interval needs to include the lowest score, although the first digit of the interval can be a lower number
7. Given the frequency distribution of the self-assessment’ of happiness, answer the following questions:
a) What is the class width of the frequency table?
b) What is the raw class interval width if we want 3 categories?
c) Given we have recoded the variable into three categories (‘not happy’, ‘about neutral’ and ‘happy’), what would be the cumulative percentage of the group ‘not happy’?
Ans: Short answers:
a) The difference between the upper and lower boundaries or limits that equals to 11 b) 3.66
c) The first 4 categories have a cumulative percentage equal to 5.86%
8. What does not idealized frequency distributions show?
a) The distribution of class intervals of a grouped variable
b) The probability of a score occurring given a density function
c) The deviation or not from a bell-shaped distribution
d) The description of the pattern of a variable
Ans: A
Explanation: Once we have grouped values into class intervals, we can no longer see the distribution of values within each class interval.
9. A frequency distribution in which low scores are most frequent (i.e., bars on the graph are highest on the left-hand side) is said to be:
a) Leptokurtic
b) Platykurtic
c) Positively skewed
d) Negatively skewed
Ans: C
Explanation: In a positively skewed distribution the frequent scores are clustered at the lower end and the tail points towards the higher or more positive scores.
10. A frequency distribution in which high scores are most frequent (i.e., bars on the graph are highest on the right-hand side) is said to be:
a) Negatively skewed
b) Positively skewed
c) Leptokurtic
d) Platykurtic
Ans: A
Explanation: In a negatively skewed distribution the frequent scores are clustered at the higher end and the tail points towards the lower or more negative scores.
11. Looking at the table below, which of the following statements is the most accurate? (Hint: The further the values of skewness and kurtosis are from zero, the more likely it is that the data are not normally distributed.)
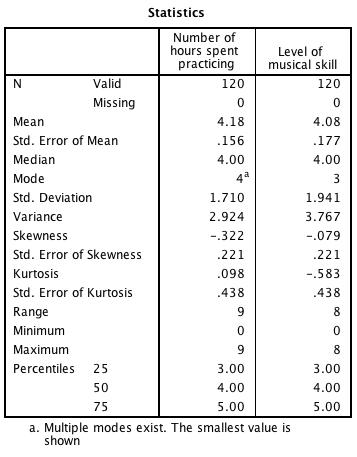
a) For the number of hours spent practising, the data are fairly positively skewed.
b) For the level of musical skill, the data are heavily negatively skewed.