CHAPTER 2 MATERIALS
SOLUTION (2.1)
SOLUTION (2.2)
This is below the yield strength of 350 MPa (Table B.1). We have
( a ) Axial strain and axial stress are
Because
(See Table B.1), Hooke's Law is valid.
( b ) Modulus of elasticity,
( c ) Decrease in the width and thickness
SOLUTION (2.4)
Assume Hooke's Law applies. We have
Thus,
Since y S , our assumption is valid.
So
SOLUTION (2.5)
We obtain
SOLUTION (2.6)
Use generalized Hooke’s law:
For a constant triaxial state of stress:
Then, Eq. (1) becomes
must have identical signs:
2.7 (CONT.)
( a ) 0.50.025 25050 2000 μ,500μxy
( b )
( c )
6 120(10) 2000(10) 60GPa
120(10) 60(10) 0.25500
63 500(10)7537.5(10)mm;'750.037574.9625mmaa
( d ) 9 60(10) 2(10.25) 24GPa G
SOLUTION (2.8)
We have
Equations (1) and (2) become
Adding
Substituting the data:
Hooke's
2.9 (CONT.)
( a ) Change in length ABx La
( b ) Change in thickness
( c ) Change in volume,
SOLUTION (2.10)
By assumptions, rubber in triaxial stress:
Stains are
Substitute
SOLUTION (2.11)
Hooke’s
SOLUTION (2.12)
We have
Gen. Hooke’s law:
SOLUTION (2.13)
We have
(10.5)1200 μ
Change in diameter, 6 1200(10)2500.3mm x dd
Decrease in circumference: ()0.30.9425mm d ( b ) (12) oxo VeVV 663 (0.5)(120010)(8.18110)4909mm
SOLUTION (2.14)
From Fig.2.3b and Eq.2.20:
SOLUTION (2.15)
Table B.1:
SOLUTION (2.16)
( a ) ASTM-A242. 200GPa E and 345MPa
( b ) Stainless (302). 190GPa E
SOLUTION (2.17) ( a ) Aluminum 2014-T6. 72GPa E and 410MPa y
(41010)
( b ) Annealed yellow brass. 105GPa E and 105MPa y S
(10510)
SOLUTION (2.18)
Referring to Fig. P2.18: 6 105(10) 0.0025 42GPa,192.5MPa y ES
( a ) 2 62 9 (192.510) 3 2 2(4210) 441.5kJm y S o E U
( b ) Total area under diagram: 63 262.5(10)(0.176)46.2MJm t U
SOLUTION (2.19)
( a ) 3 6 mm ) (10 75 3 1,500 50 50 V
Thus nU
SOLUTION (2.20)
Table B.1: 250MPa,200GPa y SE We have 5(17)85Nm app UnU
Therefore
or 0.017m=17mm d
SOLUTION (2.21)
Refer to Fig. P2.21. We have 6 190(10) 0.001 190GPa,245MPa y ES ( a ) 2 32 93 (24510) kJ 2 2(19010)m 158 y S o E U
( b ) Total area under diagram:
SOLUTION (2.22)
( a ) 2 (2) 2 2 , p S nUE p EV nUVS
Substituting the data given, (CONT.)
2.22 (CONT.)
9 1.8(150)(221010) 215 0.003 37.810 p S or 194.4MPa p S
( b ) 2 15 93 37.810kJ 2 2(21010)m 90 p S o E U
SOLUTION (2.23)
Applying Eq. (2.22), we find
3.45MPa3.45(149)514MPauBSH
Equation (2.24): 3.62(149)207332.4MPa y S
SOLUTION (2.24)
Using Eq. (2.22),
3.45MPa3.45(179)618MPauBSH
Formula (2.24): 3.62(179)207441MPa y S
SOLUTION (2.25)
Formula (2.22),
3.45MPa3.45(156)538MPauBSH
Equation (2.24): 3.62(156)207378MPa y S
SOLUTION (2.26)
Equation (2.22) gives
3.45MPa3.45(293)1010.9MPauBSH
Formula (2.24): 3.62(293)207853.7MPa y S
End of Chapter 2


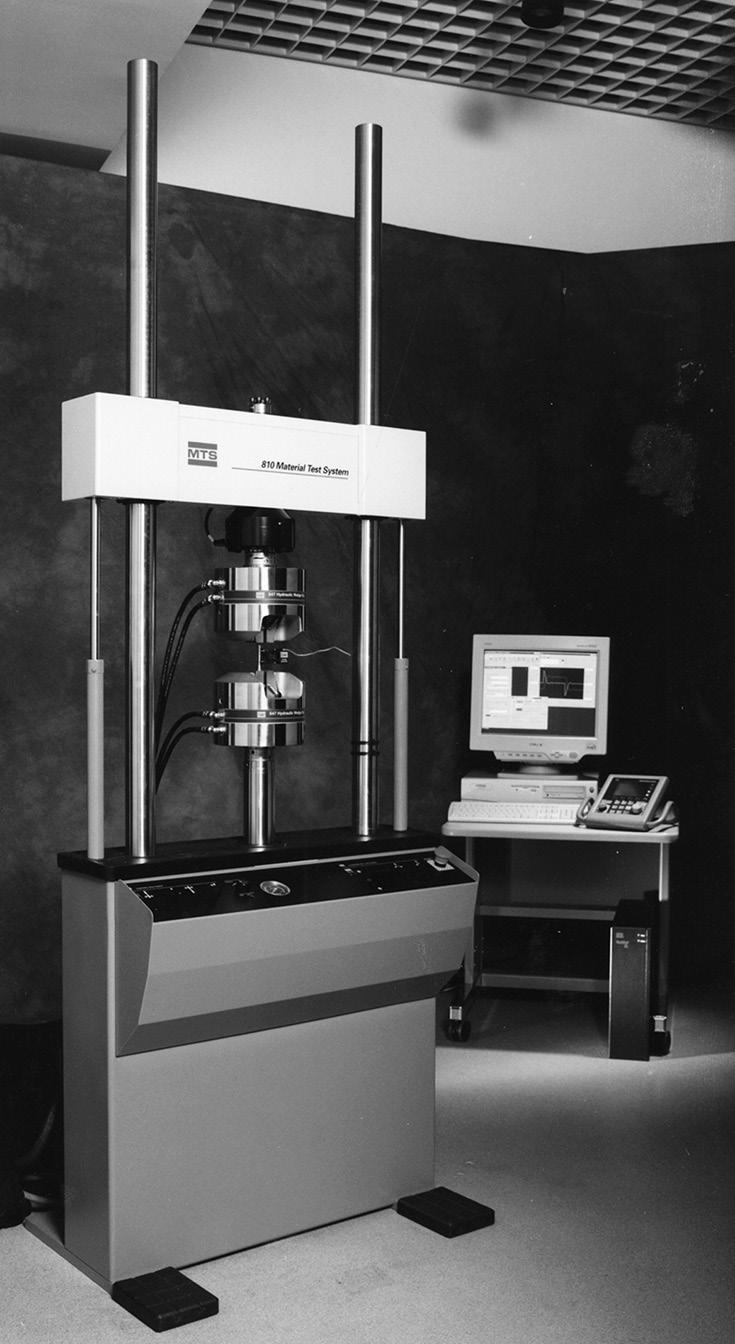
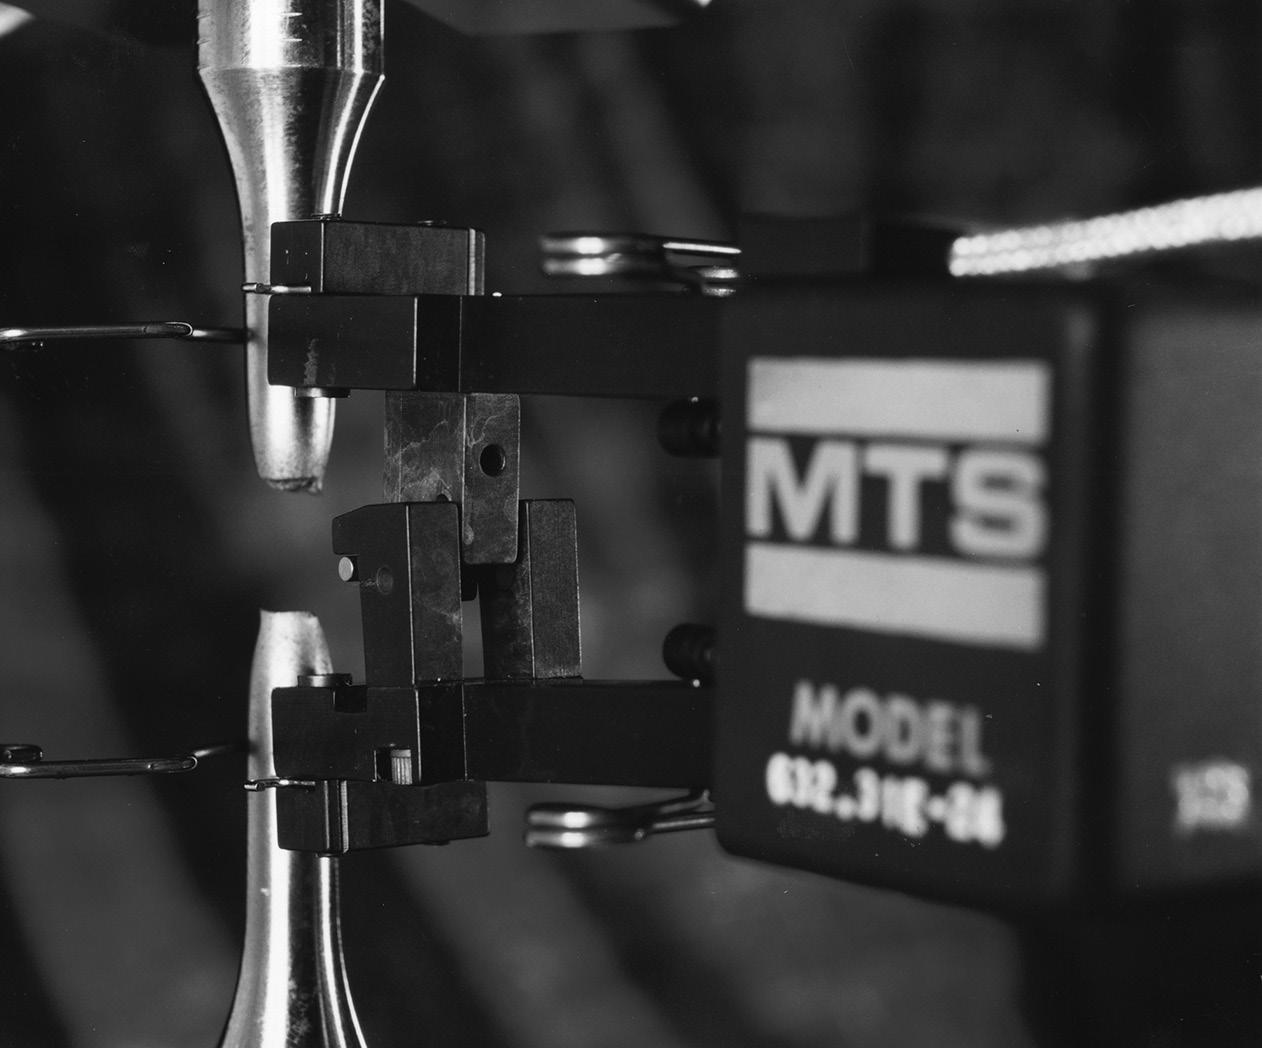
A tensile test specimen with extensometer attached; the specimen has fractured. (Courtesy of MTS Systems Corp.)
Figure 2.3
Stress–strain diagram for a typical structural steel in tension: (a) drawn not to scale and (b) drawn to scale.
2.4
Determination of yield strength by the offset method.
set line
Gray cast iron in tension: (a) stress–strain diagram and (b) fractured specimen.
2.6
Axial elongation and lateral contraction of an element in tension (Poisson’s effect).
Figure 2.7
Example 2.1. A tensile specimen. 002x007.eps
Figure 2.8 Element deformations caused by biaxial stress.
2.9
Example 2.2. Plate in biaxial stress.
2.10
Example 2.3. A solid cylinder. 002x010.eps
Figure 2.11
Stress–strain diagrams for AISI type 304 stainless steel in tension: (a) at low temperatures and (b) at elevated temperatures.
Strai n
Creep curve for structural steel in tension at high temperatures.
Modulus of resilience
Modulus of toughness
Fracture
Figure 2.13
Stress–strain diagram: (a) modulus of resilience and (b) modulus of toughness.
Figure 2.14
Example 2.4. Prismatic bar in tension.
2.15
Influence of

