Chapter 2
Examining Data: Tables and Figures
REASONS FOR EXAMINING DATA
1. Which of these is a reason why researchers examine the data they have collected?
a. to test their research hypotheses
b. to calculate measures of central tendency and variability
c. to detect outliers
d. to draw inferences about populations
Ans: C
Learning Objective: 2-1
Cognitive Domain: Knowledge
Answer Location: Why Examine Data
Question Type: MC
2. Which of these is NOT a reason why researchers examine data they have collected?
a. to evaluate their research methodology
b. to assess the shape of the distribution of scores
c. to detect outliers
d. to prove their research hypotheses
Ans: D
Learning Objective: 2-1
Cognitive Domain: Application
Answer Location: Why Examine Data
Question Type: MC
3. Which of these is NOT a reason why researchers examine data they have collected?
a. to evaluate their research methodology
b. to assess the shape of the distribution of scores
c. to detect outliers
d. to draw inferences about populations
Ans: D
Learning Objective: 2-1
Cognitive Domain: Application
Answer Location: Why Examine Data
Question Type: MC
4. Which of these is a reason why researchers examine data by creating tables and figures?
a. to prove their research hypotheses
b. to define their independent and dependent variables
c. to detect outliers
d. to draw conclusions about populations
Ans: C
Learning Objective: 2-1
Cognitive Domain: Knowledge
Answer Location: Examining Data Using Figures
Question Type: MC
5. Which of these is a reason why researchers examine data by creating tables and figures?
a. To test hypotheses about populations
b. To evaluate their research methodology
c. To determine whether their research hypotheses are skewed
d. To assess their understanding of the research literature
Ans: B
Learning Objective: 2-1
Cognitive Domain: Knowledge
Answer Location: Why Examine Data
Question Type: MC
6. Which of these is NOT a reason why researchers examine data by creating tables and figures?
a. To identify outliers
b. To get an initial look at their data
c. To evaluate their research methodology
d. To prove their research hypotheses
Ans: D
Learning Objective: 2-1
Cognitive Domain: Application
Answer Location: Examining Data Using Figures
Question Type: MC
7. Which of these is a reason why researchers examine data by creating tables and figures?
a. To calculate inferential statistics
b. To defend their research hypotheses
c. To gain an initial understanding of their data
d. To identify their independent and dependent variables
Ans: C
Learning Objective: 2-1
Cognitive Domain: Knowledge
Answer Location: Examining Data Using Figures
Question Type: MC
8. Which of these is a reason why researchers examine data by creating tables and figures?
a. To test their research hypotheses
b. To define their population
c. To figure out which variable is the independent variable
d. To understand the shape of the distribution
Ans: D
Learning Objective: 2-1
Cognitive Domain: Knowledge
Answer Location: Examining Data Using Figures
Question Type: MC
9. Which of these is a reason why researchers examine data by creating tables and figures?
a. To prove a research hypothesis
b. To determine whether the population is skewed
c. To identify the modality of a distribution
d. To decide whether a variable is measured at the interval or ratio scale
Ans: C
Tokunaga, Fundamental Statistics for the Social and Behavioral Sciences: Instructor Resource
Learning Objective: 2-1
Cognitive Domain: Knowledge
Answer Location: Examining Data Using Figures
Question Type: MC
SELECTING APPROPRIATE FIGURE BASED ON LEVEL OF MEASUREMENT
10. On the first day of class, students are asked to describe their plans after college (grad school, work, etc.); a _____ would be used to illustrate their responses to this question.
a. frequency polygon
b. normal distribution
c. histogram
d. bar chart
Ans: D
Learning Objective: 2-4
Cognitive Domain: Analysis
Answer Location: Displaying nominal and ordinal variables: bar charts and pie charts
Question Type: MC
11. You would use a _____ to illustrate data for the variable “Number of brothers”.
a. bar chart
b. histogram
c. frequency polygon
d. pie chart
Ans: B
Learning Objective: 2-4
Cognitive Domain: Application
Answer Location: Displaying interval and ratio variables: histograms and frequency polygons
Question Type: MC
12. You ask people to indicate the number of television sets in their residence (home, apartment, etc.). You would use a _____ to illustrate the data for this variable.
a. frequency polygon
b. histogram
c. bar chart
d. pie chart
Ans: B
Learning Objective: 2-4
Cognitive Domain: Application
Answer Location: Displaying interval and ratio variables: histograms and frequency polygons
Question Type: MC
13. You would use a _____ to illustrate data for the variable “Number of cars per driver”.
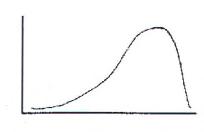
a. bar chart
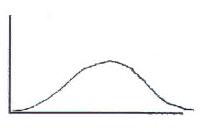
b. histogram
c. frequency polygon
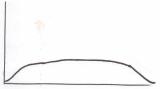
Ans: B
Learning Objective: 2-4
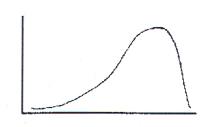
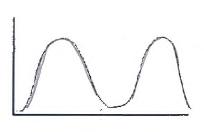
Cognitive Domain: Application
Tokunaga, Fundamental Statistics for the Social and Behavioral Sciences: Instructor Resource
Answer Location: Displaying interval and ratio variables: histograms and frequency polygons
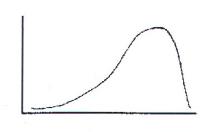
Question Type: MC
14. You would use a _____ to illustrate data for the variable “Cost per vehicle”.
a. pie graph
b. bar chart
c. histogram
Ans: C
Learning Objective: 2-4
Cognitive Domain: Application
Answer Location: Displaying interval and ratio variables: histograms and frequency polygons
Question Type: MC
15. You would use a _____ to illustrate data for a variable measured at the ____ scale of measurement.
a. pie graph; interval
b. frequency polygon; nominal
c. histogram; ordinal
d. bar chart; nominal
Ans: D
Learning Objective: 2-4
Cognitive Domain: Comprehension
Answer Location: Displaying nominal and ordinal variables: bar charts and pie charts
Question Type: MC
16. You would use a _____ to illustrate data for a variable measured at the ____ scale of measurement.
a. histogram; interval
b. frequency polygon; ordinal
c. pie graph; ratio
d. bar chart; ratio
Ans: A
Learning Objective: 2-4
Cognitive Domain: Comprehension
Answer Location: Displaying interval and ratio variables: histograms and frequency polygons
Question Type: MC
17. You would use a _____ to illustrate the data for a variable measured at the ____ scale of measurement.
a. pie graph; interval
b. frequency polygon; ratio
c. histogram; nominal
d. bar chart; ratio
Ans: B
Learning Objective: 2-4
Cognitive Domain: Comprehension
Answer Location: Displaying interval and ratio variables: histograms and frequency polygons
Question Type: MC
18. For five of her lectures, an instructor determines the number of students looking at Facebook or Twitter pages. She would use a _____ to illustrate this data because this variable is measured at the ____ scale of measurement.
Tokunaga, Fundamental Statistics for the Social and Behavioral Sciences: Instructor Resource
a. pie graph; interval
b. frequency polygon; nominal
c. histogram; ratio
d. bar chart; ordinal
Ans: C
Learning Objective: 2-4
Cognitive Domain: Comprehension
Answer Location: Displaying interval and ratio variables: histograms and frequency polygons
Question Type: MC
FREQUENCY DISTRIBUTION TABLES AND CORRESPONDING FIGURES
NOTE: Questions 19-20 are based on the following frequency distribution table:
19. Filling in the blanks in the above frequency distribution table, ____ of the sample work part-time; this is ____ of the sample.
a. 54; 63.8%
b. 62; 53.8%
c. 116; 63.8%
d. 54; 46.6%
e. Cannot be determined with information provided
Ans: D
Learning Objective: 2-2
Cognitive Domain: Analysis
Answer Location: What percentage of the sample has each value of the variable?
Question Type: MC
20. You would use a _____ to illustrate the data in the above frequency distribution table.
a. pie graph
b. frequency polygon
c. histogram
Ans: A
Learning Objective: 2-4
Cognitive Domain: Comprehension
Answer Location: Displaying nominal and ordinal variables: bar charts and pie charts
Question Type: MC
NOTE: Questions 21-22 are based on the following frequency distribution table:
Tokunaga, Fundamental Statistics for the Social and Behavioral Sciences: Instructor Resource
21. Filling in the blanks in the above frequency distribution table, ____ of the sample are married; this is ____ of the sample.
a. 54; 46.6%
b. 62; 53.8%
c. 116; 63.8%
d. 54; 63.8%
e. Cannot be determined with information provided
Ans: A
Learning Objective: 2-2
Cognitive Domain: Analysis
Answer Location: What percentage of the sample has each value of the variable?
Question Type: MC
22. You would use a _____ to illustrate the data in the above frequency distribution table.
a. pie graph
b. frequency polygon
c. histogram
Ans: A
Learning Objective: 2-4
Cognitive Domain: Comprehension
Answer Location: Displaying nominal and ordinal variables: bar charts and pie charts
Question Type: MC
NOTE: Questions 23-24 are based on the following frequency distribution table:
23. Filling in the blanks in the above frequency distribution table, ____ of this sample work 0-10 hours per week; this is ____ of the sample.
a. 16; .19%
b. 70; 81.8%
c. 16; 18.6%
d. Cannot be determined with information provided Ans: C
Learning Objective: 2-2
Cognitive Domain: Analysis
Answer Location: What percentage of the sample has each value of the variable?
Question Type: MC
24. You would use a _____ to illustrate the data in the above frequency distribution table.
a. pie graph
b. bar chart
c. histogram
Ans: C
Learning Objective: 2-4
Cognitive Domain: Comprehension
Answer Location: Displaying interval and ratio variables: histograms and frequency polygons
Question Type: MC
NOTE: Questions 25-26 are based on the following frequency distribution table:
25. Filling in the blanks in the above frequency distribution table, ____ of this sample are not employed; this is ____ of the sample.
a. 54; 63.8%
b. 62; 53.8%
c. 54; 46.6%
d. 116; 63.8%
e. Cannot be determined with information provided
Ans: C
Learning Objective: 2-2
Cognitive Domain: Analysis
Answer Location: What percentage of the sample has each value of the variable?
Question Type: MC
26. You would use a _____ to illustrate the data in the above frequency distribution table because the variable is measured at the ____ scale of measurement.
a. pie graph; ratio
b. frequency polygon; nominal
c. histogram; ordinal
d. bar chart; nominal
Ans: D
Learning Objective: 2-4
Cognitive Domain: Comprehension
Answer Location: Displaying nominal and ordinal variables: bar charts and pie charts
Question Type: MC
NOTE: Questions 27-28 are based on the following frequency distribution table:
Tokunaga, Fundamental Statistics for the Social and Behavioral Sciences: Instructor Resource
$20000 - $40000 29 _______ $0 - $20000 _______ _______
27. Filling in the blanks in the above frequency distribution table, ____ of this sample make between $0 and $20000 a year; this is ____ of the sample.
a. 16; .19%
b. 70; 81.8%
c. 16; 18.6%
d. Cannot be determined with information provided Ans: C
Learning Objective: 2-2
Cognitive Domain: Analysis
Answer Location: What percentage of the sample has each value of the variable?
Question Type: MC
28. You would use a _____ to illustrate the data in the above frequency distribution table.
a. pie graph
b. bar chart
c. histogram Ans: C
Learning Objective: 2-4
Cognitive Domain: Comprehension
Answer Location: Displaying interval and ratio variables: histograms and frequency polygons
Question Type: MC
NOTE: Questions 29-30 are based on the following frequency distribution table:
29. Filling in the blanks in the above frequency distribution table, ____ of this sample live in the 925 area code; this is ____ of the sample.
a. 10; .15%
b. 15; 10.0%
c. 10; 14.5%
d. Cannot be determined with information provided Ans: C
Learning Objective: 2-2
Cognitive Domain: Analysis
Answer Location: What percentage of the sample has each value of the variable?
Question Type: MC
30. You would use a _____ to illustrate the data in the above frequency distribution table.
a. pie graph or frequency polygon
b. bar chart or histogram
c. histogram or frequency polygon
d. bar chart or pie graph
Ans: D
Learning Objective: 2-4
Cognitive Domain: Comprehension
Answer Location: Displaying nominal and ordinal variables: bar charts and pie charts
Question Type: MC
NOTE: Questions 31-32 are based on the following frequency distribution table:
31. Filling in the blanks in the above frequency distribution table, ____ of the students predicted Candidate C will win the election; this is ____ of the sample.
a. 68; .55%
b. 68; 55.3%
c. 75; 61.0%
d. Cannot be determined with information provided Ans: B
Learning Objective: 2-2
Cognitive Domain: Analysis
Answer Location: What percentage of the sample has each value of the variable?
Question Type: MC
32. You would use either a _____ to illustrate the data in the above frequency distribution table.
a. pie graph or frequency polygon
b. bar chart or pie graph
c. histogram or frequency polygon
d. bar chart or histogram
Ans: B
Learning Objective: 2-4
Cognitive Domain: Comprehension
Answer Location: Displaying nominal and ordinal variables: bar charts and pie charts
Question Type: MC
NOTE: Questions 33-34 are based on the following frequency distribution table:
33. Filling in the blanks in the above frequency distribution table, ____ students had SAT Math scores between 200 and 400; this is ____ of the sample.
a. 37; 40.3%
b. 52; 37.4%
c. 52; .37%
d. Cannot be determined with information provided Ans: B
Learning Objective: 2-2
Cognitive Domain: Analysis
Answer Location: What percentage of the sample has each value of the variable?
Question Type: MC
34. You would use either a _____ to illustrate the data in the above frequency distribution table.
a. pie graph or frequency polygon
b. bar chart or pie graph
c. histogram or frequency polygon
d. bar chart or histogram
Ans: C
Learning Objective: 2-4
Cognitive Domain: Comprehension
Answer Location: Displaying interval and ratio variables: histograms and frequency polygons
Question Type: MC
NOTE: Questions 35-36 are based on the following frequency distribution table:
35. Filling in the blanks in the above frequency distribution table, ____ students are ‘not sure’ of their plans after finishing college; this is ____ of the sample.
a. 20; 23.2%
b. 23; 26.8%
c. 42; 48.8%
d. Cannot be determined with information provided Ans: B
Learning Objective: 2-2
Cognitive Domain: Analysis
Answer Location: What percentage of the sample has each value of the variable?
Question Type: MC
36. You would use a _____ to illustrate the data in the above frequency distribution table.
a. frequency polygon
Tokunaga, Fundamental Statistics for the Social and Behavioral Sciences: Instructor Resource
b. bar chart
c. histogram
d. none of these is correct
Ans: B
Learning Objective: 2-4
Cognitive Domain: Comprehension
Answer Location: Displaying nominal and ordinal variables: bar charts and pie charts
Question Type: MC
NOTE: Questions 37-38 are based on the following frequency distribution table:
37. Filling in the blanks in the above frequency distribution table, ____ people consumed 9 or more drinks; this is ____ of the sample.
a. 35; 10.5%
b. 23; 20.2%
c. 12; 30.7%
d. Cannot be determined with information provided Ans: B
Learning Objective: 2-2
Cognitive Domain: Analysis
Answer Location: What percentage of the sample has each value of the variable?
Question Type: MC
38. You would use a _____ to illustrate the data in the above frequency distribution table.
a. pie chart
b. normal distribution
c. histogram
d. bar chart
Ans: C
Learning Objective: 2-4
Cognitive Domain: Comprehension
Answer Location: Displaying interval and ratio variables: histograms and frequency polygons
Question Type: MC
NOTE: Questions 39-40 are based on the following frequency distribution table:
39. Filling in the blanks in the above frequency distribution table, ______ people selected ‘Dinner’; this is ______ of the sample.
a. 20; 33.9%
b. 20; 86.4%
c. 39; 52.5%
d. 59; 33.9%
Ans: A
Learning Objective: 2-2
Cognitive Domain: Analysis
Answer Location: What percentage of the sample has each value of the variable?
Question Type: MC
40. You would use a _____ to illustrate the data in the above frequency distribution table because the variable is measured at the ____ scale of measurement.
a. frequency polygon; ordinal
b. bar chart; nominal
c. histogram; interval
d. pie graph; ratio
Ans: B
Learning Objective: 2-4
Cognitive Domain: Comprehension
Answer Location: Displaying nominal and ordinal variables: bar charts and pie charts Question Type: MC
NOTE: Questions 41-42 are
41. Filling in the blanks in the above frequency distribution table, ______ people selected ‘Lunch’; this is ______ of the sample.
a. 31; 52.5%
b. 31; 86.4%
c. 28; 47.5%
d. 59; 52.5%
Ans: A
Learning Objective: 2-2
Cognitive Domain: Analysis
Answer Location: What percentage of the sample has each value of the variable?
Question Type: MC
42. You would use a _____ to illustrate the data in the above frequency distribution table because the variable is measured at the ____ scale of measurement.
a. frequency polygon; ordinal
b. bar chart; nominal
c. histogram; interval
d. pie graph; ratio
Ans: B
Learning Objective: 2-4
Cognitive Domain: Comprehension
Answer Location: Displaying nominal and ordinal variables: bar charts and pie charts
Question Type: MC
NOTE: Questions 43-44 are based on the following frequency distribution table:
43. Filling in the blanks in the above frequency distribution table, ______ people chose ‘Friday’; this is ______ of the sample.
a. 112; 40.1%
b. 112; 72.8%
c. 167; 32.6%
d. 279; 40.1%
Ans: A
Learning Objective: 2-2
Cognitive Domain: Analysis
Answer Location: What percentage of the sample has each value of the variable?
Question Type: MC
44. You would use a _____ to illustrate the data in the above frequency distribution table because the variable is measured at the ____ scale of measurement.
a. frequency polygon; ordinal
b. bar chart; nominal
c. histogram; interval
d. pie graph; ratio
Ans: B
Learning Objective: 2-4
Cognitive Domain: Comprehension
Answer Location: Displaying nominal and ordinal variables: bar charts and pie charts
Question Type: MC
NOTE: Questions 45-46 are based on the following frequency distribution table:
Tokunaga, Fundamental Statistics for the Social and Behavioral Sciences: Instructor Resource
45. Filling in the blanks in the above frequency distribution table, ______ people chose ‘Wednesday’; this is ______ of the sample.
a. 91; 32.6%
b. 91; 72.8%
c. 188; 67.4%
d. 279; 32.6%
Ans: A
Learning Objective: 2-2
Cognitive Domain: Analysis
Answer Location: What percentage of the sample has each value of the variable?
Question Type: MC
46. You would use a _____ to illustrate the data in the above frequency distribution table because the variable is measured at the ____ scale of measurement.
a. frequency polygon; ordinal
b. bar chart; nominal
c. histogram; interval
d. pie graph; ratio
Ans: B
Learning Objective: 2-4
Cognitive Domain: Comprehension
Answer Location: Displaying nominal and ordinal variables: bar charts and pie charts
Question Type: MC
NOTE: Questions 47-48 are based on the following frequency distribution table:
47. Filling in the blanks in the above frequency distribution table, ______ people owned 0 phones; this represents ______ of the sample.
a. 7; 35.0%
b. 7; 55.0%
c. 13; 20.0%
d. 20; 35.0%
Ans: A
Learning Objective: 2-2
Cognitive Domain: Analysis
Answer Location: What percentage of the sample has each value of the variable?
Question Type: MC
48. You would use a _____ to illustrate the data in the above frequency distribution table because the variable is measured at the ____ scale of measurement.
a. frequency polygon; nominal
b. bar chart; interval
c. histogram; ratio
d. pie graph; ordinal Ans: C
Learning Objective: 2-4
Cognitive Domain: Comprehension
Answer Location: Displaying nominal and ordinal variables: bar charts and pie charts
Question Type: MC
NOTE: Questions 49-50 are based on the following frequency distribution table:
49. Filling in the blanks in the above frequency distribution table, ______ people owned 1 phone; this is ______ of the sample.
a. 4; 20.0%
b. 4; 55.0%
c. 16; 80.0%
d. 20; 20.0%
Ans: A
Learning Objective: 2-2
Cognitive Domain: Analysis
Answer Location: What percentage of the sample has each value of the variable?
Question Type: MC
50. You would use a _____ to illustrate the data in the above frequency distribution table because the variable is measured at the ____ scale of measurement.
a. frequency polygon; nominal
b. bar chart; interval
c. histogram; ratio
d. pie graph; ordinal Ans: C
Learning Objective: 2-4
Cognitive Domain: Comprehension
Answer Location: Displaying nominal and ordinal variables: bar charts and pie charts
Question Type: MC
NOTE: Questions 51-52 are based on the following frequency distribution table:
Tokunaga, Fundamental Statistics for the Social and Behavioral Sciences: Instructor Resource
51. Filling in the blanks in the above frequency distribution table, ______ people preferred ‘Green’; this is ______ of the sample.
a. 57; 26.8%
b. 57; 59.6%
c. 156; 32.9%
d. 213; 26.8%
Ans: A
Learning Objective: 2-2
Cognitive Domain: Analysis
Answer Location: What percentage of the sample has each value of the variable?
Question Type: MC
52. You would use a _____ to illustrate the data in the above frequency distribution table because the variable is measured at the ____ scale of measurement.
a. frequency polygon; ordinal
b. bar chart; nominal
c. histogram; interval
d. pie graph; ratio
Ans: B
Learning Objective: 2-4
Cognitive Domain: Comprehension
Answer Location: Displaying nominal and ordinal variables: bar charts and pie charts
Question Type: MC
NOTE: Questions 53-54 are based on the following frequency distribution table:
53. Filling in the blanks in the above frequency distribution table, ______ people preferred ‘Yellow’; this is ______ of the sample.
a. 70; 32.9%
b. 70; 59.6%
c. 143; 67.1%
d. 213; 32.9%
Ans: A
Learning Objective: 2-2
Tokunaga, Fundamental Statistics for the Social and Behavioral Sciences: Instructor Resource
Cognitive Domain: Analysis
Answer Location: What percentage of the sample has each value of the variable?
Question Type: MC
54. You would use a _____ to illustrate the data in the above frequency distribution table because the variable is measured at the ____ scale of measurement.
a. frequency polygon; ordinal
b. bar chart; nominal
c. histogram; interval
d. pie graph; ratio Ans: B
Learning Objective: 2-4
Cognitive Domain: Comprehension
Answer Location: Displaying nominal and ordinal variables: bar charts and pie charts
Question Type: MC
NOTE: Questions 55-56 are based on the following frequency distribution table:
55. Filling in the blanks in the above frequency distribution table, ______ people selected ‘Pizza’; this is ______ of the sample.
a. 20; 31.3%
b. 20; 68.8%
c. 29; 45.3%
d. 29; 31.3%
Ans: A
Learning Objective: 2-2
Cognitive Domain: Analysis
Answer Location: What percentage of the sample has each value of the variable?
Question Type: MC
56. You would use a _____ to illustrate the data in the above frequency distribution table because the variable is measured at the ____ scale of measurement.
a. frequency polygon; ordinal
b. bar chart; nominal
c. histogram; interval
d. pie graph; ratio
Ans: B
Learning Objective: 2-4
Cognitive Domain: Comprehension
Answer Location: Displaying nominal and ordinal variables: bar charts and pie charts
Question Type: MC
Tokunaga, Fundamental Statistics for the Social and Behavioral Sciences: Instructor Resource
NOTE: Questions 57-58 are based on the following frequency distribution table:
57. Filling in the blanks in the above frequency distribution table, ______ people selected ‘Sandwich’; on the other hand, ______selected ‘Hamburger’.
a. 9; 37.5%
b. 9; 68.8%
c. 29; 51.6%
d. 29; 45.3%
Ans: A
Learning Objective: 2-2
Cognitive Domain: Analysis
Answer Location: What percentage of the sample has each value of the variable?
Question Type: MC
58. You would use a _____ to illustrate the data in the above frequency distribution table because the variable is measured at the ____ scale of measurement.
a. frequency polygon; ordinal
b. bar chart; nominal c. histogram; interval
d. pie graph; ratio
Ans: B
Learning Objective: 2-4
Cognitive Domain: Comprehension
Answer Location: Displaying nominal and ordinal variables: bar charts and pie charts
Question Type: MC
NOTE: Questions 59-60 are based on the following frequency distribution table:
59. Filling in the blanks in the above frequency distribution table, ______ people played soccer; this is ______ of the sample. a. 5; 6.8%
Tokunaga, Fundamental Statistics for the Social and Behavioral Sciences: Instructor Resource
b. 5; 32.9%
c. 17; 23.3%
d. 17; 6.8%
Ans: A
Learning Objective: 2-2
Cognitive Domain: Analysis
Answer Location: What percentage of the sample has each value of the variable?
Question Type: MC
60. You would use a _____ to illustrate the data in the above frequency distribution table because the variable is measured at the ____ scale of measurement.
a. frequency polygon; ordinal
b. bar chart; nominal
c. histogram; interval
d. pie graph; ratio
Ans: B
Learning Objective: 2-4
Cognitive Domain: Comprehension
Answer Location: Displaying nominal and ordinal variables: bar charts and pie charts
Question Type: MC
NOTE: Questions 61-62 are based on the following frequency distribution table:
61. Filling in the blanks in the above frequency distribution table, ______ people played football; on the other hand, ______ people played basketball.
a. 12; 26.0%
b. 12; 32.9%
c. 17; 42.5%
d. 17; 23.3%
Ans: A
Learning Objective: 2-2
Cognitive Domain: Analysis
Answer Location: What percentage of the sample has each value of the variable?
Question Type: MC
62. You would use a _____ to illustrate the data in the above frequency distribution table because the variable is measured at the ____ scale of measurement.
a. frequency polygon; ordinal
b. bar chart; nominal c. histogram; interval
d. pie graph; ratio
Tokunaga, Fundamental Statistics for the Social and Behavioral Sciences: Instructor Resource
Ans: B
Learning Objective: 2-4
Cognitive Domain: Comprehension
Answer Location: Displaying nominal and ordinal variables: bar charts and pie charts
Question Type: MC
NOTE: Questions 63-64 are based on the following frequency distribution table:
63. Filling in the blanks in the above frequency distribution table, ______ people took a math class; this is ______ of the sample.
a. 19; 13.7%
b. 19; 45.3%
c. 49; 35.3%
d. 49; 13.7%
Ans: A
Learning Objective: 2-2
Cognitive Domain: Analysis
Answer Location: What percentage of the sample has each value of the variable? Question Type: MC
64. You would use a _____ to illustrate the data in the above frequency distribution table because the variable is measured at the ____ level of measurement.
a. frequency polygon; ordinal
b. bar chart; nominal c. histogram; interval
d. pie graph; ratio Ans: B
Learning Objective: 2-4
Cognitive Domain: Comprehension
Answer Location: Displaying nominal and ordinal variables: bar charts and pie charts
Question Type: MC
NOTE: Questions 65-66 are based on the following frequency distribution table:
Tokunaga, Fundamental Statistics for the Social and Behavioral Sciences: Instructor Resource
65. Filling in the blanks in the above frequency distribution table, ______ people took physics; on the other hand, ______people took chemistry.
a. 30; 31.7%
b. 30; 45.3%
c. 49; 53.2%
d. 49; 35.3%
Ans: A
Learning Objective: 2-2
Cognitive Domain: Analysis
Answer Location: What percentage of the sample has each value of the variable?
Question Type: MC
66. You would use a _____ to illustrate the data in the above frequency distribution table because the variable is measured at the ____ level of measurement.
a. frequency polygon; ordinal
b. bar chart; nominal
c. histogram; interval
d. pie graph; ratio
Ans: B
Learning Objective: 2-4
Cognitive Domain: Comprehension
Answer Location: Displaying nominal and ordinal variables: bar charts and pie charts
Question Type: MC
NOTE: Questions 67-68 are based on the following frequency distribution table:
67. Filling in the blanks in the above frequency distribution table, ______ people had 0 jobs; this is ______ of the sample.
a. 17; 19.1%
b. 17; 58.4%
c. 26; 29.2%
d. 26; 19.1%
Ans: A
Learning Objective: 2-2
Cognitive Domain: Analysis
Answer Location: What percentage of the sample has each value of the variable?
Question Type: MC
68. You would use a ______ to illustrate the data in the above frequency distribution table because the variable is measured at the ______ level of measurement.
a. frequency polygon; nominal
b. bar chart; interval
c. histogram; ratio
d. pie graph; ordinal Ans: C
Learning Objective: 2-4
Cognitive Domain: Comprehension
Answer Location: Displaying nominal and ordinal variables: bar charts and pie charts
Question Type: MC
NOTE: Questions 69-70 are based on the following frequency distribution table:
69. Filling in the blanks in this frequency distribution table, ______ people had 1 job; on the other hand, ______people had 2 jobs.
a. 9; 39.3%
b. 9; 58.4%
c. 26; 49.4%
d. 26; 29.2%
Ans: A
Learning Objective: 2-2
Cognitive Domain: Analysis
Answer Location: What percentage of the sample has each value of the variable?
Question Type: MC
70. You would use a ______ to illustrate the data in the above frequency distribution table because the variable is measured at the ______ level of measurement.
a. frequency polygon; nominal
b. bar chart; interval
c. histogram; ratio
d. pie graph; ordinal Ans: C
Learning Objective: 2-4
Cognitive Domain: Comprehension
Answer Location: Displaying nominal and ordinal variables: bar charts and pie charts
Question Type: MC
GROUPED FREQUENCY DISTRIBUTION TABLES AND REAL LIMITS
71. A table that groups the values of a variable measured at the interval or ratio level of measurement into a small number of intervals is known as a:
a. percent distribution table
b. grouped frequency distribution table
c. cumulative frequency distribution table
d. cumulative percent distribution table
Ans: B
Learning Objective: 2-2
Cognitive Domain: Knowledge
Answer Location: Grouped Frequency Distribution Tables
Question Type: MC
72. Grouped frequency distribution tables are created to summarize data for variables measured at the _____ level of measurement.
a. nominal or interval
b. nominal or ordinal
c. ordinal or ratio
d. interval or ratio
Ans: D
Learning Objective: 2-2
Cognitive Domain: Knowledge
Answer Location: Grouped Frequency Distribution Tables
Question Type: MC
73. Grouped frequency distribution tables are created to summarize data for variables measured at the _____ level of measurement.
a. ordinal or interval
b. interval or ratio
c. nominal or ordinal
d. nominal or ratio
Ans: B
Learning Objective: 2-2
Cognitive Domain: Knowledge
Answer Location: Grouped Frequency Distribution Tables
Question Type: MC
74. For which of these variables would you create a grouped frequency distribution table to summarize data you’ve collected?
a. College major
b. Year in school
c. Type of housing
d. Distance from campus (miles)
Ans: D
Learning Objective: 2-2
Cognitive Domain: Knowledge
Answer Location: Grouped Frequency Distribution Tables
Question Type: MC
75. For which of these variables would you create a grouped frequency distribution table to summarize data you’ve collected?
Tokunaga, Fundamental Statistics for the Social and Behavioral Sciences: Instructor Resource
a. Type of automobile
b. Miles per gallon (MPG)
c. Color of automobile
d. Type of gasoline
Ans: B
Learning Objective: 2-2
Cognitive Domain: Knowledge
Answer Location: Grouped Frequency Distribution Tables
Question Type: MC
76. For which of these variables would you create a grouped frequency distribution table to summarize data you’ve collected?
a. Number of calories
b. Type of salad dressing
c. Favorite restaurant
d. Day of week
Ans: A
Learning Objective: 2-2
Cognitive Domain: Knowledge
Answer Location: Grouped Frequency Distribution Tables
Question Type: MC
77. For which of these variables would you create a grouped frequency distribution table to summarize data you’ve collected?
a. Type of music
b. Quality of video
c. Number of downloads
d. Favorite singer
Ans: C
Learning Objective: 2-2
Cognitive Domain: Knowledge
Answer Location: Grouped Frequency Distribution Tables
Question Type: MC
78. Real limits are:
a. the values of a variable that fall halfway between the top of one interval and the bottom of the next interval.
b. the smallest value of a variable that would be grouped into a particular interval.
c. the largest value of a variable that would be grouped into a particular interval.
d. a small number of intervals that provide the frequencies within each interval.
Ans: A
Learning Objective: 2-2
Cognitive Domain: Knowledge
Answer Location: Grouped Frequency Distribution Tables
Question Type: MC
79. Real lower limits are:
a. the values of a variable that fall halfway between the top of one interval and the bottom of the next interval.
b. the smallest value of a variable that would be grouped into a particular level.
Tokunaga, Fundamental Statistics for the Social and Behavioral Sciences: Instructor Resource
c. the largest value of a variable that would be grouped into a particular interval.
d. a small number of intervals that provide the frequencies within each interval.
Ans: B
Learning Objective: 2-2
Cognitive Domain: Knowledge
Answer Location: Grouped Frequency Distribution Tables
Question Type: MC
80. Real upper limits are:
a. the values of a variable that fall halfway between the top of one interval and the bottom of the next interval.
b. the smallest value of a variable that would be grouped into a particular level.
c. the largest value of a variable that would be grouped into a particular interval.
d. a small number of intervals that provide the frequencies within each interval.
Ans: C
Learning Objective: 2-2
Cognitive Domain: Knowledge
Answer Location: Grouped Frequency Distribution Tables
Question Type: MC
81. The smallest values of a variable that would be grouped into a particular interval are:
a. real limits
b. real lower limits
c. real upper limits
d. grouped frequency distribution
Ans: B
Learning Objective: 2-2
Cognitive Domain: Knowledge
Answer Location: Grouped Frequency Distribution Tables
Question Type: MC
82. The largest values of a variable that would be grouped into a particular interval are:
a. real limits
b. real lower limits
c. real upper limits
d. grouped frequency distribution
Ans: C
Learning Objective: 2-2
Cognitive Domain: Knowledge
Answer Location: Grouped Frequency Distribution Tables
Question Type: MC
GROUPED FREQUENCY DISTRIBUTION TABLES (CREATING)
83. When creating a grouped frequency distribution table, the number of intervals depends on a. the size of the population
b. the difference between the sample and the population
c. the distribution of data in the sample
d. arbitrary cutpoints
Tokunaga, Fundamental Statistics for the Social and Behavioral Sciences: Instructor Resource
Ans: C
Learning Objective: 2-2
Cognitive Domain: Knowledge
Answer Location: Guidelines for creating grouped frequency distribution tables
Question Type: MC
84. Which of the following is not a guideline for creating grouped frequency distribution tables?
a. The number of intervals should accurately represent the data
b. Intervals should be of equal size
c. Intervals should not overlap
d. The data should be grouped into randomly created intervals
Ans: D
Learning Objective: 2-2
Cognitive Domain: Comprehension
Answer Location: Guidelines for creating grouped frequency distribution tables
Question Type: MC
85. The intervals created for a grouped frequency distribution table should represent the nature of the data as _____ as possible.
a. redundantly
b. accurately
c. arbitrarily
d. simplistically
Ans: B
Learning Objective: 2-2
Cognitive Domain: Comprehension
Answer Location: Guidelines for creating grouped frequency distribution tables
Question Type: MC
86. Which of the following is true regarding creating intervals for a grouped frequency distribution table?
a. The intervals should be of equal size
b. The intervals should overlap
c. Many of the intervals should have a frequency of zero
d. All of the intervals should have the same frequencies
Ans: A
Learning Objective: 2-2
Cognitive Domain: Knowledge
Answer Location: Guidelines for creating grouped frequency distribution tables
Question Type: MC
FREQUENCY DISTRIBUTION TABLES (CUMULATIVE PERCENTAGES)
87. Filling in the blanks in this frequency distribution table, the cumulative percent (‘Cum %’) associated with 3 arrests is ______.
Tokunaga, Fundamental Statistics for the Social and Behavioral Sciences: Instructor Resource
a. 5.0%
b. 20.0%
c. 90.0%
d. 95.0%
Ans: D
Learning Objective: 2-2
Cognitive Domain: Analysis
Answer Location: What percentage of the sample has each value of the variable?
Question Type: MC
88. Filling in the blanks in this frequency distribution table, the percentage (‘%’) for 2 arrests is ______; the cumulative percent (‘Cum %’) associated with 2 arrests is ______.
a. 5.0%; 90.0%
b. 15.0%; 90.0%
c. 20.0%; 95.0%
d. 90.0%; 15.0%
Ans: B
Learning Objective: 2-2
Cognitive Domain: Analysis
Answer Location: What percentage of the sample has each value of the variable? Question Type: MC
89. Filling in the blanks in this frequency distribution table, the cumulative percent (‘Cum %’) associated with 11th grade is ______.
Tokunaga, Fundamental Statistics for the Social and Behavioral Sciences: Instructor Resource
a. 15.8%
b. 34.2%
c. 78.9%
d. 94.7%
Ans: D
Learning Objective: 2-2
Cognitive Domain: Analysis
Answer Location: What percentage of the sample has each value of the variable?
Question Type: MC
90. Filling in the blanks in this frequency distribution table, the percentage (‘%’) for 10th grade is ______; the cumulative percent (‘Cum %’) associated with 10th grade is ______.
a. 15.8%; 78.9%
b. 18.4%; 78.9%
c. 34.2%; 94.7%
d. 78.9%; 18.4%
Ans: B
Learning Objective: 2-2
Cognitive Domain: Analysis
Answer Location: What percentage of the sample has each value of the variable? Question Type: MC
91. Filling in the blanks in this frequency distribution table, the cumulative percent (‘Cum %’) associated with a B grade is ______.
Tokunaga, Fundamental Statistics for the Social and Behavioral Sciences: Instructor Resource
a. 46.5%
b. 36.8%
c. 60.5%
d. 83.3%
Ans: D
Learning Objective: 2-2
Cognitive Domain: Analysis
Answer Location: What percentage of the sample has each value of the variable?
Question Type: MC
92. Filling in the blanks in this frequency distribution table, the percentage (‘%’) for a C grade is ______; the cumulative percent (‘Cum %’) associated with a C grade is ______.
a. 36.8%; 46.5%
b. 23.7%; 46.5%
c. 60.5%; 83.3%
d. 46.5%; 23.7%
Ans: B
Learning Objective: 2-2
Cognitive Domain: Analysis
Answer Location: What percentage of the sample has each value of the variable?
Question Type: MC
93. Filling in the blanks in this frequency distribution table, the cumulative percent (‘Cum %’) associated with a rating of ‘Very good’ is ______.
Tokunaga, Fundamental Statistics for the Social and Behavioral Sciences: Instructor Resource
a. 22.4%
b. 59.5%
c. 63.4%
d. 85.8%
Ans: D
Learning Objective: 2-2
Cognitive Domain: Analysis
Answer Location: What percentage of the sample has each value of the variable? Question Type: MC
94. Filling in the blanks in this frequency distribution table, the percentage (‘%’) for a rating of ‘Good’ is ______; the cumulative percent (‘Cum %’) associated with a rating of ‘Good’ is ______.
a. 22.4%; 63.4%
b. 37.1%; 63.4%
c. 59.5%; 85.8%
d. 63.4%; 37.1%
Ans: B
Learning Objective: 2-2
Cognitive Domain: Analysis
Answer Location: What percentage of the sample has each value of the variable? Question Type: MC
95. Filling in the blanks in this frequency distribution table, the cumulative percent (‘Cum %’) associated with a score of 31-40 is ______.
Tokunaga, Fundamental Statistics for the Social and Behavioral Sciences: Instructor Resource
a. 29.8%
b. 48.9%
c. 34.0%
d. 63.8%
Ans: D
Learning Objective: 2-2
Cognitive Domain: Analysis
Answer Location: What percentage of the sample has each value of the variable?
Question Type: MC
96. Filling in the blanks in this frequency distribution table, the percentage (‘%’) for a score of 21-30 is ______; the cumulative percent (‘Cum %’) associated with a score of 21-30 is ______.
a. 29.8%; 34.0%
b. 19.1%; 34.0%
c. 48.9%; 63.8%
d. 34.0%; 19.1%
Ans: B
Learning Objective: 2-2
Cognitive Domain: Analysis
Answer Location: What percentage of the sample has each value of the variable?
Question Type: MC
APA GUIDELINES FOR FIGURES
97. In constructing figures such as bar charts and frequency polygons, the American Psychological Association (APA) recommends that
a. figures be numbered using Roman numerals (Figure I, Figure II, etc.)
b. figures have a square shape, with the same horizontal and vertical dimensions
Tokunaga, Fundamental Statistics for the Social and Behavioral Sciences: Instructor Resource
c. values along the vertical (Y) axis start with the value of zero (0)
d. the vertical axis (Y-axis) be divided into 2-3 values of the variable
Ans: C
Learning Objective: 2-3
Cognitive Domain: Knowledge
Answer Location: Drawing Inappropriate Conclusions From Figures
Question Type: MC
98. In constructing figures such as bar charts and frequency polygons, the American Psychological Association (APA) recommends that
a. figures be numbered using letters (Figure A, Figure B, etc.)
b. figures have a rectangular shape, with the length of the horizontal (X) axis greater than the height of the vertical (Y) axis
c. labels along the X and Y axes be written in all capital letters (i.e., MALE, FEMALE)
d. the vertical axis (Y-axis) be divided into 2-3 values of the variable
Ans: B
Learning Objective: 2-3
Cognitive Domain: Knowledge
Answer Location: Drawing Inappropriate Conclusions From Figures
Question Type: MC
99. In constructing figures such as bar charts and frequency polygons, the American Psychological Association (APA) recommends that
a. figures be numbered using Arabic numbers (Figure 1, Figure 2, etc.)
b. the vertical axis (Y-axis) be divided into 15-20 values of the variable
c. labels along the X and Y axes be written in all lower-case letters (i.e., male, female)
d. the horizontal (X) axis contains the frequency (f) or percentage (%) of the sample with each value of the variable
Ans: A
Learning Objective: 2-3
Cognitive Domain: Knowledge
Answer Location: Drawing Inappropriate Conclusions From Figures
Question Type: MC
ASPECTS OF DISTRIBUTIONS (MODALITY, SYMMETRY,
VARIABILITY)
100. Which of these is not one of the three aspects of distributions discussed in the textbook?
a. variability
b. directionality
c. symmetry
d. modality
Ans: B
Learning Objective: 2-5
Cognitive Domain: Knowledge
Answer Location: Examining data: describing distributions
Question Type: MC
101. Which of these is not one of the three aspects of distributions discussed in the textbook?
a. variability
Tokunaga, Fundamental Statistics for the Social and Behavioral Sciences: Instructor Resource
b. frequency
c. symmetry
d. modality
Ans: B
Learning Objective: 2-5
Cognitive Domain: Knowledge
Answer Location: Examining data: describing distributions Question Type: MC
102. Which of these is not one of the three aspects of distributions discussed in the textbook?
a. variability
b. range
c. symmetry
d. modality
Ans: B
Learning Objective: 2-5
Cognitive Domain: Knowledge
Answer Location: Examining data: describing distributions Question Type: MC
103. Which of these is not one of the three aspects of distributions discussed in the textbook?
a. variability
b. representativeness
c. symmetry
d. modality
Ans: B
Learning Objective: 2-5
Cognitive Domain: Knowledge
Answer Location: Examining data: describing distributions Question Type: MC
104. Which of these is not one of the three aspects of distributions discussed in the textbook?
a. symmetry
b. variability
c. centrality
d. modality
Ans: C
Learning Objective: 2-5
Cognitive Domain: Knowledge
Answer Location: Examining data: describing distributions Question Type: MC
105. Which of these is not one of the three aspects of distributions discussed in the textbook?
a. size
b. variability
c. symmetry
d. modality
Ans: A
Learning Objective: 2-5
Cognitive Domain: Knowledge
Answer Location: Examining data: describing distributions
Question Type: MC
106. Which of these is not one of the three aspects of distributions discussed in the textbook?
a. symmetry
b. variability
c. methodology
d. modality
Ans: C
Learning Objective: 2-5
Cognitive Domain: Knowledge
Answer Location: Examining data: describing distributions
Question Type: MC
107. Which of these is not one of the three aspects of distributions discussed in the textbook?
a. independence
b. variability
c. symmetry
d. modality
Ans: A
Learning Objective: 2-5
Cognitive Domain: Knowledge
Answer Location: Examining data: describing distributions
Question Type: MC
108. Which of these is not one of the three aspects of distributions discussed in the textbook?
a. symmetry
b. variability
c. magnitude
d. modality
Ans: C
Learning Objective: 2-5
Cognitive Domain: Knowledge
Answer Location: Examining data: describing distributions
Question Type: MC
DESCRIBING DISTRIBUTIONS (MODALITY, SYMMETRY, VARIABILITY)
109. You would use the word ______ in describing a distribution that is ______, a. bimodal; skewed
b. skewed; symmetrical
c. normal; asymmetrical
d. skewed; asymmetrical
Ans: D
Learning Objective: 2-7
Cognitive Domain: Comprehension
Answer Location: Symmetry
Question Type: MC
110. You would use the word ______ to describe a distribution that is _____.
a. bimodal; normal
b. skewed; asymmetrical
c. normal; skewed
d. flat; bimodal
Ans: B
Learning Objective: 2-7
Cognitive Domain: Comprehension
Answer Location: Symmetry
Question Type: MC
111. You would use the word ______ to describe the _____ of a distribution
a. bimodal; variability
b. skewed; variability
c. skewed; symmetry
d. flat; modality
Ans: C
Learning Objective: 2-6
Cognitive Domain: Comprehension
Answer Location: Symmetry
Question Type: MC
112. You would use the word ______ to describe the _____ of a distribution
a. bimodal; modality
b. skewed; variability
c. skewed; variability
d. peaked; symmetry
Ans: A
Learning Objective: 2-6
Cognitive Domain: Comprehension
Answer Location: Modality
Question Type: MC
113. You would use the word ______ to describe the _____ of a distribution
a. symmetrical; modality
b. peaked; variability
c. skewed; modality
d. flat; symmetry
Ans: B
Learning Objective: 2-9
Cognitive Domain: Comprehension
Answer Location: Variability
Question Type: MC
114. You would use the word ______ to describe the _____ of a distribution
a. symmetrical; modality
b. skewed; modality
c. flat; variability
d. bimodal; symmetry
Ans: C
Tokunaga, Fundamental Statistics for the Social and Behavioral Sciences: Instructor Resource
Learning Objective: 2-9
Cognitive Domain: Comprehension
Answer Location: Variability
Question Type: MC
115. You would use the word ______ to describe the _____ of a distribution.
a. peaked; modality
b. flat; symmetry
c. bimodal; variability
d. skewed; symmetry
Ans: D
Learning Objective: 2-7
Cognitive Domain: Comprehension
Answer Location: Symmetry
Question Type: MC
DESCRIBING DISTRIBUTIONS (HYPOTHETICAL SITUATIONS)
116. After grading an examination, an instructor realizes the exam was much harder than he planned. He realizes this because the shape of the distribution of exam scores is
a. positively skewed
b. negatively skewed
c. symmetrical
d. flat
Ans: A
Learning Objective: 2-8
Cognitive Domain: Application
Answer Location: Symmetry
Question Type: MC
117. After grading an examination, an instructor realizes the exam was much easier than she planned. She reaches this conclusion because the shape of the distribution of exam scores is
a. positively skewed
b. normal
c. negatively skewed
d. flat
Ans: C
Learning Objective: 2-8
Cognitive Domain: Application
Answer Location: Symmetry
Question Type: MC
118. After grading an examination, an instructor realizes the exam was much harder than she planned. She reaches this conclusion because the shape of the distribution of exam scores is
a. bimodal
b. flat
c. skewed
d. normal
Ans: C
Tokunaga, Fundamental Statistics for the Social and Behavioral Sciences: Instructor Resource
Learning Objective: 2-7
Cognitive Domain: Application
Answer Location: Symmetry
Question Type: MC
119. A researcher asks a sample of people about their attitudes toward same-sex marriage and concludes that most people in her sample are strongly in favor of it, with relatively few people either undecided or against it. She reaches this conclusion because the shape of the distribution is
a. normal
b. flat
c. skewed
d. bimodal
Ans: C
Learning Objective: 2-6
Cognitive Domain: Application
Answer Location: Modality
Question Type: MC
120. After grading an examination, an instructor realizes her class is comprised of students who either completely understand the material or do not understand the material at all. She reaches this conclusion because the shape of the distribution of exam scores is
a. bimodal
b. flat
c. skewed
d. normal
Ans: A
Learning Objective: 2-7
Cognitive Domain: Application
Answer Location: Symmetry
Question Type: MC
121. A researcher asks a sample of people about their attitudes toward same-sex marriage and concludes people are either strongly in favor of it or strongly opposed, with relatively few people either unsure or indifferent. She reaches this conclusion because the shape of the distribution is
a. normal
b. peaked
c. skewed
d. bimodal
Ans: D
Learning Objective: 2-6
Cognitive Domain: Application
Answer Location: Modality
Question Type: MC
122. After grading an examination, an instructor realizes there is a wide range of ability among her students. She reaches this conclusion because the shape of the distribution is a. flat
b. skewed
c. abnormal
d. peaked
Tokunaga, Fundamental Statistics for the Social and Behavioral Sciences: Instructor Resource
Ans: A
Learning Objective: 2-9
Cognitive Domain: Application
Answer Location: Variability
Question Type: MC
123. A researcher asks a sample of people about their attitudes toward marijuana legalization and concludes people have a wide variety of opinions, and are equally likely to be anywhere between strongly in favor of it to strongly opposed to it. She reaches this conclusion because the shape of the distribution is
a. flat
b. skewed
c. abnormal
d. peaked
Ans: A
Learning Objective: 2-9
Cognitive Domain: Application
Answer Location: Variability
Question Type: MC
124. A panel of judges in a high school science fair have to select the overall winner from a group of contestants. Which of these distributions would make their decision most difficult to make?
a. peaked
b. bimodal
c. normal
d. flat
Ans: A
Learning Objective: 2-9
Cognitive Domain: Application
Answer Location: Variability
Question Type: MC
125. A researcher asks a sample of people about a particular politician and concludes the virtually everyone has the same opinion of the politician. She reaches this conclusion because the shape of the distribution is
a. peaked
b. bimodal
c. normal
d. flat
Ans: A
Learning Objective: 2-9
Cognitive Domain: Application
Answer Location: Variability
Question Type: MC
DESCRIBING DISTRIBUTIONS (HYPOTHETICAL FIGURES)
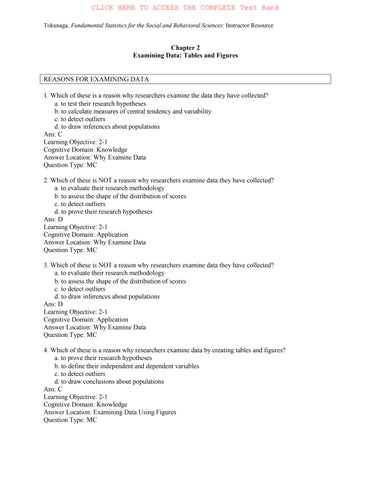
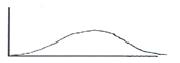
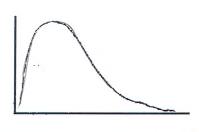
126. Which of the following best describes the shape of this distribution?
Tokunaga, Fundamental Statistics for the Social and Behavioral Sciences: Instructor Resource
a. skewed
b. symmetrical
c. bimodal
d. flat
Ans: A
Learning Objective: 2-7
Cognitive Domain: Comprehension
Answer Location: Symmetry
Question Type: MC
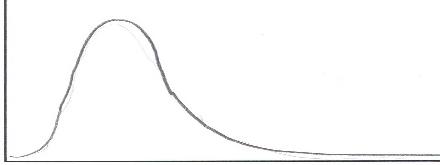
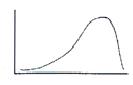
127. Which of the following best describes the shape of this distribution?
a. skewed
b. symmetrical
c. bimodal
d. asymmetrical
Ans: B
Learning Objective: 2-7
Cognitive Domain: Comprehension
Answer Location: Symmetry
Question Type: MC
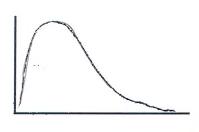
128. Which of the following does not describe the shape of this distribution?
a. normal
b. symmetrical
c. unimodal
d. skewed
Ans: D
Learning Objective: 2-7
Cognitive Domain: Comprehension
Answer Location: Symmetry
Question Type: MC
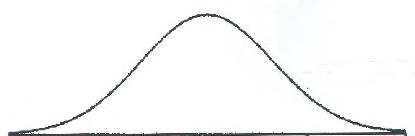
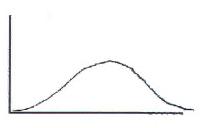
129. Which of the following best describes the shape of this distribution?
Tokunaga, Fundamental Statistics for the Social and Behavioral Sciences: Instructor Resource
a. flat
b. asymmetrical
c. bimodal
d. skewed
Ans: A
Learning Objective: 2-9
Cognitive Domain: Comprehension
Answer Location: Symmetry
Question Type: MC
130. Which of the following does not describe the shape of this distribution?
a. normal
b. asymmetrical
c. unimodal
d. skewed
Ans: A
Learning Objective: 2-9
Cognitive Domain: Comprehension
Answer Location: Variability
Question Type: MC
131. A pollster finds that people are either strongly in favor of abortion or are strongly opposed. Which of these best describes the distribution of attitudes?
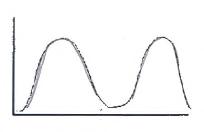
a. A
b. B
c. C
d. D
Ans: C
Learning Objective: 2-7
Cognitive Domain: Comprehension
Answer Location: Modality
Question Type: MC
132. A university surveys its students and finds the large majority of students are ‘somewhat satisfied’ with the education they have received, with only a few students either ‘very unsatisfied’ or ‘very satisfied. Which of these best describes the distribution of satisfaction?
Tokunaga, Fundamental Statistics for the Social and Behavioral Sciences: Instructor Resource
a. A
b. B
c. C
d. D
Ans: D
Learning Objective: 2-7
Cognitive Domain: Comprehension
Answer Location: Modality
Question Type: MC
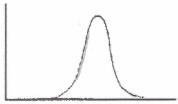
133. A university asks students to indicate their level of satisfaction with their education (from low to high). They find the large majority of students are ‘very satisfied’ with their education, with relatively few students either ‘very unsatisfied’ or ‘satisfied’. Which of these best describes this distribution?
a. A
b. B
c. C
d. D
Ans: C
Learning Objective: 2-7
Cognitive Domain: Comprehension
Answer Location: Symmetry
Question Type: MC
134. A judge has been hired to resolve the salary negotiations between a company and its labor union. The great majority of union members have relatively low salaries; however, a small percentage of union members have very high salaries. Which of these best describes the distribution of salaries?
a. A
b. B
c. C
d. D
Ans: D
Tokunaga, Fundamental Statistics for the Social and Behavioral Sciences: Instructor Resource
Learning Objective: 2-7
Cognitive Domain: Comprehension
Answer Location: Symmetry
Question Type: MC
DESCRIBING DISTRIBUTIONS (SETS OF DATA)
135. For the set of data below, pick the choice that best describes the shape of the distribution: 3, 7, 7, 12, 6, 7, 4, 7, 9, 7
a. normal
b. bimodal
c. flat
d. peaked
Ans: D
Learning Objective: 2-9
Cognitive Domain: Analysis
Answer Location: Variability
Question Type: MC
136. Which of the following best describes the shape of the distribution of these 11 scores?
16, 17, 12, 23, 18, 15, 17, 18, 17, 20, 16
a. bimodal
b. peaked
c. skewed
d. symmetrical
Ans: D
Learning Objective: 2-7
Cognitive Domain: Analysis
Answer Location: Symmetry
Question Type: MC
137. Which of the following best describes the shape of the distribution?
9, 4, 1, 6, 9, 8, 11, 9, 8, 9, 7
a. skewed
b. bimodal
c. symmetrical
d. flat
Ans: A
Learning Objective: 2-7
Cognitive Domain: Analysis
Answer Location: Symmetry
Question Type: MC
138. Which measure of central tendency would be the most appropriate for this distribution?
9, 4, 1, 6, 9, 8, 11, 9, 8, 9, 7
a. variance
b. median
c. standard deviation
d. mean
Ans: B
Learning Objective: 2-5
Cognitive Domain: Comprehension
Answer Location: Symmetry
Question Type: MC
139. Which of the following best describes the shape of the distribution?
9, 2, 4, 6, 4, 7, 9, 4, 9, 11, 5
a. skewed
b. bimodal
c. symmetrical
d. flat
Ans: B
Learning Objective: 2-6
Cognitive Domain: Analysis
Answer Location: Modality
Question Type: MC
140. Which measure of central tendency would be the most appropriate for this distribution?
9, 2, 4, 6, 4, 7, 9, 4, 9, 11, 5
a. variance
b. median
c. standard deviation
d. mode
Ans: D
Learning Objective: 2-5
Cognitive Domain: Comprehension
Answer Location: Modality
Question Type: MC
141. Which of the following best describes the shape of the distribution?
4, 13, 18, 4, 6, 2, 4, 6, 4, 8
a. skewed
b. bimodal
c. symmetrical
d. flat
Tokunaga, Fundamental Statistics for the Social and Behavioral Sciences: Instructor Resource
Ans: A
Learning Objective: 2-7
Cognitive Domain: Analysis
Answer Location: Symmetry
Question Type: MC
142. Which measure of central tendency would be the most appropriate for this distribution? 4, 13, 18, 4, 6, 2, 4, 6, 4, 8
a. variance
b. median
c. mean
d. skewness
Ans: B
Learning Objective: 2-5
Cognitive Domain: Comprehension
Answer Location: Symmetry
Question Type: MC