Test Bank for Principles Of Macroeconomics 1st Us Edition by Stevenson
Chapter 02: Demand: Thinking Like a Buyer
1. An individual demand curve is a graph:
a. that plots the quantity of an item that someone plans to buy, at each price.
b. that plots the quantity of an item that someone plans to buy, at one single price point.
c. that plots the quantity of an item that a seller plans to sell, at each price.
d. that plots the market price of a product at different points in time.
ANSWER: b
2. Quantity demanded is on the horizontal axis when you plot a demand curve and shows the:
a. amount of a good that a person is willing to buy at each price.
b. amount of a good that a person actually buys at the market price.
c. amount of a good that a seller is willing to sell at a particular price.
d. amount where opportunity cost is equal to the marginal benefit.
ANSWER: a
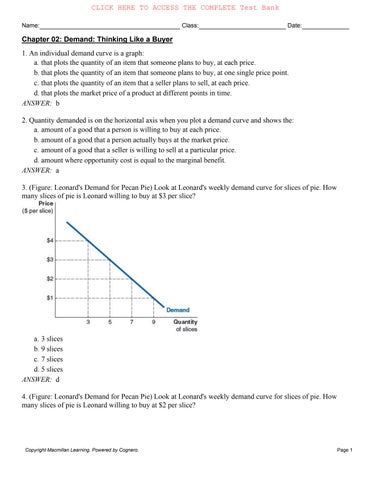
3. (Figure: Leonard's Demand for Pecan Pie) Look at Leonard's weekly demand curve for slices of pie. How many slices of pie is Leonard willing to buy at $3 per slice?
a. 3 slices
b. 9 slices
c. 7 slices
d. 5 slices
ANSWER: d
4. (Figure: Leonard's Demand for Pecan Pie) Look at Leonard's weekly demand curve for slices of pie. How many slices of pie is Leonard willing to buy at $2 per slice?
Chapter 02: Demand: Thinking Like a Buyer
a. 3 slices
b. 9 slices
c. 7 slices
d. 5 slices
ANSWER: c
5. (Figure: Mia's Demand Curve for Ice Cream) The accompanying graph shows Mia's demand curve for ice cream, how many cones would Mia be willing to buy at $5 per cone?
a. 3 cones
b. 9 cones
c. 5 cones
d. 12 cones
Chapter 02: Demand: Thinking Like a Buyer
ANSWER: a
6. (Figure: Mia's Demand Curve for Ice Cream) Look at Mia's demand curve for ice cream, how many cones is Mia willing to buy at $4 per cone?
a. 6 cones
b. 3 cones
c. 12 cones
d. 9 cones
ANSWER: a
7. Why does the demand curve slope downwards?
a. It slopes downward due to the positive relationship between price and quantity demanded.
b. It slopes downward due to buyers perceiving fall in price as a fall in quality.
c. It slopes downward due to the law of demand.
d. It slopes downward due to stores lowering the prices on their products.
ANSWER: c
8. A downward-sloping demand curve implies:
a. there is an inverse relationship between price and quantity demanded.
b. there is a positive relationship between price and quantity demanded.
c. there is no relationship between price and quantity demanded.
d. buyers are willing to buy less when prices are lower.
ANSWER: a
9. The law of demand refers to a. the positive relationship between price and quantity supplied.
Chapter 02: Demand: Thinking Like a Buyer
b. the inverse relationship between price and quantity supplied.
c. the inverse relationship between price and quantity demanded.
d. the positive relationship between price and quantity demanded.
ANSWER: c
10. Which of the following scenarios does not illustrate the law of demand?
a. When Kit-Kats are cheaper, Mary opts to buy more Kit-Kats.
b. Darren buys two pairs of jeans when they are $40 each, but only one pair when it is $60.
c. Layla buys less tea when the price of tea rises.
d. Freya buys more doughnuts when the price of doughnuts is higher.
ANSWER: d
11. Which of the following scenarios illustrates the law of demand?
a. Francis does not care about the price of coffee at the coffee shop – he must buy two cappuccinos every day, regardless of the price.
b. A research company finds that the more expensive a particular brand of a designer handbag, the more that consumers are willing to purchase the brand.
c. John likes to drink spring water. At $2 he buys four bottles of water, and at $1.50 he still buys four bottles of water.
d. Kathleen eats more steak when the price is low, and less when the price is high.
ANSWER: d
12. When plotting a demand curve,
a. quantity demanded is on the vertical axis.
b. price is on the horizontal axis.
c. quantity supplied is on the vertical axis.
d. quantity demanded is on the horizontal axis.
ANSWER: d
13. When plotting a demand curve
a. quantity demanded is on the vertical axis.
b. price is on the horizontal axis.
c. price is on the vertical axis.
d. quantity supplied is on the vertical axis.
ANSWER: c
14. A rational buyer will:
a. keep buying a product until marginal benefit equals price.
b. buy a product until the marginal benefit of consuming the product is less than the price of the product.
c. buy the product only when the marginal benefit of consuming the product is twice as much as the price of the product.
Chapter 02: Demand: Thinking Like a Buyer
d. not consider costs versus benefits when purchasing a product.
ANSWER: a
15. The Rational Rule for Buyers
a. compares the total benefit of all units to the total price of all units purchased.
b. compares the benefit of buying an additional unit of the item to the cost of that item.
c. only applies to buyers who are buying necessities as opposed to luxury items.
d. compares the cost of production of an item to the price of the item.
ANSWER: b
16. Which of the following scenarios depicts a rational buyer?
a. Mary values a bag of salad at $2, but she buys the bag of salad even when the price is $4.
b. John walks into a grocery store and purchases monthly groceries without paying attention to the prices of groceries.
c. Darwin buys a can of shoe polish at $4.50 when his marginal benefit from it is $3.75.
d. Damien chooses to buy a sandwich for $5 when the marginal benefit of the sandwich to him is $7.
ANSWER: d
17. The demand curve
(i) is a curve that shows the maximum willingness to pay for a product.
(ii) is a curve that shows the marginal benefit gained from a product.
(iii) is a curve that shows the production cost of a product.
(iv) is a curve that shows the relationship between the price of a product and a consumer's willingness to buy at each price.
a. (i), (ii), (iii) and (iv) are all correct.
b. (i), (ii) and (iv) are correct.
c. (ii) and (iv) are correct.
d. (i) and (ii) are correct.
ANSWER: b
18. Which of the following would be considered in a cost-benefit analysis to decide if a person should cycle to work or ride the subway?
(i) The air pollution that the cyclist has to breathe.
(ii) The cost of subway tickets.
(iii) The time it takes to cycle to work versus the time it takes to ride the subway to work.
(iv) The cost per gallon of gasoline.
a. (i), (iii) and (iv)
b. (i), (ii), (iii) and (iv)
c. (i), (ii), and (iv)
d. (i), (ii) and (iii)
ANSWER: d
Chapter 02: Demand: Thinking Like a Buyer
19. Diminishing marginal benefit:
a. is when buying an additional item yields a larger marginal benefit than the previous item.
b. is when consumers do not follow the rational rule.
c. is not important in determining a consumer's purchase decision.
d. is when buying an additional item yields a smaller marginal benefit than the previous item.
ANSWER: d
20. Diminishing marginal benefit
a. does not affect a buyer's decision.
b. can be observed in the upward slope of the supply curve.
c. can be observed in the downward slope of the demand curve.
d. means that consumers are willing to pay more for additional units of an item.
ANSWER: c
21. On a hot sweltering day, you feel thirsty and buy an ice-cold soft drink, which you gulp down. Whether you buy the second drink or not, will depend on
a. how you feel about soft drinks.
b. the total amount of soft drinks that you have consumed that week.
c. the price of the soft drink.
d. the marginal benefit from the second soft drink and if it will outweigh the price of the soft drink.
ANSWER: d
22. The table shows the monthly individual demand schedules of four students for soda. What is the total monthly market demand for soda at $2 per can?
a. 99 cans
b. 45 cans
c. 125 cans
d. 148 cans
ANSWER: c
23. The table contains the monthly demand for soda cans for four students. If these four students make up the entire market, what is the total monthly market demand for soda at $1.50 per can?
Chapter 02: Demand: Thinking Like a Buyer
a. 125 cans
b. 45 cans
c. 99 cans
d. 148 cans
ANSWER: d
24. The table shows the monthly individual demand schedules of four students for soda. What is the change in the total market demand for soda when the price changes from $1.50 per can to $2 per can?
a. The total quantity demanded in the market falls by 23 cans.
b. The total quantity demanded in the market rises by 26 cans.
c. The total quantity demanded in the market falls by 18 cans.
d. The total quantity demanded in the market rises by 23 cans.
ANSWER: a
25. The table contains the monthly demand for soda cans for four students. If these four students make up the entire market, what is the change in the total monthly market demand for soda when the price changes from $3 per can to $2.50 per can?
a. The total quantity demanded in the market rises by 23 cans.
b. The total quantity demanded in the market falls by 26 cans.
c. The total quantity demanded in the market rises by 36 cans.
d. The total quantity demanded in the market falls by 33 cans.
Copyright Macmillan Learning. Powered by Cognero.
Chapter 02: Demand: Thinking Like a Buyer
ANSWER: c
26. As part of a market research project, you survey six random people to see how much gas per week they would buy at various prices. The data you collect is in the accompanying table. What is the total demand for gasoline at $2.50 per gallon in your survey?
of
a. 51 gallons
b. 38 gallons
c. 77 gallons
d. 22 gallons
ANSWER: a
27. As part of a market research project, you survey six random people to see how much gas per week they would buy at various prices. The data you collect is in the accompanying table. What is the total demand in your survey for gas at $1.50 per gallon?
a. 51 gallons
b. 77 gallons
c. 38 gallons
d. 22 gallons
ANSWER: b
28. As a part of a market research project, you survey six random people to see how much gas per week they would buy at various prices. The data you collect is in the accompanying table. What is the change in the total demand for gasoline in your survey when the price changes from $2 per gallon to $2.50 per gallon?
of Gallons of Gas Demanded Per Week
Chapter 02: Demand: Thinking Like a Buyer
a. The total quantity demanded in the market rises by 11 gallons.
b. The total quantity demanded in the market falls by 14 gallons.
c. The total quantity demanded in the market rises by 16 gallons.
d. The total quantity demanded in the market falls by 13 gallons.
ANSWER: b
29. As part of a market research project, you survey six random people to see how much gas per week they would buy at various prices. The data you collect is in the accompanying table. What is the change in the total demand for gasoline in your survey when the price changes from $3 per gallon to $2.50 per gallon?
Quantity of Gallons of Gas Demanded Per Week
a. The total quantity demanded in the market falls by 11 gallons.
b. The total quantity demanded in the market falls by 14 gallons.
c. The total quantity demanded in the market rises by 16 gallons.
d. The total quantity demanded in the market rises by 13 gallons.
ANSWER: d
30. What is the process that a manager can follow to estimate the total market demand for the United States?
a. Survey one consumer, and then scale up that individual demand to represent the entire market, and plot the market demand curve.
b. Survey some representative customers, find the total quantity demanded for those customers, scale up the quantities demanded to represent the entire market, and then plot the market demand curve.
c. Survey representative customers, find the total quantity demanded for those representative customers, and then plot the market demand curve.
d. Generate random data to represent market quantity demanded for the entire market, and then plot the market demand curve.
ANSWER: b
31. (Figure: Graph) Refer to the graph to answer the question.
Chapter 02: Demand: Thinking Like a Buyer
The movement from point M to point N represents:
a. a decrease in demand.
b. a decrease in quantity demanded.
c. an increase in quantity demanded.
d. an increase in demand.
ANSWER: c
32. (Figure: Graph) Refer to the graph to answer the question. In the graph, the movement from point P to point Q represents
a. a decrease in quantity demanded.
b. an increase in demand.
c. a decrease in demand.
d. an increase in quantity demanded.
ANSWER: a
Chapter 02: Demand: Thinking Like a Buyer
33. (Figure: Graph) Refer to the graph to answer the question. In the graph, the movement from point M to point Q represents
a. a decrease in demand.
b. a decrease in quantity demanded.
c. an increase in quantity demanded.
d. an increase in demand.
ANSWER: d
34. (Figure: Graph) Refer to the graph to answer the question. In the graph, the movement from point W to point P represents:
a. an increase in quantity demanded.
b. an increase in demand.
c. a decrease in demand.
d. an increase in quantity demanded.
ANSWER: c
Chapter 02: Demand: Thinking Like a Buyer
35. (Figure: Graph) Refer to the graph to answer the question.
The movement from point S to point T is caused by
a. an increase in the price of the item.
b. a decrease in the price of the item.
c. a decrease in the demand for the item.
d. an increase in the demand for the item.
ANSWER: b
36. (Figure: Graph) Refer to the graph to answer the question.
The movement from point V to point W is caused by
a. an increase in the price of the item.
b. a decrease in the price of the item.
c. an increase in the demand for the product.
d. a decrease in the demand for the product.
Chapter 02: Demand: Thinking Like a Buyer
ANSWER: a
37. (Figure: Graph) Refer to the graph to answer the question.
An increase in the price of an item will cause the movement from a. point W to point V.
b. point Q to point P.
c. point N to point M.
d. point Q to point T.
ANSWER: c
38. (Figure: Graph) Refer to the graph to answer the question.
A decrease in the price of an item will cause the movement from a. point P to point W.
b. point N to point M.
Chapter 02: Demand: Thinking Like a Buyer
c. point T to point P.
d. point Q to point P.
ANSWER: d
39. The interdependence principle:
a. is the same as the cost-benefit principle.
b. refers to the marginal benefit of consuming additional units of an item.
c. implies that buyers decisions are affected by many factors other than the price of an item.
d. implies that consumers depend on each other to make purchase decisions in the market.
ANSWER: c
40. (Figure: Holly's Demand for Toffee) Holly doesn't care about the price of toffee. She loves toffee so much that she must eat toffee every day. Which of the following figures most likely depicts Holly's demand for toffee?
a. Figure A
b. Figure B
c. Figure C
d. Figure D
ANSWER: a
41. (Figure: Damien's Demand for Kit-Kats) Regardless of the price of Kit-Kats, Damien has decided to eat five Kit-Kats every day. Which of the figures shows Damien's daily demand curve for Kit-Kats?
a. Figure A
Chapter 02: Demand: Thinking Like a Buyer
b. Figure B
c. Figure C
d. Figure D
ANSWER: b
42. Shifts in market demand can result from a change in
a. the price of a product.
b. the cost of production for an item.
c. the number of producers of an item in the market.
d. the type and number of buyers.
ANSWER: d
43. Which of the following is not a demand shifter?
a. The price of a substitute good.
b. The price of a complementary good.
c. The number of buyers in the market.
d. The price of the product.
ANSWER: d
44. A normal good is:
a. a good for which higher income causes an increase in demand.
b. a good which is normally purchased by many consumers.
c. a good which is only purchased by high-income consumers.
d. a good for which higher income causes a decrease in demand.
ANSWER: a
45. For normal goods
a. a tax cut on consumer income will lead to a rise in their demand.
b. a tax cut on consumer income will lead to a fall in their demand.
c. changes in consumer income do not affect their consumption.
d. most consumers will choose to purchase the good regardless of income changes.
ANSWER: a
46. An inferior good is
a. a good whose demand increases when income rises.
b. a good whose demand decreases when income rises.
c. an item that is only bought by rich people.
d. an item that is purchased by very few people.
ANSWER: b
47. Fast food is a good example of
Chapter 02: Demand: Thinking Like a Buyer
a. a normal good.
b. a good with a congestion effect.
c. an inferior good.
d. a luxury good.
ANSWER: c
48. Holding all else constant, if people eat out more at expensive restaurants when they earn more, then expensive restaurant meals are
a. goods with a congestion-effect.
b. goods with a network-effect.
c. inferior goods.
d. normal goods.
ANSWER: d
49. Recent evidence suggests exercise promotes longevity and reverses aging. Based on this information, what might happen in the market for exercise-related goods and services?
a. The demand for gyms will not change.
b. People will reduce their purchases of exercise equipment.
c. The demand for exercise machines and/or gyms will increase.
d. The demand for exercise equipment will not be affected.
ANSWER: c
50. In March 2019, airlines around the world grounded their Boeing 737 Max aircraft after two of them crashed. What would we expect to happen in the market for this aircraft?
a. Airline companies would increase their demand for the Boeing 737 Max aircraft.
b. There would be a rise in the number of orders for the Boeing 737 Max aircraft.
c. Consumers would increase the number of flights they take per year.
d. The demand for the Boeing 737 Max would decrease due to concerns about the safety of the aircraft.
ANSWER: d
51. (Figure: Leather Wallets) Fossil has started an aggressive advertising campaign for its wallets. Which graph shows how the demand in the market might change if the advertising campaign is successful?
a. Graph A
Chapter 02: Demand: Thinking Like a Buyer
b. Graph B
c. Graph C
d. Graph D
ANSWER: d
52. (Figure: Demand for Bus Rides) The city of Vaughan in Ontario, Canada, opened a new subway line that extended the existing subway system between the greater Toronto area and the city of Vaughan. The route previously only had bus service. Which of the following graphs depicts the effect you would expect to see on the demand for bus rides on this route after the introduction of the subway?
a. Graph A
b. Graph B
c. Graph C
d. Graph D
ANSWER: a
53. (Figure: Peanut Butter and Jelly) In the United States, peanut butter and jelly are considered complementary items. Which graph illustrates the impact of a rise in the price of peanut butter on the jelly market?
a. Graph A
b. Graph B
c. Graph C
d. Graph D
ANSWER: a
54. (Figure: Butter and Jam) Some people like to eat jam and butter sandwiches, and for them, these two foods are complementary goods. For these people, which of the graphs illustrates the impact of a fall in the price of
Chapter 02: Demand: Thinking Like a Buyer
butter on the jam market?
a. Graph A
b. Graph B
c. Graph C
d. Graph D
ANSWER: d
55. (Figure: Demand for Rental Housing) Fort Collins, CO is experiencing net immigration of people into the area. Which of the following graphs illustrates the impact of this net immigration on the demand for rental housing?
a. Graph A
b. Graph B
c. Graph C
d. Graph D
ANSWER: d
56. (Figure: Market for Luxury Vehicles) Which graph shows what will happen in the market for luxury vehicles if a recession is imminent?
Chapter 02: Demand: Thinking Like a Buyer
a. Graph A
b. Graph B
c. Graph C
d. Graph D
ANSWER: a
57. (Figure: Market for Holiday Cruises) Which graph shows the effect of an impending slowdown on the market for cruise holidays?
a. Graph A
b. Graph B
c. Graph C
d. Graph D
ANSWER: a
58. (Figure: Market for High-End Meals) What will happen to the demand for upscale restaurants, if an economy goes into recession and unemployment rises?
a. Graph A
Chapter 02: Demand: Thinking Like a Buyer
b. Graph B
c. Graph C
d. Graph D
ANSWER: a
59. (Figure: Market for Community College) Which graph illustrates the effect on the demand for community college, if an economy faces a recession, and there is rising unemployment?
a. Graph A
b. Graph B
c. Graph C
d. Graph D
ANSWER: d
60. (Figure: Market for New Housing) Which of the graphs shows the effect on the housing market today, if the realtor association predicts new housing prices to fall in a few months?
a. Graph A
b. Graph B
c. Graph C
d. Graph D
ANSWER: a
61. (Figure: Market for New Housing) Which graph shows the effect on the housing market today, if the realtor association predicts new housing prices to rise in a few months?
Chapter 02: Demand: Thinking Like a Buyer
a. Graph A
b. Graph B
c. Graph C
d. Graph D
ANSWER: d
62. (Figure: Market for Printing Paper) Which of the following graphs illustrates what we expect to see in the market for printing paper if the price of printing paper rises?
a. Graph A
b. Graph B
c. Graph C
d. Graph D
ANSWER: c
63. (Figure: Market for Roses) Which graph illustrates what will happen in the market for roses if the price of roses falls?
a. Graph A
Chapter 02: Demand: Thinking Like a Buyer
b. Graph B
c. Graph C
d. Graph D
ANSWER: b
64. Paint and paintbrushes are complements. If the price of paint rises, we can expect:
a. the quantity demanded of paint to increase.
b. the demand for paintbrushes to decrease.
c. the demand for paintbrushes to increase.
d. the quantity demanded of paintbrushes to remain unchanged.
ANSWER: b
65. If Tesla cars become less expensive, what will happen in the market for other electric cars?
a. The quantity demanded of Teslas will fall.
b. The demand for other electric cars will fall.
c. The demand for other electric cars will rise.
d. The quantity demanded of Teslas will not change.
ANSWER: b
66. (Figure: Market for Stevia) Stevia is a natural sweetener that is used as a sugar substitute. Which of the following graphs illustrates the impact of a rise in the price of Stevia on the demand for sugar?
a. Graph A
b. Graph B
c. Graph C
d. Graph D
ANSWER: d
67. (Figure: Market for Bread) Bread and cheese are often considered to be complementary foods. Which graph shows what will happen in the market for bread if the price of bread rises?
Chapter 02: Demand: Thinking Like a Buyer
a. Graph A
b. Graph B
c. Graph C
d. Graph D
ANSWER: c
68. (Figure: Market for Apple Computers) Dell and Apple are competitors in the computer market. Which graph illustrates the effect of a rise in the price of Dell computers on the demand for Apple computers?
a. Graph A
b. Graph B
c. Graph C
d. Graph D
ANSWER: d
69. Which of the following lists only factors that would cause a decrease in the demand for a good?
a. A decrease in popularity of a good; a rise in income (if the good is an inferior good); a fall in the price of a substitute good.
b. A decrease in the number of consumers in the market; a rise in the price of a substitute good; a fall in the price of a complementary good.
c. An increase in congestion effects; a decrease in the number of consumers in the market; increase in popularity of a product.
d. An increase in network effects; a rise in income (if the good is a normal good); a rise in the price of a substitute good.
ANSWER: a
Chapter 02: Demand: Thinking Like a Buyer
70. Which of the following lists only factors that would cause an increase in the demand for an item?
a. Information on possible side effects of using an item; a rise in income (if the good is a normal good); a fall in the price of a substitute good
b. Information on possible side effects of using an item; a rise in income (if the good is a normal good); a fall in the price of a substitute good
c. A decrease in the number of consumers in the market; a rise in the price of a substitute good; a fall in the price of a complementary good
d. An increased congestion effect; a decrease in the number of consumers in the market; increase in popularity of a product
ANSWER: b
71. Which of the following items is an inferior good?
a. Low-quality frozen meals
b. University textbooks
c. Restaurant a la carte dinners
d. Toll roads
ANSWER: a
72. Which of the following items is an inferior good?
a. Luxury SUVs
b. Discount stores
c. Airline tickets
d. Car rentals
ANSWER: b
73. Which of the following items is a normal good?
a. Canned food
b. Instant noodles
c. Steak
d. Third-hand cars
ANSWER: c
74. The relationship between price expectations and demand is
a. negative; when future prices are expected to rise, current demand will fall.
b. negative; when future prices are expected to fall, current demand will rise.
c. positive; when future prices are expected to rise, current demand will rise.
d. positive; future prices are generally expected to rise.
ANSWER: c
75. A product that can have congestion effects is
a. Tripadvisor reviews.
b. Facebook.
Chapter 02: Demand: Thinking Like a Buyer
c. roads.
d. Instagram.
ANSWER: c
76. A product with a network effect is
a. a drive-through window at a fast food restaurant.
b. a social media tool such as WeChat in China.
c. a broadband telecommunications network.
d. the customer service line at the Department of Motor Vehicles.
ANSWER: b
77. If Canadian consumers expect the value of the Canadian dollar to depreciate against the US dollar (the Canadian dollar becomes weaker against the dollar), what impact would we expect this to have on Canadians' demand for American made products?
a. The demand for American-made items would fall.
b. The demand for American-made items would not change.
c. The demand for American-made items would rise.
d. The demand for American-made items would double.
ANSWER: a
78. If Canadian consumers expect the value of the Canadian dollar to rise against the US dollar, what impact would we expect this to have on Canadians' demand for American made products?
a. The demand for American-made items would fall.
b. The demand for American-made items would not change.
c. The demand for American-made items would rise.
d. The demand for American-made items would double.
ANSWER: c
79. Due to uncertainty around Brexit, the value of the British pound has been falling against the Euro. How will this affect the demand for German goods in the UK?
a. The demand for German goods would increase.
b. The demand for German goods would not change.
c. The demand for German goods would double.
d. The demand for German goods would fall.
ANSWER: d
80. The table below shows data on quantity demanded for ATV tours at an ATV excursion company in Bali. In June, many new tourists arrive in Bali and the additional demand from these tourists is indicated in the table. Which of the following is true about the market for ATV tours in June?
Chapter 02: Demand: Thinking Like a Buyer
a. At a price of $149, the total market demand for ATV tours in June is 933.
b. At a price of $99, the total market demand for ATV tours in June is 272.
c. At a price of $189, the total market demand for ATV tours in June is 459.
d. At a price of $119, the total market demand for ATV tours in June is 245.
ANSWER: a
81. (Figure: Market for Tourism) A hotel in Cape Cod, Massachusetts, is completely booked during August. However, in September, tourism drops significantly and some hotel rooms remain empty. Which of the graphs depicts this scenario?
a. Graph A
b. Graph B
c. Graph C
d. Graph D
ANSWER: a
82. The table shows data on quantity demanded for college textbooks in June. In August, the new incoming freshmen join the university. The additional demand for college textbooks in August is shown in the last column of the table. Which of the following is true about the market for textbooks in August?
a. At a price of $75, the total market demand for textbooks in August is 2700.
b. At a price of $99, the total market demand for textbooks in August is 1050.
Chapter 02: Demand: Thinking Like a Buyer
c. At a price of $149, the total market demand for textbooks in August is 417.
d. At a price of $300, the total market demand for textbooks in August is 967.
ANSWER: d
83. During the Great Recession of 2007-2009, unemployment shot up and a lot of people lost their jobs. All over the United States, people worried about job security. Which of the following do you think happened as a result of the Great Recession?
(i) Consumers ate out less often.
(ii) Consumers purchased fewer higher-end vehicles.
(iii) Purchases of new housing went down.
(iv) Consumers took fewer vacations outside the United States.
a. (i), (ii) and (iv) are correct.
b. (i) and (iv) are correct.
c. (ii) and (iii) are correct.
d. (i), (ii), (iii) and (iv) are all correct.
ANSWER: d
84. (Figure: Market for Oral Health Care) A recent article published in the Journal of the American Dental Association talked about the impact of the Great Recession of 2007-2009 on the demand for oral health care in the United States. Which of the graphs illustrates what this impact might have been?
a. Graph A
b. Graph B
c. Graph C
d. Graph D
ANSWER: a
85. How will the demand for Gucci shoes change today, if the government decides to tax designer shoes next year?
a. The demand for Gucci shoes will shift to the right today.
b. There will be no impact on the demand for Gucci shoes today.
c. People will stop buying Gucci shoes today.
d. The demand for Gucci shoes will shift to the left today.
ANSWER: a
Chapter 02: Demand: Thinking Like a Buyer
86. What would you expect to happen to the demand for a luxury good today, if the government announces it will stop taxing that luxury good next year?
a. The demand for the luxury good will shift to the right today.
b. There will be no impact on the demand for the luxury good.
c. Consumers will stop their consumption of the luxury good altogether.
d. The demand for the luxury good will shift to the left today.
ANSWER: d
87. Which of the following businesses do you think will do well during a recession?
a. Luxury cruise lines
b. Discount clothing stores
c. Designer clothing stores
d. Upscale restaurants
ANSWER: b
88. Stores that are expected to perform better during recessions are those that sell
a. inferior goods.
b. normal goods.
c. luxury goods.
d. expensive goods.
ANSWER: a
89. The marginal benefit of consuming an item is
a. the difference between what the consumer is willing to pay and the actual market price of the item.
b. the total benefit from buying several units of the item.
c. the additional benefit from buying one more unit of that item.
d. the additional number of consumers who buy a unit of an item.
ANSWER: c
90. Jane goes to an all-you-can-eat restaurant and makes three trips to the buffet. After finishing food from her third trip, she felt sick and throws up. Which of the following economic explanations best matches Jane's situation?
a. Jane's marginal benefit from eating the third place was positive but less than that of the second plate.
b. Jane's marginal benefit from her third trip to the buffet was larger than her marginal benefit from her second trip.
c. Jane was charged extra for the third plate at the buffet.
d. Jane's marginal benefit from eating the third plate was negative.
ANSWER: d
91. When you get hired for a well-paying job, you will most likely view older used cars as
a. complementary goods.
b. substitute goods.
Chapter 02: Demand: Thinking Like a Buyer
c. inferior goods.
d. normal goods.
ANSWER: c
92. As consumers consume more units of an item, the marginal benefit of each additional unit decreases at an increasing rate. This can be seen through:
a. demand curves that are flatter at lower quantities and steeper at higher quantities.
b. demand curves that are vertical.
c. demand curves that are steeper at lower quantities and flatter at higher quantities.
d. demand curves that are positively sloped.
ANSWER: c
93. In May of 2019, the U.S. raised tariffs (import taxes) on a large variety of Chinese imports. In the U.S. market for these Chinese imports, we would see:
a. an increase in the number of consumers.
b. a fall in price.
c. a rise in demand.
d. a rise in price.
ANSWER: d
94. If a product has a large network effect, it will lead to
a. a large congestion effect.
b. a small number of consumers using the product and a decreased demand for the product.
c. greater marginal benefits from using the product and increased demand for the product.
d. smaller marginal benefits from using the product.
ANSWER: c
95. If the price of airline tickets goes up, there will be
a. an increase in the demand for bus tickets, but a decrease in the demand for train tickets.
b. a decrease in the demand for bus tickets, but an increase in the demand for train tickets.
c. an increase in the quantity demanded of airline tickets.
d. an increase in the demand for both bus and train tickets.
ANSWER: d
96. Air Canada announces a 15% off sale on its flights, so fans can watch Toronto Raptors play against the Golden State Warriors in the NBA Finals. What effect will this sale have on Air Canada's flights to destinations other than Canada?
a. The supply of Air Canada tickets will shift to the right.
b. The demand for Air Canada tickets will shift to the right.
c. The supply of Air Canada tickets will shift to the left.
d. The demand for Air Canada tickets will shift to the left.
Name: Class: Date:
Chapter 02: Demand: Thinking Like a Buyer
ANSWER: b
97. Dental services can be classified as
a. normal goods.
b. expenses that do not change with income.
c. inferior goods.
d. fixed in their demand.
ANSWER: a
98. The aim of a marketing campaign is to
a. decrease the number of consumers in the market.
b. shift the demand curve to the left.
c. decrease the demand for the product.
d. increase the demand for the product.
ANSWER: d
99. Find and explain the error in reasoning in each of the following three statements.
Statement 1: If the price of steak rises, then the demand for steak will fall.
Statement 2: When incomes rise, consumers demand fewer inferior goods because these goods are lower in quality than normal goods.
Statement 3: The law of demand refers to the inverse relationship between the price of a product and the demand curve for that product.
ANSWER: Statement 1's error is the failure to distinguish between a change in quantity demanded and a change in demand. If the price of steak rises, then the quantity demanded of steak will fall, leading to a movement along the same demand curve. The demand curve would not shift as a result of the change in the price of steak.
Statement 2's error is in defining inferior goods. Inferior goods do not have to be low in quality –when income rise, the demand for inferior goods falls because consumers can afford more expensive items.
Statement 3's error is in the failure to distinguish between demand and quantity demanded. The law of demand refers to the inverse relationship between the price of a product and the quantity demanded of that product.
100. Find and explain the error in reasoning in each of the following three statements.
Statement 1: If prices are expected to rise in the future, this will lead to a fall in quantity demanded at the present time.
Statement 2: A decrease in demand is the same as saying that there is a decrease in the quantity demanded for the product.
Statement 3: An increase in demand is the same as saying that there is an increase in the quantity demanded for the product.
ANSWER: Statement 1's error is in failing to distinguish between a change in price today and a change in the expected future price. If the product price changes today, this will lead to a change in quantity demanded. However, if the future price of the product is expected to change, this will lead to a shift in the demand curve.
Statements 2 and 3 have the same error – a failure to distinguish between a change in demand and a
Chapter 02: Demand: Thinking Like a Buyer
change in quantity demanded A change in demand is a shift of the entire demand curve. A change in quantity demanded is a movement along the same demand curve.
101. As a part of a market research project, you survey six random people to see how much gas per week they would buy at various prices. The data you collect is in the accompanying table. Assuming that these are the only six consumers in the market, plot the market demand curve for gas.
102. The table shows the demand data for four different consumers who drinks sodas. Assuming that these are the only four consumers in the market, plot the market demand curve for sodas.
of soda
Chapter 02: Demand: Thinking Like a Buyer
ANSWER:
103. You are studying the demand for cruise ship tickets. Determine how the demand for these tickets might be affected by each of the three factors below.
(a) A major marketing campaign successfully advertises the cruise ship sailings.
(b) The government lowers income taxes on its population and so consumers have more after-tax income. (c) Consumers begin to prefer ocean travel as opposed to airline travel.
104. Suppose you find out that Domino's is having a promotion where you buy the first 3-topping large pizza for $8 and get the second one for $4. Why does the store not simply sell each pizza for $6? Explain your answer using the Rational Rule for Buyers.
ANSWER: The rational buyer will only buy an item if the marginal benefit is greater than or equal to the price of the product. The first pizza that a consumer buys will have a larger marginal benefit than the second pizza. Therefore, in order to sell the second pizza, Domino's will have to lower the price.
105. For each of the four scenarios below, explain which way the demand curve shifts and why.
Scenario 1: In the market for automobiles, a credible forecast is released which says that prices will fall in the near future.
Scenario 2: You are studying the market for jackfruits. A report is released which details the health benefits of eating jackfruits.
Scenario 3: You are studying the market for farmed salmon. You now get information that consumers have developed a strong preference for wild-caught salmon.
ANSWER: Scenario 1: Demand will decrease at the current time as consumers will wait to purchase vehicles when they are cheaper.
Scenario 2: The demand for jackfruits will increase as consumers will want to benefit from the health properties of jackfruits.
Scenario 3: The demand for farmed salmon will decrease as consumers will opt for the wild-caught variety.
106. For each of the four scenarios below, explain which way the demand curve shifts and why.
Scenario 1: In the market for automobiles, a credible forecast is released which says that prices will rise in the near future.
Scenario 2: Many young people leave a small town to look for jobs in the capital city. What happens to the
Chapter 02: Demand: Thinking Like a Buyer
demand for college education in the small town?
Scenario 3: There is news of an E. coli outbreak caused by contaminated lettuce.
ANSWER: Scenario 1: Demand will increase at the current time as consumers will hurry to buy vehicles before prices rise.
Scenario 2: The demand for college education in the small town will decrease as young people will have moved away to the capital city.
Scenario 3: The demand for lettuce will fall as consumers will want to avoid the contaminated lettuce.
107. For each of the four scenarios below, draw demand curves to illustrate the effects.
(a) During the cold and flu season, consumers choose to drink more orange juice to get the health benefits of Vitamin C. What happens to the demand curve for orange juice?
(b) The government provides tax incentives to consumers who trade in their old vehicles for electric vehicles. What happens to the demand curve for electric vehicles?
(c) The Canadian dollar weakens against the US dollar. In Canada, what happens to the demand for Americanmade goods?
(d) The US dollar strengthens against the Canadian dollar. In the United States, what happens to the demand for Canadian-made goods?
ANSWER: (a)
Name:
Chapter 02: Demand: Thinking Like a Buyer
108. Computer hardware and computer software are complementary goods. What happens to the demand curves for computer hardware and computer software if the price of computer hardware rises? Show your answer using two graphs – one for computer hardware and the other for computer software. ANSWER: Computer hardware market
Computer software market
Chapter 02: Demand: Thinking Like a Buyer
109. Orange juice and apple juice are substitute goods. What happens to the demand curves for apple juice and orange juice if the price of apple juice rises? Show your answer using two graphs – one for apple juice and the other for orange juice.
ANSWER: Apple juice market
110. McDonald's and Wendy's are substitute fast food restaurants. What would happen to the demand curve for
Orange juice market
Chapter 02: Demand: Thinking Like a Buyer
fish sandwiches from these two restaurants if McDonald's decreases the price of fish sandwiches? Show your answer using two graphs – one for McDonald's fish sandwiches and the other for Wendy's fish sandwiches.
ANSWER: Vegemite market
111. Graphically illustrate how the demand curve for electric vehicles will be affected in each of these cases below.
(a) A major climate change awareness campaign is instituted which teaches consumers about clean energy vehicles.
(b) The price of gas-powered vehicles falls significantly, due to lower costs of production.
(c) Gas prices experience a significant and long-standing increase.
(d) The price of electric vehicles falls due to a fall in the cost of production.
ANSWER: (a)
Bread market
Name:
Chapter 02: Demand: Thinking Like a Buyer
(b)
(c)
(d)
Chapter 02: Demand: Thinking Like a Buyer
112. Consider the demand for strawberry ice-cream. For each of the following scenarios, identify whether the market would experience a change in quantity demanded or a change in demand, and specify the direction of the change.
a. Strawberry orchards are affected by disease, and the supply of strawberries to ice-cream manufacturers falls.
b. The market price of strawberry ice-cream rises.
c. More consumers begin to prefer chocolate ice-cream to strawberry ice-cream.
ANSWER: a. The fall in the supply of strawberries will cause a reduction in the supply of strawberry ice-cream. This will lead to a rise in the price of strawberries and a decrease in the quantity demanded of strawberry ice-cream.
b. The rise in the price of strawberries and a decrease in the quantity demanded of strawberry icecream
c. The demand for strawberry ice-cream will decrease as more consumers choose chocolate icecream instead.
113. Consider the demand for antibiotic-free eggs. For each of the following scenarios, identify whether the market would experience a change in quantity demanded or a change in demand, and specify the direction of the change.
a. A major news article is published, which shows that eating antibiotic-free eggs is much healthier than eating eggs from farms where antibiotics are used.
b. Where there used to be just one producer of antibiotic-free eggs, now several new producers of antibiotic-free eggs also begin to supply eggs to supermarkets in the region. This causes a fall in the price of antibiotic-free eggs.
c. The price of eggs produced using antibiotics falls significantly.
ANSWER: a. An increase in the demand for antibiotic-free eggs.
b. An increase in the quantity demanded of antiobiotic-free eggs.
c. A decrease in demand for antiobiotic-free egg, as some onsumers will now switch back to the eggs produced using antiobiotics (since they are now much cheaper).
114. You are provided with the following table, which shows price and quantity demanded data for soccer game tickets.
Chapter 02: Demand: Thinking Like a Buyer
(a) A major advertising campaign doubles the demand for soccer game tickets. Fill in the table to show the new demand data.
(b) Which way has the demand curve shifted? ANSWER: (a)
(b) Demand has shifted to the right (an increase in demand).
115. You are provided with the following table, which shows price and quantity demanded data for boats.
(a) A credible forecast is then released which indicates that the prices of boats will fall in the near future. At each current price level, this forecast causes a reduction of 25% of the current consumers, as these consumers
Chapter 02: Demand: Thinking Like a Buyer
opt to wait to purchase the boats when the prices have actually fallen. Fill in the table to show what the new demand for boats will be.
(b) Which way has the demand curve shifted? ANSWER: (a)
(b) Demand has shifted to the left (a decrease in demand).
116. (Figure: Graph) Use the graph to answer the following questions.
Here are 5 different options based on the graph above. These 5 options show movements from one point to another on the graph.
(i) Point M to Point N
(ii) Point W to Point V
(iii) Point Q to point T
Chapter 02: Demand: Thinking Like a Buyer
(iv) Point W to point P
(v) Point N to point W
Now answer the following three questions:
(a) Which of the 5 options could be caused by a change in the price of the product?
(b) Which of the 5 options could be caused by a decrease in the price of the product?
(c) Which of the 5 options could be caused by an increase in the expected future price of the product?
ANSWER: (a) Options (i) and (ii)
(b) Options (i) and (ii)
(c) Options (iii) and (v)
117. (Figure: Graph) Use the graph to answer the following questions.
Here are 5 different options based on the graph above. These 5 options show movements from one point to another on the graph.
(i) Point M to Point N
(ii) Point W to Point V
(iii) Point Q to point T
(iv) Point W to point P
(v) Point N to point W
Now answer the following three questions:
(a) Which of the 5 options could be caused by an increased congestion effect?
(b) Which of the 5 options could be caused by an increased network effect?
(c) Which of the 5 options could be caused by decreased consumer preferences for the product?
ANSWER: (a) Option (iv)
(b) Options (iii) and (v)
(c) Option (iv)
118. (Figure: Graph) Use the graph to answer the following questions.
Chapter 02: Demand: Thinking Like a Buyer
(a) What change caused the movement from point V to point W?
(b) What change caused the movement from point T to point W?
(c) If the item is a normal good, in what direction did income change to cause the shift from point P to point W?
(d) If the item is an inferior good, in what direction did income change to cause the shift from point T to point Q?
ANSWER:
(a) An increase in price caused the movement from V to W.
(b) A decrease in price caused the movement from T to W.
(c) An increase in income.
(d) An increase in income
119. (Figure: Graph) Use the graph to answer the following questions.
(a) What change caused the movement from point S to point T?
(b) What change caused the movement from point W to point T?
(c) Fishing rods and fishing reels are complementary goods. In which direction did the price of fishing rods change to cause the shift from point Q to point M in the demand for fishing reels?
(d) Abu Garcia fishing rods and Shimano fishing rods are substitute goods. In which direction did the price of
Chapter 02: Demand: Thinking Like a Buyer
Abu Garcia fishing rods change to cause the shift from point N to point P in the demand for Shimano fishing rods?
ANSWER: (a) A decrease in price caused the movement from S to T.
(b) An increase in price caused the movement from W to T.
(c) There was an increase in the price of fishing rods.
(d) There was an increase in the price of Abu Garcia fishing rods.
120. Fill in the blanks below using the following choices: increases OR decreases.
(a) If the congestion effect of using a highway increases, then the demand curve for that highway __________.
(b) If the network effect of using a social media platform increases, the demand for advertising by businesses on that platform ________.
(c) On heavy smog days in Beijing, the demand for face masks _______.
ANSWER: (a) decreases (b) increases (c) increases
121. Fill in the blanks below using the following choices: increases OR decreases.
(a) When Canadian fans travel to Oracle Arena in California to watch the Toronto Raptors play the Golden State Warriors in the NBA Finals, we observe that the demand for airline tickets __________.
(b) As the Toronto Raptors reach the final rounds of the NBA Finals, the demand for Raptors merchandise
(c) If the demand for hot dogs at basketball games increases, then the price of hot dogs sold at basketball games
ANSWER: (a) increases (b) increases (c) increases
122. Fill in the blanks below using the following choices: increases OR decreases.
(a) As the price of roses increases, the quantity demanded of roses _________.
(b) As the expected price of airline tickets rises, the current demand for airline tickets _________.
(c) As the demand for cruise ship vacations falls, the price of cruise ship tickets _________.
(d) When the tourist season begins in Bali, the price of hotels rooms _________.