Chapter 2
2.1 From Eq. (2.18),
From Eq. (2.6),
2.2 From Eq. (2.13), the dry density
From Eq. (2.18),
Once saturated, from Eq. (2.19),
2.3 Let’s consider a 1-m2 area in plan. The initial volume of this soil is V = 1×0.5 = 0.5 m3. Volume of the solids is Vs
0.2632 m3 Ws = 0.2632×2.68×9.81 = 6.919 kN
The new volume after compaction = 1×0.455 = 0.455 m3 The
From Eq. (2.12), e γ G γ w s d + = 1
From Eq. (2.13), 3kN/m 18.25 = + = 20) 21)(1 (15 γ
2.4 At the compacted road base, the weight of solids, Ws = 120,000×19.5 = 2,340,000 kN
At the borrow pit, the dry unit weight,
Volume of the pit, 3145,080m = = 16.13 340,000 V
The moisture content has to be increased from 8.5% (at the borrow pit) to 14.0% (at the road base). The quantity of water to add, 2,340,000×(0.14‒0.085) = 128,700 kN Volume of water to be added =
Eq. (2.23),
2.6 a. A-1-a c. A-3 b. A-1-b d. A-7-6
2.7 Soil A: % of gravel = 50, % of sand = 13, % of fines = 37 D10 = 0.035 mm, D30 = 0.061 mm, D60 = 9.8 mm Cu = 280; Cc = 0.02 LL = 58, PL = 34, PI = 24 plots below the A-line; hence, silt The soil can be described as poorly(gap)gradedsandysiltygravel withagroupsymbolofGM.
Soil B: % of gravel = 24, % of sand = 69, % of fines = 7
D10 = 0.17 mm, D30 = 0.82 mm, D60 = 2.6 mm Cu = 15.3; Cc = 1.5
LL = 42, PL = 22, PI = 20 plots above the A-line; hence, clay
The soil can be described as wellgradedclayeygravellysandwitha groupsymbolofSW-SM.
Soil C: % of gravel = 1, % of sand = 99, % of fines = 0
D10 = 0.7 mm, D30 = 1.2 mm, D60 = 1.6 mm Cu = 2.3; Cc = 1.3
The soil can be described as poorly(uniformly)gradedsandwitha groupsymbolofSP.
Soil D: % of gravel = 0, % of sand = 12, % of fines = 88
LL = 75, PL = 31, PI = 44 plots above the A-line; hence, clay.
The soil can be described as sandyclayofhighplasticitywithagroup symbolofCH.
2.8 The head loss from the reservoir to the ditch, m 10 28 38 ∆ = = h
The length of the sand seam in the direction of the flow, 203.1m cos10 200 = = L
The hydraulic gradient, 0492 203 10 = = i
By Darcy’s law [Eq. (2.35)],
The cross section of the sand seam through which the flow takes place is 2 1.0500.0500.0 m ×=
The flow rate /s m 10 64 ) m m/s)(500 10 128 .0( 3 5 2 5 × = × =
Volume of water flowing into the ditch per day: 3 m 55.3 = × = /s)(24)(3600) m 10 (64 3 5
2.9 For the flow net shown in Figure P2.9, Nf = 3 and Nd = 10
Total head loss from right to left, hmax = 5.0 m
The flow rate is given by [Eq. (2.46)] /day m97.2 3 = × =
/day) )(24)(3600m )(50 10 (2.25 /s/mlength m
2.10 Ontopofthesoftclaylayer(i.e.,at10mdepth),initially:
Afterthewatertableislowered,
By lowering the water table, the effective stress has increased by (122.3 – 108.7) = 13.6 kN/m2
2.11 Thesoilbelowthewatertablecanbeassumedtobefullysaturated(i.e., S =1).
s wG e
Thesaturatedunitweightcanbecomputedas 3
Atadepthof5mintothesandyclay,
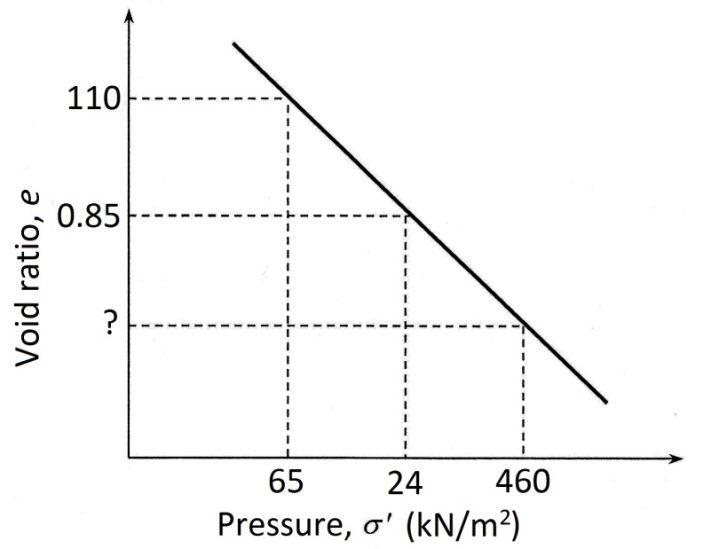
2.12 Refertothefigure. a. Thecompressionindex Cc isgivenby[Eq.(2.53)],

2.13
b. Letthevoidratioat460kN/m2 pressurebe 3e .
a. Theclayisbelowthewatertableand,hence,issaturated.Theinitialvoid ratio eo canbedeterminedas
Thesaturatedunitweightisdeterminedas
Theeffectiveoverburdenstressatthemiddleoftheclayis
Sincethepreconsolidationpressureisgreaterthanthecurrentoverburden pressure,the clay is overconsolidated.Theoverconsolidationratio
b. The2-m-highcompactedfillimposesasurchargeof
Since
theconsolidationsettlementcanbecomputedfromEq. (2.69)as
2.14 For U =75%, Tv =0.477(Table2.12)
2 drH t c T v v =
Fromtwo-way(doublydrained)toone-way(singlydrained), Hdr isdoubled. Forthesame U and,hence,thesame Tv,thiswouldincreasethetimefourfold. Therefore,itwilltake 4t years
2.15
a. Theclaylayerwithone-waydrainagehas Hc of6.0m.Afteroneyear,
FromTable2.12, U =39.6%
When t =2years, Tv =0.246.
FromTable2.12, U =55.8%.
Consolidationsettlementduringthefirsttwoyearsis0.558 × 404= 225.4 mm
b. Theinitialeffectiveoverburdenstressatthemiddleoftheclayis
2.16 a. Fortheclaylayer,assuming S =100%belowthewatertable,
Theinitialeffectiveoverburdenstressatthemiddleoftheclaylayeris
WithOCR=1.5,thepreconsolidationpressure
Whenthefillisplaced,itimposesasurchargeof
FromEq.(2.69),
b. Including the fill load and the warehouse load, 2kN/m70 40 30 = +
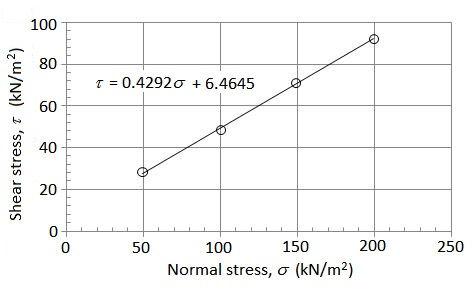
2.17 The direct shear test data are plotted in the figure. From the failure envelope, c′ = 6.5 kN/m2 and ϕ' = tan‒1(0.4292) = 23.2

For normally consolidated clays, c′ = 0; hence,
b. For the second specimen, 3σ ′ = 200 kN/m2
2.19 a. In normally consolidated clay, c′ = 0
For the first specimen (consolidated drained test), using Eq. (2.91),
In the second specimen (consolidated undrained test), applying the same value of φ′ in Eq. (2.91),
2.20 At failure the pore water pressure is
and 100
Substituting for 3
in Eq. (2.91),
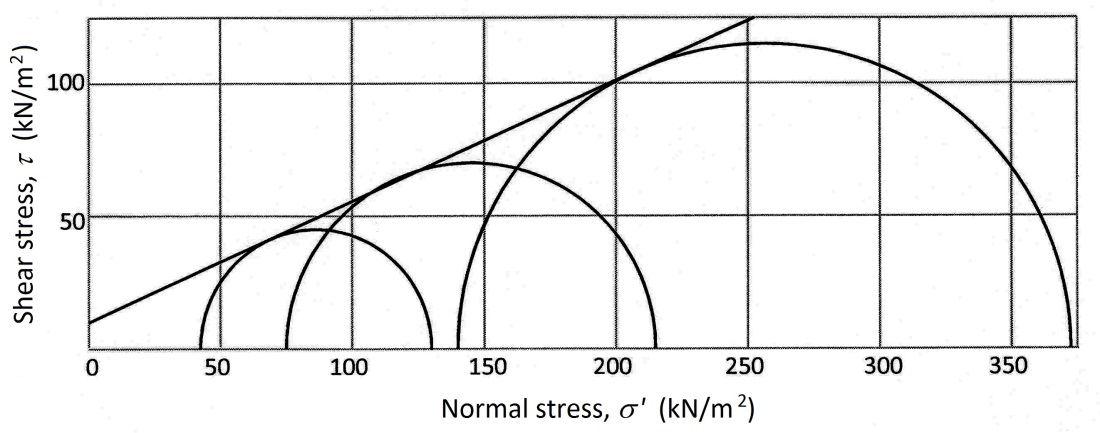
2.21 The following table can be prepared from the given data, and the Mohr circles are plotted as shown in the figure.

The failure envelope is drawn tangent to the Mohr circles in the figure and, from measurements, c′ = 10.0 kN/m2 and ϕ' = 24.7°
2.22 The unconfined compressive strength of the clay specimen
Maximum load the specimen can carry 398N
Therefore, number of plates that can be stacked on the specimen = 358 398 = 54
With qu = 90 kN/m2 (see Table 2.14), it is a medium clay (consistency).
2.23 a. From Figure P2.7, D10 = 0.7 mm, D15 = 0.9 mm, D30 = 1.2 mm, D50 = 1.4 mm, D60 = 1.6 mm, and D85 = 2.05 mm
Eq. (2.87),
b. From Eq. (2.89), 322
From Eq. (2.90), b = 0.845 – 0.398a = 0.845 – 0.398×2.322 = ‒0.0792
From Eq. (2.88),
