
SOLUTIONS
© 2020 Cengage Learning® May not be scanned, copied or duplicated, or posted to a publicly accessible website, in whole or in part, except for use as permitted in a license distributed with a certain product or service or otherwise on a password-protected website or school approved learning management system for classroom use.
CHAPTER 1
WHAT IS ECONOMICS?
DISCUSSION QUESTIONS
1. Think about a way you would construct a model of how your college is governed. Which officers and administrators would you include and exclude from your model if the objective were one of the following:
a.To explain how decisions on financial aid are made
b.To explain the quality of the faculty
Relate this to the map example in the chapter.
This question is designed to make students construct their own version of the map example. A good answer is one in which (i) the people who are principally involved in the decision are identified, (ii) the flow of information and persuasion between those people is outlined and (iii) extraneous detail is eliminated. The “model” is likely to be quite different for part (a) and part (b). Thus decisions on financial aid may depend upon the trustees, who set overall policy and attempt to raise funds; the president, who allocates the college budget; the admissions office, which determines what portion of each class is financially needy; and the counselors in the financial aid office, who make decisions about individual cases. Information about policy flows from the top of the bureaucratic hierarchy, and information about need from the bottom. In part (b), faculty quality may be determined by the trustees, who may be responsible for setting salary levels; the president or dean, who must agree to each faculty appointment and promotion; and the faculty committees in each department and division, that search for potential appointees. Instructors who assign this question may be amazed at the image of their institution’s structure held by the students.
2. Relate the process of abstraction to the way you take notes in a lecture. Why do you not try to transcribe every word uttered by the lecturer? Why don’t you write down just the title of the lecture and stop there? How do you decide, roughly speaking, on the correct amount of detail?
Most students are familiar with the need to abstract from detail, and take notes only about the essential points. The student will want enough detail to be able to reconstruct the instructor’s argument, but not so much detail as to obscure the main point. It is unlikely that simply writing down the title of the lecture will enable the student to recall the main arguments at a later date. The choices of how much detail, and what particular detail, are similar to the choices an economist makes in thinking about a problem, that is to say, in constructing a model. [This is a good opportunity to discuss note-taking with the students. While most understand the basic idea, few are skilled at it. Take a look at a few students’ lecture notes, and ask whether you would be comfortable learning economics from those notes.]
3. Explain why a government policy maker cannot afford to ignore economic theory. Without theory, an economist (or anyone else) can only assemble facts, but she cannot understand the relationship between those facts, in particular the cause-and-effect relationships. For example, a person who ignores theory can notice that average prices sometimes rise a short time after the country’s money supply increases, but has no way of knowing whether there is a causal relationship between those two phenomena, or whether they are just coincidences. A government policy maker who wants to change something in the country only has a few policy “tools” to use, and so she must have a theory to indicate to her whether changing one of those tools is likely to have the desired result in the country.
APPENDIX—USING GRAPHS: A REVIEW
TEST YOURSELF
1. Portray the following hypothetical data on a two variable diagram:
Academic Year Total Enrollment Enrollment in Economics Courses
Measure the slope of the resulting line, and explain what this number means
Slope is 100 interpreted as 100 new students each academic year.
© 2020 Cengage Learning® May not be scanned, copied or duplicated, or posted to a publicly accessible website, in whole or in part, except for use as permitted in a license distributed with a certain product or service or otherwise on a password-protected website or school approved learning management system for classroom use.
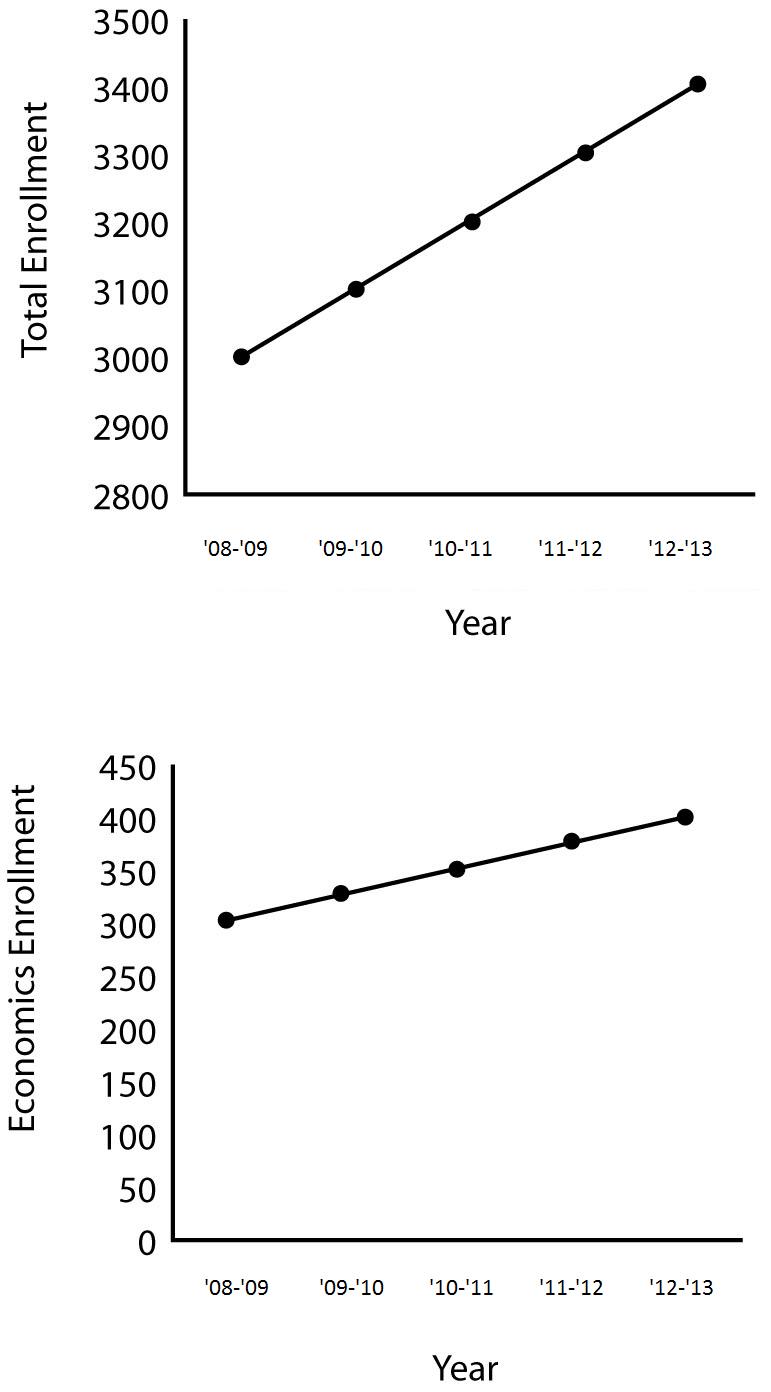
Slope is 25 interpreted as 25 new economics students each academic year.
© 2020 Cengage Learning® May not be scanned, copied or duplicated, or posted to a publicly accessible website, in whole or in part, except for use as permitted in a license distributed with a certain product or service or otherwise on a password-protected website or school approved learning management system for classroom use.
2. From Figure 5, calculate the slope of the curve at point M. Slope is 0.
3. Arthur believes that the number of job offers he will get depends on the number of courses in which his grade is B+ or better. He concludes from observation that the following figures are typical: Number of grades of B+ or better
Put these numbers into a graph like Figure 1(a). Measure and interpret the slopes between adjacent dots.
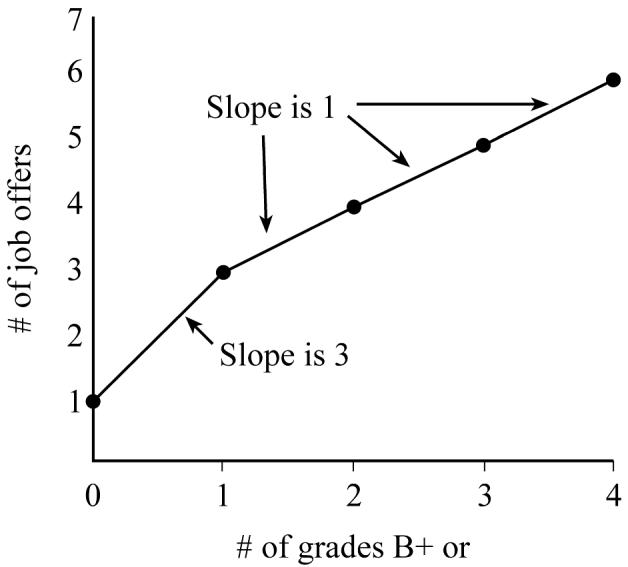
A marginal increase in the number of job offers is relatively larger with the first good grade compared to additional good grades.
4. In Figure 6, determine the values of X and Y at point K and at point E . What do you conclude about the slopes of the lines on which K and E are located?
K = (2,2); E = (2,1)
The slope of 1 for the line on which K is located indicates that this is the steeper of the two curves. On this curve, the variable on the vertical axis responds more significantly to a change in the variable on the horizontal axis.
5. In Figure 8, interpret the economic meaning of points A and B. What do the two points have in common? What is the difference in their economic interpretation?
© 2020 Cengage Learning® May not be scanned, copied or duplicated, or posted to a publicly accessible website, in whole or in part, except for use as permitted in a license distributed with a certain product or service or otherwise on a password-protected website or school approved learning management system for classroom use.
A => 30 hours labor and 40 yds. cloth = 20 units of output.
B => 40 hours labor and 28 yds. cloth = 20 units of output.
Common: 20 units of output; Difference: Amount of labor and cloth change more labor, less cloth.
© 2020 Cengage Learning® May not be scanned, copied or duplicated, or posted to a publicly accessible website, in whole or in part, except for use as permitted in a license distributed with a certain product or service or otherwise on a password-protected website or school approved learning management system for classroom use.