Section 1.1 1. () ? ? 21040 210104010 230 230 22 15 Check: 21510104010 30030 3030 x x
2.57.57.532.57.5 2.525
6. 3.48.215.6 3.48.28.215.68.2 3.423.8 3.423.8 3.43.4 7 x x x x x −= −+=+ = = = 7. 205.20.8 200.85.20.80.8 20.85.2 20.85.2 5.25.2 4 4 x x x x x x =− +=−+ = = = = 8. 453.6189 451893.6189189 1443.6 1443.6 3.63.6 40 40 c c c c c c
0.0315108
0.03151510815
After 1 hour of training, a new employee can produce 30 candies per hour. b. () 10420 402060 C C =+ =+=
After 4 hours of training, a new employee can produce 60 candies per hour.
c. Let150 1501020 15020102020 13010 13010 1010 13
A new employee can produce 150 candies per hour after 13 hours of training.
12. 17600Ew=−+ a. 17(0)600600 E =−+=
The total enrollment in math classes at the college was 600 at the beginning of the fall semester. b.
Let430 43017600 43060017600600 17017 17017 1717 10 E w w w w w =
The total enrollment will be 430 ten weeks after the start of the fall semester. c. 17600 17(8)600 464 Ew E E =−+ =−+ =
After 8 weeks, enrollment in math classes at the college will be 464. 13 7.8933.73Pq=+ a.
() 7.89833.73 63.1233.73 96.85 P P P =+ =+
In March 2017, there were approximately 96.85 million Amazon Prime members in the United States. b.
() 7.8933.73 7.892033.73 157.833.73 191.53 Pq P P P =+ =+ =+ =
In March 2020, there will be approximately 191.53 million Amazon Prime members in the United States. This may be too many to make sense.
c. Let 133. P = 1337.8933.73
13333.737.8933.7333.73
99.277.89
q q
In about May 2018 (about 12.6 quarters after March 2015) the number of Amazon Prime members will reach about 133 million.
14. 2.3990.03 pw =+ a. ()2.3990.035 2.3990.15 2.549 p p p =+
Five weeks after the start of summer, the gas price is $2.549 per gallon.
b. Let 2.759
2.7592.3990.03
2.7592.3992.3992.3990.03
0.3600.03
Twelve weeks after the start of summer, the gas price is $2.759 per gallon.
15. 1.5300Pt=− a. () 1.5100300 150300 150 P P P =−
If you sell 100 printed T-shirts, you will lose $150.
If you sell 400 printed T-shirts, you will make $300 profit.
c.
Let 1000 10001.5300 10003001.5300300 13001.5 13001.5 1.51.5 866.67
To make $1000 profit, you must sell 867 printed Tshirts.
16. 5.5500.50Pb=− a.
5.5(75)500.50 412.50500.50 $88.00 P P P
There is a loss of $88 dollars for selling only 75 books.
b.
5.5()500.50 5.5(200)500.50 1100500.50 $599.50 Pb
There is a $599.50 profit for selling 200 books.
c.
Let3600
5.5500.50
36005.5500.50
3600500.505.5500.50500.50
4100.55.5
4100.55.5 5.55.5
745.545
To make $3600 in profit, you must sell 746 books.
It costs $52.50 to take a 25-mile taxi ride in NYC.
20.
a. 20 R = . A $20 revenue for a two-day event seems too small.
b 3000 R =− . Revenue must be 0 ≥ so this is not possible.
c $4500 R = . This answer is most reasonable.
21
a. 50 T =− . This answer is most reasonable and would mean that the temperature at the South Pole is 50 degrees Fahrenheit.
b 75 T = . This temperature is too warm for South Pole temperatures.
For $100, you can take about a 48-mile taxi ride in NYC. 18.
After 150 seconds, the pressure in the vacuum chamber will be 24.5 psi. b. 350.07 1350.07 13535350.07
The pressure in the vacuum chamber will be 1 psi after about 486 seconds. 19.
a. 3.5 P = . This too few people. This would mean that only 3500 people live in Kentucky.
b. 4200 P = . This answer is most reasonable. This would mean that 4,200,000 people live in Kentucky.
c. 210 P =− . This not possible. This would mean that 210,000 people live in Kentucky.
c. 82 T = . This temperature is too warm for South Pole temperatures.
22.
a. 10.50 S = . This answer is too small to represent a cook’s monthly salary.
b 1600 S = . This answer is most reasonable for a cook’s monthly salary.
c. 28,000 S = . This answer is too large to represent a cook’s monthly salary.
23. () 0.081000Ps=−
a.
() () 0.0820001000 0.08100080 P P =− ==
On sales of $2000, you will make $80 in commissions.
b.
() () 0.0850,0001000 0.0849,000 3920 P P P =− = =
On sales of $50,000, you will make $3920 in commissions.
c.
c.
() 0.081000
5000.0880
500800.088080
5800.08
5800.08 0.080.08
7250 Ps s s s s s =− =− +=−+ = = =
To make $500 per week, you will need $7250 in sales each week.
24. ()0.06500Ps=−
a.
() 0.062000500 0.06(1500)90 P P =− ==
On $2000 in sales, you will make $90 in commissions.
b.
() 0.065000500 0.06(4500)270 P P =− == On $5000 in sales, you will make $270 in commissions.
c.
29.950.55
10029.950.55
10029.9529.9529.950.55
70.050.55
70.050.55
For a total of $100, you can rent the 10-foot truck from Budget and drive it 127 miles. 26.
a. 59.9929.99 Cm =+ b. Let 24. m = ()59.9929.9924 59.99719.76 779.75
The total cost of this membership for the first 2 years is $779.75. c.
4500.06s500
() () 0.06500
4500.06s30
450+300.06s3030
4800.06
4800.06
0.060.06 8000 Ps s s s =−
If you need at least $450 per week to pay your bills, you must make $8000 in sales. 25.
a. 29.950.55 Bm =+ b.
()29.950.5575 29.9541.25 71.20 B B B =+ =+ =
If you drive the 10-foot truck 75 miles, it will cost you $71.20.
Let 1000. C = 100059.9929.99 100059.9959.9929.9959.99 940.0129.99
$1000 will purchase 34 months of membership at this club.
27
a. 2500.07 Ps =+ b. () Let 2000 2500.072000 250140390 s P P =
If you have sales of $2000 in a week, your pay will be $390.
c. Let 650
6502500.07
650-2502502500.07
4000.07
4000.07
0.070.07
5714.29
To earn $650 per week, you must have $5714.29 in sales each week.
28
a. 3000.05 Ps =+
Your paycheck will be $500 if you have $4000 in sales.
c. Let 750 7503000.05
7503003003000.05
4500.05s
4500.05
0.050.05 $9000 P s s s s = =+ +−=+−+
For a paycheck of $750, the weekly sales would be $9000.
29 . Let C be the total cost (in dollars) of a trip to Las Vegas, and let d be the number of days you stay.
225150
A three-day trip to Las Vegas will cost $675. c. $1200 $600 2 225150 600225150 600225225225150 375150 375150 150150 2.5 Cd d d d d d
If you have $1200 and gamble half of it, you can stay in Las Vegas for only 2 days.
30. Let C be the total cost (in dollars) for a trip to Orlando, Florida, for a family of four, and let d be the number of days you stay.
a 1600900 Cd =+
b. ()16009005 16004500 6100 C C C =+
A five-day trip to Orlando, Florida, will cost a family of four $6100.
c. 1600900 75001600900 7500160016001600900 5900900 5900900 900900 6.56 Cd d d d d d
For $7500 a family of four can take a trip to Orlando, Florida, for six days.
31. Let C be the total cost (in dollars) for shooting a wedding, and let p be the number of proofs edited and printed.
a 5.29800Cp=+
b.
() 5.29100800 529800 1329 C C C =+ =+ =
If the photographer edits and prints 100 proofs, the cost will be $1329.
c.
Let 1750. C = 17505.29800 17508005.29800800 9505.29 9505.29 5.295.29 179.58 p p p p p
With a budget of $1750, the photographer can edit and print 179 proofs.
32. Let R be the total amount a photographer charges her clients for editing and printing p proofs.
a 7.50600Rp=+
b.
() 7.50100600 750600 1350 R R R =+ =+ =
The photographer will charge her client $1350 to edit and print 100 proofs.
c. Let P be the profit (in dollars) from editing and printing p proofs.
()() 7.506005.29800 7.506005.29800 2.21200 PRC Ppp Ppp
d.
() 2.21100200 221200 21 P P P
The photographer makes a $21 profit from editing and printing 100 proofs from the wedding shoot.
e. Let 0. P = 2.212000 2.21200 2.21200 2.212.21 90.50 p p p p −= = = ≈
The photographer must edit and print 91 proofs to break even.
33.
a. Let C be the total cost (in dollars) for selling s snow cones for a month. Fixed costs are: 200011503150. 31500.36 Cs +=
b.
()31500.363000 4230 C C =+ = The monthly cost for selling 3000 snow cones is $4230.
c. 440031500.36 44003150315031500.36 12500.36 12500.36 0.360.36 3472.22 s s s s
For a $4400 budget, the vendor can sell up to 3472 snow cones.
34.
a. Let R be the monthly revenue (in dollars) for selling s snow cones for a month. 2.50 Rs =
b () 2.5030007500 R == . The total monthly revenue from selling 3000 snow cones is $7500.
c. Let P be the profit (in dollars) from selling s snow cones.
()2.5031500.36 2.5031500.36 2.143150
() 2.1445003150 96303150 6480 P P P =− =− =
The vendor makes a $6480 profit from selling 4500 snow cones.
e.
31502.14 2.142.14 1471.96 s s s s s
02.143150
31502.1431503150
31502.14
The vendor must sell 1472 snow cones to break even.
35.
a. Let C be the total cost (in dollars) for the Squeaky Clean Window Company to clean windows for a day, when w windows are cleaned. 1.50530Cw=+
b.
() 1.5060530 90530 620 C C C =+ =+ =
If the Squeaky Clean Window Company cleans 60 windows in a day, it will cost the company $620.
c.
b. () 95050 45050 500 R R R =+ =+ =
The Squeaky Clean Window Company will charge a business $500 to clean 50 windows.
c. Let P be the profit for the Squeaky Clean Window Company to clean windows when w windows are cleaned.
()() 9501.50530
d. () 7.5080480 600480 120 P P P =− =− =
The Squeaky Clean Window Company makes a $120 profit by washing 80 windows. e.
07.50480 04807.50480480 4807.50 4807.50 7.507.50 64 w w w w w =−
They must clean at least 64 windows to break even.
8001.50530
8005301.50530530
2701.50
2701.50 1.501.50 180 w w w w w
To stay within a budget of $800, the Squeaky Clean Window Company can clean up to 180 windows.
36. a. Let R be the monthly revenue (in dollars) for the Squeaky Clean Window Company to clean windows for a day when w windows are cleaned. 950Rw=+
37. Maria’s work is correct. Javier needs a decimal to correctly represent 55 cents per bottle in terms of dollars per bottle.
38. Rosemary’s work is correct. Will needs to use parentheses so that so that the entire cost is subtracted.
39. a. Let C be the total cost (in dollars) for pest management from Enviro-Safe Pest Management when m monthly treatments are done.
15038 Cm =+
b. There are 18 months in 1.5 years. ()1503818 150684 834 C C C =+ =+ =
If your house is treated for 1.5 years (18 months) after the initial treatment, it will cost $834. 40.
a. () 20133
2.763309.37
The population of the United States was approximately 317.65 million in 2013.
b.
3262.76309.37
326309.372.76309.37309.37
16.632.76
16.632.76 2.762.76 6.03
In about 2016, the population of the United States was approximately 326 million.
c.
3752.76309.37
375309.372.76309.37309.37
65.632.76
65.632.76 2.762.76 23.78
By late 2033, the population of the United States will have reached 375 million.
41. a. Let C be the total monthly cost (in dollars) for a manufacturer to produce g sets of golf clubs. 23250145 Cg =+
b. ()23250145100 2325014500 37750 C C C =+ =+ =
It costs the manufacturer $37,750 to produce 100 sets of golf clubs.
c.
20000232502325023250145 3250145 3250145 145145 22.41 g g g g
This is model breakdown. Their costs can never be lower than their fixed costs of $23,250.
d.
$37,750 $377.50 per set 100 sets =
To break even selling 100 sets of golf clubs per month, the manufacturer must sell each set for $377.50.
42. a 1505 Ct =+ for 100. t ≥ b.
()1505300 1501500 1650
It costs $1650 to make 300 T-shirts.
c. 15001505 15001501501505 13505 13505 55 270 t t t t
The camp can have 270 T-shirts made for $1500.
d.
$1650 $5.50 per T-shirt 300 T-shirts =
To break even selling 300 T-shirts, the camp should sell each for $5.50.
43.
a 15001.50 Cn =+ for 500. n ≤ b. ()15001.50250 1500375 1875
It costs Rockon $1875 to make 250 EPs.
c.
200015001.50
20001500150015001.50
With a budget of $2000, Rockon can order 333 EPs. d.
300015001.50
30001500150015001.50
With a budget of $3000, Rockon can order 1000 EPs.
This is model breakdown. They can only order up to 500 EPs.
44 350Pt=−+
a. ()
Five years in operation: 0. One year in operation: 4. 3450 125062 t t P P = =− =−−+ =+=
After one year in operation, 62% of companies are still in business.
b.
Five years in operation: 0. 25 years in operation: 20. 32050 605010 t t P P = =
After 25 years, –10% of companies are still in business. This is model break down.
a. If Budget doubled the cost per mile, it would change the 0.55 m to 1.10 m , which would make the cost grow faster with every mile driven.
b 29.95 + 0.55(75) = 71.20, and 29.95 + 1.10(75) = $112.45.
The cost for 75 miles would not double because the day charge of $29.95 did not change. The cost for 75 miles would increase from $71.20 to $112.45.
46.
a. If the membership plan doubled the cost per month, it would change the 29.99m to 59.98m, which would make the cost grow faster with every month.
b. 2 years = 24 months
59.99 + 29.99(24) = 779.75, and 59.99 + 59.98(24) = 1499.51. Note that 779.75(2) = 1559.50.
The cost for 2 years would not quite double because the initiation fee of $59.99 did not change. The cost for 2 years would increase from $779.75 to $1499.51.
47.
a. If the salesperson got a raise, increasing the guaranteed pay per week $100, the constant 250 would change to 350. We’d have P= 350 + 0.07s
b. The raise in the commission rate would change the 0.07s to 0.08s. We’d have P= 250 + 0.08s.
c 250 + 0.07(7000) = 740, 350 + 0.07(7000) = 840, and 250 + 0.08(7000) = 810.
If a salesperson makes an average of $7000 in sales per week, the $100 increase would be better for the salesperson. The commission-rate change would increase the salary only $70 per week.
d. 250 + 0.07(4000) = 530, 350 + 0.07(4000) = 630, and 250 + 0.08(4000) = 570.
If the salesperson makes an average of $4000 in sales per week, the commission-rate increase would be better for the business. The commission-rate increase would cost them on average only $40 per week.
After 10 years, only 35% of companies are still in business.
e.
3500.072500.08
1000.01
1000.01 0.010.01
10000 ss s s s +=+ = = =
For the two raises to result in the same weekly pay, the salesperson would have to average $10,000 in sales per week.
48.
a. If the salesperson got a raise, increasing the guaranteed pay per week $150, the constant 300 would change to 450. We’d have P= 450 + 0.05s.
b. The raise in the commission rate would change the 0.05s to 0.06s. We’d have P= 300 + 0.06s
c. 300 + 0.05 (20000) = 1300, 450 + 0.05(20000) = 1450, and 300 + 0.06(20000) = 1500.
If a salesperson makes an average of $20,000 in sales per week, the commission-rate increase would be better for the salesperson. The commission-rate increase would increase the salary $200 per week.
d. 300 + 0.05 (11000) = 850, 450 + 0.05(11000) = 1000, and 300 + 0.06(11000) = 960.
If the salesperson makes an average of $11,000 in sales per week, the commission-rate increase would be better for the business. The commission-rate increase would cost them on average only $110 per week.
e.
4500.053000.06
1500.01
1500.01
0.010.01
15000 ss s s s +=+ = = =
$15,000 in sales per week would make these raises result in the same weekly pay.
49.
a.
800 + 0.50(800) = 800 + 400 = 1200
If the salaries paid by the photographer increase 50%, the 800 in the cost equation would increase to 1200, and we’d have C = 5.29p + 1200.
b.
PRC Ppp Ppp Pp =− =+−+ =+−− =−
()() 7.506005.291200
7.506005.291200
2.21600
The new profit minus the old profit is ()() 2.216002.21200
400. =−−+ =− pp pp
2.216002.21200
This increase in salaries would decrease the profit for the photographer by $400.
c.
$400 $4 100 =
If the photographer wants to cover the increase in salaries, she would have to increase the charge per proof from $5.29 to $9.29.
50.
a. Assuming that both utilities and kiosk-rental costs increase by 20%, the $1150 increases to $1150 + $1150(0.20) = $1380.
C = 3380 + 0.36s b.
()2.5033800.36 2.5033800.36 2.143380 PRC Pss Pss Ps =−
The new profit minus the old profit is ()() 2.1433802.143150 2.1433802.143150 230. =−−+ =− ss ss
The increase in costs will reduce the snow cone vendor’s profits by $230.
c.
$230 6000 0.038 ≈
To cover the $230 increase in costs, the vendor should increase the charge per snow cone by $0.04, or 4 cents.
51.
Step 1 Reason: Combine the variable terms together on one side of the equation using the subtraction property of equality.
Step 2 Algebraic Step: 51015 101 5 0 x x = +=
Step 3 Reason: Solve for the variable using the division property of equality.
Step 4 Algebraic Step: 5 x =
52.
Step 1 Algebraic Step: 47 8 7 9 9 8 8 xx xx −+=−− +++=−
Step 2 Reason: Isolate the variable term by using the subtraction property of equality.
Step 3 Algebraic Step: 416 44 x =
Step 4 Reason: The solution 53.
Step 1 Reason: Simplify the left side of the equation using the distributive property.
Step 2 Algebraic Step: 23312 xx−=−+
Step 3 Reason: Combine the variable terms together on one side of the equation using the addition property of equality.
Step 4 Algebraic Step: 5 5312 33 x x + = = +
Step 5 Algebraic Step: 515 55 x =
Step 6 Reason: The solution 54.
Step 1 Algebraic Step: 61423 xx+=−−−
Step 2 Reason: Combine like terms on each side of the equation.
Step 3 Algebraic Step: 6145 4 1 4 xx xx +=−− = ++ +
Step 4 Reason: Isolate the variable term by using the subtraction property of equality.
Step 5 Algebraic Step: 106 1010 x =
Step 6 Reason: The solution
55. Algebraic Step to Solve the Equation Reason for Each Step
560290 xx+=+ This is the given equation.
56022902 xxxx +−=+−
36090 x += Combine the variable terms together on one side of the equation using the subtraction property of equality.
360609060 x +−=−
330 x = Isolate the variable term by using the subtraction property of equality.
330 33 x = Solve for the variable using the division property of equality.
10 x = The solution ()() ? ? 5106021090
50602090 110110 +=+ +=+ = Check the answer.
56 . Algebraic Step to Solve the Equation
Reason for Each Step
62095 xx+=+ This is the given equation.
6209959 xxxx +−=+−
3205 x −+=
32020520 x −+−=−
315 x −=−
Combine the variable terms together on one side of the equation using the subtraction property of equality.
Isolate the variable term by using the subtraction property of equality.
315 33 x = Solve for the variable using the division property of equality.
5 x = The solution
()() ? ? 6520955 3020455 5050 +=+ +=+ = Check the answer.
57. Algebraic Step to Solve the Equation Reason for Each Step
2 614 5 d += This is the given equation.
2 66146 5 d +−=−
2 8 5 d =
() 525 8 252 d ⎛⎞ = ⎜⎟ ⎝⎠
Isolate the variable term by using the subtraction property of equality.
Solve for the variable using the multiplication property of equality.
20 d = The solution
() ? ? 2 20614 5 8614 1414 += += = Check the answer.
58 . Algebraic Step to Solve the Equation Reason for Each Step 3 1720 4 x −= This is the given equation.
3 17172017 4 x −+=+ 3 37 4 x =
() 434 37 343 x ⎛⎞ = ⎜⎟ ⎝⎠
Isolate the variable term by using the addition property of equality.
Solve for the variable using the multiplication property of equality.
148 3 x = The solution ? ? 3148 1720 43 371720 2020 ⎛⎞ −= ⎜⎟ ⎝⎠ −= = Check the answer.
59. Algebraic Step to Solve the Equation Reason for Each Step 14 4 33 m += This is the given equation. () 14 334 33 m ⎛⎞+=⎜⎟ ⎝⎠
Multiply both sides by the LCD, 3, to get eliminate the fraction.
412 m +=
44124 m +−=− Isolate the variable term by using the subtraction property of equality.
8 m = The solution () ? ? 14 84 33 84 4 33 44 += += = Check the answer.
60 . Algebraic Step to Solve the Equation Reason for Each Step 13 5 22 x += This is the given equation. () 13 225 22 x ⎛⎞+=⎜⎟ ⎝⎠
Multiply both sides by the LCD, 2, to get eliminate the fraction.
310 x +=
33103 x +−=− Isolate the variable term by using the subtraction property of equality.
7 x = The solution () ? ? 13 75 22 73 5 22 55 += += = Check the answer.
61. Algebraic Step to Solve the Equation
Reason for Each Step
36148 xx−−=+ This is the given equation.
3681488 xxxx−−−=+−
11614 x −−= Combine the variable terms together on one side of the equation using the subtraction property of equality.
1166146 x −−+=+
1120 x −= Isolate the variable term by using the addition property of equality.
1120 1111 x = Solve for the variable using the division property of equality.
−=− −=− −=− Check the answer.
20 11 x =− The solution ? ? ? 2020 36148 1111 60160 614 1111 6066154160 11111111 66 1111 ⎛⎞⎛⎞ −−−=+−
62 . Algebraic Step to Solve the Equation Reason for Each Step
59182 rr−=+ This is the given equation.
591818218 rrrr −−=+−
1392 r −−=
Combine the variable terms together on one side of the equation using the subtraction property of equality.
139929 r −−+=+
1311 r −= Isolate the variable term by using the addition property of equality.
1311 1313 r = Solve for the variable using the division property of equality.
11 13 r =− The solution
? ? ? 1111 59182 1313 55198 92 1313 5511719826 13131313 172172 1313 ⎛⎞⎛⎞ −−=−+ ⎜⎟⎜⎟ ⎝⎠⎝⎠
Check the answer.
63. Algebraic Step to Solve the Equation Reason for Each Step 534 4 7107 dd−=+ This is the given equation. 534 70704 7107 dd ⎛⎞⎛⎞ −=+ ⎜⎟⎜⎟ ⎝⎠⎝⎠
502140280 dd−=+
5021404028040 dddd −−=+−
1021280 d −=
Multiply both sides by the LCD, 70, to get eliminate the fraction.
Combine the variable terms together on one side of the equation using the subtraction property of equality.
10212128021 d −+=+
10301 d = Isolate the variable term by using the addition property of equality.
10301 1010 d = Solve for the variable using the division property of equality.
301 10 d = The solution
? ? ? ? 530134301 4 71010710 43386 4 2105 21538620 101055 212106 105 106106 55 ⎛⎞⎛⎞ −=+⎜⎟⎜⎟ ⎝⎠⎝⎠ −=+ −=+ = =
Check the answer.
64. Algebraic Step to Solve the Equation Reason for Each Step
345 7 898pp−=+
345 72727 898pp ⎛⎞⎛⎞ −=+ ⎜⎟⎜⎟ ⎝⎠⎝⎠
273245504 pp−=+
2732454550445 pppp −−=+−
1832504 p −−=
18323250432 p −−+=+
18536 p −=
This is the given equation.
Multiply both sides by the LCD, 72, to get eliminate the fraction.
Combine the variable terms together on one side of the equation using the subtraction property of equality.
Isolate the variable term by using the addition property of equality.
18536 1818 p = Solve for the variable using the division property of equality.
268 9 p =− The solution ? ? ? 326845268 7 89989 674335 7 6918 2018335126 18181818 209209 1818
65. ()
1.253.42.354 1.253.411.59.2
1.253.411.511.59.211.5
12.753.49.2
12.753.43.49.23.4
12.755.8
12.755.8
12.7512.75 0.45
Check:
1.250.453.42.350.454
()()() ? ?
0.56253.42.32. dd dd dddd d d d d d −=−+ −=−− −+=−−+
Check the answer.
−−=−−() () ? 254
3.96252.31.75 3.96254.025 + −=−
66. ()
3.74.61.868
3.74.610.814.4
3.74.610.810.814.410.8 14.54.614.4
14.54.64.614.44.6
14.59.8
14.59.8 14.514.5 0.68
Check:
3.70.684.61.860.688
7. mm mm mmmm m m m m m −=−+ −=−− −+=−−+ −=−
−−=−−+ () ? 1161.83.92 7.1167.056 =− −≈−
2.5164.61.84.088
67. () 3521107 31521107 36107 3661076 3113 3113 33 113 3 +−= +−= −= −+=+ = = = c c c c c c c
57261456 57122856 571228 5712122812 7728 777287 721 721 77 3 Check: 5372631456 1572181456 823256 86456 88 kk kk
Checktheanswersforexercises69-76inasimilar manner. 69.
1.75.729.75
1.75.7529.755
3.33.3 7.27 dd dddd d d d d d
3.35.729.7
3.35.75.729.75.7 3.324 3.324
2.13.47.29.4
2.13.49.47.29.49.4
11.53.47.2
11.53.43.47.23.4
11.53.8
11.53.8
11.511.5 0.33 mm mmmm m m m m m +=− ++=−+ += +−=− = = ≈
71. () () 34 2539 77 6151236 7777 6151236 77 7777 6151236 61512123612 181536 1815153615 1851 1851 1818 51 18 17 6 zz zz zz zz zzzz z z z z z z
−=−+
−=−+
−=−+
−=−+ −+=−++ −= −+=+ = = = = 72 . () () 23 3846 55 6161218 5555 6161218 55 5555 6161218 61612121812 181618 1816161816 1834 1834 1818 34 18 17 9 rr rr rr rr rrrr r r r r r r
−=−+
−=−+ ⎛⎞⎛⎞ −=−+ ⎜⎟⎜⎟ ⎝⎠⎝⎠
−=−+
−+=−++ −= −+=+ = = = =
73.
()()() 3293374628 62792141248 1561648 15616164816 31648 3166486 3142 3142 3131 42 31 vvvv vvvv vv vvvv v
74.
()()() 42764812349 8282448121227 16762427 167624242724 407627 4076762776 40103 40103 4040 103 40 xxxx xxxx xx xxxx x x x x x +−−=+− +−+=+−
75. () 82 3512 93 24402 12 993 24402 9912 993 24406108 2440661086 3040108 30404010840 3068 3068 3030 68 30 34 15 tt tt tt tt tttt t t t
76. () 23 4215 728 843 15 7728 843 282815 7728 32163420 3216334203 3516420 35161642016 35404 35404 3535 404 35 xx xx xx xx xxxx x x x x x
Fma Fma mm F a m = = = 78. Wmg Wmg gg W m g = = = 79. JFt JFt tt J F t = = = 80. 10 10 1010 10 Ph Ph P h = = =
95. Yes, rounding the outside temperature to 73 degrees Fahrenheit is appropriate because a difference of 0.4-degree Fahrenheit would not be noticed.
96. No, a body temperature of 100.3 degrees Fahrenheit would not be rounded to the nearest whole degree. A 0.3-degree Fahrenheit difference in body temperature could be critical.
97. A result of $236.5725 would be rounded to $236.57 because our monetary units extend to hundredth place value.
98. The correct rounding of 2200.8 pens would be 2200 pens. If the budget is limited to $500, rounding up would result in going over budget.
99. The number of cars that the company would need to wash should be rounded to 313 (312.25 rounded up). To make the profit of $400, the company needs to wash just slightly more than 312 cars. Therefore, the next possible whole number greater than that is 313. Anything less would result in a profit of less than $400.
100. Your example. Refer to problems 98 and 99.
Section 1.2
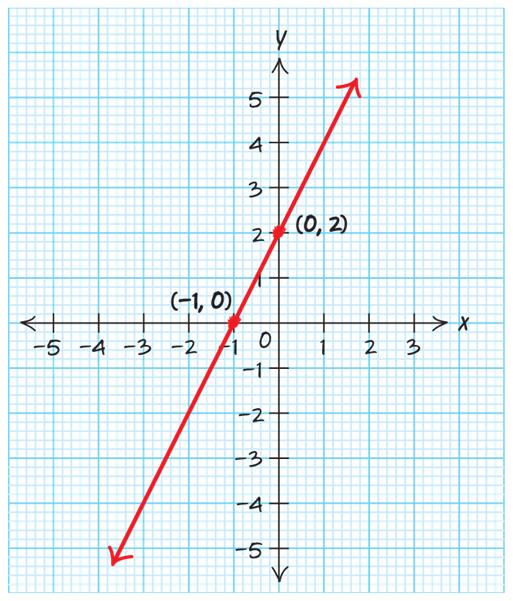
Use two points:0,1&2,0 01 1 Slope 202 ==
()() ()
b. Increasing
c. Vertical intercept: () 0,1
2.
a.
Use two points:3,0&0,2 202 Slope 033 ==
()() ()
b. Increasing
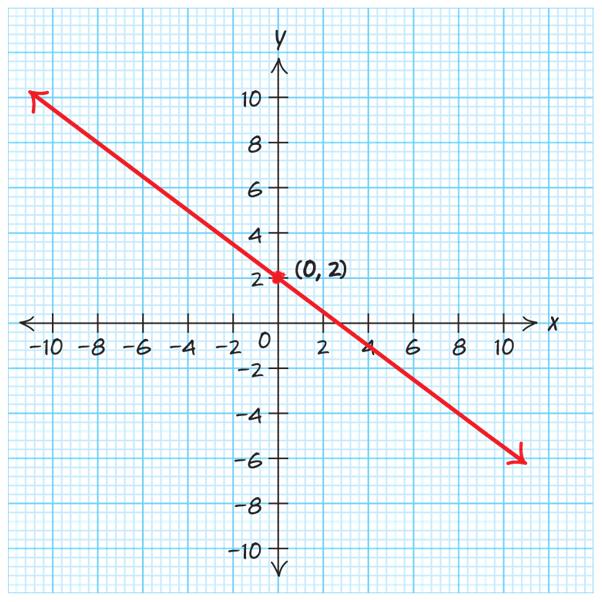
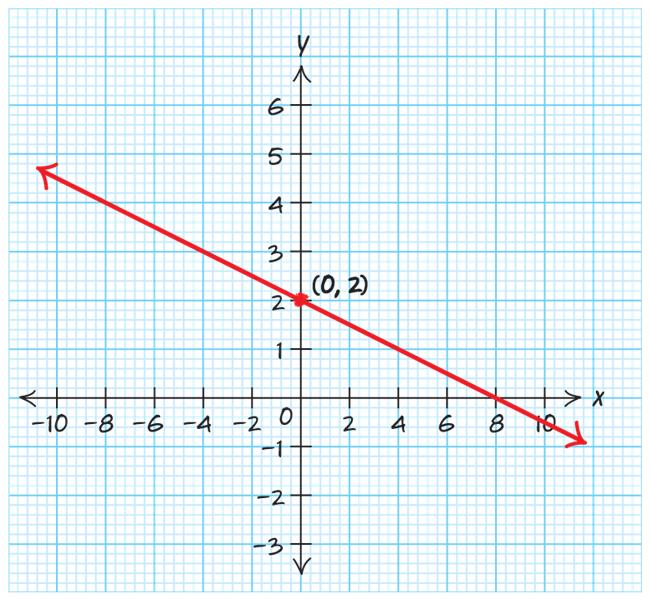
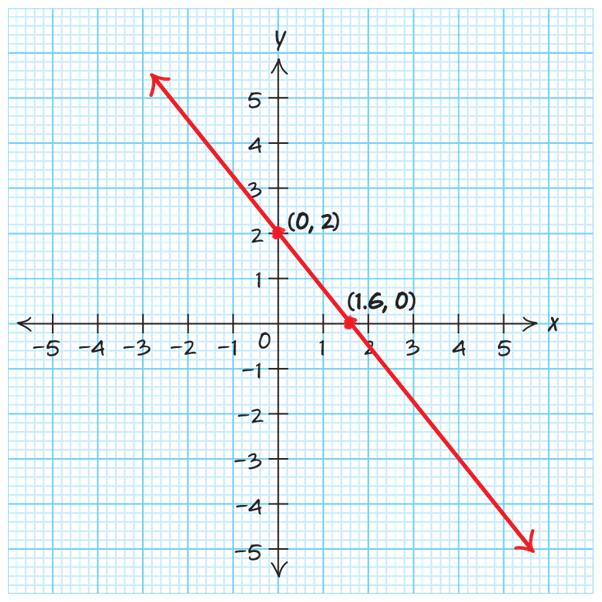
c. Vertical intercept: (0,2)
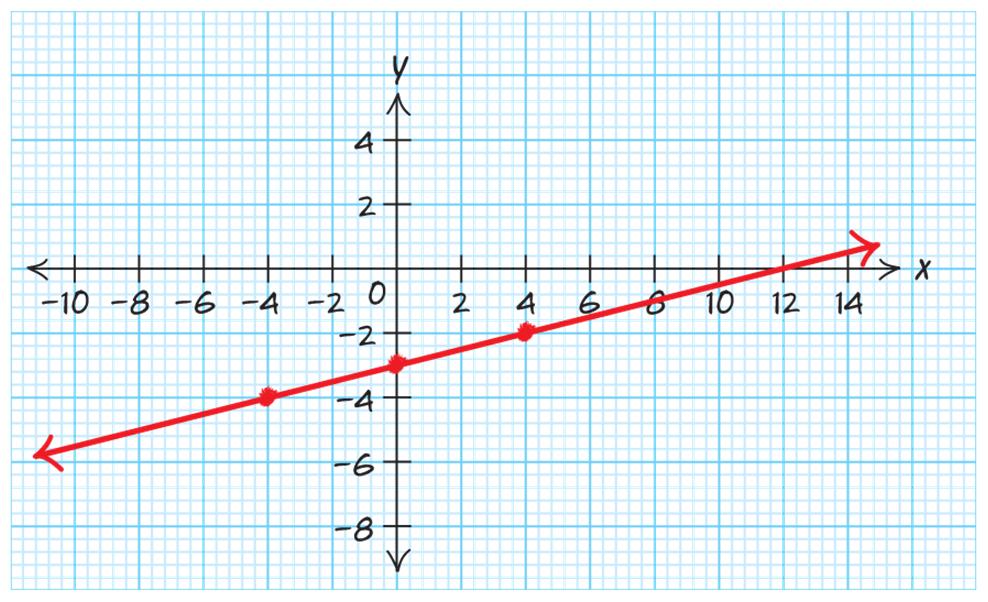
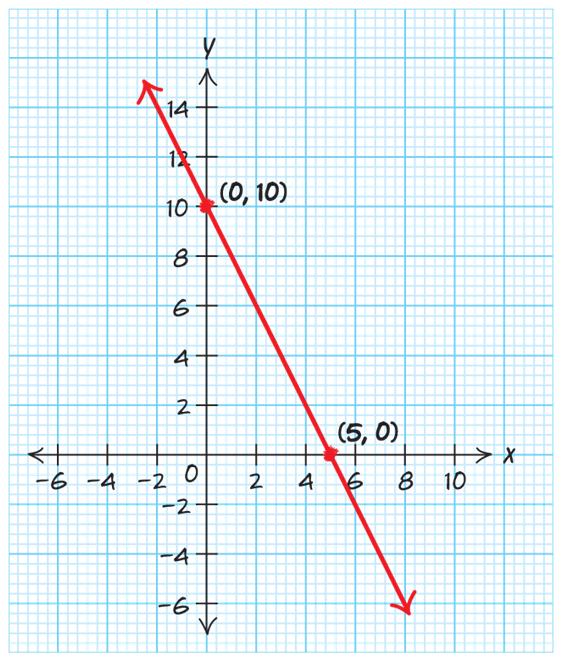
Use two points:0,10&4,0 010105 Slope 4042 ===
b. Decreasing
Use two points:3,15&3,0 015 155 Slope 3362 ===
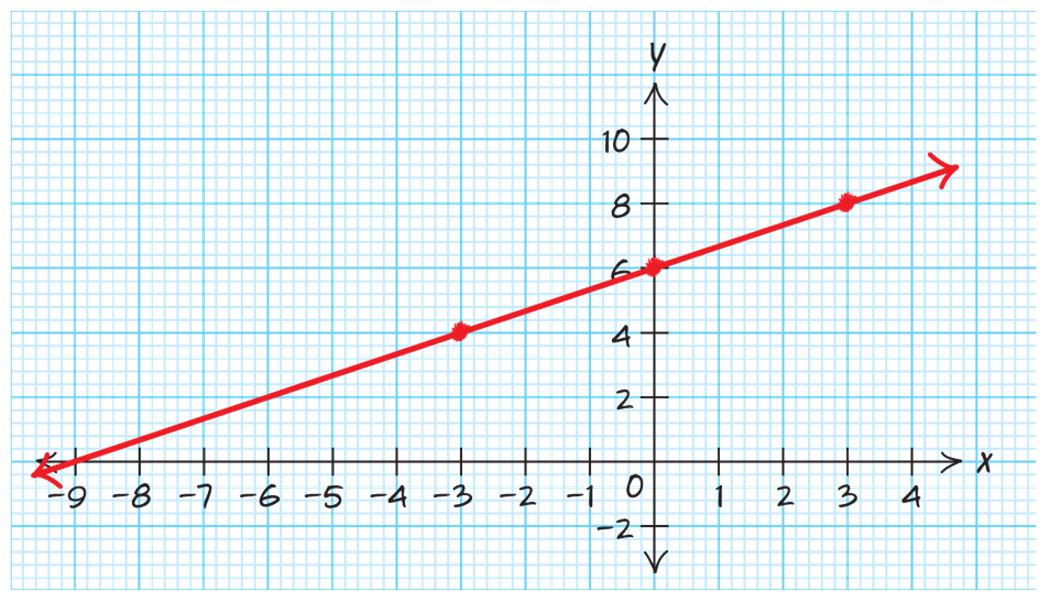
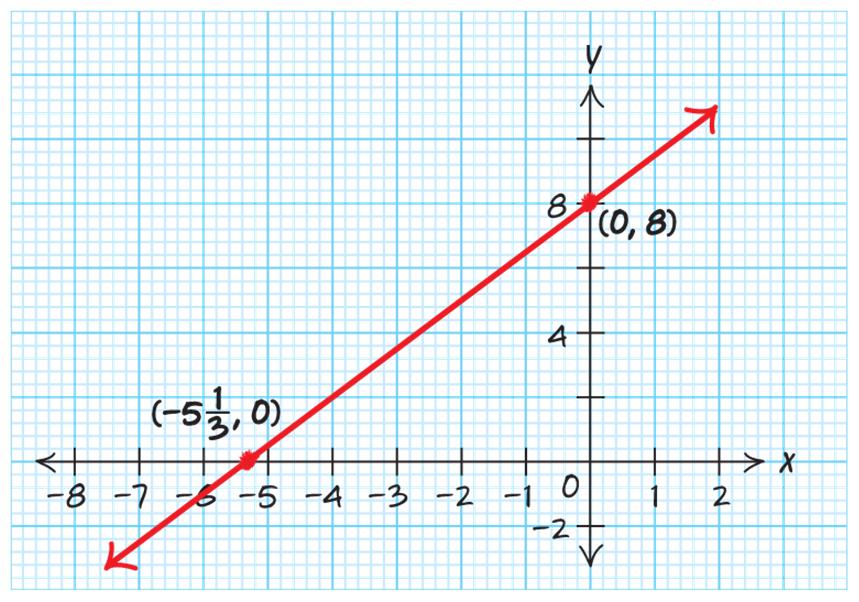
3. a. ()() () ()
b. Increasing
c. y-intercept: (0,7.5)
4.
a.
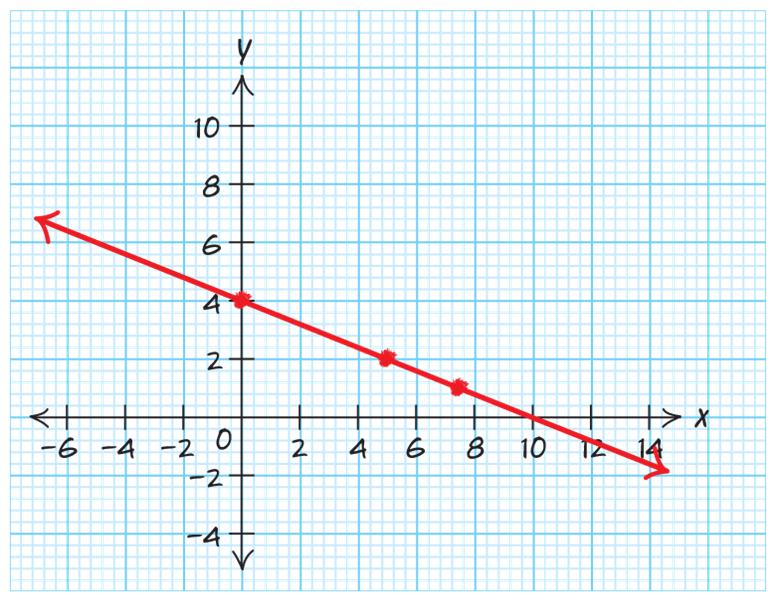
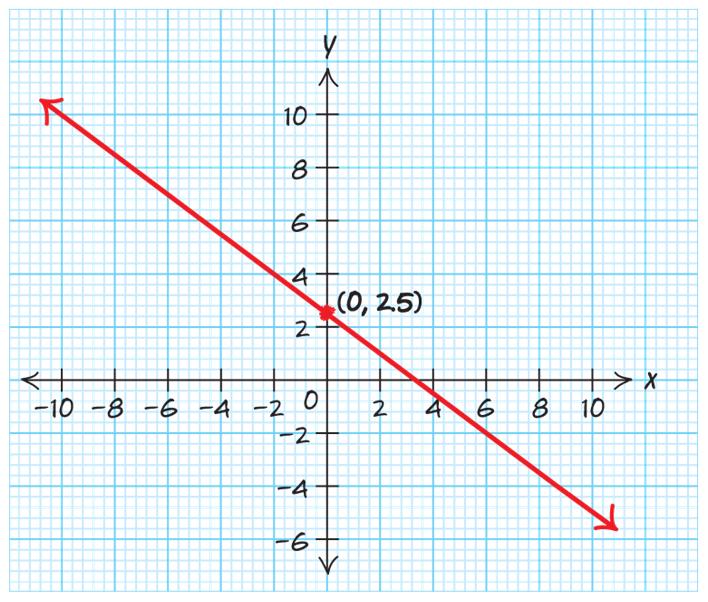
Use two points:1,4&3,2 2463 Slope 3142 ===
()() ()
b. Decreasing
c. y-intercept: () 0,2.5
5.
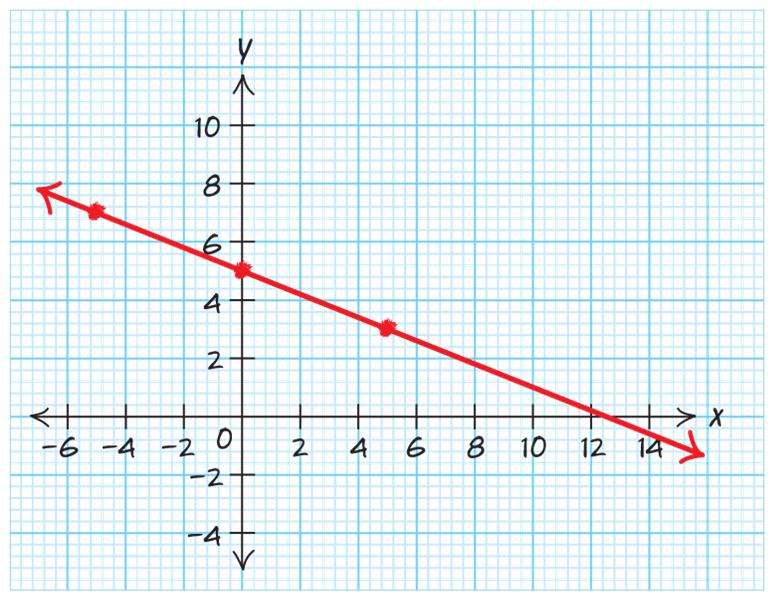
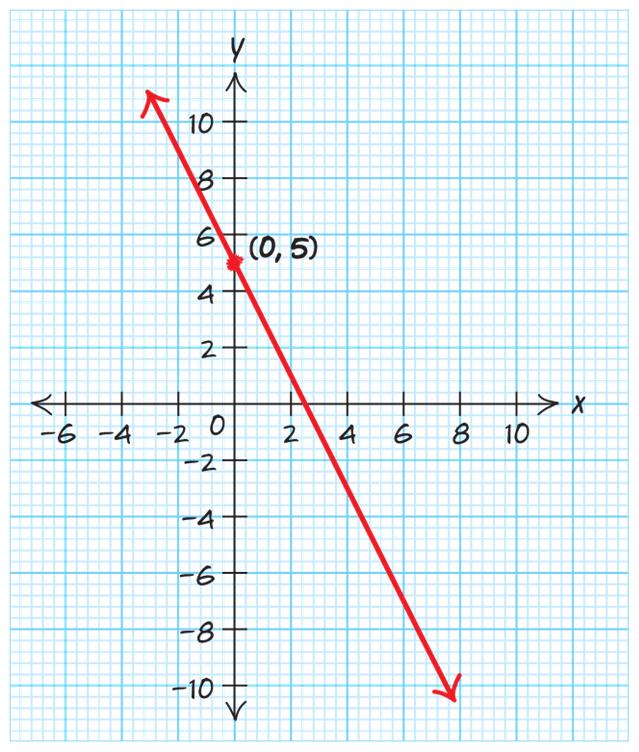
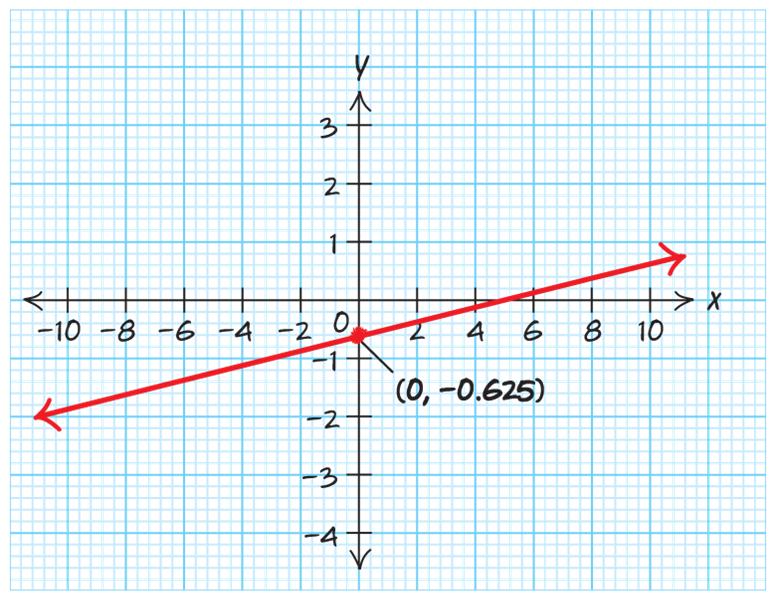
a. ()() Use two points:0,5&1,0 05 Slope5 10 ==−
b. Decreasing
c. Vertical intercept: (0,5)
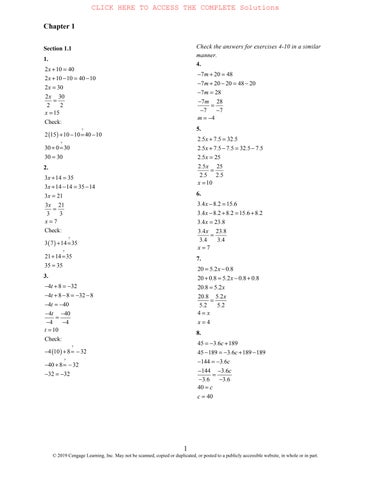
c. Vertical intercept: (0,10) 7. 23yx=+ x 23yx=+ –1 () 2131 −+= 0 () 2033 += 1 () 2135 += 2 () 2237 += The graph is linear. 8. 38yx=− xy –1 () 31811 −−=− 0 () 3088 −=− 1 () 3185 −=− 2 () 3282 −=−

The graph is linear. 9 54xy=+ xy () 5141 −+=− –1 () 5044 += 0 () 5149 += 1 () 52414 += 2

The graph is linear. 10. 27xy=−− xy
graph is linear.
The graph is nonlinear.
2 4 yx=− xy
() 2 345−−= –2 () 2 240−−=
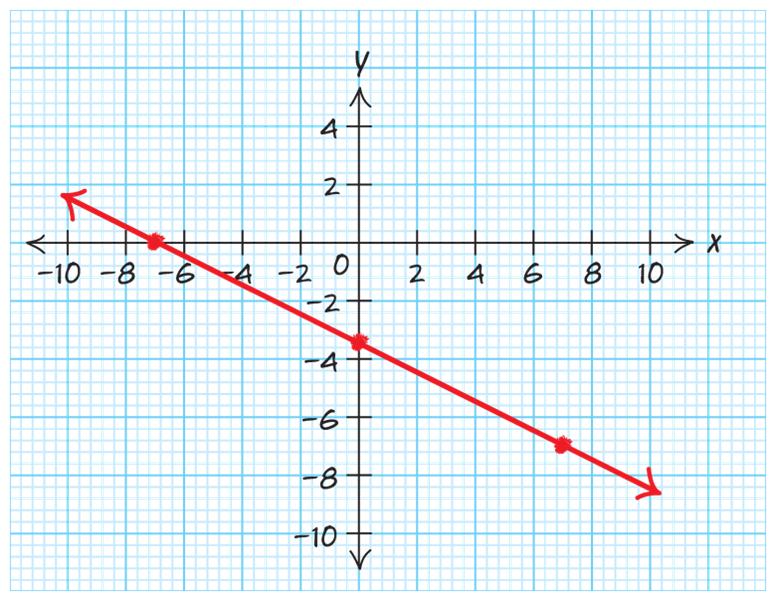
() 2 044 −=− 2 () 2 240−−= 3 () 2 345 −= The graph is nonlinear. 13 2 6 3 yx=+ xy

graph is linear.

The graph is linear.
3 1 4 xy=+ xy () 3 4 412−+=− –4
() 3 4 011 += 0
() 3 4 414 += 4

The graph is linear.
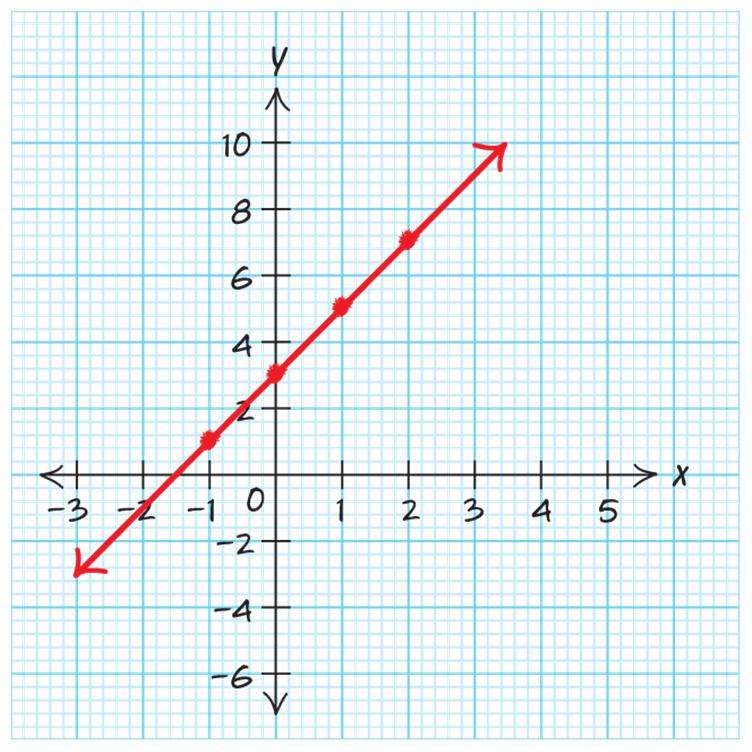
17 0.53yx=− xy
–2 () 0.5234 −−=−
0 () 0.5033 −=−
2 () 0.5232 −=−
4 () 0.5431 −=−

The graph is linear.
18. 0.45yx=−+ xy
–5 () 0.4557 −−+=
0 () 0.4055−+=
5 () 0.4553−+=
The graph is linear.
19 1.57xy=−+ xy () 1.5077−+= 0 () 1.5274−+= 2 () 1.5672 −+=− 6

The graph is linear.
20. 2.510xy=−+ xy
() 2.56105 −+=− 6
() 2.54100 −+= 4
() 2.501010 −+= 0 () 2.51107.5 −+= 1
The graph is linear.
21 2 215yx=−+ xy
–3 () 2 23153 −−+=− –2 () 2 22157 −−+= 0 () 2 201515−+= 2 () 2 22157−+=
3 () 2 23153 −+=−

The graph is nonlinear. 22 2 1.58yx=−+ xy
–3 () 2 1.5385.5 −−+=− –2 () 2 1.5282 −−+= 0 () 2 1.5088 −+=
2 () 2 1.5282 −+=
3 () 2 1.5385.5 −+=−

The graph is nonlinear. 23 0.5529.95Bm=+

100,000
500,000 160,000
400,000 180,000
500,000 200,000
600,000 220,000

25.
a. Let W be the sales clerk’s weekly salary in dollars for selling s dollars of merchandise during the week.
0.04100Ws=+ b.
120
140
160

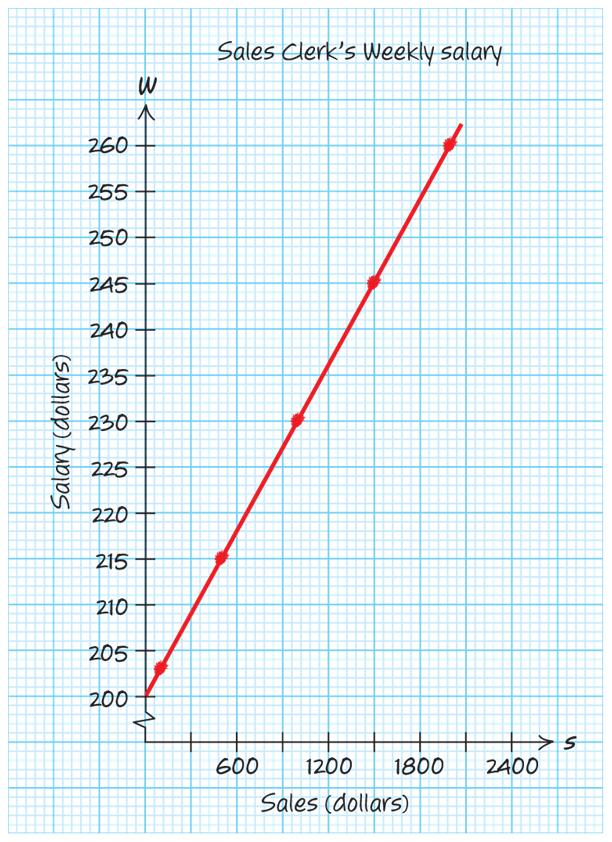
a. Let W be the sales clerk’s weekly salary in dollars for selling s dollars of merchandise during the week.
0.03200Ws=+
203
215
230
245
260
a. Let T be the total tuition and fees Western Washington University charges resident undergrad students (in dollars) for c credits taken by the student, up to 10 credits. T = 225.20c + 550.25


a. Let C be the cost in dollars for special delivery service m miles over the first 10 miles.


37. Yes, the points given in the table all lie on a line. The slopes are all equal.
38. Yes, the points given in the table all lie on a line. The slopes are all equal.
41.
a. The slope is 3. The slope is the coefficient of x in the equation.
b. The slope is positive, so the line is increasing.
c. The y-intercept is () 0,5 . The y-coordinate of the y-intercept is the constant of the equation.
42.
a. The slope is 7. The slope is the coefficient of x in the equation.
b. The slope is positive, so the line is increasing.
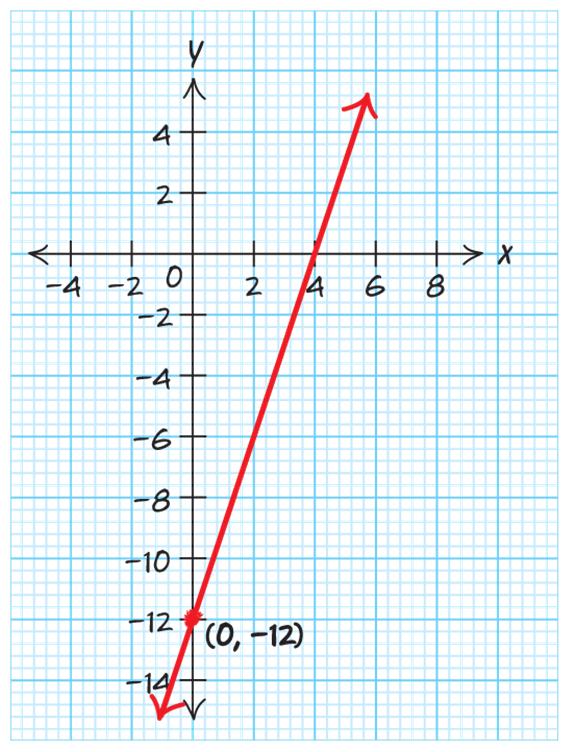
c. The y-intercept is ()0,12. The y-coordinate of the y-intercept is the constant of the equation.
43.
a. The slope is 4 . The slope is the coefficient of x in the equation.
b. The slope is negative, so the line is decreasing.
c. The y-intercept is ()0,8. The y-coordinate of the y-intercept is the constant of the equation.
44.
39. No, the points given in the table do not all lie on a line. The slopes are not all equal.
slope
40. No, the points given in the table do not all lie on a line. The slopes are not all equal.
a. The slope is 9. The slope is the coefficient of x in the equation.
b. The slope is negative, so the line is decreasing.
c. The y-intercept is ()0,25. The y-coordinate of the y-intercept is the constant of the equation.
45.
a. The slope is 1 2 The slope is the coefficient of x in the equation.
b. The slope is positive, so the line is increasing.
c. The y-intercept is ()0,5. The y-coordinate of the y-intercept is the constant of the equation.
46.
a. The slope is 2 . 3 The slope is the coefficient of x in the equation.
b. The slope is positive, so the line is increasing.
c. The y-intercept is ()0,43. The y-coordinate of the y-intercept is the constant of the equation.
47.
a. The slope is 0.4. The slope is the coefficient of x in the equation.
b. The slope is positive, so the line is increasing.
c. The y-intercept is () 0,7.2. The y-coordinate of the y-intercept is the constant of the equation.
48.
a. The slope is 2.3. The slope is the coefficient of x in the equation.
b. The slope is positive, so the line is increasing.
c. The y-intercept is () 0,8.4. The y-coordinate of the y-intercept is the constant of the equation.
49.
a. The slope is 4 . 3 The slope is the coefficient of x in the equation.
b. The slope is positive, so the line is increasing.
c. The y-intercept is 7 0,. 5 ⎛⎞ ⎜⎟ ⎝⎠ The y-coordinate of the y-intercept is the constant of the equation.
50.
a. The slope is 6 5 The slope is the coefficient of x in the equation.
b. The slope is negative, so the line is decreasing.
c. The y-intercept is 4 0,. 9 ⎛⎞ ⎜⎟ ⎝⎠ The y-coordinate of the y-intercept is the constant of the equation.
51. No, the y-intercept is () 0,9
52. No, the slope is 1 , 3 and the y-intercept is 4 0,. 3 ⎛⎞
53. Write the equation in the form y=mx+b 220 22202 220 xy xyxx yx +=
a. The slope is 2. The slope is the coefficient of x.
b. The slope is negative, so the line is decreasing.
c. The y-intercept is ()0,20. The y-coordinate of the y-intercept is the constant of the equation.
54. Write the equation in the form y=mx+b
a. The slope is 5. The slope is the coefficient of x in the equation.
b. The slope is negative, so the line is decreasing.
c. The y-intercept is ()0,11. The y-coordinate of the y-intercept is the constant of the equation.
55. Write the equation in the form y=mx+b
a. The slope is 2. The slope is the coefficient of x in the equation.
b. The slope is positive, so the line is increasing.
c. The y-intercept is ()0,10. The y-coordinate of the y-intercept is the constant of the equation.
56. Write the equation in the form y=mx+b 6318 636186
a. The slope is 2. The slope is the coefficient of x in the equation.
b. The slope is positive, so the line is increasing.
c. The y-intercept is ()0,6. The y-coordinate of the y-intercept is the constant of the equation.
57. Write the equation in the form y=mx+b.
a. The slope is 3 5 The slope is the coefficient of x in the equation.
b. The slope is negative, so the line is decreasing.
c. The y-intercept is 12 0,. 5 ⎛⎞ ⎜⎟ ⎝⎠ The y-coordinate of the y-intercept is the constant of the equation.
58. Write the equation in the form y=mx+b.
a. The slope is 2. The slope is the coefficient of x in the equation.
b. The slope is positive, so the line is increasing.
c. The y-intercept is 7 0,. 2 ⎛⎞ ⎜⎟ ⎝⎠ The y-coordinate of the y-intercept is the constant of the equation.
59. Write the equation in the form y=mx+b The slope is then the coefficient of x. The ycoordinate of the y-intercept is then constant of the equation.
60. Write the equation in the form y=mx+b. The slope is then the coefficient of x. The ycoordinate of the y-intercept is then constant of the equation.
No, the slope is 3 2 , and the y-intercept is () 0,3
No, the slope is 7, and the y-intercept is () 0,4
61.
a. The slope is 0.55. The cost of renting a 10-foot truck from Budget increases by $0.55 per mile the truck is driven.
b. If the per-mile charge were changed to $0.75, the graph would be steeper.
62.
a. The slope is 0.20. The hedge fund fees increase by $0.20 for each dollar of earnings.
b. If the percent charged on earning were changed to 15%, the graph would be less steep.
63.
a. The slope is 0.04. The sales clerk’s weekly salary increases by $0.04 per dollar of sales made. This represents the commission rate earned on all sales made.
b. If the base salary were changed to $200, the graph would have a higher vertical intercept, ()0,200, but would continue to increase at the same rate.
64.
a. The slope is 0.03. The sales clerk’s salary increases by $0.03 per dollar of sales made. This represents the commission rate earned on all sales made.
b. If the base salary were changed to $150, the graph would have a lower vertical intercept, ()0,150, but would continue to increase at the same rate.
65.
a. The slope is 225.20. The total tuition and fees Western Washington University charges each new resident undergrad student are increasing by $225.20 per credit taken. This is the per-credit charge.
b. If the per-credit fee is changed to $300 per credit and the other fees are changed to $400, the graph would start at a lower vertical intercept of ()0,400, and it would increase faster.
66.
a. The slope is 0.55. Each mile over 10 miles will increase the delivery fee by $0.55.
b. If the fees were changed to $7 for delivery and 75 cents for each mile over 10 miles, the graph would start at a higher vertical intercept of ()0,7, and it would increase faster.
67.
a. The slope is 3 . The percent of companies still in business is decreasing by 3 percentage points per year after the fifth year in operation.
b. If this trend continued, there would eventually be no long-standing companies still in business.
68.
a. The slope is –0.12. The percentage of U.S. households that have no car is decreasing by 0.12 each year.
b. If this trend were to continue, there will eventually be no households without cars. 69.
a. Texas has the larger population during these years because the Texas line is above the Florida line in the graph.
b. The vertical intercept is approximately ()0,19. In 2010, Florida had a population of about 19 million.
c. Texas is growing faster during these years because the line appears to have a steeper rate of increase (slope).
d. It appears that () 0,25 and () 10,30 are on the Texas line. Calculating slope gives 30255 0.5.
10010 ==
The slope is approximately 0.5. The population of Texas is increasing by about half a million people per year.
70.
a. Colorado has the larger population during these years because the Colorado line is above the Washington line in the graph.
b. The vertical intercept is about () 0,6.75. In 2010, Colorado had a population of about 6.75 million.
c. The states appear to be growing at roughly equal rates because the lines appear to have slopes that are about equal.
d. It appears that () 0,6.75 and () 10,7.75 are on the Colorado line. Calculating slope gives 7.756.751 0.1.
10010 ==
The slope is approximately 0.1. The population of Colorado is increasing by about 0.1 million, or 100,000, people per year.
71.
a. McDonald’s has the higher revenue during these years because the line for McDonald’s is above the Starbucks line.
b. The vertical intercept is approximately ()0,1. In 2000, Starbucks had revenue of about $1 billion.
c. Starbucks is growing faster during these years because the line appears to have a steeper rate of increase (slope).
d. It appears that () 2,4 and () 18,24 are on the Starbucks line. Calculating slope gives 24420 1.25.
18216 ==
Starbucks revenue is increasing by about $1.25 billion dollars per year.
72.
a. Except at the very start, Instagram had the larger percent of the population during these years because the Instagram line is above the Twitter line.
b. The vertical intercept is approximately ()0,11. In 2010, Instagram was used by about 11% of the U.S. population.
c. Instagram is growing its market penetration faster during these years because the line appears to have a steeper rate of increase (slope).
d. It appears that () 4,15 and () 9,20 are on the Twitter line. Calculating slope gives 20155 1. 945 == The slope is approximately 1. Twitter’s penetration among the U.S. population is increasing by about 1% per year.
73 27yx=− . The y-intercept is () 0,7 . The slope is 2 2 1 = . Plot a point at the y-intercept, then, using the slope, go up 2 and to the right 1.

74. 312yx=− . The y-intercept is () 0,12 . The slope is 3 3 1 = . Plot a point at the y-intercept, then, using the slope, go up 3 and to the right 1.
75. 4 6 5 yx=− . The y-intercept is () 0,6 . The slope is 4 5 . Plot a point at the y-intercept, then, using the slope, go up 4 and to the right 5.

76. 2 4 3 yx=+ . The y-intercept is () 0,4 . The slope is 2 3 . Plot a point at the y-intercept, then, using the slope, go up 2 and to the right 3.

77. 25yx=−+ . The y-intercept is () 0,5 . The slope is 2 2 1 −= . Plot a point at the y-intercept, then, using the slope, go down 2 and to the right 1.
78. 43yx=−− . The y-intercept is () 0,3 . The slope is 4 4 1 −= . Plot a point at the y-intercept, then, using the slope, go down 4 and to the right 1.

79. 7 11 5 yx=−+ . The y-intercept is () 0,11 . The slope is 77 55 −= . Plot a point at the y-intercept, then, using the slope, go down 7 and to the right 5.

80. 3 2 4 yx=−+ . The y-intercept is () 0,2 . The slope is 33 44 −= . Plot a point at the y-intercept, then, using the slope, go down 3 and to the right 4.
81. The graph has the y-intercept at () 0,1.5 , but it should be at () 0,3 .
82. The graph uses the slope 1 3 , but it should use the slope 3.
83. The graph uses the slope 2 3 , but it should use the slope 2 3 .
84. The graph uses the slope 1 2 , but it should use the slope 1 2
85. 0.54yx=+ . The y-intercept is () 0,4 . The slope is 1 0.5 2 = . Plot a point at the y-intercept, then, using the slope, go up 1 and to the right 2.

86. 0.758yx=− . The y-intercept is () 0,8 . The slope is 3 0.75 4 = . Plot a point at the y-intercept, then, using the slope, go up 3 and to the right 4.

87. 0.252yx=−+ . The y-intercept is () 0,2 . The slope is 11 0.25 44 −=−= . Plot a point at the yintercept, then, using the slope, go down 1 and to the right 4.
88. 0.36yx=−+ . The y-intercept is () 0,6 . The slope is 33 0.3 1010 −=−= . Plot a point at the yintercept, then, using the slope, go down 3 and to the right 10.

89. 23 55yx=−+ . The y-intercept is 3 0, 5 ⎛⎞ ⎜⎟ ⎝⎠ . The slope is 22 55 −= . Plot a point at the y-intercept, then, using the slope, go down 2 and to the right 5.
90. 19 44yx=−+ . The y-intercept is 9 0, 4 ⎛⎞ ⎜⎟ ⎝⎠ . The slope is 11 44 −= . Plot a point at the y-intercept, then, using the slope, go down 1 and to the right 4.
91. 13 44yx=− . The y-intercept is 3 0, 4 ⎛⎞ ⎜⎟ ⎝⎠ . The slope is 1 4 . Plot a point at the y-intercept, then, using the slope, go up 1 and to the right 4.
92. 15 88yx=− . The y-intercept is 5 0, 8 ⎛⎞ ⎜⎟ ⎝⎠ . The slope is 1 8 . Plot a point at the y-intercept, then, using the slope, go up 1 and to the right 8.
93. 0.752.5yx=−+ . The y-intercept is () 0,2.5 . The slope is 33 0.75 44 −=−= . Plot a point at the yintercept, then, using the slope, go down 3 and to the right 4.
94. 0.43.6yx=−+ . The y-intercept is () 0,3.6 . The slope is 22 0.4 55 −=−= . Plot a point at the yintercept, then, using the slope, go down 2 and to the right 5.

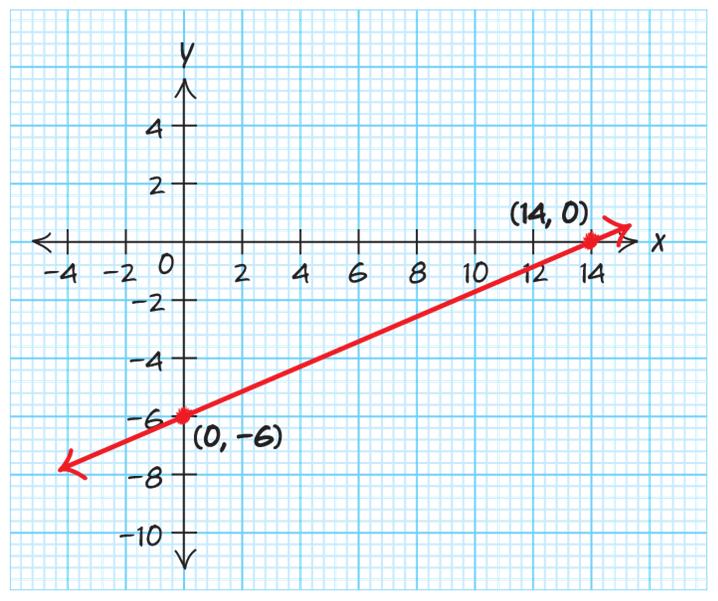
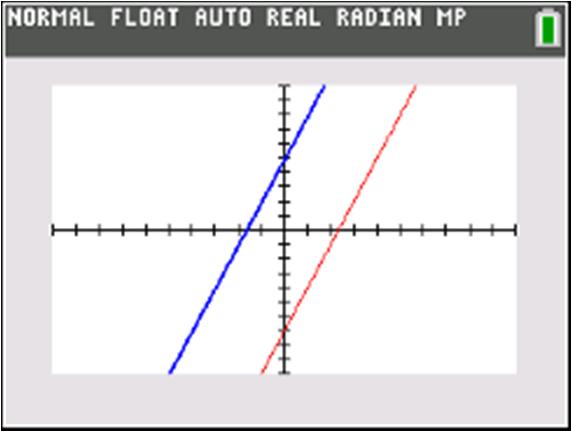
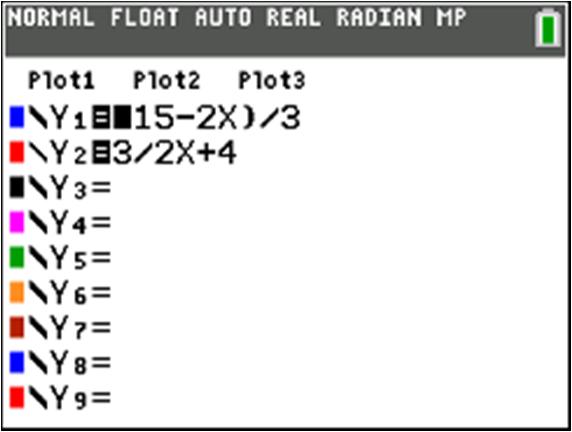
Section 1.3 1. ()() 58 5558 58 1518 58 yx xyxx xy xy xy =+
2. () 720 77720 720 1(7)1(20) 720 yx xyxx xy xy
3. 415 44415 415 yx xyxx xy
4. 39 3339 39 yx xyxx xy =−+
5. () ()() 2 8 3 2 338 3 3224 232224 123124 2324 yx yx yx xyxx xy xy =−
6. ()() 3 4 7 3 774 7 7328 373328 3728 137128 3728 yx yx yx xyxx xy xy xy
7. ()() 12 25 12 1010 25 1054 510554 5104 151014 5104 yx yx yx xyxx xy xy xy =+ ⎛⎞=+⎜⎟ ⎝⎠
8. ()() 27 94 27 3636 94 36863 8368863 83663 1836163 83663 yx yx yx xyxx xy xy xy =− ⎛⎞ =−⎜⎟ ⎝⎠
9. 41 53 41 1515 53 15125 121512125 12155 yx yx yx xyxx xy
⎛⎞ =−−⎜⎟ ⎝⎠ =−− +=−+− +=− 10. 27 75 27 3535 75 351049 1035101049 103549 yx yx yx xyxx xy =− ⎛⎞ =−⎜⎟ ⎝⎠
11.
a () 0,2 . The point that crosses the y-axis.
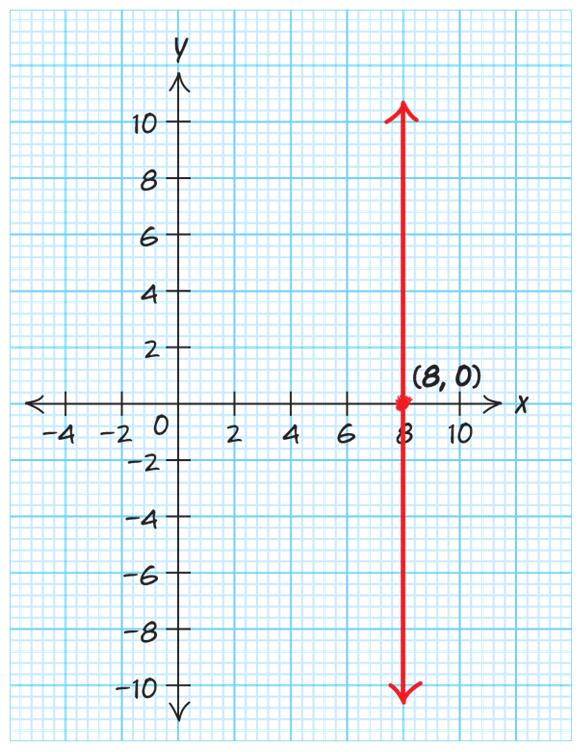
b () 3,0 . The point that crosses the x-axis.
c 3 x = from the point () 3,4
d 2.6 y = from the point () 1,2.6
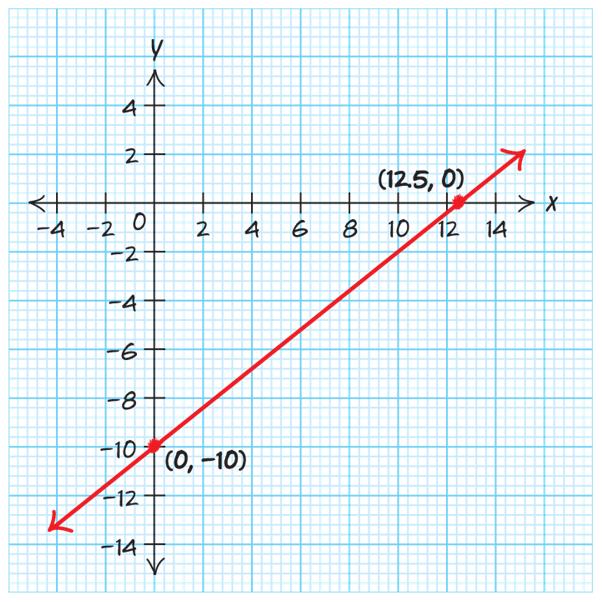
a () 0,3 . The point that crosses the y-axis.
b () 4,0 . The point that crosses the x-axis.
c 1.5 x = from the point () 1.5,2
d 4.5 y =− from the point () 2,4.5
13.
a () 0,5 . The point that crosses the y-axis.
b () 4,0 . The point that crosses the x-axis.
c. The input value is 10 when the output value is 18 . That is, 10 x =− when 18 y =
d. The input value is 15 when the output value is 15 . That is, 15 x = when 15 y =− .
e. The output value is 8 when the input value is 10 . That is, 8 y =− when 10 x = 14.
a. () 0,7 . The point that crosses the y-axis.
b. () 12,0 . The point that crosses the x-axis.
c. The input value is 13 when the output value is 15 . That is, 13 x =− when 15 y =
d. The input value is 15 when the output value is 2 . That is, 15 x = when 2 y =− .
e. The output value is 13 when the input value is 10 . That is, 13 y = when 10 x =− 15.
a. () 0,8 . The point that crosses the y-axis.
b. () 30,0 . The point that crosses the x-axis.
c 11 x = from the point () 11,5
d 9 x =− from the point () 9,10
e 3 y =− from the point () 20,3 16.
a. () 10,0 . The point that crosses the x-axis.
b () 0,50 . The point that crosses the y-axis.
c 110 x = from the point () 110,500
d 30 x =− from the point () 30,200
e 450 y = from the point () 100,450
17.
a. The vertical intercept for the Texas line is approximately () 0,25.5. In 2010, Texas had a population of about 25.5 million.
b. The vertical intercept for the Florida line is approximately ()0,19. In 2010, Florida had a population of about 19 million.
c. The horizontal intercepts would represent the years when the states had no population. This would not be reasonable to predict with this graph.
18.
a. The vertical intercept for the Washington line is approximately ()0,5. In 2010, Washington had a population of about 5 million.
b. The vertical intercept for the Colorado line is approximately () 0,6.75. In 2010, Colorado had a population of about 6.75 million.
c. The horizontal intercepts would represent the years when the states had no population. This would not be reasonable to predict with this graph. 19.
a. The vertical intercept for the McDonald’s line is approximately ()0,14. In 2000, McDonald’s had revenue of about $14 billion.
b. The vertical intercept for the Starbucks line is approximately ()0,1. In 2000, Starbucks had revenue of about $1 billion.
c. The horizontal intercepts would represent the years when these companies had no revenue. This would not be reasonable to predict with this graph. 20.
a. The vertical intercept for the Twitter line is approximately ()0,11. In 2010, about 11% of the U.S. population used Twitter.
b. The vertical intercept for the Instagram line is approximately ()0,10. In 2010, about 10% of the U.S. population used Instagram.
c. The horizontal intercepts would represent the years when these services had not penetrated the U.S. population. This may not be reasonable to predict with this graph.
21.
a. False, () vertical intercept0,2 =−
b. True.
c. False, 4.5 x =−
d. False, 1.5 x =−
e. True.
22.
a. False, ()-intercept100,0 x =
b. False, ()-intercept0,400 y =
c. True.
d. False, 150 x =
e. True.
23 0.5529.95Bm=+
a. Vertical intercept: () 0.55029.95 29.95 (0,29.95) B B =+ =
It will cost you $29.95 to rent a 10-ft truck from Budget and drive it 0 miles.
b. Horizontal intercept:
00.5529.95
29.950.5529.9529.95
29.950.55
29.950.55 0.550.55 54.5
To rent a 10-ft truck from Budget for $0, you would have to drive it 55 miles. This is model breakdown.
24. 8555Ch=+
a. Vertical intercept: 85(0)55 55 (0,55) C C =+ =
Renting a backhoe for zero hours would cost $55. Since it would not happen, this is model breakdown.
b. Horizontal intercept:
08555 550855555 5585 5585 8585 0.65 0.65,0 h h h h h
Renting a backhoe for 0.65 hours will cost $0. Since this cannot happen (negative time rental), this is model breakdown.
25. 57Pa=+
a. P-intercept () 507 7 (0,7) P P =+ =
7% of 10-year-old girls are sexually active.
b a-intercept
0% of 8.6-year-old girls are sexually active.
26 350Pt=−+
a. P-intercept () () 3050 50 0,50 P P
50% of companies that have been in business for five years are still in business.
= =
b. t-intercept 0350 5035050 503 503 33 2 16 3 2 16,0 3 t t t t t =−+ −=−+−
0% of companies are in business after 2 21 3 years. This is model breakdown.
27.
a. Let M be the total monthly salary a salesperson earns in dollars. Let s be the total dollars in sales per month.
0.05500Ms=+
b. Vertical intercept: () () 0.050500 500 0,500 M M =+ =
If a salesperson sells $0 during the month, his/her monthly salary will be $500.
b. Vertical intercept:
If a loan officer makes 0 loans, their salary will be $2000 for the month.
c. Horizontal intercept:
01002000
2000010020002000 2000100 2000100 100100 20 20,0
20 loans will earn a loan officer $0 in wages. This
is model breakdown.
29. P = 0.34t + 1327.6 a P-intercept: () () 0.3401327.6 1327.6 0,1327.6 P P =+ =
The population of Maine in 2010 was 1327.6 thousand people.
b. t-intercept: 00.341327.6
5000.05
5000.05
c. Horizontal intercept () 00.05500
0.050.05 10,000 10,000,0 s s s
1327.60.341327.61327.6
05000.05500500
A salesperson will need to sell $10,000 in order to make $0 for the month. This is model breakdown. 28.
a. Let M be the monthly salary a loan officer earns in dollars. Let l be the number of loans made in a month. 1002000Ml=+
1327.60.34
1327.60.34
0.340.34
3904.7
() 3904.7,0
The population of Maine was 0 people in 1895. This is model breakdown.
30. P = 37t + 4934
a P-intercept: 37(0)4934 4934 (0,4934) P P =+ =
The population of Minnesota was 4934 thousand people in the year 2000.
b. t-intercept:
The population of Minnesota was 0 people in 1867. This is model breakdown.
31. 822798Mt=+
a. M-intercept:
The number of Florida residents enrolled in Medicare in 2000 was 2798 thousand people. b t-intercept:
Zero residents of Vermont were enrolled in Medicare in 1968. This is model breakdown. 33. 248 xy+=
Zero residents of Florida were enrolled in Medicare in 1966. This is model breakdown.
32 M = 2.8t + 89
a. M-intercept: 2.8(0)89 89 (0,89)
This means that in the year 2000, there were 89 thousand Vermont residents enrolled in Medicare. b t-intercept: 02.889

4220 xy
35. 3515 xy−= ()
vertical intercept: 30515 515 55 3 (0,3) y y y −= = =− () horizontal intercept: 35015 315 33 5 (5,0) x x x −= = =

36. 5220 xy−=
vertical intercept: 5(0)220 220 22 10 (0,10) y y y

37. 4630 xy+= () vertical intercept: 40630 630 66 5 (0,5) y y y += =
() horizontal intercept: 46030 430 44 15 7.5 2 (7.5,0) x x x +=


42. 7570 xy −−=−
4

44. 3 x =− no vertical intercept horizontal intercept: 3 (3,0) x
45. 3 y = no horizontal intercept vertical intercept: 3 (0,3) y =

46. 6 y =− no horizontal intercept vertical intercept: 6 (0,6) y =−

47. The graph of the line goes through the point () 0,0 , but if you substitute 0 x = and 0 y = into the equation, you get a false statement.
48. The graph of the line goes through the point () 0,1 , but if you substitute 0 x = and 1 y = into the equation, you get a false statement.
49. This is the graph of the line 1 y =− . 50. This is the graph of the line 4 x =
51. 3 6 7 yx=− . The y-intercept is () 0,6 . The slope is 3 7 . Plot a point at the y-intercept, then, using the slope, go up 3 and to the right 7.
52. 4 10 5 yx=− . The y-intercept is () 0,10 . The slope is 4 5 . Plot a point at the y-intercept, then, using the slope, go up 4 and to the right 5.
53. ()534 5312 553125 37 yx yx
The y-intercept is () 0,7 . The slope is 3 3 1 = . Plot a point at the y-intercept, then, using the slope, go up 3 and to the right 1.

54. ()423 426 44264 22 yx
The y-intercept is () 0,2 . The slope is 22 2 11 == .
Plot a point at the y-intercept, then, using the slope, go up 2 and to the right 1. Or, plot a point at the y-
intercept, then, using the slope, go down 2 and to the left 1.
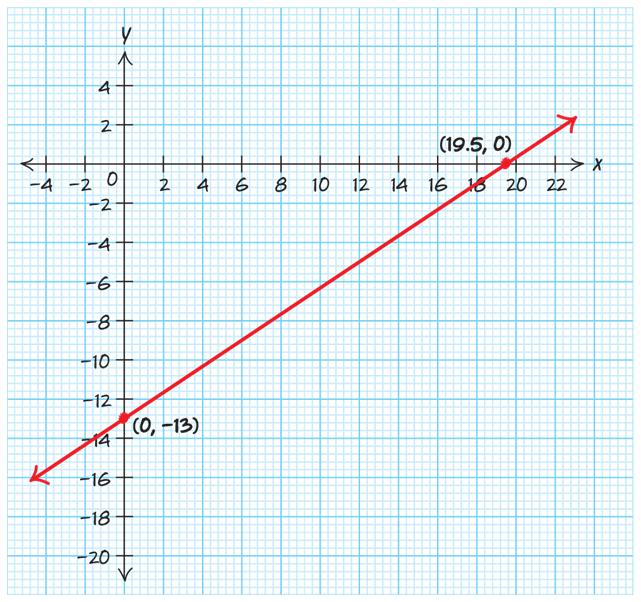
Plot a point at the -intercept 0,13.
solve
55. () 1 41 2 yx−=+ () () ()
Plot a point at the -intercept 19.5,0. Draw a line through the two points.
Plot a point at the -intercept 0,4.5.
Plot a point at the -intercept 9,0. Draw a line through the two points.

57. The line 7 y = is a horizontal line through the point () 0,7 .

58. The line 2.5 y = is a horizontal line through the point () 0,2.5

59. The line 9 x = is a vertical line through the point () 9,0 .

60. The line 3.5 x = is a vertical line through the point () 3.5,0

61. The line 4.5 y =− is a horizontal line through the point () 0,4.5

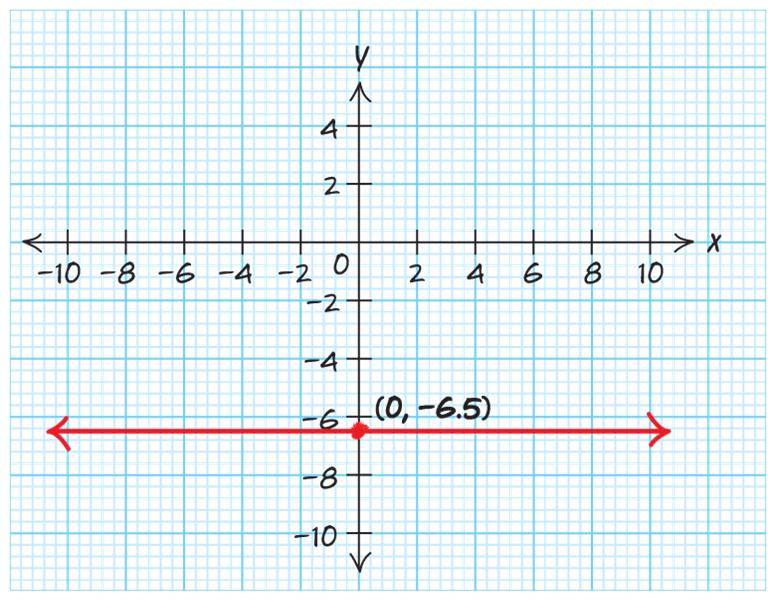
62. The line 6.5 y =− is a horizontal line through the point () 0,6.5 .
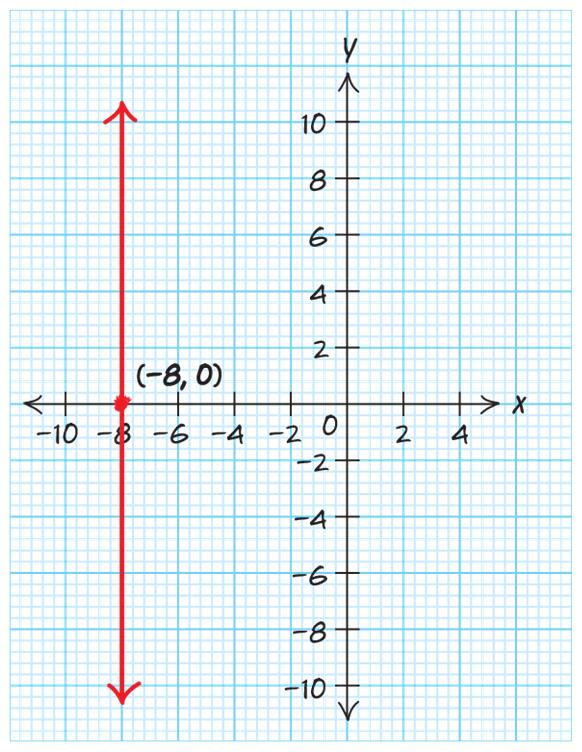
63. The line 8 x =− is a vertical line through the point () 8,0 .
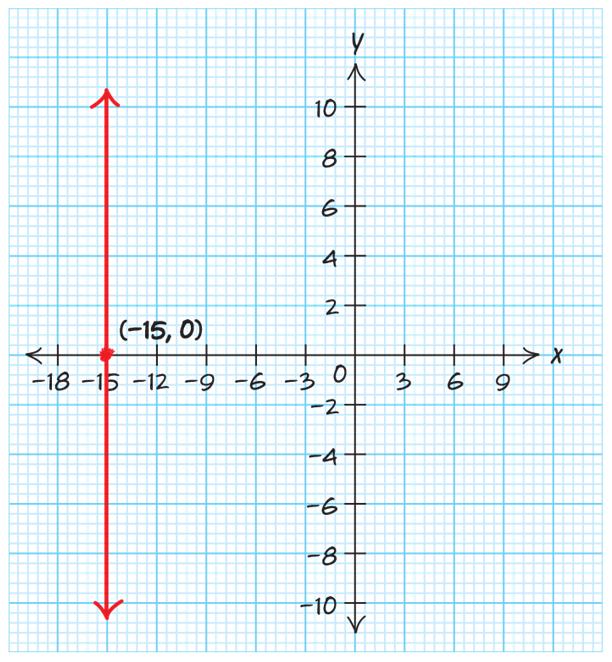
64. The line 15 x =− is a vertical line through the point () 15,0
65. 1 362 2 3312 333123 12 yxx yxx yxxxx y ⎛⎞ +=−
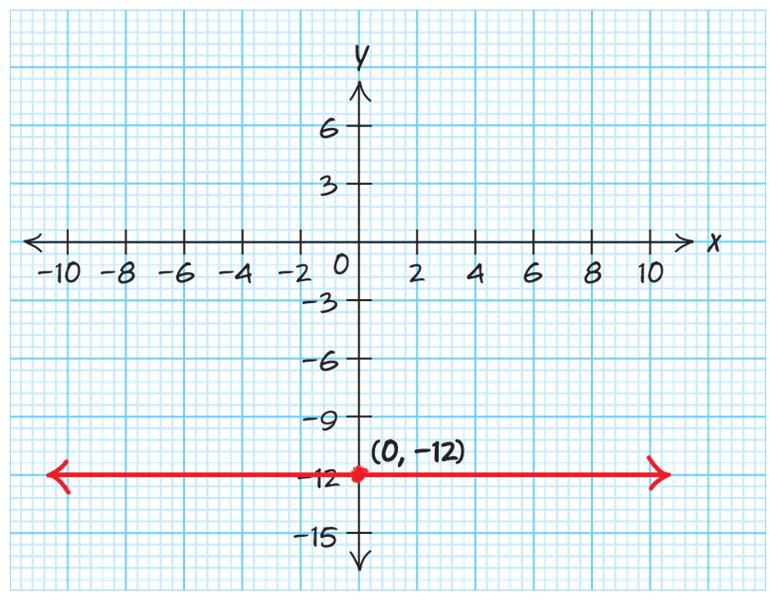
The line 12 y =− is a horizontal line through the point () 0,12
66. ()24227 24414 2444144 214 7 yxx yxx yxxxx y
The line 7 y =− is a horizontal line through the point () 0,7

67. ()52310 52330 5530 555305 30 yxyy yxyy yxy yxyyy x +=+− +=+−
The line 30 x =− is a vertical line through the point () 30,0 .

68. 28 28 28 2282 8 8 yxxy yxyxyy xx xxxx x x
The line 8 x = is a vertical line through the point () 8,0 .
69. () 2242 2282 28 6 yxx yxx y y +=+−
The line 6 y = is a horizontal line through the point
() 0,6

70. 5314 5314 5314 51431414 93 3 yxy
The line 3 x = is a vertical line through the point
() 3,0 .
71. 2 6 15 yx=−
The y-intercept is () 0,6 . The slope is 2 15 . Plot a point at the y-intercept, then using the slope, go up 2 and to the right 15.
72. 3 6 11 yx=−
The y-intercept is () 0,6 . The slope is 3 11 . Plot a point at the y-intercept, then using the slope, go up 3 and to the right 11.

Let 0 and solve for : 10025100 025100 25100 4
Plot a point at the -intercept 0,4. xy y y
73. 1025100 xy−= () ()
Let 0 and solve for : 10250100 100100 10100 10
() ()
Plot a point at the -intercept 10,0. Draw a line through the two points. yx x

Let 0 and solve for : 20100400 0100400 100400 4

75. 0.00120yx=−
The y-intercept is () 0,20 . The slope is 1 0.001 1000 = . Plot a point at the y-intercept, then using the slope, go up 1 and to the right 1000.

76. 0.00214yx=−+
Plot a point at the -intercept 0,4. xy y y y y y =
74. 21004000 xy−= () ()
Let 0 and solve for : 21000400 20400 2400 200
The y-intercept is () 0,14 . The slope is 211 0.002 1000500500 −=−=−= . Plot a point at the yintercept, then using the slope, go down 1 and to the right 500.
Plot a point at the -intercept 200,0. Draw a line through the two points. yx
() ()

77.
a. If the slope were changed to 0.75, the vertical intercept would not change.
b.
Let B = 0 in B = 0.75m + 29.95. 00.7529.95
29.950.75
29.950.75
0.750.75
39.93 m m m m =+
The horizontal intercept would be () 39.93,0 instead of () 54.45,0. If the slope were changed to 0.75, the horizontal intercept would get closer to zero.
78.
a. If the slope were changed to 100, the vertical intercept would not change.
b.
Let C = 0 in C = 100h + 55. 010055 55100 55100 100100 0.55 h h h h =+
The horizontal intercept would be () 0.55,0 instead of () 0.65,0. If the slope were changed to 100, the horizontal intercept would get closer to zero.
79.
a. If the slope were changed to 3, the vertical intercept would not change.
b.
Let P = 0 in P = 3a + 7. 037
If the slope were changed to 3, the horizontal intercept would be 1 2,0 3 ⎛⎞ ⎜⎟
instead of ()1.4,0.
The horizontal intercept would be more negative. The age at which 0% of girls are sexually active would be younger 2 7 vs. 8.6. 3 ⎛⎞ ⎜⎟ ⎝⎠ This might indicate model breakdown.
80.
a. If the slope were changed to 2, the vertical intercept would not change. b.
Let P = 0 in P = –2t + 50.
If the slope were changed to 2, the horizontal intercept would be () 25,0 instead of 2 16,0. 3 ⎛⎞
It would take 25 years after the fifth year (so 30 years) for the percentage of companies still in business to reach zero instead of only 2 16 3 years after the fifth year (so 2 21 3 years).
81.
a. If the commission were changed to 6%, the vertical intercept would not change.
b. If the base salary were changed to $400, the vertical intercept would be lower at ()0,400.
c.
Let M = 0 in M = 0.06s + 400. 00.06400 4000.06 4000.06 0.060.06 6666.67 s s s s =+ −= = −≈
The horizontal intercept would be about () 6667,0 instead of () 10000,0. If both changes were made, the horizontal intercept would be closer to zero, but this would still be model breakdown.
82.
a. If the commission were changed to $150, the vertical intercept would not change.
b. If the base salary were changed to $2500, the vertical intercept would be higher at () 0,2500.
Let M = 0 in M = 150l + 2500.
2500150 2500150 150150 16.67 l
01502500
The horizontal intercept would be about () 16.67,0 instead of ()20,0. If both changes were made, the horizontal intercept would be closer to zero, but this would still be model breakdown.
83.
a. If the population were to start growing more quickly, the slope would be bigger and the graph would start to increase more rapidly.
b. If the population were to start growing more slowly, the slope would be smaller and the graph would increase even more slowly.
84.
a. If the population were to start growing more quickly, the slope would be bigger and the graph would start to increase even more rapidly.
b. If the population were to start growing more slowly, the slope would be smaller and the graph would increase more slowly.
is
-intercept is 0,10.
is 0,3.
-intercept is
9.
Using two points: 2,5 and 6,0 055
()()
Find the slope: 624 m ==−
() () 5 Using and 6,0. 4 5 06 4 15 0 2 15 2 m b b b =− =−+ =−+ = 515 Since amd 42 515 42 mb yx =−= =−+
10.
Using two points: 1,0 and 3,15 150
()()
Find the slope: 7.5 31 m ==
() () Using 7.5 and 1,0. 017.5 07.5 7.5 Since 7.5 amd 7.5 7.57.5 m b b b mb yx = =+ =+ =− ==− =−
11. The equation for a horizontal line that goes through the point () 0,4 is 4 y =
12. The equation for a horizontal line that goes through the point () 0,2 is 2 y =− .
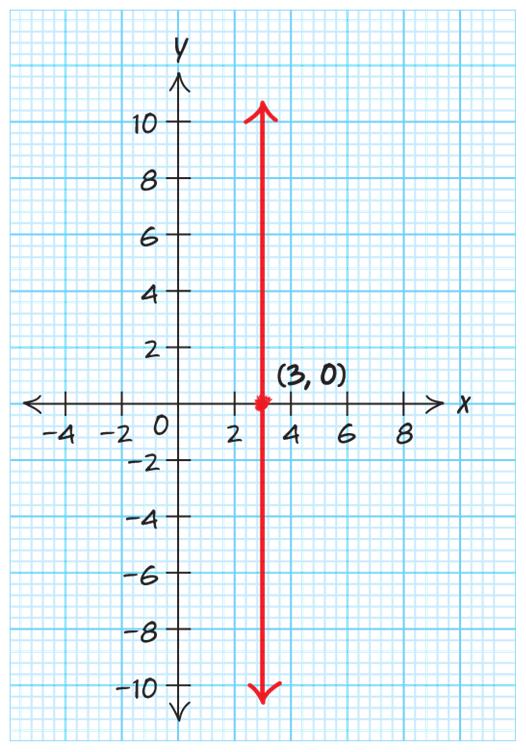
13. The equation for a vertical line that goes through the point () 3,0 is 3 x =
14. The equation for a vertical line that goes through the point () 4,0 is 4 x =−
15. Sherry’s work is correct. One of the points that Maritza used did not clearly cross the intersection on the graph paper. The point () 0,1.5 was incorrect.
16. Cheryll’s work is correct. Lance wrote the equation of horizontal line.
17. Let C be the total cost of shirts in dollars, and let n be the total number of shirts purchased.
()() 10,110&30,280
Slope: 28011017017 3010202 m ===
Use the point slope form of the equation: () 17 11010 2 17 11085 2 17 11011085110 2 17 25 2
18. Let C be the total cost of sports jerseys in dollars, and let j be the total number of jerseys purchased.
()() 15,360&25,500
Slope: 500360140 14 251510 m ===
Use the point slope form of the equation: ()5001425 50014350 50050014350500 14150
19. Let P be the total population of Washington State in thousands, and let t be the years since 2000.
()() 15,6951&25,7996
Slope: 799669511045 104.5 251510 m ===
Use the point slope form of the equation: ()6951104.515 6951104.51567.5 69516951104.51567.56951 104.55383.5 Pt
20. Let P be the total population in the state of Nevada in thousands t years since 2000.
()() 10,2691&25,3863
Slope: 386326911172 78.13 251015 m ===
Use the point slope form of the equation:
78.131909.7 Pt
269178.13(10)
269178.13781.3
2691269178.13781.32691
21. Let W be a woman’s optimal weight in pounds, and let h be a woman’s height in inches above 5 feet.
()() 0,100&6,130
Slope: 13010030 5 606 m ===
The vertical intercept is () 0,100 . 5100Wh=+
22. Let W be a man’s optimal weight in pounds, and let h be a man’s height in inches above 5 feet.
()() 0,106&6,142
Slope: 14210636 6 606 m ===
The vertical intercept is () 0,106 . 6106Wh=+
23. Let H be the national healthcare expenditures in the United States in billions of dollars and let t be time in years since 2000.
()() 17,3586.6&24,5425.1
Slope: 5425.13586.61838.5 24177 m ==
Use the point slope form of the equation: 1838.5 3586.6(17) 7
3586.6262.644464.93
3586.63586.6262.644464.933586.6
262.64878.33
24. Let H be the number of hospitals in the United States t years since 2000.
()() 14,5723&17,5564
Slope: 55645723159 53 17143 m ===−
Use the point slope form of the equation: 572353(14) 572353742 57235723537425723 536465
() () Using 2 and 3,7. 723 76 13 Since 2 amd 13 213 m b b b mb yx
=−+ 26. () () Using 3 and 4,10. 1034 1012 2 Since 3 amd 2 32 m b b b mb
and 2,12.
or duplicated, or posted to a publicly accessible website, in whole or in part.
29.
Using two points: 1,3 and 4,12 123
()()
Find the slope: 3 41 m == () ()
Using 3 and 1,3. 331 333 33333 3 m yx yx yx yx = −=−
30.
Using two points: 2,4 and 7,24 244
Find the slope: 4 72
()() () ()
Using 4 and 2,4. 442 448 44 m m yx yx yx == =
31.
Using two points: 7,6 and 21,1 161
()()
Find the slope: 2172 m ==− () () 1 Using and 7,6. 2 1 67 2 17 6 22 17 666 22 119 22 m yx yx yx yx =−
Using two points: 5,2 and 3,10 102
32. ()() () ()
Find the slope: 4 35 m ==− () () Using 4 and 5,2. 245 2420 422 m yx yx yx =−−− +=−+
Using two points: 4,5 and 1,7 75
33. ()() () ()
Using two points: 8,3 and 12,15 153
34. ()() () ()
Find the slope: 3 128 m == () ()
Using 3 and 8,3. 338 3324 333243 321 m yx yx yx yx =−− +=+
35.
Find the slope: 4 14 m == () () Using 4 and 4,5. 544 5416 554165 411 m yx yx yx
Using two points: 7,3 and 7,9 93 12
()() ()
Find the slope: undefined 770 m ⎫ == ⎬ ⎭
If the slope is undefined, then the line is a vertical line. The vertical line that goes through both () 7,3 and () 7,9 is 7 x = 36.
Using two points: 4,5 and 4,12 1257
()()
Find the slope: undefined 440 m ⎫ == ⎬ ⎭
If the slope is undefined, then the line is a vertical line. The vertical line that goes through both () 4,5 and () 4,12 is 4 x = .
37.
Using two points: 2,8 and 4,8 880
()()
Find the slope: 0 422 m ===
If the slope is zero, then the line is a horizontal line. The horizontal line that goes through both () 2,8 and () 4,8 is 8 y =
38.
Using two points: 8,15 and 10,15 1515 0
Find the slope: 0 10818 m ===
If the slope is zero, then the line is a horizontal line. The horizontal line that goes through both () 8,15 and () 10,15 is 15 y =− .
39. ()()
Using two points: 0,7 and 2,11 117
Using two points: 8,6 and 11,18 186
Find the slope: 4 118
43. ()() () ()
Using 4 and 8,6. 648 6432 664326 426 m m yx yx yx yx
44. ()()
Find the slope: 2 20
Since 2 and 7 27 m mb yx == == =+
40.
Using two points: 0,4 and 4,10 104 7
()() ()
Find the slope: 402 7 Since and 4 2 7 4 2 m mb yx == ==− =−
41.
Using two points: 2,1 and 4,13 131
Using two points: 4,7 and 14,18 1875
Find the slope: 1442 m ==− () () 5 Using and 4,7. 2 5 74 2 5 710 2 5 77107 2 5 17 2 m yx yx yx yx =−
Find the slope: 7 42
Using 7 and 2,1. 172 1714 117141 715 m m yx yx yx
Using two points: 1,10.75 and 3,3.75 3.7510.757
42. ()() ()
Find the slope: 314 m ==− () () 7 Using and 3,3.75. 4 7 3.753 4 7 3.755.25 4 7 9 4 m yx yx yx =−
Since the lines are parallel. yxm yxm mm =+→= =−→= =
45. 1 2 12 353 373
Check:


Since the lines are not parallel.
Since the lines are not perpendicular. The lines are neither.

Check: Checktheanswersforexercises49-58inasimilar manner.
49. 1 2540 252402 5240 5240 555 22 8 55 xy xyxx yx yx yxm −= −−=− −=−+ =+ =−→= 2 41010 41010 444 55 2.5 22 yx yx yxm −=+ =+ =−−→=−
Since 1 2 1 m m =− , the lines are perpendicular.
50. 1 2 0.2590.25 43 34 0.250.750.25 yxm xy xy yxm =−→=
Since 12mm = the lines are parallel.
51. 1 4320 434204 3420 3420 333 4204 333 xy xyxx yx yx yxm −= −−=−
=+ =−→= 2 12930 129123012 91230 91230 999 4104 333 xy xyxx yx
Since 12mm = the lines are parallel.
52. () 1 2 743 7412 7312 353 11 2 33 yxx yxx yx yxm yxm +=+− +=+− +=+ =+→= =−+→=−
Since 1 2 1 m m =− , the lines are perpendicular.
53. Perpendicular, any horizontal line is perpendicular to any vertical line.
54. Parallel, 12 . mm = Any two unique vertical lines are parallel.
55. 1 2520 252202 5220 5220 555 22 4 55 xy xyxx yx yx yxm += +−=− =−+ =+ =−+→=− 2 10420 104102010 41020 41020 444 55 5 22 xy xyxx yx yx yxm −= −−=− −=−+ =+ =−→=
Since 1 2 1 m m =− , the lines are perpendicular.
56. 1 328 32383 238 238 222 33 4 22 xy xyxx yx yx yxm += +−=− =−+ =+ =−+→=− 2 6912 6912 666 33 2 22 yx yx yxm −=+ =+ =−−→=−
Since 12mm = the lines are parallel.
57. 1 57 5575 557 575 xy xyxx xyx yxm += +−=− +=−+ =−+→=−
62. Since the lines are parallel, 12
Since 12mm ≠ the lines are not parallel. Since 1 2 1 m m
, the lines are not perpendicular. The lines are neither parallel nor perpendicular.
58. Perpendicular. Every horizontal line is perpendicular to every vertical line.
59. Since the lines are parallel, 12mm = .
Using 4 and the point 2,8
Since the lines are perpendicular, 1 2
60. Since the lines are parallel, 12mm = .
3 and the point 4,6
61. Since the lines are parallel, 12mm =
Since the lines are perpendicular,
Since the lines are perpendicular,
66. Since the lines are perpendicular, 1 2 1 m m =−
and the point
67. Since the lines are perpendicular, 1 2
5 Using 5 and the point 2,3
68. Since the lines are perpendicular, 1 2 1 m m =− .
The horizontal line that goes through the point () 3,7 is 7 y = .
71. The student needs to take the negative reciprocal of the original slope to find the slope of the line perpendicular. 3 2 m =−
72. The student needs to take the negative reciprocal of the original slope to find the slope of the line perpendicular. 1 5 m =
73. The student needs to find the slope of the original line. The slopes will be the same if the two lines are parallel. To find the slope of the original line, put it into slope-intercept form.
2514 252142 5214 5214 555 214 55 2 5 xy xyxx yx yx yx m += +−=−
74. The slopes must be the same if the two lines are parallel. To find the slope of the original line put it into slope-intercept form. 6310 3610 10 2 3 2 xy yx yx m −= −=−+ =− =
69. Since the two lines are perpendicular, and the first line is horizontal, then the other line is vertical. The vertical line that goes through the point () 4,3 is 4 x = .
70. Since the two lines are perpendicular, and the first line is vertical, then the other line is horizontal.
75. The point () 2,6 is not the y -intercept, so b is not 6. ()642 648 66486 42 yx yx yx yx −=− −=− −+=−+ =−
76. The point () 7,0 is not the y -intercept, so b is not 7. ()037 321 yx yx −=−− =−+
77. 85.186744.5Pt=+
a. Slope = 85.18. The population of Washington state increases 85.18 thousand each year.
b. The vertical intercept is (0, 6744.5). In 2010, the population of Washington state was 6744.5 thousand.
c. Horizontal intercept:
085.186744.5
6744.585.18
6744.585.18
85.1885.18
79.18
The horizontal intercept is () 79.2,0 . In 1931, the population of Washington State was zero. This is model breakdown.
78. P = 80.7t + 19392.3
a. Slope = 80.7. The population of New York state is increasing by 80.7 thousand people per year.
b. Vertical intercept: (0, 19392.3). In 2010, the population of New York state was 19,392.3 thousand (or 19,392,300) people.
c. Horizontal intercept:
080.719392.3
19392.380.7
19392.380.7
80.780.7
240.3
The horizontal intercept is () 240.3,0. In 1770, the population of New York State was zero. This is model breakdown.
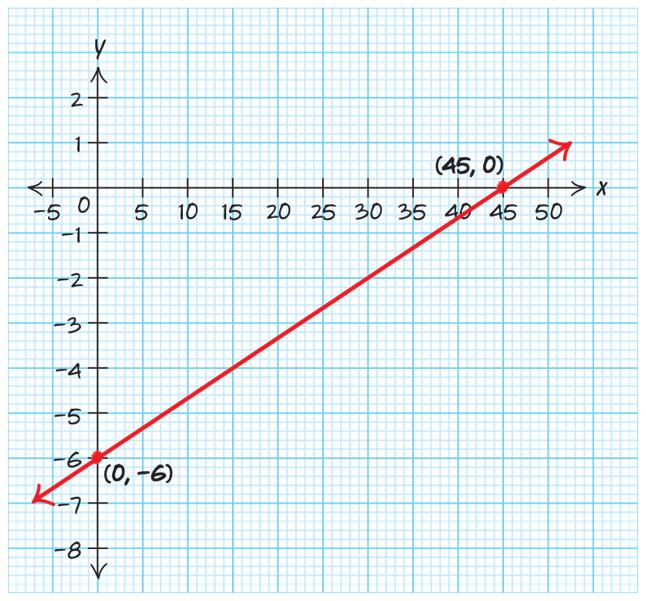
79. 0.39Ca=−
a. Slope = 0.3. The percent of women who have coronary heart disease is increasing by 0.3 percentage points per year of age.
b. The vertical intercept is ()0,9. The percent of women at birth with coronary heart disease is 9%.
This is model breakdown.
c. Horizontal intercept:
00.39
90.3
90.3
0.30.3
The horizontal intercept is (30, 0). Zero percent of 30-year-old women have coronary heart disease. This is model breakdown.
80. 4464.522361.7Wt=+
a. Slope = 4464.5. There is an increase of 4464.5 thousand megawatt hours of wind energy produced in Texas per year.
b. The vertical intercept is (0, 22361.7). In 2010, 22361.7 thousand megawatt hours of wind energy was produced in Texas.
c. Horizontal intercept: 04464.522361.7
22361.74464.5
22361.74464.5
4464.54464.5
5.0 t t t t =+
The horizontal intercept is ()5,0. In 2005, no megawatt hours of wind energy were produced in Texas. This is model breakdown.
81. 5006000Pc=−
a. Slope = 500. The monthly profit for a small used car lot increases by $500 for every car that is sold.
b. The vertical intercept is () 0,6000 . If the small used car lot sells 0 cars, it will lose $6000.
c. Horizontal intercept:
05006000
6000500
6000500
500500 12 c c c c =− = =
The horizontal intercept is (12, 0). The small used car lot will need to sell 12 cars in order to break even in their monthly profit.
82. 0.753500Pc=−
a. Slope0.75 = . There is an increase of $0.75 per customer in profit for the coffee shop.
b. Vertical intercept: (0,3500) . If there are no customers, there is a loss of $3500.
c. Horizontal intercept:
d. Horizontal intercept: 020100 10020 10020 2020 5 h h h h =− = = =
To break even, Janell must tutor five hours.
85.
00.753500
35000.75
35000.75
0.750.75
4666.7 c c c c =− = = ≈
To break even the coffee shop must have 4667 customers.
83.
a. Let P the total profit in dollars Dan earns teaching surfing lessons, and let s be the number of one-hour surf lessons Dan gives. This can be represented by the equation 30700Ps=−
b. Slope = 30. Dan’s earnings increase by $30 for every one-hour surf lesson he gives.
c. The vertical intercept is () 0,700 . If Dan doesn’t give any surf lessons, he will lose $700 in profit.
d. Horizontal intercept:
a. Let T be the total amount of money raised by the PTA for a new track at Mission Meadows Elementary School in dollars, and let a be the total pounds of aluminum cans the PTA recycles.
1.242000Ta=+
b Slope1.24 = . The funds raised by the PTA at Mission Meadows Elementary School increases by $1.24 for every pound of aluminum cans they recycle.
c. The vertical intercept is (0, 2000). The PTA at Mission Meadows Elementary School will have $2000 to put toward a new track if they recycle 0 pounds of aluminum cans.
d. Horizontal intercept: 01.242000
20001.24
030700
70030
70030
3030 23.33 s s s c =− = = ≈
The horizontal intercept is (23.33, 0). Dan will need to give 24 one-hour surf lessons in order to break even.
84. Let P be the profit in dollars Janell earns each month tutoring math students, and let h be the number of hours spent tutoring.
a. 20100Ph=−
b Slope20 = . Janell’s profit increases by $20 per hour spent tutoring.
c. Vertical intercept: (0,100) . If Janell does not tutor any math students, she will lose $100 in profits.
20001.24
1.241.24
1612.9
The horizontal intercept is () 1612.9,0 . The PTA at Mission Meadows Elementary School will need to recycle 1612.9 pounds of aluminum cans in order to earn $0 for a new track. This is model breakdown. 86.
a. Let P be the population of the United States in millions of people t years since 2010.
Use the slope 2.1 and the point (6, 324):
3242.1(6)
3242.112.6
3243242.112.6324 2.1311.4
b. () 2.120311.4 353.4 P P =+ =
In 2030, the population should be about 353.4 million people.
c.
a.
Using two points: (1000,1) and (1500,1.5) 1.51
Find the slope: 0.001 15001000 m ==
Using 0.001 and (1000,1). m =
10.001(1000) 10.0011
4002.1324 4003242.1324324
762.1
762.1
2.12.1 36.2 t
The population of the United States will reach 400 million in 2046.
d. The vertical intercept is () 0,324 . In 2010, the population of the United States was 324 million. 87.
a. Let P be the total percentage of Americans who have been diagnosed with diabetes, and let t be time in years since 2010.
Use ()() 2,8.9 and 4,9.1:
9.18.90.2 Slope0.1 422 ===
Use the point slope form of the equation:
8.90.1(2)
8.90.10.2
8.98.90.10.28.9 0.18.7
This implies 9.7% of Americans will have been diagnosed with diabetes in 2020.
c. Slope = 0.1. The percentage of Americans diagnosed with diabetes increases 0.1 percentage points each year.
88. Let P be the percentage of toy cars that are defective if t toys are produced an hour.
110.00111
0.001(2500) 2.5% P P = =
If 2500 toy cars are produced an hour, then 2.5% will be defective.
c. Slope0.001 = . The percentage of cars that are defective increases by 0.001 percentage points per car produced each hour.
89. Let C be the total cost of shirts in dollars, and let n be the total number of shirts purchased. 8.525Cn=+ a. () 8.55025 42525 450 C C C
It will cost $450 for 50 shirts.
b. Slope = 8.5. The cost per shirt increases by $8.50 per shift.
c. The vertical intercept is (0, 25). It costs $25 if 0 shirts are purchased. This is model breakdown.
d.
08.525 258.5 258.5 8.58.5 2.94 n n n n =+ −= = −≈
The horizontal intercept is () 2.94,0 . To pay $0, you would have to purchase 3 shirts. This is model breakdown.
90. Let C be the cost in dollars, and j be the number of jerseys. 14150Cj=+ .
It will cost $710 for 40 jerseys.
b. Slope = 14. The cost increases by $14 per jersey.
c. The vertical intercept is (0, 150). It costs $150 if 0 jerseys are purchased. This may be model breakdown.
92. 78.131909.7Pt=+ , where P is the population of Nevada (in thousands) t years since 2000.
a.
The horizontal intercept is () 10.7,0 . When 10.7 jerseys are ordered, the cost is $0. This is model breakdown.
91. Let P be the total population of Washington state in thousands, and let t be the years since 2000.
104.55383.5Pt=+ a.
104.5305383.5
31355383.5
In 2030, the population of Washington state will be about 8518.5 thousand.
b. Slope = 104.5. The population of Washington state increases by 104.5 thousand each year.
c. The vertical intercept is (0, 5383.5). In 2000, the population of Washington state was 5383.5 thousand.
d.
0104.55383.5
5383.5104.5
5383.5104.5 104.5104.5
The horizontal intercept is () 51.52,0 . In 1949, the population of Washington State was zero. This is model breakdown.
78.13(30)1909.7
2343.91909.7
4253.6
The population of Nevada will be about 4253.6 thousand in 2030.
b. Slope: 78.13 m = . This means that the population of Nevada increases by 78.13 thousand each year.
c. Vertical intercept: (0,1909.7) . In 2000, the population of Nevada was 1909.7 thousand.
d. Horizontal intercept:
078.131909.7
1909.778.131909.71909.7
1909.778.13
1909.778.13
78.1378.13
24.4
In 1975, the population of Nevada was zero. This is model breakdown.
93. 5100Wh=+ , where W is the weight of the woman, and h is the number of inches past 5 feet.
a.
6 feet is 12 inches over 5 feet.
Use 12: 512100 60100 160 h W W W =
The optimal weight of a woman who is 6 feet tall is 160 pounds.
b. Slope = 5. For every inch taller than 5 feet, a woman’s optimal weight increases 5 pounds.
c. The vertical intercept is (0, 100). A woman’s optimal weight at 5 feet tall is 100 pounds.
d. 05100 1005 1005 55 20 h h h h
The horizontal intercept is () 20,0 . At 3 feet 4 inches, a woman’s optimal weight is 0 pounds. This is model breakdown.
94. 6106Wh=+ , where W is the optimal weight of a man in pounds and h is the number of inches past 5 feet.
a.
6 feet is 12 inches over 5 feet. Use 12:
The optimal weight of a man who is 6 feet tall is 178 pounds.
b. Slope = 6. For every inch taller than 5 feet, a man’s optimal weight increases 6 pounds.
c. The vertical intercept is (0, 106). A man’s optimal weight at 5 feet tall is 106 pounds.
b. Slope = 262.64. National healthcare expenditures for the United States are increasing by about $262.64 billion per year.
c. The vertical intercept is () 0,878.33. In 2000, national healthcare expenditures for the United States were $878.33 billion. This is model breakdown.
d.
The horizontal intercept is () 17.7,0 . At 3 feet 6 inches, a man’s optimal weight is 0 pounds. This is model breakdown.
95. Let H be the national healthcare expenditures in the United States in billions of dollars, and let t be time in years since 2000.
262.64878.33Ht=−
In 2022, national healthcare expenditures for the United States will reach $4899.75 billion.
0262.64878.33
262.64878.33
262.64878.33
262.64262.64
3.3
The horizontal intercept is ()3.3,0. In 2003, national healthcare expenditures for the United States were zero. This is model breakdown.
96. 536465Ht=−+ , where H is the number of hospitals in the United States t years since 2000. a.
53(20)6465 10606465 5405 H H H
There will be about 5405 hospitals in the United States in the year 2020.
b. Slope: 53. m =− The number of hospitals in the United States is decreasing by 53 each year.
c. Vertical intercept: (0,6465). In the year 2000, there were 6465 hospitals in the United States.
d. Horizontal intercept: 0536465
646553
646553 5353
122.0 t t t
The horizontal intercept is (122.0, 0). In 2122, there will be no hospitals in the United States. This is model breakdown.
Section 1.5
1. This is not a function because two children the same age may not be in the same grade.
Input: a = years old.
Output: G = grade level of student.
2. This is not a function because two people the same age may have different salaries.
Input: a = years old.
Output: S = salary in dollars.
3. This is not a function because two children the same age may not be the same height.
Input: a = years old.
Output: H = heights in inches of children attending Mission Meadows Elementary School.
4. This is a function.
Input: w = weight in ounces.
Output: P = postage in dollars.
5. This is a function.
Input: t = years after starting the investment.
Output: I = interest earned from an investment in dollars.
6. This is not a function because during the year the price may fluctuate.
Input: t = year.
Output: P = price in dollars for Nike shoes.
7. This is not a function because each year there will be several songs at the top of the pop charts.
Input: y = year.
Output: S = song at the top of the pop charts.
8. This is a function.
Input: m = month.
Output: B = number of students who have a birthday.
9. This is a function.
Input: t = year.
Output: T = amount of taxes you paid in dollars.
10. This is a function.
Input: m = month.
Output: A = number of tourists visiting Arizona.
11. This is a function. Every input value is unique.
12. This is a function. Every input value is unique.
13. This is not a function, because the input of 1 hour of poker play is related to two different amounts of winnings.
14. This is not a function, because the input of 1 year in college is related to two different amounts of credits earned.
15. This is a function. Every input value is unique.
16. This is a function. Every input value is unique.
17. This is not a function, because the input of Monday is related to two different amounts of money spent on lunch.
18. This is not a function, because the input of 5’10” is related to two different weights.
19. Domain: {Jan., Feb., May, June}
Range: {5689.35, 7856.12, 2689.15, 1005.36}
20. Domain: {2011, 2012, 2013, 2014, 2015}
Range: {16807, 16180, 15365, 17200, 17807}
21. Domain: {1, 2, 3, 4, 5}
Range: { }650,100,150,60,125,200,300
22. Domain: { }14,59,1014,1519
Range: {12, 15, 18, 21}
23. 99% of 20-year-olds use the Internet.
24. 96% of 40-year-olds use the Internet.
25. In 2012, women-owned small businesses were awarded $16,180 million of contracts.
26. In 2015, women-owned small businesses were awarded $17,807 million of contracts.
27. The amount spent on lunch on Tuesday was $5.95 and $6.33.
28. The amount spent on lunch on Friday was $15.26 and $20.36.
29. Yes, this is a function. Each input has one output.
30. Yes, this is a function. Each input has one output.
31. No, this is not a function. The 2 y means some inputs have more than one output.
32. Yes, this is a function. Each input has one output.
33. Yes, this is a function. Each input has one output.
34. No, this is not a function. The ± means some inputs have more than one output.
35. Yes, this is a function. The graph passes the vertical line test.
36. No, this is not a function. The graph fails the vertical line test.
37. Yes, this is a function. The graph passes the vertical line test.
38. No, this is not a function. The graph fails the vertical line test.
39. No, this is not a function. The graph fails the vertical line test.
40. Yes, this is a function. The graph passes the vertical line test.
41.
a. ()086.5. W = On the first day of starting a diet, a person’s weight will be 86.5 kg.
b ()1082 W = . Ten days after starting a diet, a person’s weight will be 82 kg.
c 75 W = when 30 d = . Thirty days after starting a diet, a person’s weight will be 75 kg.
d ()10088 W = . One hundred days after starting a diet, a person’s weight will be 88 kg.
42.
a ()19951973 F = . The value of the fresh fruit exported in 1995 was $1973 million.
b 1971 F = when 1996 t = . The value of the fresh fruit exported in 1996 was $1971 million.
c. ()20002077 F = . The value of the fresh fruit exported in 2000 was $2077 million.
43.
a ()58 C = . Eight ounces of chocolate were consumed in the Clark household on the fifth day of the month.
b 20 C = when 15 d = . Twenty ounces of chocolate were consumed in the Clark household on the 15th day of the month.
c ()3028 C = . Twenty-eight ounces of chocolate were consumed in the Clark household on the 30th day of the month.
44.
a ()112 C = . There are 12 cyclists on the bike trail at 6 A.M.
b 40 C = when 2 h = . There are 40 cyclists on the bike trail at 7 A.M.
c ()98 C = . There are 8 cyclists on the bike trail at 2 P.M.
45.
a ()Ohio11.61 P =
b. ()Texas27.8626 P =
c. () Wyoming0.585501 P =
46.
a ()20012392 F =
b. ()20032245 F =
c. ()20051937 F =
47.
a.
() () 13 55 13 10 55 13 5105 55 503 47 fxx x x x x =+ =+
d. Domain: All real numbers, Range: All real numbers
51. () 18 gx =−
a. ()218 g =−
b ()1118 g −=−
c. Domain: All real numbers, Range: { }18
52. () 12.4 hx =
a. ()512.4 h =
b. ()12312.4 h −=
c. Domain: All real numbers, Range: { }12.4
53.
Ashlyn set 20 x = and solved for () 20 f .
The correct solution is: () 48 2048 208488 124 3 fxx x x x x =+ =+ −=+− = = 54.
JT set () 24 fx =− and solved for x
The correct solution is: () ()() ()() () 48 48 244248 2488 fxx f
55.
Alicyn should not have restricted the domain and range.
The correct solution is: Domain: All real numbers, Range: All real numbers 56.
Wyatt reversed the domain and range.
The correct solution is: Domain: All real numbers, Range: { }8
57. a. () ()() ()() () () 3.24.8 3.24.8 23.224.8 26.44.8 21.6 fxx f f f f =− =− =− =− = b. () ()() ()() () () 3.24.8 3.24.8 143.2144.8 1444.84.8 1449.6 fxx f f f f =− =− −=−− −=−−
c. () 3.24.8 103.24.8 104.83.24.84.8 5.23.2 5.23.2 3.23.2 1.625 fxx x x x x x =− −=− −+=−+ −= = =−
d. Domain: All real numbers, Range: All real numbers
58. a. () ()() ()() () 4.35 4.35 154.3155 1569.5 gxx g g g =−− =−− =−− =−
d. Domain: All real numbers, Range: All real numbers 59. a.
b. () ()() ()() () 25740 25740 192519740 191215 fxx f
c. Domain: All real numbers, Range: All real numbers
60. a.
d. Domain: All real numbers, Range: All real numbers
61.
a. ()32 f =
b. ()28 f −=−
c. 1 x =−
d. Domain: All real numbers, Range: All real numbers
e. Vertical intercept: () 0,4 . This is the point the graph crosses the y-axis.
Horizontal intercept: () 2,0 . This is the point the graph crosses the x-axis.
62.
a. ()18 g =−
b. ()34 g −=
c 2 x =−
d. Domain: All real numbers, Range: All real numbers
e. Vertical intercept () 0,5 . This is the point the graph crosses the y-axis.
Horizontal intercept () 1.7,0 . This is the point the graph crosses the x-axis.
63.
a. ()2550 f =
b. ()100275 f =
c 75 x =
d. Domain: All real numbers, Range: All real numbers
e. Vertical intercept () 0,25 . This is the point the graph crosses the y-axis.
Horizontal intercept () 8,0 . This is the point the graph crosses the x-axis.
64.
a. ()530 h =
b. ()200 h =
c 10 x =
d. Domain: All real numbers, Range: All real numbers
e. Vertical intercept () 0,40 . This is the point the graph crosses the y-axis.
Horizontal intercept () 20,0 . This is the point the graph crosses the x-axis.
65.
a. ()23 h =
b. ()54 h =−
c. 0.2 and 4.2 xx=−=
d. Domain: All real numbers, Range: (,3] −∞
e. Vertical intercept () 0,0 . This is the point the graph crosses the y-axis.
Horizontal intercepts () 0,0 and () 4,0 . These are the points the graph crosses the x-axis. 66.
a. ()12 f =
b. 1 x = and 5 x =
c. Domain: all real numbers, Range: ( ] ,6−∞
d. Vertical intercept: ()0,3. This is the point at which the graph crosses the y-axis.
Horizontal intercepts () 0.5,0 and ()5.5,0. These are the points at which the graph crosses the x-axis.
67.
a. ()52 g −=
b. 5.5 x =− and 0.5 x =
c. Domain: all real numbers, Range: [ ) 3, −∞
d. Vertical intercept: ()0,2. This is the point at which the graph crosses the y-axis.
Horizontal intercepts () 4.5,0 and ()0.5,0. These are the points at which the graph crosses the x-axis.
68.
a. ()314 g =
b. ()49.5 g −=
c. 0.8 x = and 2.8 x =−
d. Domain: All real numbers, Range: [4,) ∞
e. Vertical intercept () 0,4.5 . This is the point the graph crosses the y-axis.
Horizontal intercept: none, because the graph does not cross the x-axis.
69.
a. ()12 h =
b. 3 x =−
c. Domain: [ ] 4,4, range: [ ]3,5
d. Vertical intercept: ()0,2.4. This is the point at which the graph crosses the y-axis.
Horizontal intercept: () 2.25,0. This is the point at which the graph crosses the y-axis.
70.
a. ()33 f −=−
b. 1 x =
c. Domain: [ ] 5,4, Range: [ ]4,5
d. Vertical intercept: ()0,2. This is the point at which the graph crosses the y-axis.
Horizontal intercept ()2,0. This is the point at which the graph crosses the x-axis.
71.
a. ()31.5 g −=
b. 2.5, x =− 1, x = and 2 x =
c. Domain: [ ] 4,4, Range: [ ] 2,6
d. Vertical intercept: ()0,3. This is the point at which the graph crosses the y-axis.
Horizontal intercept: ()3.5,0. This is the point at which the graph crosses the x-axis.
72.
a. ()22.5 h −=
b. 2.4, x =− 0.4, x =− and 3.5 x =
c. Domain: [ ] 3,4, Range: [ ] 1,4
d. Vertical intercept: ()0,1.4. This is the point at which the graph crosses the y-axis.
Horizontal intercepts: ()3,0, ()0.9,0, and ()3,0.
There are the points at which the graph crosses the xaxis.
73.
a. ()110 h −=
b. 2.5 x =−
c. Domain: ()4,5, Range: () 10,20
d. Vertical intercept: ()0,7. This is the point at which the graph crosses the y-axis.
Horizontal intercept: ()2,0. This is the point at which the graph crosses the x-axis.
74.
a. ()44 f −=−
b. 2.8 x =
c. Domain: ()6,8, Range: () 6,10
d. Vertical intercept: ()0,1. This is the point at which the graph crosses the y-axis.
Horizontal intercept: ()0.8,0. This is the point at which the graph crosses the x-axis.
75.
a. ()23.5 g −=−
b. 1 x = and 3 x =−
c. Domain: [ ] 5,3, Range: [ ]4,3
d. Vertical intercept: () 0,3.5. This is the point at which the graph crosses the y-axis.
Horizontal intercepts: () 4,0 and ()2,0. These are the points at which the graph crosses the x-axis.
76.
a. ()11 h −=
b. 1.5 x =− and 3.5 x =
c. Domain: [ ] 2,4, Range: [ ] 3,4
d. Vertical intercept: () 0,3.25. This is the point at which the graph crosses the y-axis.
Horizontal intercepts: () 1.25,0 and () 3.25,0.
These are the points at which the graph crosses the xaxis.
77.
a. ()34 h −=
b. 4 x =− and 2 x =−
c. Domain: ()6,0, Range: ( ] 5,4
d. There is not a vertical intercept, as () 0,5 is not actually on the graph.
Horizontal intercepts: () 5,0 and ()1,0. These are the points at which the graph crosses the x-axis.
78.
a. ()22 f =−
b. 1.7 x =− and 1.7 x =
c. Domain: ()3,3, Range: [ ) 5,2
d. Vertical intercept: ()0,5. This is the point at which the graph crosses the y-axis.
Horizontal intercepts: () 2.5,0 and ()2.5,0. These are the points at which the graph crosses the x-axis.
a. Domain: [ ] 0,9, Range: [ ] 7.5,60
b. In 2018, the North American E-sports audience was about 54 million people.
c. In 2011, the North American E-sports audience was about 15 million people.
d. The vertical intercept is (0, 7.5). In 2010, the North American E-sports audience was about 7.5 million people.
e. Using (0, 7.5) and (6, 42.5),
42.57.535 6 5 06 .83 m == ≈
The North American E-sports audience is increasing by about 5.83 million people per year.
2.
a. Domain: [ ] 2,8, Range: [ ]3.5,4.1
b. In 2017, the population of Georgia was about 3.56 million.
c. In 2007, the population of Georgia was about 4.1 million.
d. The vertical intercept is (0, 3.92). In 2010, the population of Georgia was about 3.92 million people.
e. Using (0, 3.92) and (7, 3.56),
3.563.920.36 707 0.05 m ≈ ==
The population of Georgia is decreasing by about 0.05 million (50,000) people per year.
3. (A) and (F)
4. (C) and (E)
5. (C) and (E)
6. (C) and (F)
7. 50
8. 25
9. 0.01
10. 0.0001
11. 50 12. 500
13. 10,000
14. 2,000,000 15.
a. Dependent variable: C = Cost in dollars for producing chocolate-covered ice cream bars. Independent variable: b = Number of bars produced. b.

c. Domain: 0200 b ≤≤ , Range: 240485 C ≤≤
d. When b = 200, then C = $485. The cost of producing 200 chocolate-covered ice cream bars is about $485. 16.
a. Dependent variable: C = Cost to produce custom printed metal pens in dollars. Independent variable: p = number of pens produced in hundreds. pC 1 90 2 125 10 405
1805
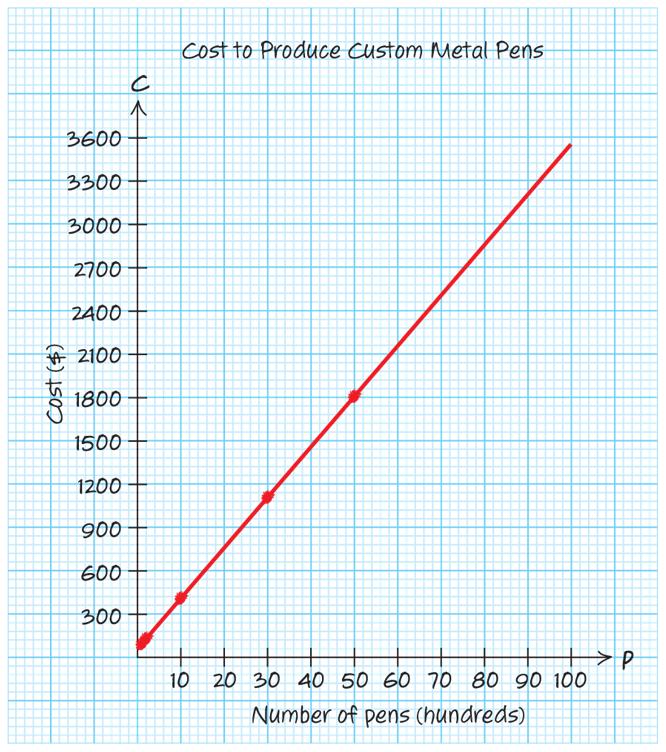
c. Domain: 0.5100 p ≤≤ , Range: 703600 C ≤≤
d. When 5 p = , then 230 C ≈ . The cost to produce 500 custom printed metal pens is approximately $230.
17.
a. Independent variable: t = Time in years since 2010
Dependent variable: U = Net income for Under Armour Inc. in millions of dollars
b.
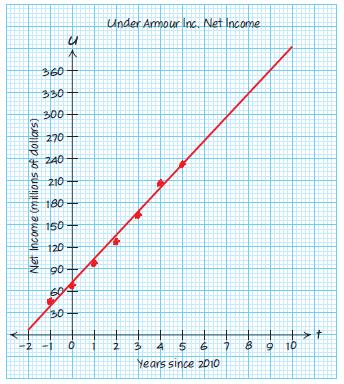
c. Domain: 28, t −≤≤ Range: 6330 U ≤≤
d. When t = 8, then 330. U ≈ In 2018, Under Armour Inc. had net sales of about $330 million.
18.
a. Independent variable: t = Time in years since 2010
Dependent variable: N = Net income (in millions of dollars) for Home Depot.
2620
3338
3883
4535
5385
6345
7009

c. Domain: 29 t −≤≤ , Range: 18009900 N ≤≤
d. When 8, t = then 9100. N ≈ In 2018, the net income for Home Depot will be about $9100 million.
19. Maria’s model fits the data better. The line of best fit passes through the middle of the data, and there is a smaller variance between it and the data points.
20. Maria’s answer is not reasonable. The vertical intercept is (0, 1.75), which means in 2000, there were 1.75 million people 65 and older in the United States with Alzheimer’s Disease. Maria’s answer was incorrect as she has the horizontal intercept at ()8,0.
21 [] 15,50 is not a reasonable domain because the model predicts a negative number of people with Alzheimer’s Disease. This is model breakdown. Domain: []0,60, Range: [] 1.75,15.75
22. Maria’s answer is not reasonable. The model shows that in 2010, there were about 4.75 million bases of Alzheimer’s Disease in the United States among people 65 and older. 23.
a. Independent variable: t = Years since 2000 Dependent variable: P = Population of the United States in millions
b.
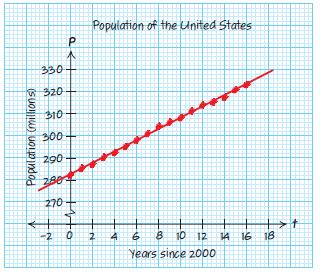
c. When 18, t = then 330. P ≈ The population of the United States in 2018 will be around 330 million people.
d. Domain: [ ]2,18 , Range: [ ] 277,330
e. Vertical intercept: () 0,282.5
f. In 2000, there were approximately 282.5 million people in the United States.
24
a. Dependent variable: P = Population of Florida in millions
= Number of
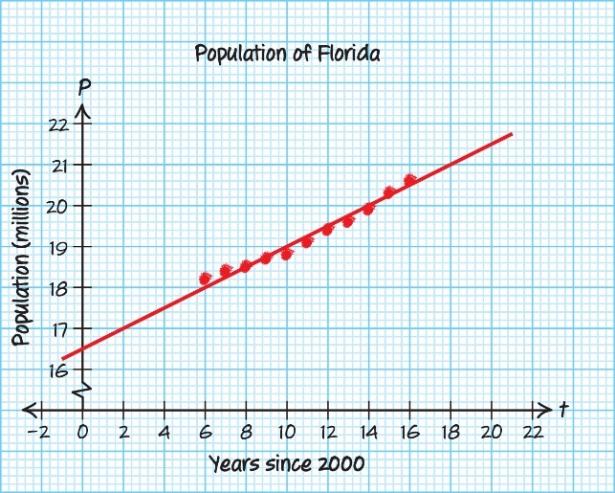
c Domain: [ ] 0,20, Range: [ ]16.5,21.5
d. When 19, t = then 21.3 P ≈ . In 2019, the population of Florida will be about 21.3 million.
e. Vertical intercept: (0,16.5)
f. In 2000, there were about 16.5 million people in Florida.
25.
a. Let D be the number of opioid-related deaths in Wisconsin t years since 2010.

b. When t = 6, then D = 685. In 2016, there were about 685 opioid-related deaths in Wisconsin.
c. There were about 550 opioid-related deaths in Wisconsin in 2013.
d. Domain: 26, t −≤≤ Range: 6 405 38 D ≤≤ 26.
a. Let D be the death rate per 100,000 people for diseases of the heart in the United States tyears since 2000.
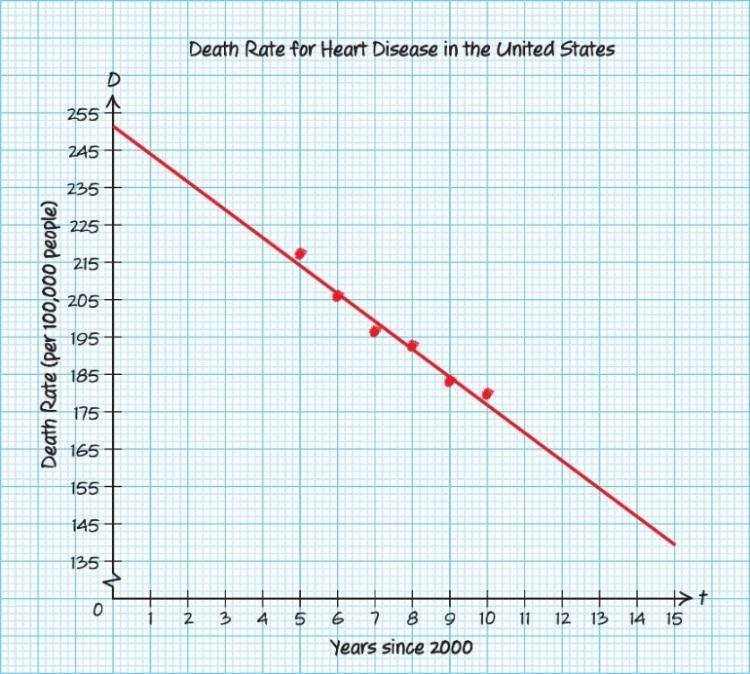
b. In 2012, the death rate per 100,000 will be about 150.
c. Domain: [] 0,15 , Range: [] 250,140
d. In 2013, the death rate from diseases of the heart was about 155 per 100,000.
e. Vertical intercept: () 0,251
f. In 2000, the death rate from diseases of the heart was 251 per 100,000 population. 27.
a. Let T be the number of additional years someone is expected live in the United States if they are a years in age.
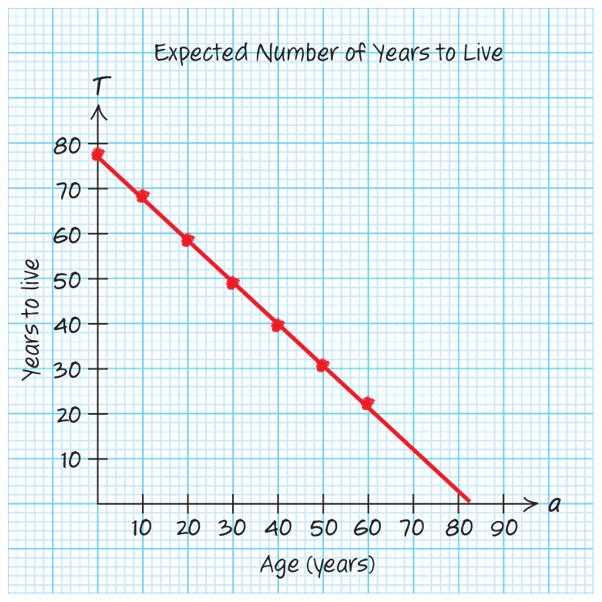
b. When a = 45, then T = 35. According to the model, a 45-year-old person will live around 35 additional years.
c. Domain: [] 0,80 , Range: [] 3,77.5
d. The graphical model predicts a 90-year-old to live negative additional years. This is model breakdown.
e. The vertical intercept is () 0,77.5
f. At birth, a person will live about an additional 77.5 years. 28
a. Let S be the salary for teachers in thousands of dollars and let E be the number of years of experience.
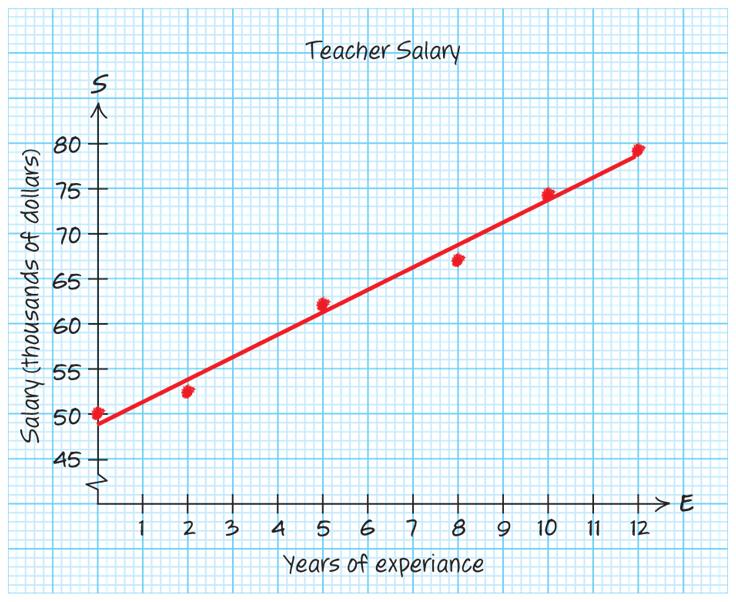
b. When 7, E = then 66 S ≈ . A teacher with 7 years of experience should be making approximately $66,000.
c. Domain: [0,16] , Range: [49.9,88.6]
d. A teacher with about 4.5 years of experience will earn $60,000 per year.
e. The vertical intercept is (0,49.9).
f. An instructor with 0 years of experience will earn about $49,900 per year.
29.
a. Let S = Etsy.com’s annual merchandise sales in millions of dollars and t = time in years since 2010.
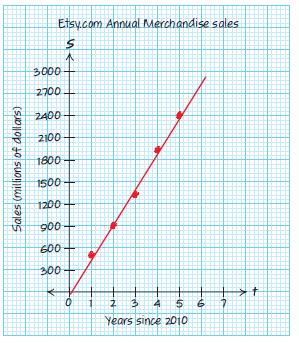
b. Domain: 16, t ≤≤ Range: 8 522050 S ≤≤
c. Etsy.com had about $3 billion worth of annual merchandise sales in 2017.
d. Vertical intercept () 0,10≈−
e. In 2010, Etsy.com had about $10 million worth of annual merchandise sales. This is model breakdown.
30.
a. Let S = Etsy.com’s active sellers (in thousands) and t = time in years since 2010.

b. Domain: [0,12] , Range: [ ] 400,3100
c. Etsy.com will have 3 million active sellers in about 2021.
d. The vertical intercept is () 0,400
e. In 2010, Etsy.com had about 400,000 active sellers.
31. Two points on the line are ()() 11,10,252.50xy = and ()() 22,150,427.50xy = . 427.50252.50175$1.25 Slope 150101401 bar ===
The cost increases by $1.25 for every chocolatecovered ice cream bar produced.
32. Two points on the line are ()() 11,1,90xy = and ()() 22,50,1805xy = . 1805901715$35 Slope 501491 hundred pens ===
For every 100 custom metal pens produced, the cost increases by $35.
33. Two points on the line are ()() 11,0,72xy = and ()() 22,5,232.57xy = 232.5772160.57$32.1 million Slope 5051year ==≈
Each year the net income increases by approximately $32.1 million.
34. Two points on the line are ()() 11,0,3338xy = and ()() 22,5,7009xy = . 700933383671$734.2 million Slope 5051year ===
Each year Home Depot’s net income increases by $734.2 million.
35. Two points on the line are ()() 11,0,283xy = and ()() 22,16,324xy = . 324283412.6 million Slope 160161year ==≈
Each year the population of the United States increases by 2.6 million.
36. Two points on the line are ()() 11,6,18xy = and
()() 22,16,20.5xy = 20.5182.50.25 million Slope 166101year ===
Each year the population of Florida increases by 0.25 million (250,000).
37. Two points on the line are ()() 11,0,425xy = and
()() 22,5,640xy = 64042521543 deaths Slope 5051year ===
Each year the number of opioid-related deaths in Wisconsin increases by 43.
38. Two points on the line are ()() 11,0,251xy = and
()() 22,14,147xy = 1472511047.4 deaths per 100,000 people Slope 140141year ==≈
Each year the death rate (per 100,000 people) for diseases of the heart in the United States decreases by 7.4.
39. Two points on the line are ()() 11,0,77xy = and
()() 22,70,12xy =
1277650.93 year to live Slope 700701year in age ==≈
For each year increase in age, the expected number of additional years someone will live in the United States decreases by 0.93 year, or around 11 months.
40. Two points on the line are ()() 11,0,49xy = and
()() 22,12,79xy =
794930$2.5 thousand
Slope 120121year of experiance ==≈
For each year in experience, a teacher’s salary increases by $2.5 thousand, or $2500.
41. Graph this line using the intercepts because the equation of the line is in general form.
3848 xy −+=−
-intercept: y-intercept:

42. Graph this line using the intercepts because the equation of the line is in general form.
3742 xy−=− x-intercept: y-intercept:

43. Graph this line using the slope and the yintercept.
The y-intercept is ()0,7, and the slope is 2 2. 1 −=
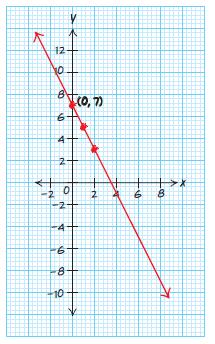
44. Graph this line using the slope and the yintercept. () 3 96 2 3 99 2 3 2 yx
The y-intercept is ()0,0, and the slope is 3 2
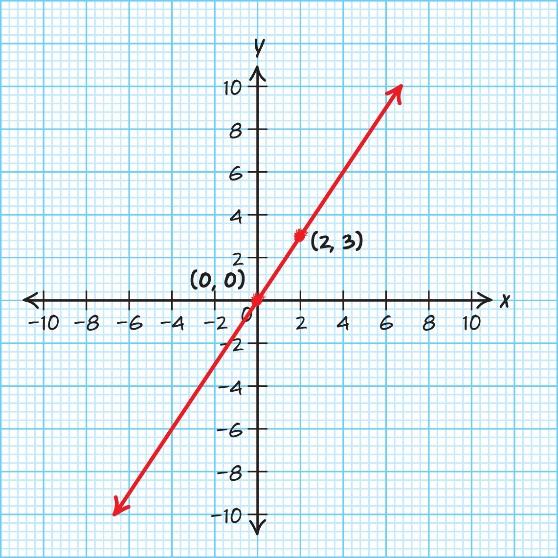
45. Graph this line using a table of values.
517xy=−+
yx Point
0 17 (17, 0)
1 12 (12, 1)
2 7 (7, 2)
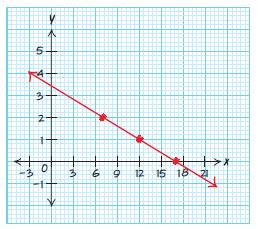
46. Graph this line using a table of values.
35xy=−
yx Point 0 5 () 5,0 1 2 () 2,1 2 1 () 1,2
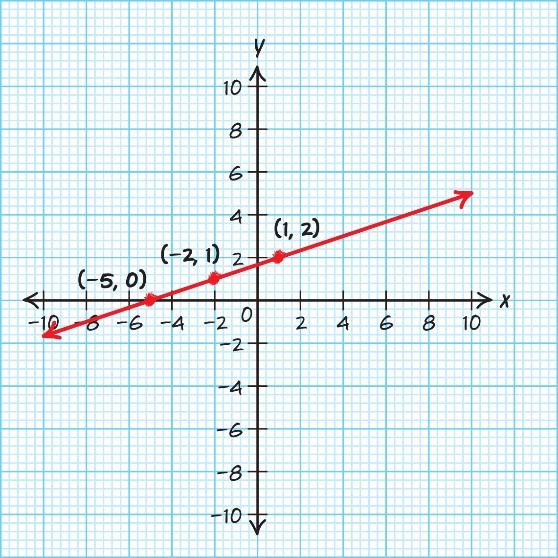
47. Graph this line using the slope and the yintercept.
8.5 y = has a slope of 0 and a y-intercept of ()0,8.5.
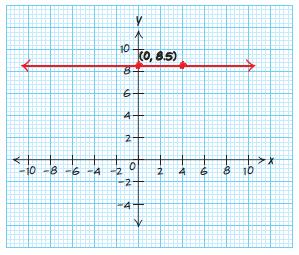
48. Graph this line using the slope and the yintercept.
0 y = has a slope of 0 and a y-intercept of ()0,0. This line is the x-axis.
49. Graph this line using the slope and the yintercept.
3.5 x =− has undefined slope and is thus a vertical line. The line has no y-intercept but passes through xintercept ()3.5,0.

50. Graph this line using the slope and the yintercept.
6.9 x = has undefined slope and is thus a vertical line. The line has no y-intercept but passes through xintercept ()6.9,0.
51. ()44 0 0 707 m === () ()() 11 400 40 4 yymxx yx y y −=−
7.57.50 0
The line 3 6 2 yx=−+ has slope 3 , 2 m =− so a line parallel to 3 6 2 yx=−+ also has slope 3 . 2 m =−
The y-intercept of the parallel line is ()() 0,0,7, b = so the slope-intercept-form equation of the line is 3 7. 2 yx=−+ 54.
The line 715yx=−+ has slope 7, m =− so a line parallel to 715yx=−+ also has slope 7. m =−
The y-intercept of the parallel line is ()0,3.5, so the slope-intercept-form equation of the line is 73.5.yx=−−
55. () 628 , 6.16.10 m == which is undefined.
This is a vertical line with equation 6.1. x =− 56. 415 , 22 0 33 m == which is undefined.
This is a vertical line with equation 2 . 3 x =
57.
The line 512yx=−+ has slope 5, m =− so a line perpendicular to 512yx=−+ would have slope 1 , 5 m =
can run different numbers of miles, there is not a unique output for each input, and this is not a function.
61. Input: time oven has been turned on in minutes. Output: temperature of oven. Since at any given time the oven has exactly one temperature, there is a unique output for each input, and this is a function.
62. Input: the number of miles a car has been driven. Output: the amount of gas remaining in the gas tank. Since at any given mileage there is just one amount of gas remaining in the gas tank, there is a unique output for each input, and this is a function.
63.
a ()22 f =
b. 4 x = when () 4 fx =−
c. Domain: all real numbers, Range: all real numbers
d. vertical: ()0,8, horizontal: 8 ,0 3 ⎛⎞ ⎜⎟ ⎝⎠
64.
58.
The line 6 2 x y =− has slope 1 , 2 m = so a line perpendicular to 6 2 x y =− would have slope 2. m =−
59. Input: age of person (years). Output: average number of texts received daily. Since different people of the same age would have different average numbers of texts received daily, there is not a unique output for each input, and this is not a function.
60. Input: age of person (years). Output: how far the person can run (miles). Since different people of the same age are in different physical conditions and thus
a. ()20 f =
b. 2.5 x = when () 2 fx =
c. Domain: all real numbers, Range: all real numbers
d. vertical: ()0,8, horizontal: () 2,0
65.
a. ()13 f =−
b. 3 x =± when () 5 fx =
c. Domain: all real numbers, Range: [ ) 4, −∞
d. vertical: ()0,4, horizontal: () 2,0±
66.
a. ()21 f −=
b. 3 x =± when () 4 fx =−
c. Domain: all real numbers, Range: ( ],5−∞
d. vertical: ()0,5, horizontal: () 2.2,0±
67. The red line has greater slope since it is steeper in the positive direction. The red line is increasing.
68. The red line has greater slope since it is steeper in the positive direction. The red line is increasing.
69. The blue line has greater slope since it is less steep in the negative direction. Its slope is less negative than the slope of the red line. The red line is decreasing.
70. The blue line has greater slope since it is less steep in the negative direction. Its slope is less negative than the slope of the red line. The red line is decreasing.
71. Each line is horizontal and thus has slope 0, so neither line has the greater slope. The red line is neither increasing nor decreasing.
72. Each line is horizontal and thus has slope 0, so neither line has the greater slope. The red line is neither increasing nor decreasing.
9. x-scl = 1 , y-scl = 5
10. x-scl = 3 , y-scl = 6
11. x-scl = 1 , y-scl = 0.1
12. x-scl = 3 , y-scl = 0.01
13. The student switched the min and max for the xvalues.
Here is a reasonable window:
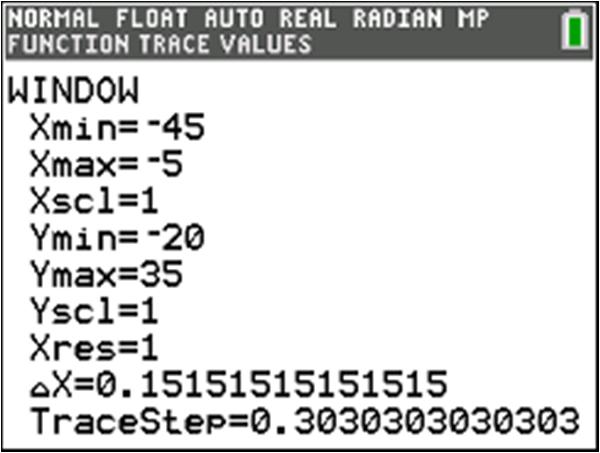
14. The student switched the x-values for max and min with the y-values for max and min.
Here is a reasonable window:

15. a. Let R be the revenue in thousands of dollars for Quick Tire Repair, Inc. and t be the years since 2010.
Our input-output pairs look like:

Here is one example of a reasonable window:
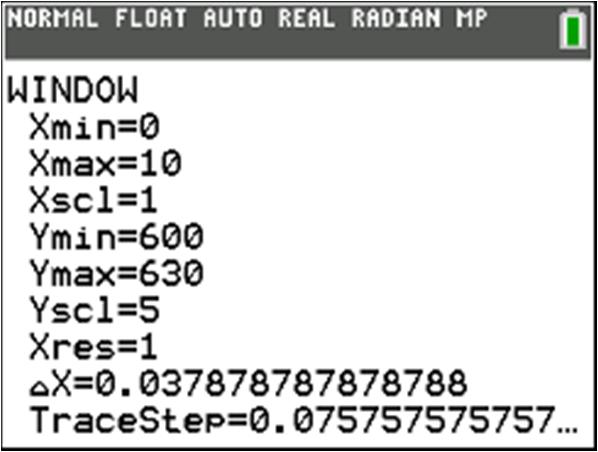
Using this window, our scatterplot looks like:
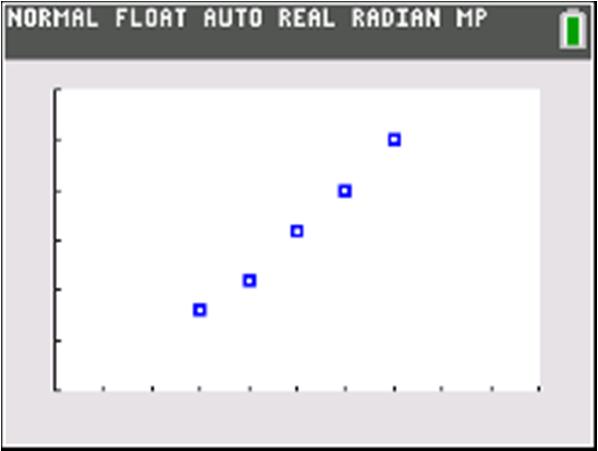
We can get a good straight-line fit using the points () 3,608 and () 7,625 .
The slope is difference in output625608 4.25 difference in input73 == .
We can use the point-slope form with () 3,608 :
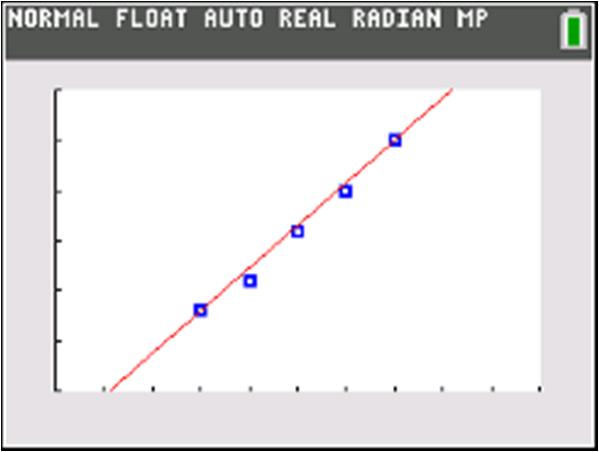
The equation for this model is:
() 4.25595.25Rtt=+
b. Our domain contains [] 3,7 . We can try going moving each endpoint out by a few units.
We will try [] 0,10 as the domain.
04.250595.25595.25
104.2510595.25637.75
There are no obvious cases of model breakdown. One example of a reasonable domain and range:
Domain: [] 0,10
Range: [] 595.25,637.75
c. If 700 R = then:
4.25595.25700
4.254.25 24.6 t t t t += = =
4.25104.75
4.25104.75
According to this model, the revenue for Quick Tire Repair, Inc. will be closest to $700 thousand in either 2034 or 2035.
d. The slope is 4.25. This means that in our model, the revenue for Quick Tire Repair, Inc. will increase by about $4.25 thousand = $4250 each year. 16.
a.
Let c be the number of chocolate bars made and let T be the number of hours it takes to make the bars.
Our input-output pairs look like:
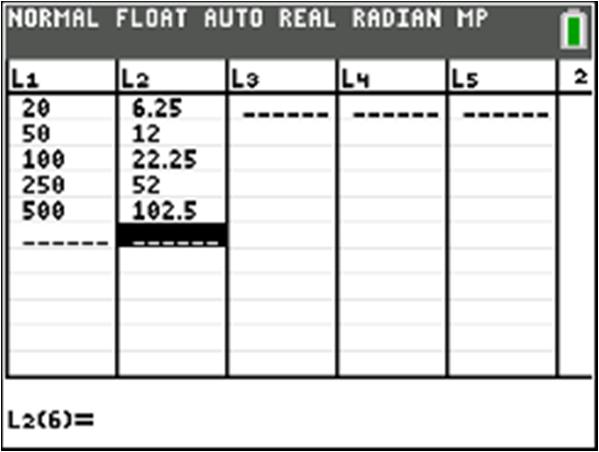
Here is one example of a reasonable window:

Using this window, our scatterplot looks like:
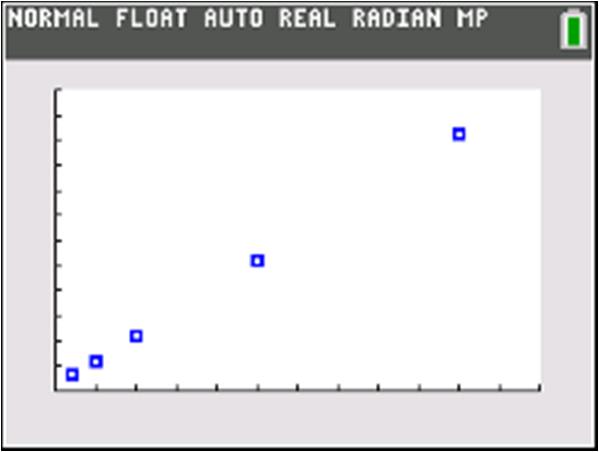
We can get a good straight-line fit using the points () 20,6.25 and () 500,102.5
The slope is 0 difference in output102.56.25 difference in input50 0 0 2 20 =≈
We can use the point-slope form with () 20,6.25 :
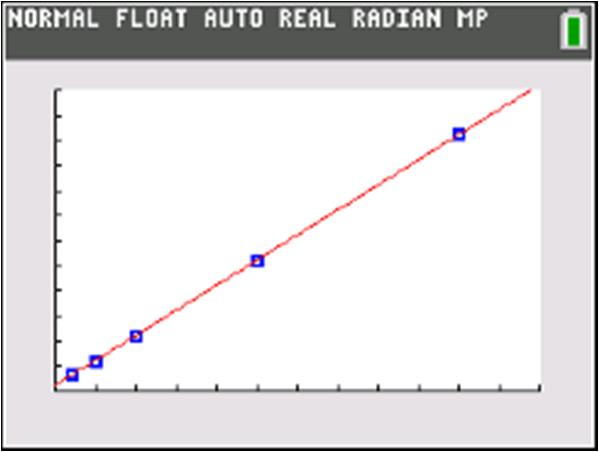
The equation for this model is: () 0.202.25Tcc
b.
Our domain contains [] 20,500 . We can try going moving each endpoint out by a relatively small amount, but it is worth noting that 0 c = should not be part of the domain, because it does not make sense
to say that making zero chocolate bars takes a nonzero amount of time (unless it is clearly stated that this includes time for ancillary activities such as preparing the kitchen).
We will try [] 10,600 as the domain.
There are no obvious cases of model breakdown.
One example of a reasonable domain and range:
Domain: [] 10,600
Range: [] 4.25,122.25
c.
If 75 T = then:
0.202.2575
One example of a line that fits well is: 2.58yx=+
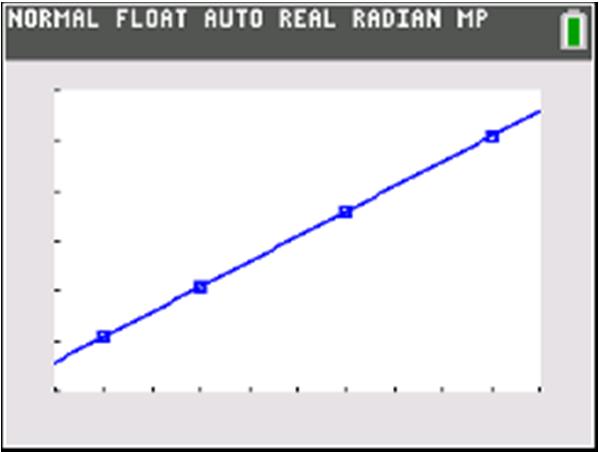
(Answers may vary.) 18.
0.2072.75
0.2072.75
0.200.20 36 c c c c
4
The chocolate bar makers can produce about 364 chocolate bars in 75 hours.
d. The slope is 0.20. This means that in our model, each additional chocolate bar adds roughly 0.20 hours = 12 minutes to the required time. 17.
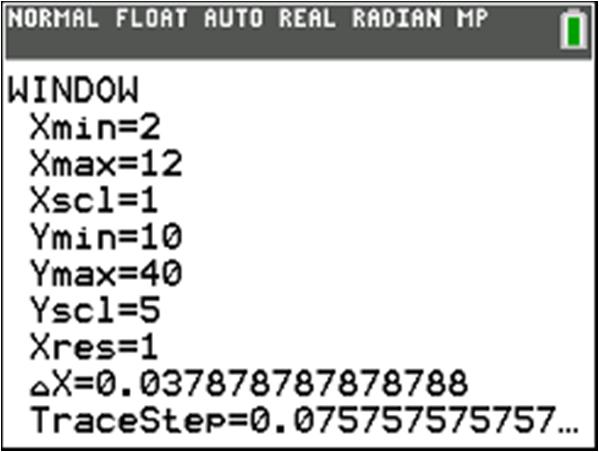
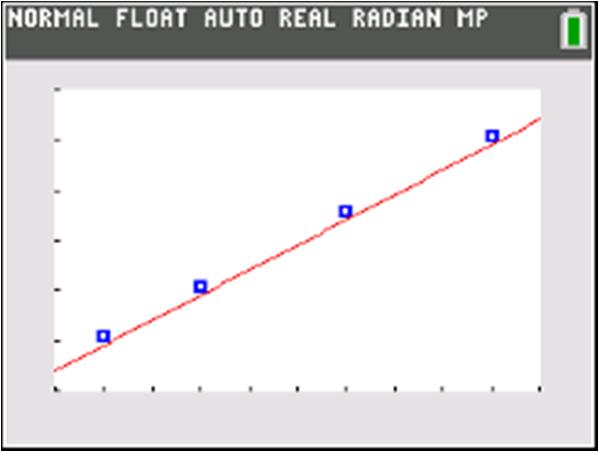
The graph will fit the points better if we shift it up, so b needs to be increased.


The graph will fit the points better if it’s less steep, which in this case means the negative slope needs to be less negative. Therefore, m needs to be increased. One example of a line that fits well is: 0.7520yx=−+
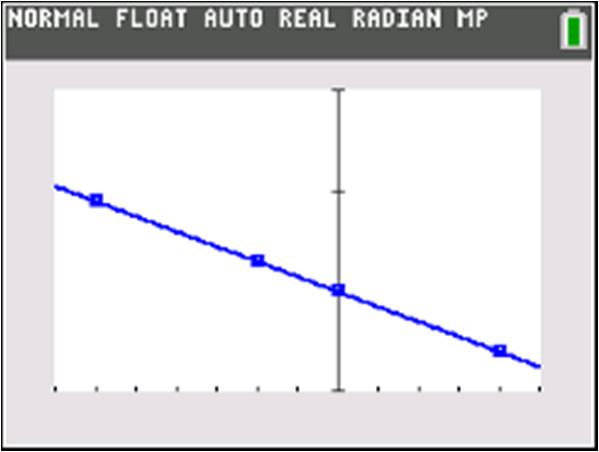
(Answers may vary.)
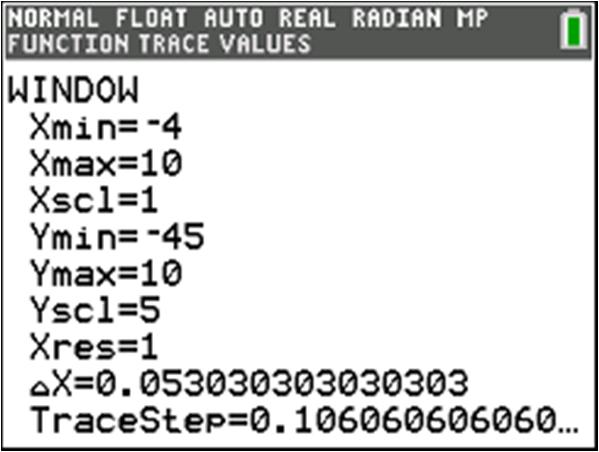

The graph will fit the points better if it shifts down, so b needs to be decreased.
One example of a line that fits well is: 45yx=−−

(Answers may vary.) 20.

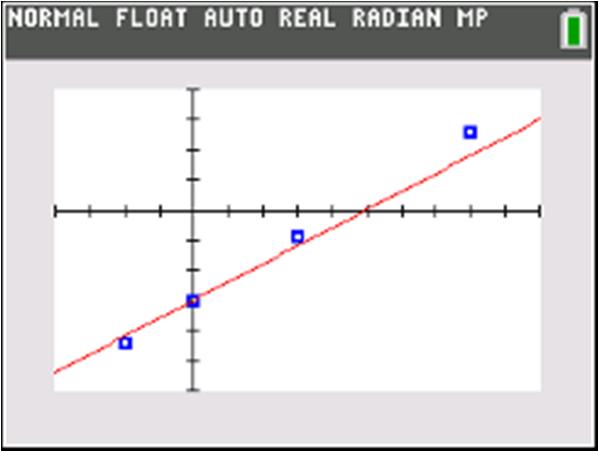
The graph will fit the points better if it is steeper, which in this case means the positive slope should be more positive. Therefore, m needs to be increased.
One example of a line that fits well is: 0.73yx=−
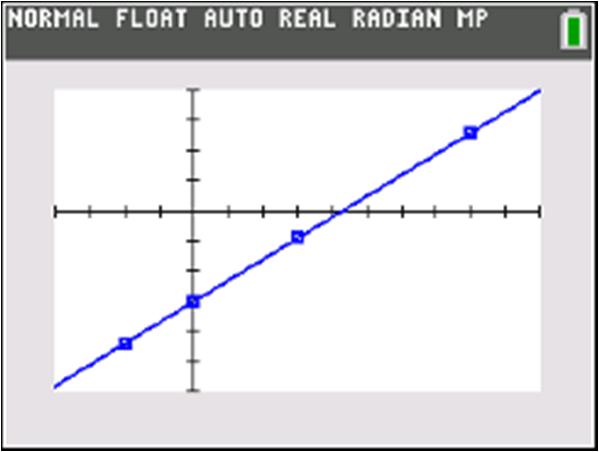
(Answers may vary.)
Let C be world chicken production in millions of metric tons, t years since 2010.
Our input-output pairs look like:
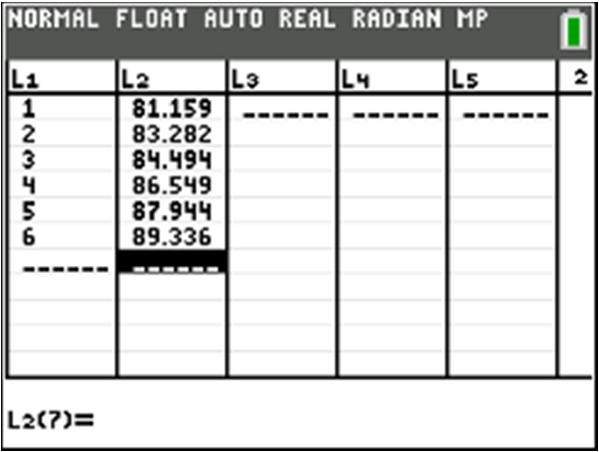
Here is one example of a reasonable window:

Using this window, our scatterplot looks like:

We can get a good straight-line fit using the points () 3,84.494 and () 5,87.944
The slope is difference in output87.94484.494 1.725 difference in input53 ==
We can use the point-slope form with () 3,84.494 :
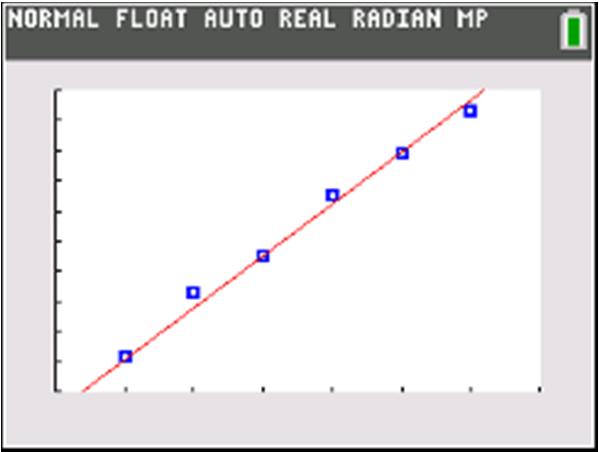
The equation for this model is: () 1.72579.319Ctt=+
b.
Our domain contains [] 1,6 . We can try going moving each endpoint out by a relatively small amount. We will try [] 2,10 as the domain.
d. If () 100 Ct = then: 2 1.72579.319100 1.72520.68 1 1 1.72520.681 1.7251.725 t t
The model predicts that about 100 million metric tons of chicken will be produced 12 years after 2010, in 2022.
e.
The slope of the model 1.725. The model predicts that worldwide chicken production will go up by about 1.725 million metric tons each year.
22.
a.
Let R be the operating revenue in billions of dollars for Southwest Airlines, t years since 2010. Our input-output pairs look like:
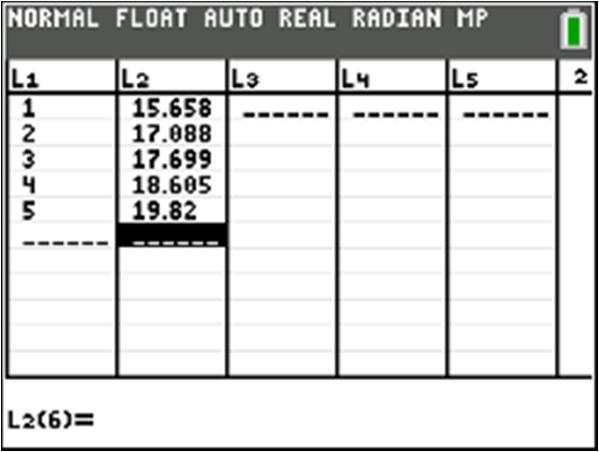
Here is one example of a reasonable window:
There are no obvious cases of model breakdown. One example of a reasonable domain and range: Domain: [] 2,10
Range: [] 75.869,96.569
The model predicts that about 98.294 million metric tons of chicken will be produced in 2021.
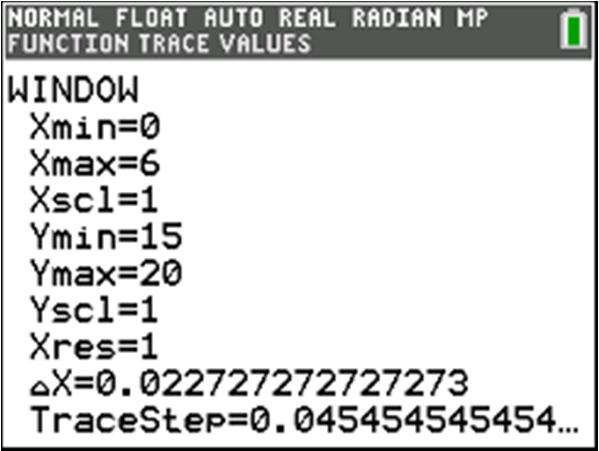
Using this window, our scatterplot looks like:
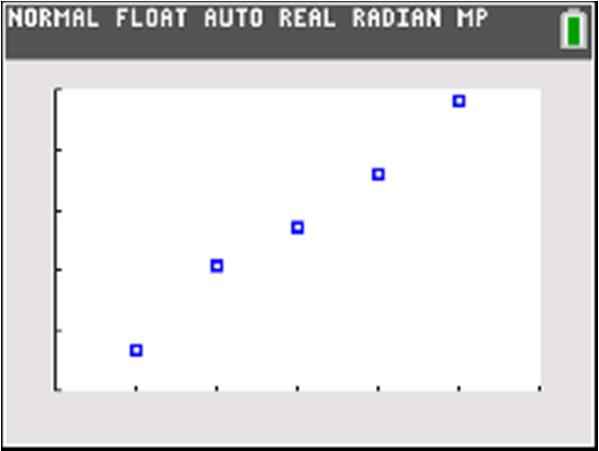
We can get a good straight-line fit using the points () 3,17.699 and () 5,19.820
The slope is difference in output19.82017.699 1.0605 difference in input53 ==
We can use the point-slope form with () 3,17.699 :
17.6991.06053
17.6991.06053.1815
1.060514.5175

The equation for this model is: () 1.060514.5175Rtt=+
b.
Our domain contains [] 1,5 . We can try going moving each endpoint out by a few units. We will try [] 2,8 as the domain.
The slope of the model is 1.0605. The model predicts that the annual operating revenue for Southwest Airlines will increase by about $1.0605 billion each year.
e.
There are no obvious cases of model breakdown. One example of a reasonable domain and range: Domain: [] 2,8
Range: [] 12.3963,23.0023
c.
If () 25 Rt = then:
1.060514.517525
The model predicts that Southwest’s operating revenue will reach about $25 billion 10 years after 2010, in 2020.
The model predicts that Southwest’s operating revenue will be about $21.941 billion in 2017.
23. The student did not find a reasonable model for the data provided as the calculation for the slope is incorrect. The numerator should be the difference in the output variable, which in this case is the difference in cost. The denominator should be the difference in the input variable, which in this case is the difference in number of bars. The slope should be 365265 1.25 10020 m ==
This made the value of b incorrect as well. The calculation for that should be 2651.25(20) 26525 240 b b b =+ =+ = 1.25240Cb=+
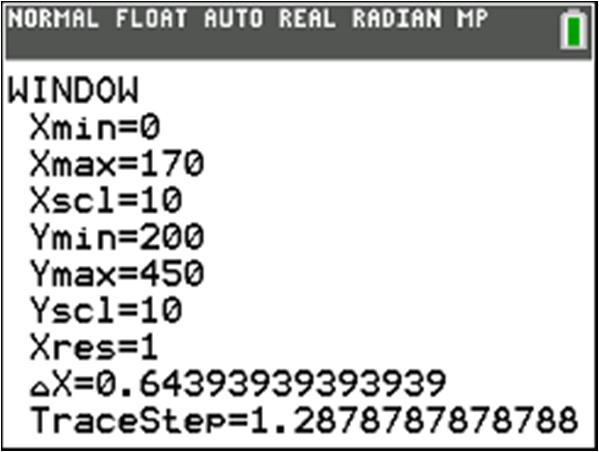

24. The student did not find a reasonable model for the data provided as there was a mistake in
calculating the vertical intercept. At the point where the student had to solve the equation:
26525 b =+
the student tried to eliminate 25 on the right side by dividing by 25, when he should have subtracted 25 on each side:
26525
2525
240 b b =+ = 1.25240Cb=+


25. The student did not find a reasonable model for the data provided as the calculation of the slope is incorrect. The output value 1105 should correspond to the input value 3000. The slope should be
110590 0.35 3000100 m ==
(Note: It would also be correct to calculate the slope as 901105 0.35 1003000 m == )
This made the value of b incorrect as well. The calculation should be:
900.35(100)
9035
55 b b b =+ =+ = 0.3555Cp=+

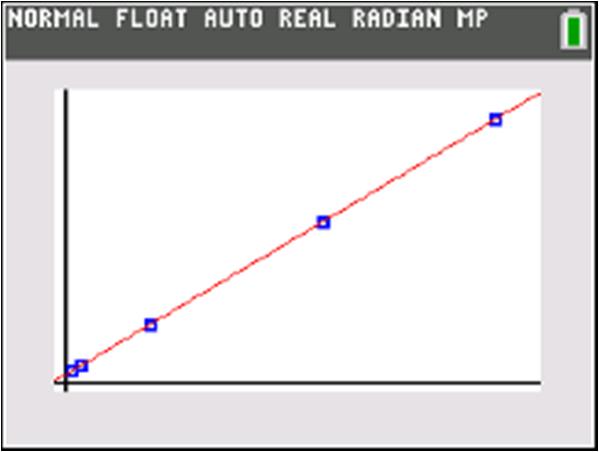
26. The student did not find a reasonable model for the data provided as the vertical intercept is incorrect. The student switched the input and output variables. The calculation should be:
11050.35(3000) 11051050 55 b b b =+ =+ = 0.3555Cp=+
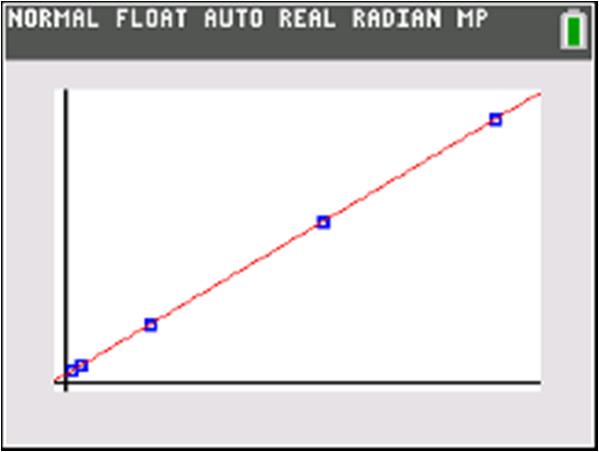
Let P be the number of patents awarded to Google, t years since 2010.
Our input-output pairs look like:

Here is one example of a reasonable window:
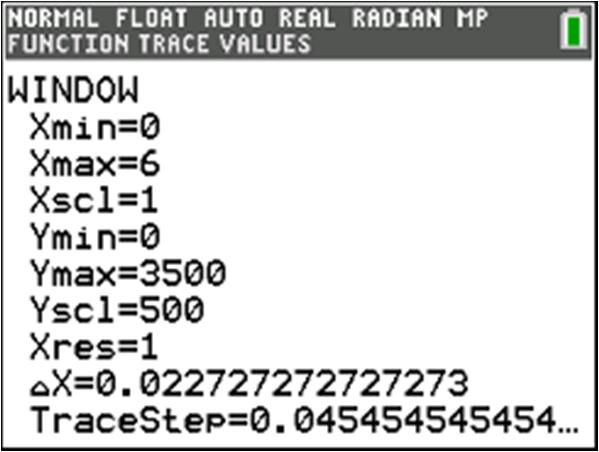
Using this window, our scatterplot looks like:
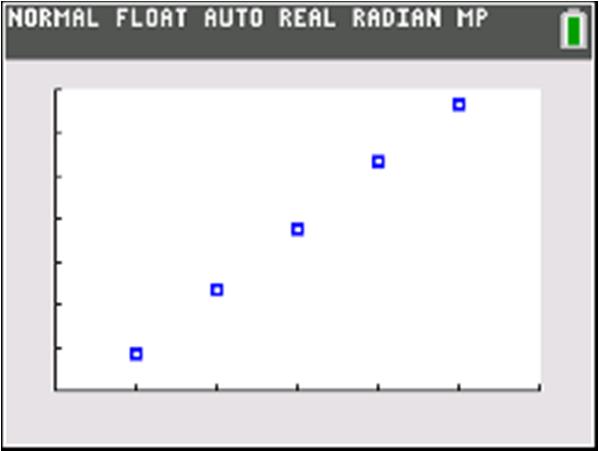
We can get a good straight-line fit using the points () 1,427 and () 2,1169 .
The slope is difference in output1169427 742 difference in input21 == .
We can use the point-slope form with () 1,427 :

The equation for this model is: () 742315Ptt=−
b.
Our domain contains [] 1,5 . We can try going moving each endpoint out by a few units, but we can see from the equation we got in part (a) that the vertical intercept is () 0,315 , which is a case of model breakdown because the number of patents awarded cannot be negative. So 0 t = cannot be in the domain. We will try [] 1,8 as the domain.
There are no obvious cases of model breakdown. One example of a reasonable domain and range: Domain: [] 1,8 Range: [] 427,5621
c.
If () 5500 Pt = then: 7423155500 7425835 7425835 742742 8
The model predicts that Google will come closest to being awarded 5500 patents in 2018.
d.
The slope of the model is 742. The model predicts that the number of patents awarded will increase by 742 every year.
e.
The model predicts that about 4879 patents will be awarded in 2017.
28.
a.
Let E be number of millions of households connected to the electricity grid in Kenya, t years since 2010.
Our input-output pairs look like:

Here is one example of a reasonable window:
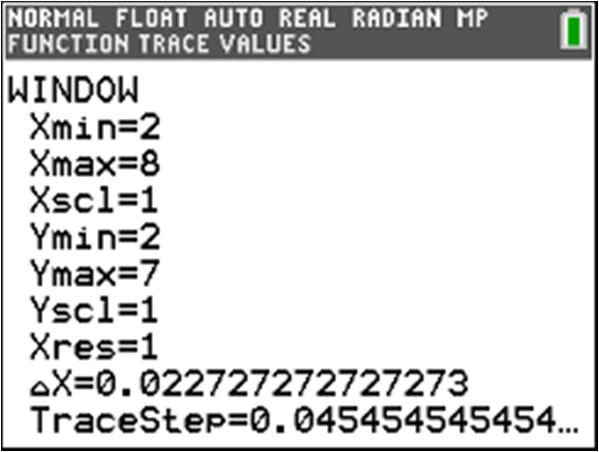
Using this window, our scatterplot looks like:

We can get a good straight-line fit using the points () 4,2.7 and () 6,4.9 .
The slope is difference in output4.92.7 1.1 difference in input64 == .
We can use the point-slope form with () 4,2.7 :

The equation for this model is: () 1.11.7Ett=−
b.
Our domain contains [] 3,7 . We can try going moving each endpoint out by a few units, but we note that the vertical intercept is () 0,1.7 , which is a case of model breakdown because the number of connected households cannot be negative. Therefore 0 t = cannot be included in the domain.
We will try [] 1,10 as the domain.
We see that 1 t = leads to model breakdown. We can try 2 t = : ()()1.121.70.5 2 E =−= One example of a reasonable domain and range: Domain: [] 2,10
Range: [] 0.5,9.3
c.
If () 8 Et = then: 1.11.78 1.19.7 1.19.7 1.11.1 9 t t t t −= = = ≈
According to the model, about 8 million households in Kenya will be connected to the grid in 2019. d.
The slope of the model is 1.1. According to the model, about 1.1 million more people in Kenya will be connected to the grid each year.
e. ()() 202010 101.1101.79.3 t E →= =−=
The model predicts that about 9.3 million people in Kenya will be connected to the grid in 2020.
Let F be the percentage of Americans who are Facebook users, t years since 2010. Our input-output pairs look like:
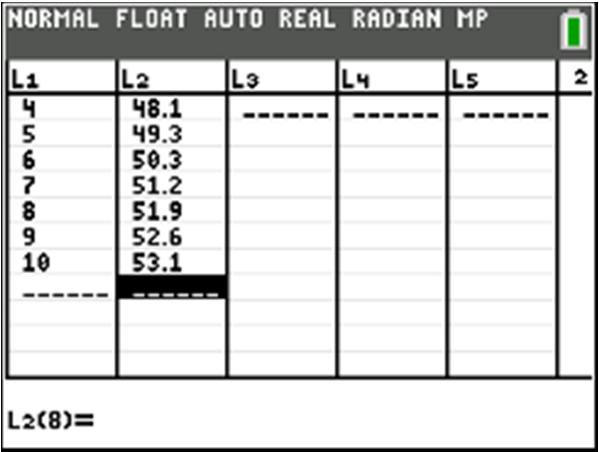
Here is one example of a reasonable window:
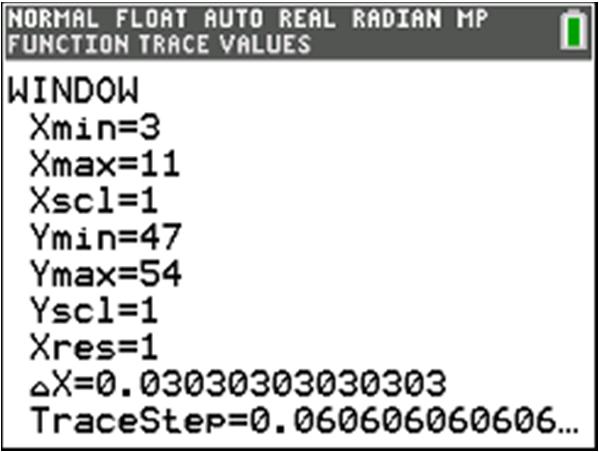
Using this window, our scatterplot looks like:

We can get a good straight-line fit using the points () 5,49.3 and () 9,52.6 .
The slope is difference in output52.649.3 0.825 difference in input95 == .
We can use the point-slope form with () 5,49.3 :

The equation for this model is: () 0.82545.175Ftt=+ b.
Our domain contains [] 4,10 . We can try going moving each endpoint out by a few units. We will try [] 0,14 as the domain.
One example of a reasonable domain and range: Domain: [] 0,14 Range: [] 45.175,56.725
c.
If () 60 Ft = then: 8 0.82545.17560
0.8250.825
0.82514.825 1 0.82514.825
The model predicts that about 60% of Americans will be Facebook users 18 years after 2010, in 2028. d.
The slope of the model is 0.825. According to the model, an additional 0.825% (roughly) of Americans will become Facebook users each year.
e.
According to the model, about 57.55% of Americans will be Facebook users in 2025.
Let R be the total revenue in billions of dollars for Costco Wholesale Corporation, t years since 2010. Our input-output pairs look like:
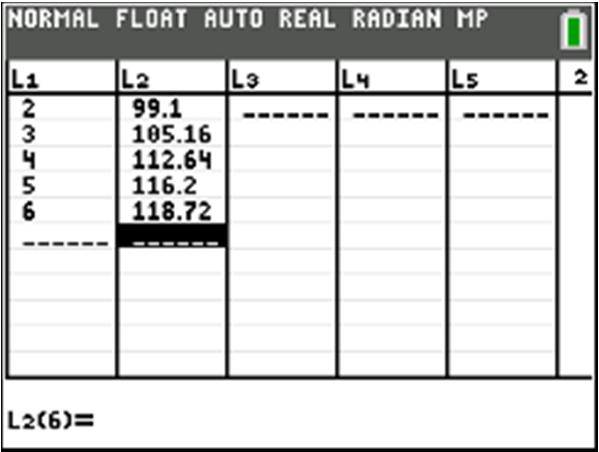
Here is one example of a reasonable window:

Using this window, our scatterplot looks like:

We can get a good straight-line fit using the points () 3,105.16 and () 5,116.12 .
The slope is difference in output116.12105.16 5.48 difference in input53 == .
We can use the point-slope form with () 3,105.16 :
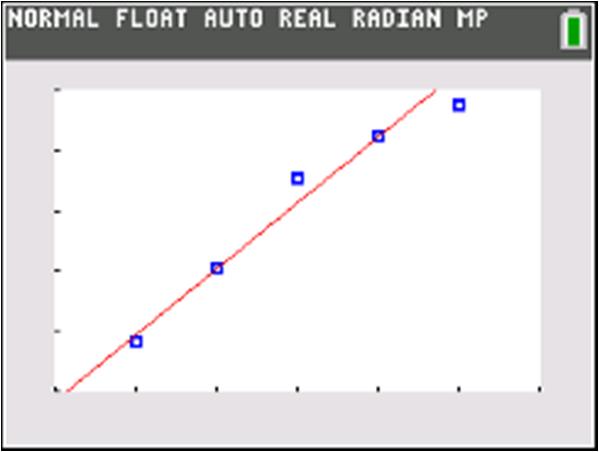
The equation for this model is: () 5.4888.72Rtt=+
b.
The slope is 5.48. According to the model, Costco’s total revenue will go up by about $5.48 billion per year.
c.
The model predicts that Costco Wholesale’s total revenue for 2018 will be about 132.56 billion.
31.
Let E be the number of thousands of industrial robots sold annually in China, Korea, and Japan, t years since 2010.
Let W be the number of thousands of industrial robots sold annually in the rest of the world, t years since 2010. Here are the input-output table and scatterplot for t and E:
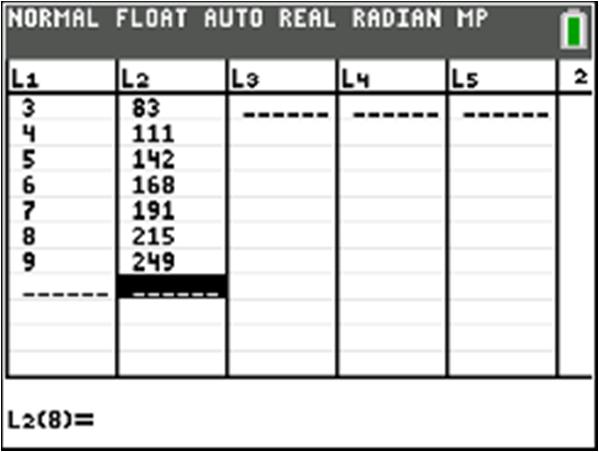
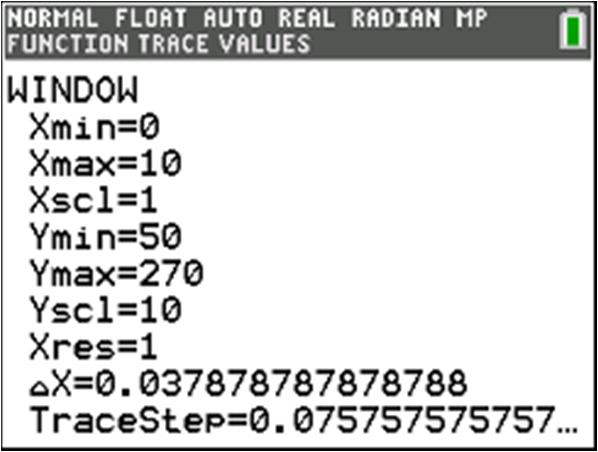

We can get a good straight-line fit with the two points () 4,111 and () 7,191 7 difference in output191111 difference in input74 26. = ≈
We can use the point-slope form with the point () 4,111 :
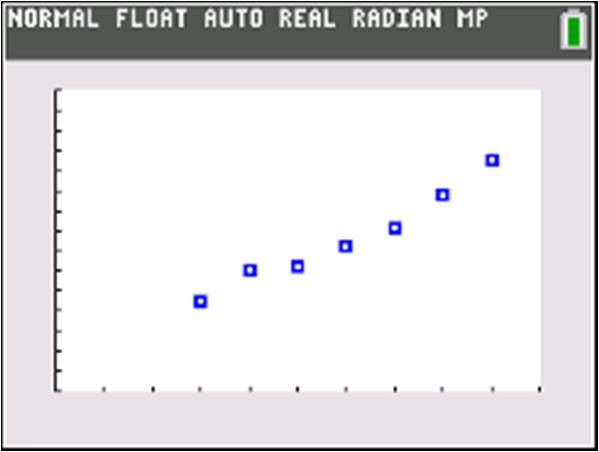
We can get a good straight-line fit with the two points () 3,95 and () 8,148 6 difference in output14895 difference in input83 10. = =
We can use the point-slope form with the point () 3,95 :

Here are the input-output table and scatterplot for t and W:
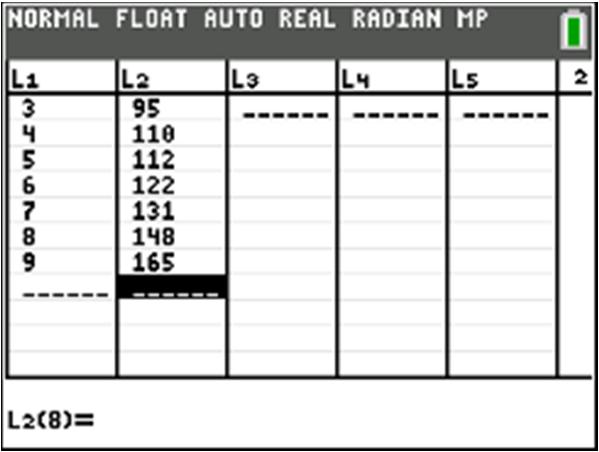
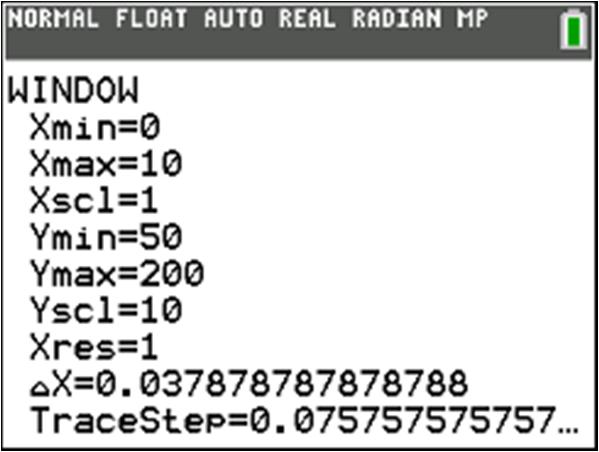
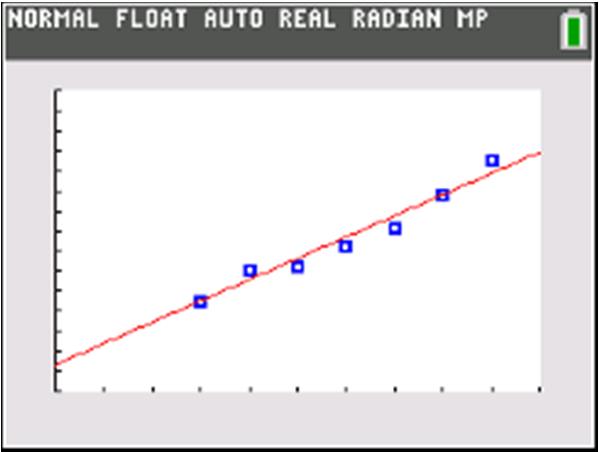
The equations for these models are:
32.
The domain includes [] 3,9 . We can try moving out each endpoint out a few units. Let’s try [] 0,12 as the domain.
There is no obvious model breakdown for 0 t = , though the value of () 0 E may be suspiciously low.
There is no obvious model breakdown for 12 t = .
Here is an example of reasonable domain and range for these two models:
Domain: [] 0,12
Range for ()Et : [] 4.2,324.6
Range for ()Wt : [] 63.2,190.4
33.
The yearly growth per year of industrial robot sales for China, Korea, and Japan is 26.7 thousand robots per year, because the slope for ()Et is 26.7.
The yearly growth per year of industrial robot sales for the rest of the world is 10.6 thousand robots per year, because the slope for ()Wt is 10.6.
China, Korea, and Japan have faster-growing sales of industrial robots than the rest of the world.
34.
If () 0 Et = then:
26.74.20
26.74.2
26.74.2
26.726.7
The horizontal intercept for ()Et is close to () 0.16,0 . This suggests that all industrial robot sales in China, Korea, and Japan began sometime in 2009 or 2010, which is false. This is an example of model breakdown.
35.
a. Let R be the revenue in billions of dollars for FedEx, t years since 2010. Our input-output pairs look like:

Here is one example of a reasonable window:
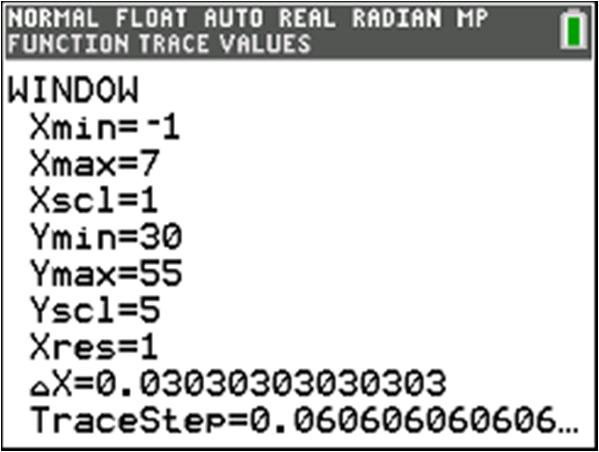
Using this window, our scatterplot looks like:

We can get a good straight-line fit using the points () 1,39.3 and () 6,50.4
The slope is difference in output50.439.3 2.22 difference in input61 ==
We can use the point-slope form with () 1,39.3 :

The equation for this model is: () 2.2237.08Rtt
b. Our domain contains [] 0,6 . We can try going moving each endpoint out by a few units.
We will try [] 3,10 as the domain.
There are no obvious cases of model breakdown. One example of a reasonable domain and range: Domain: [] 3,10
Range: [] 30.42,59.28
c. The slope is 2.22, which means that in this model, FedEx’s annual revenue increases by about $2.22 billion each year.
d.
In 2018, our model predicts $54.84 billion in revenue for FedEx.
36.
a. Let P be the gross profit for UPS in billions of dollars, t years since 2010. Our input-output pairs look like:

Here is one example of a reasonable window:

Using this window, our scatterplot looks like:
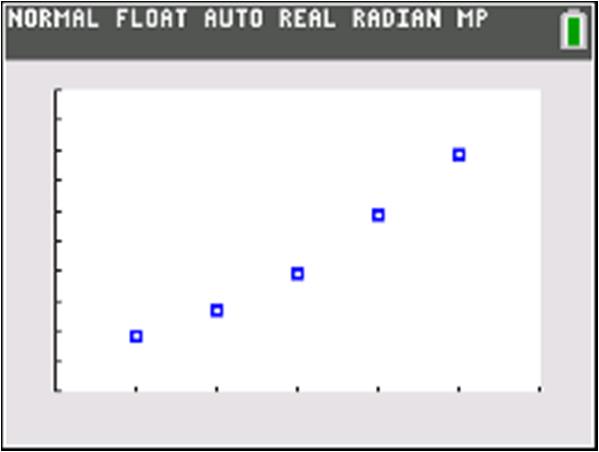
We can get a good straight-line fit using the points () 2,42.683 and () 4,45.874 The slope is difference in output45.87442.683 1.5955 difference in input42 ==
We can use the point-slope form with () 2,42.683 :
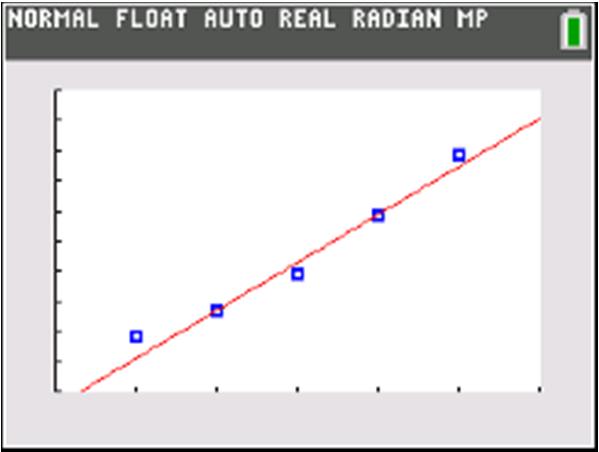
The equation for this model is: () 1.595539.492Ptt
b. Our domain contains [] 1,5 . We can try going moving each endpoint out by a few units. We will try [] 2,8 as the domain.
There are no obvious cases of model breakdown. One example of a reasonable domain and range: Domain: [] 2,8 Range: [] 36.301,52.256
c. The slope is 1.5955. According to the model, UPS’s gross profit increases by about $1.6 billion per year.
The model predicts that UPS had profits of about $50.66 billion in 2017.
e. The vertical intercept is () 0,39.492 . According to the model, UPS had gross profits of about $39.492 billion in 2010.
37.
a.
Let M be the fluid milk consumption in the United States in pounds per person, t years since 2010. Our input-output pairs look like:
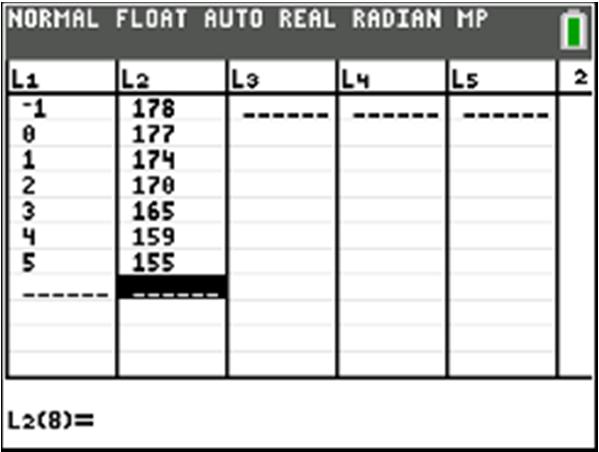
Here is one example of a reasonable window:

Using this window, our scatterplot looks like:

We can get a good straight-line fit using the points () 0,177 and () 5,155
The slope is difference in output155177 4.4 difference in input50 ==−
The vertical intercept is () 0,177 , so we can use this in the slope-intercept form: 4.4177Mt=−+
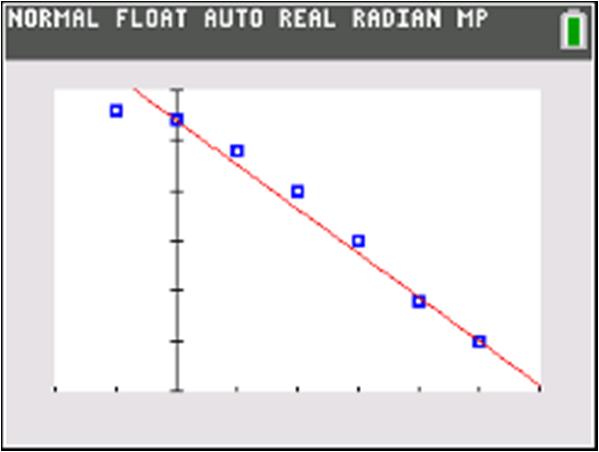
The equation for this model is: () 4.4177Mtt=−+
b.
Our domain contains [] 1,5 . We can try going moving each endpoint out by a few units. We will try [] 4,8 as the domain.
There are no obvious cases of model breakdown. One example of a reasonable domain and range: Domain: [] 4,8 Range: [] 141.8,194.6
c.
The vertical intercept is () 0,177 . This means that about 177 pounds of milk per person were consumed in the United States in 2010. d.
If () 200 Mt = then: 4.4177200 4.423
The model predicts that about 200 pounds of milk per person were consumed 5 years before 2010, in 2005. e.
If () 0 Mt = then: 4.41770 4.4177 4.4
The horizontal intercept is close to () 40,0 . This means that, according to the model, milk consumption will completely stop 40 years after 2010, in 2050. This is most likely a case of model breakdown.
38.
a.
Let M be the number of millions of unique mobile subscribers in Africa, t years since 2010.
Our input-output pairs look like:
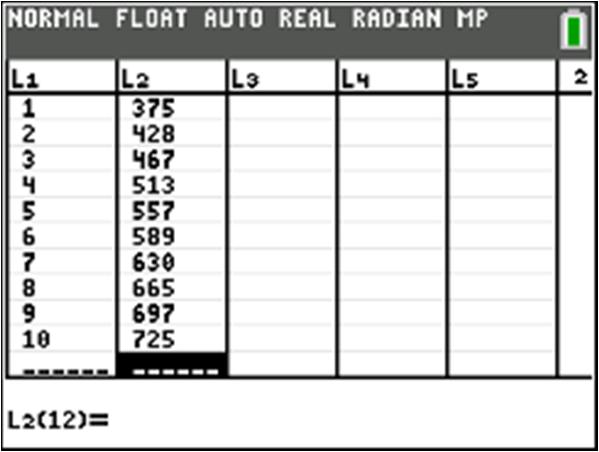
Here is one example of a reasonable window:

Using this window, our scatterplot looks like:

We can get a good straight-line fit using the points () 3,467 and () 8,665 .
The slope is difference in output665467 39.6 difference in input83 == .
We can use the point-slope form with () 3,467 :
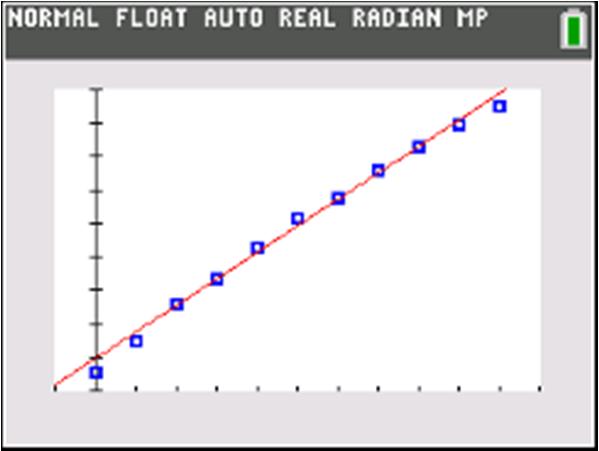
The equation for this model is: () 39.6348.2Mtt=+
b.
Our domain contains [] 0,10 . We can try going moving each endpoint out by a few units. We will try [] 5,15 as the domain.
There are no obvious cases of model breakdown. One example of a reasonable domain and range: Domain: [] 5,15
Range: [] 150.2,942.2
c.
The vertical intercept is () 0,348.2 . According to the model, there were about 348.2 million unique mobile subscribers in Africa in 2010. (Compare this with the true value of 327 million.)
d.
39.6348.2900
If () 900 Mt = then: 4
39.6551.8
39.639.6
39.6551. 1 8
According to the model, Africa will have about 900 million mobile subscribers 14 years after 2010, in 2024.
If () 0 Mt = then:
The horizontal intercept of the model is close to () 9,0 .
This means that in our model, there were no unique mobile subscribers in Africa 9 years before 2010, in 2001. This is false; there were mobile subscribers in Africa in the 1990s. This is a case of model breakdown. 39.
Let C be the amount processed by mobile payment firms in China in trillions of U.S. dollars, t years since 2010.
Our input-output pairs look like:
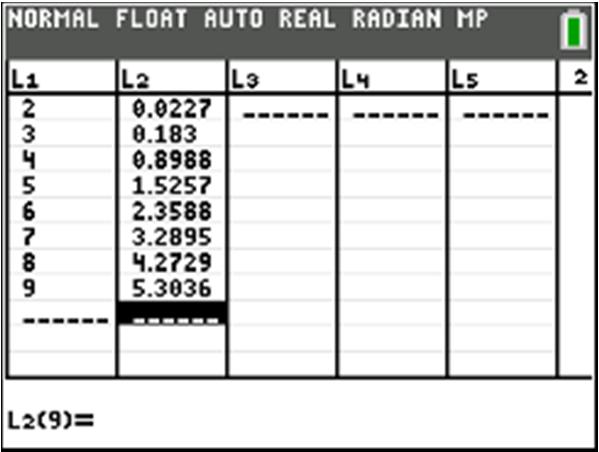
Here is one example of a reasonable window:
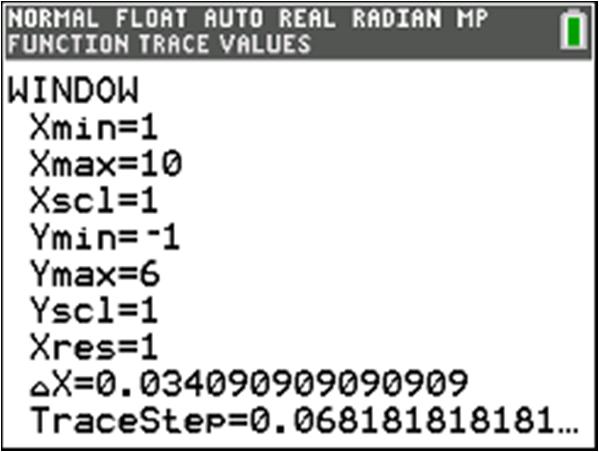
Using this window, our scatterplot looks like:
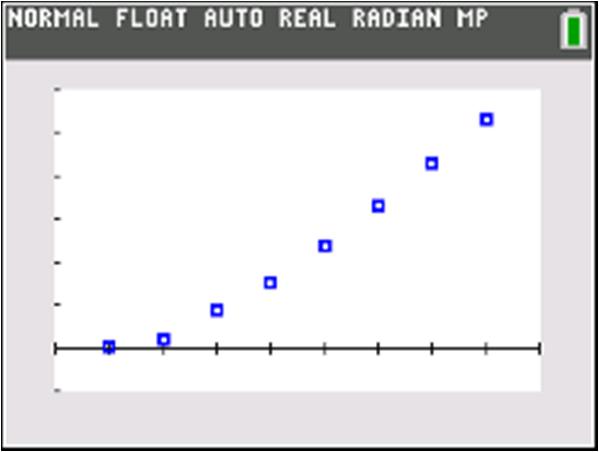
We can get a good straight-line fit using the points () 3,0.183 and () 7,3.289 The slope is difference in output3.2890.183 0.7765 difference in input73 ==
We can use the point-slope form with () 3,0.183 :
0.1830.77652.3295
0.77652.1465
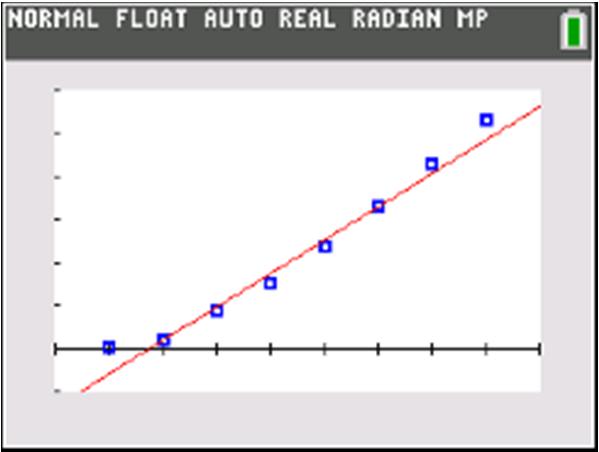
The equation for this model is: () 0.77652.1465Ctt
Although the input values in our data set go from 2 t = to 9 t = , we cannot include 2 t = in the domain for our model because ()() 20.776522.14650.5935
=−=− , which is a problem for two reasons:
• It is too far from the true value of C corresponding to 2 t =
• An amount of money processed by mobile payment firms cannot be negative.
It is reasonable to say that the domain contains [] 3,9
We can try moving the maximum value out by a few units.
We will try [] 3,13 as the domain.
() ()() 30.183 (This was one of the points we used to create the model.) 130.7765132.14657.948
One example of a reasonable domain and range:
Domain: [] 3,13
Range: [] 0.183,7.948
c.
The vertical intercept is () 0,2.1465 . This means that, according to the model, about $2.14 trillion was processed by mobile payment firms in China, which does not make sense. This is a case of model breakdown.
d.
If () 7 Ct = then:
0.77652.14657
0.77659.1465

Here is one example of a reasonable window:
0.77659. 6 1 1465
0.77650.775 1.7
8
The model predicts that the amount processed by mobile payment firms in China will reach $7 trillion in about 2022.
e.
If () 0 Ct = then:
0.77652.14650
0.77652.1465
0.77652.1465
0.77650.7765 2.7
6
The horizontal intercept is close to () 2.76,0 . This means that, according to the model, mobile payment firms in China began processing payments in late 2012. This seems like it could be model breakdown, though we might need more specific data for 2012 to be sure.
40.
a.
Let D be the number of cancer deaths per 100,000 people in the U.S., t years since 2010. Our input-output pairs look like:


Using this window, our scatterplot looks like:

We can get a good straight-line fit using the points () 0,198.8 and () 5,185.2
The slope is difference in output185.2198.8 2.72 difference in input50 ==− .
The vertical intercept is () 0,198.8 , so we can put this into the slope-intercept form: 2.72198.8Dt=−+

The equation for this model is: () 2.72198.8Dtt=−+
b.
Our domain contains [ ] 0,12 . We can try going moving each endpoint out by a few units. We will try [ ] 4,16 as the domain.
There are no obvious cases of model breakdown.
One example of a reasonable domain and range:
Domain: [ ] 4,16
Range: [ ]155.28,209.68
c.
The vertical intercept is () 0,198.8 . This means that there were about 198.8 cancer deaths per 100,000 people in the United States in 2000.
d.
If () 150 Dt = then:
2.72198.8150
Using two points: 4,4 and 10,40 404
()() ()
Find the slope: 6 104 464 424 20 Since 6 and 20 620 m b b b mb yx
42.
Using two points: 2,6 and 14,24 246
()() () ()
Find the slope: 2.5 142 62.52 65 11 Since 2.5 and 11 2.511 m b b b mb yx
e.
2.7248.8 8
2.7248.8
2.7 1 22.72 t
The cancer mortality rate in the United States will have reached 150 per 100,000 people about 18 years after 2000, in 2018.
If () 0 Dt = then:
2.72198.80
2.72198.8
2.72198.8 2.722. 3 72 7 t
The horizontal intercept is () 73,0 . The model predicts that cancer deaths in the U.S. will completely end in 2073. This is probably too far in the future for us to rely on any predictions made by our model. 41.
Using two points: 1,5 and 5,7 57
()() () ()
Find the slope: 3 15 531 53 8 Since 3 and 8 38 m b b b mb yx ==−
44.
Using two points: 4,3 and 8,24 24327
()() () ()
Find the slope: 2.25 8412 32.254 39 6 Since 2.25 and 6 2.256 m b b b mb yx ==−=− =−−+
Using two points: 3,4 and 12,1 14 31
Find the slope: 12393 1 43 3 41 5 1 Since and 5 3 1 5 3 m b b b mb
46.
Using two points: 1,3.4 and 6,5.4 5.43.42
Using two points: 10,492 and 19,627 627492135
()() ()
Using two points: 8,4.167 and 7,1.333 1.3334.1672.834 Find the slope: 0.189 7815
4.1670.1898
4.1671.512 2.66
Since 0.19 and 2.66 0.192.66 m b b b mb yx
Using two points: 4,9.45 and 11,2.45 9.452.45 11.9
Find the slope: 0.79 41115
2.450.7911
Since 0.79 and 6.24 0.796.24 m b b b mb yx
2.458.69 6.24
Find the slope: 15 19109 4921510 492150 342
Since 15 and 342 15342 m b b b mb yx
Using two points: 12,625 and 24,775 775625150
50. ()() ()
Find the slope: 12.5 241212 62512.512 625150 475 Since 12.5 and 475 12.5475 m b b b mb yx === =+
Using two points: 7,3755 and 22,4370 43703755 615
51. ()() () ()
Find the slope: 41 22715 3755417 3755287 3468
Since 41 and 3468 413468 m b b b mb yx
52. ()
Using two points: (2,5301) and (13,5587) 55875301286
Find the slope: 26 13211 5301262 53012652 265249 m yx yx yx
Our input-output pairs look like:

Here is one example of a reasonable window:
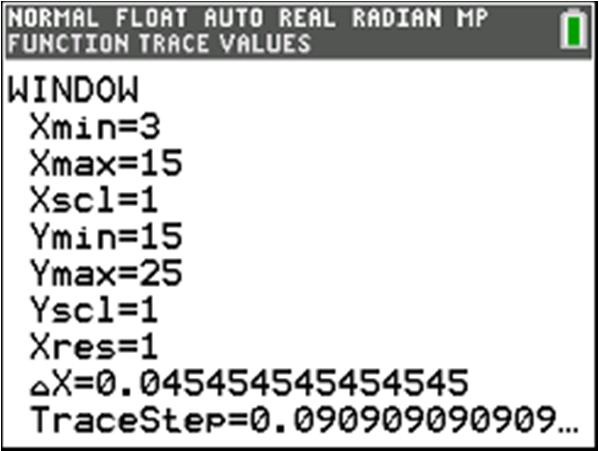
Using this window, our scatterplot looks like:

We can get a good straight-line fit using the points () 10,21.126 and () 11,22.074
The slope is difference in output22.07421.126 0.948 difference in input1110 ==
We can use the point-slope form with () 10,21.126 :

The equation for this model is: () 0.94811.646Att=+ b. ()() 150.9481511.64625.866 A =+=
The model predicts that about the average annual tuition would have been $25.866 thousand = $25,866 in 2015.
c.
If () 30 At = then:
0.94811.64630
0.94818.354
0.94818.354
0.9480.948 19.36
According to the model, the average annual tuition will come closest to $30 thousand in 2019.
d.
Our domain contains [] 4,14 . We can try going moving each endpoint out by a few units.
We will try [] 1,17 as the domain. ()() ()() 10.948111.64612.594 170.9481711.64627.762 A A =+= =+=
There are no obvious cases of model breakdown.
One example of a reasonable domain and range: Domain: [] 1,17 Range: [] 12.594,27.762
e.
The A-intercept (the vertical intercept) is () 0,11.646 .
The model estimates that the average annual tuition was about $11.646 thousand = $11,646 in 2000.
Our input-output pairs look like:
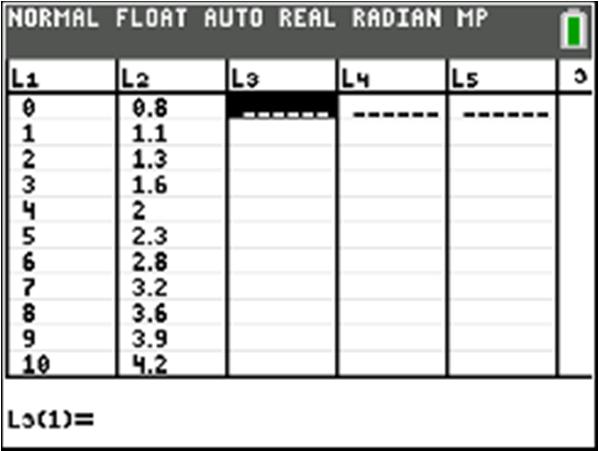
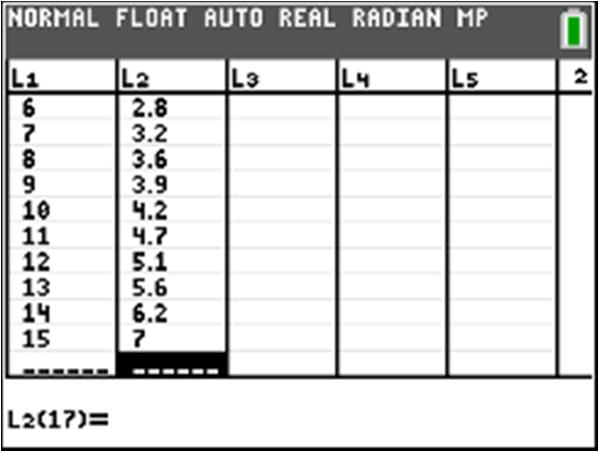
Here is one example of a reasonable window:

Using this window, our scatterplot looks like:
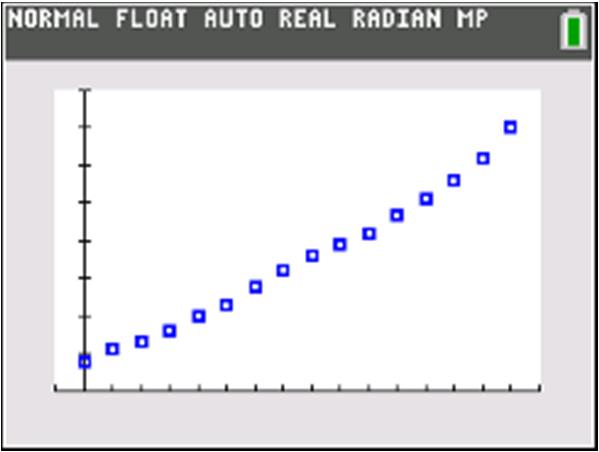
We can get a good straight-line fit using the points () 2,1.3 and () 13,5.6 The
We can use the point-slope form with () 2,1.3 :

The equation for this model is: () 0.390.52Ott=+ b. ()() 170.39170.527.15 O =+=
The model predicts that online sales were about 7.15% of total U.S. retail sales in 2017.
c.
If () 25 Ot = then:
0.390.5225 0.3924.48 0.3924.48 0.390.39 62.77
The model predicts that online sales will reach 25% (one-fourth) of total U.S. retail sales about 62.77 years after 2000. If we read this as 62.77 years after the beginning of 2000, this would be between the third and fourth quarter of 2062. (This is far enough in the future that our linear model will probably no longer be applicable.)
d.
Our domain contains [] 0,15 . We can try going moving each endpoint out by a few units, but it is worth noting that since () 0 O is already pretty low, we cannot decrease our minimum value of t by very much.
We will try [] 1,20 as the domain.
10.3910.520.13
There are no obvious cases of model breakdown, except that the value of () 0 O may be suspiciously low. One example of a reasonable domain and range: Domain: [] 1,20
Range: [] 0.13,8.32
e.
The O-intercept (the vertical intercept) is () 0,0.52
The model predicts that online sales were about 0.52% of total U.S. retail sales. (Compare this to the true value of 0.8%.) 55.
a.
Here is the input values and approximate output values:

Here is one example of a reasonable window:

Using this window, our scatterplot looks like:
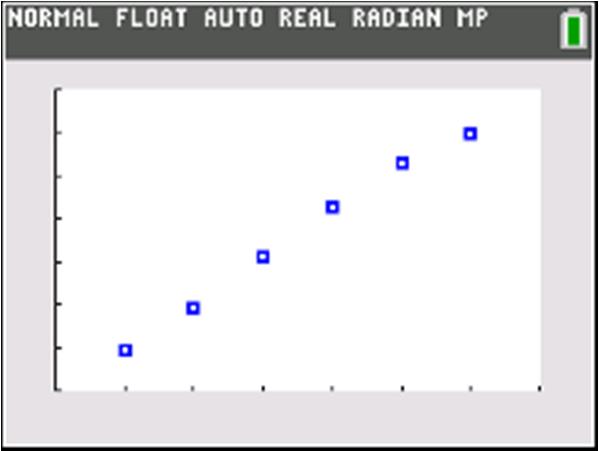
We can get a good straight-line fit using the points () 1,547.4 and () 3,656.7
The slope is difference in output656.7547.4 54.65 difference in input31 ==
We can use the point-slope form with () 1,547.4 :
547.454.651
547.454.6554.65
54.65492.75

The equation for this model is: () 54.65492.75Ctt=+ b.
()() 954.659492.75984.60 C =+=
According to the model, Compassion International will receive about $984.6 million in total contributions and gifts in 2019.
c.
If () 850 Ct = then:
54.65492.75850
54.65357.25
54.65357.25
54.6554.65 6.5 t t t t += = = ≈
According to the model, the total contributions and gifts received by Compassion International came closest to $850 million in either 2016 or 2017.
d.
Our domain contains [] 1,6 . We can try going moving each endpoint out by a few units.
We will try [] 2,9 as the domain.
There are no obvious cases of model breakdown.
One example of a reasonable domain and range: Domain: [] 2,9
Range: [] 383.45,984.60
e.
The C-intercept (the vertical intercept) is () 0,492.75 .
According to the model, Compassion International received about $492.75 million in contributions and gifts in 2010.
56.
a.
Our input-output pairs look like:

Here is one example of a reasonable window:

Using this window, our scatterplot looks like:
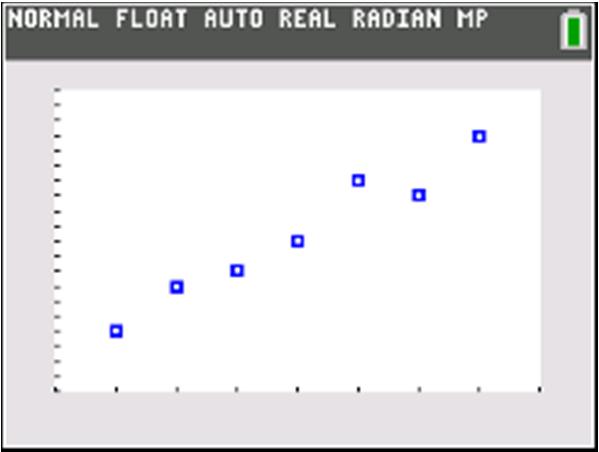
We can get a good straight-line fit using the points () 7,19 and () 13,32
The slope is 7 difference in output3219 difference in input137 2.1 = ≈
We can use the point-slope form with () 7,19 :
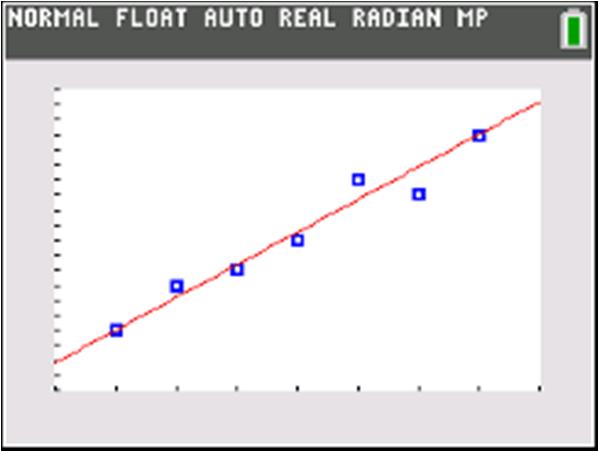
The equation for this model is: () 2.173.81Ptt
b. ()() 162.17163.8138.53 P =+=
According to the model, the percentage of college applicants applying to seven or more schools was 38.53% in 2016.
c.
If () 40 Pt = then: 7 2.173.8140 2.1736.19 2.1736 1 .19 2.17217 6. t t t
The model predicts that the percentage of college applicants applying to seven or more schools came closest to 40% in about 2017. d.
Our domain contains [] 7,13 . We can try going moving each endpoint out by a few units. We will try [] 4,16 as the domain.
There are no obvious cases of model breakdown. One example of a reasonable domain and range:
Domain: [ ] 4,16
Range: [ ]12.49,38.53
e.
The P-intercept for the model is () 0,3.81 . This means that, according to the model, about 3.81% of college applicants in 2000 applied to seven or more schools.
57.
The vertical intercept is where the input equals zero: ()() 04066 f =−=−
The vertical intercept is at () 0,6 .
The horizontal intercept is where the output equals zero:
The horizontal intercept is at 12 5 ,0
⎜⎟ ⎝⎠ , which can also be written as () 2.4,0
Domain: () , −∞∞ , Range: () , −∞∞

59.
The horizontal intercept is at 3 ,0 2 ⎛⎞ ⎜⎟ ⎝⎠ , which can also be written as () 1.5,0
Domain: () , −∞∞ , Range: () , −∞∞

58.
The vertical intercept is where the input equals zero: ()() 0501212 g =−=−
The vertical intercept is at () 0,12
The horizontal intercept is where the output equals zero:
The vertical intercept is where the input equals zero:
The vertical intercept is at () 0,9 .
The horizontal intercept is where the output equals zero:
The horizontal intercept is at 0 27 4 , ⎛⎞ ⎜⎟ ⎝⎠ , which can also be written as () 0 6.75, .
Domain: () , −∞∞ , Range: () , −∞∞

60.
The vertical intercept is where the input equals zero: () () 3 001212 4 g =+=
The vertical intercept is at () 0,12
The horizontal intercept is where the output equals zero:
The horizontal intercept is where the output equals zero:
The horizontal intercept is at () 6,0
Domain: () , −∞∞ , Range: () , −∞∞
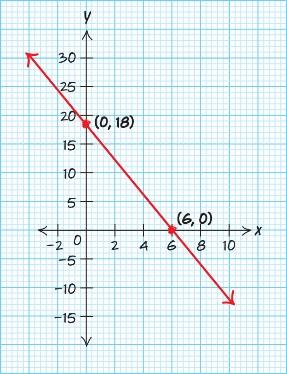
62.
The vertical intercept is where the input equals zero: ()() 0201616 h =−+=
The vertical intercept is at () 0,16
The horizontal intercept is where the output equals zero:
The horizontal intercept is at () 16,0
Domain: () , −∞∞ , Range: () , −∞∞

61.
The vertical intercept is where the input equals zero: ()() 0301818 f =−+=
The vertical intercept is at () 0,18
The horizontal intercept is at () 8,0
Domain: () , −∞∞ , Range: () , −∞∞

0.42.60.80.86.560.8 0.42.66.56
0.42.62.66.562.6
5. 0.754.5hd=+
a. () 0.7574.5 9.75 h h =+ =
The height after 1 week (7 days) is 9.75 inches. b.
120.754.5 124.50.754.54.5
7.50.75
7.50.75
0.750.75
The course grass attendants should cut the grass in the rough 10 days before the tournament.
6.
a. Let C be the cost of the satellite phone service in dollars, and m be the number of minutes used.
1010Cm=+ b. () 10310 40 C C =+ =
A 3-minute call cost $40. c.
3001010
The satellite call can last 29 minutes for $300.
7. Let C be the cost in dollars of renting a Bobcat for h hours.
a 4015Ch=+ b. () 40215 95 C C =+ =
Renting a Bobcat for 2 hours will cost $95.
A three-day rental of a Bobcat will cost $975. 8.
a. Let C be the cost in dollars to produce n putters.


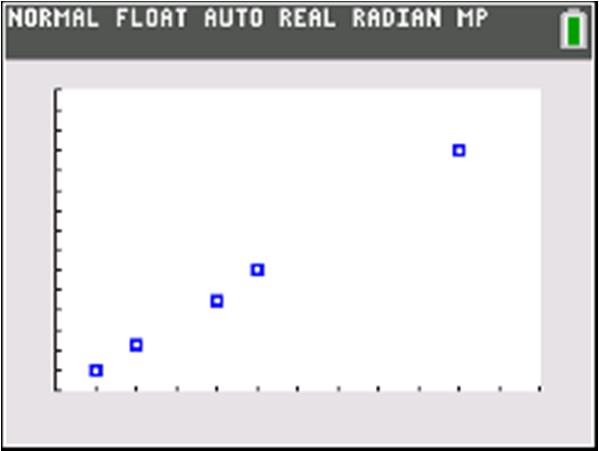
Using two points: 5,600 and 50,1700

b. The vertical intercept is (0,477.80). It costs $477.80 to produce 0 putters.
c. () 24.44100477.80 2921.80 C C =+
The cost to produce 100 putters is $2921.80.
d. Domain: [0,100] () 24.44100477.802921.80 C =+=
Range: [477.80, 2921.80]
e. The slope is 24.44. For every putter produced the cost increases by $24.44.
9.
a t = Time in years since 2010 R(t) = Revenue for Amazon in billions of dollars Using () 1,24.51 and () 3,74.45,
24.5112.51 24.5112.51 24.5112.512.5 24.5124.5112.512.524.51 12.537.01
Rounding further and using function notation, () 12.537.Rtt=+
b. Domain: 27, t −≤≤ Range: 1 14.5 22 R ≤≤ c.
In 2015, Amazon has about $100 billion in revenue.
20177 12.5737 87.537 124.5 t R R R →= =+ =+ =
In 2017, Amazon had revenue of about $124.5 billion.
e.
The slope is 12.5. Amazon’s revenue is increasing by about $12.5 billion per year. 10.
a. t = Time in years since 2010
I(t) = The number of global Internet users in billions
Using () 1,1.766 and () 6,3.425, () 3.4251.7661.659 0.237 617 m === () () () 1.7660.2371 1.7660.2371 1.7660.2370.237 1.7661.7660.2370.2371.766 0.2372.003
Rounding further and using function notation, () 0.2372.Itt=+
b () 0.237321.289 −+= and () 0.2371024.37 +=
Domain: 1 30, t −≤≤ Range: 1.2894.37 I ≤≤
c. The slope is 0.237. The number of global Internet users is increasing by about 237 million per year.
f. 00.2372 20.237 20.237
0.2370.237
8.439 t t t t =+ −= = −≈
The horizontal intercept is () 8.439,0. In 2002, there were no Internet users. This is model breakdown. 11.
a. t = Time in years since 1900
P(t) = Ticket prices for movies in North America in U.S. dollars
Using () 90,4.11 and () 105,6.41,
6.414.112.30 1059015 0.1533 m == ≈ ()4.110.153390 4.110.153313.797
4.114.110.153313.7974.11 0.15339.687 Pt Pt Pt Pt
Rounding further and using function notation, () 0.1539.69.Ptt=−
b () 0.153709.691.02 −= and () 0.1531209.698.67 −=
Domain: 71020, t ≤≤ Range: . .027 186 P ≤≤
c. The slope is 0.153. Ticket prices for movies in North America are increasing by about 0.153 dollars per year.
d.
In 2017, there were about 3.659 billion global Internet users.
e. The vertical intercept is (0, 2). In 2010, there were about 2 billion global Internet users.
2015115 t →= () 0.1531159.69 17.5959.69 7.905 P P P =− =− =
In 2015, ticket prices for movies in North America were about $7.91.
e. The vertical intercept is () 0,9.69. In 1900, ticket prices for movies in North America were about $9.69. This is model breakdown.
00.1539.69 9.690.153 9.690.153
0.1530.153
The horizontal intercept is (63.33, 0). In 1963, movies in North America were free. This is model breakdown.
12 () 0.564.3Ctt=+ a.
7.1 million candles will be produced in 2015. b.
30.5634.3 35.98 C C
5.98 million candles will be produced in 2013. c.
100.564.3
104.30.564.34.3
5.70.56
5.70.56
10 million candles will be produced in 2020. 13. VbT VbT
Since 4 the -intercept is 0,4. To find the -intercept let 0 and solve for : 034 43 4 3 yx by xyx x x
4 Plot a point at the -intercept ,0. 3
Draw a line through the two points. x
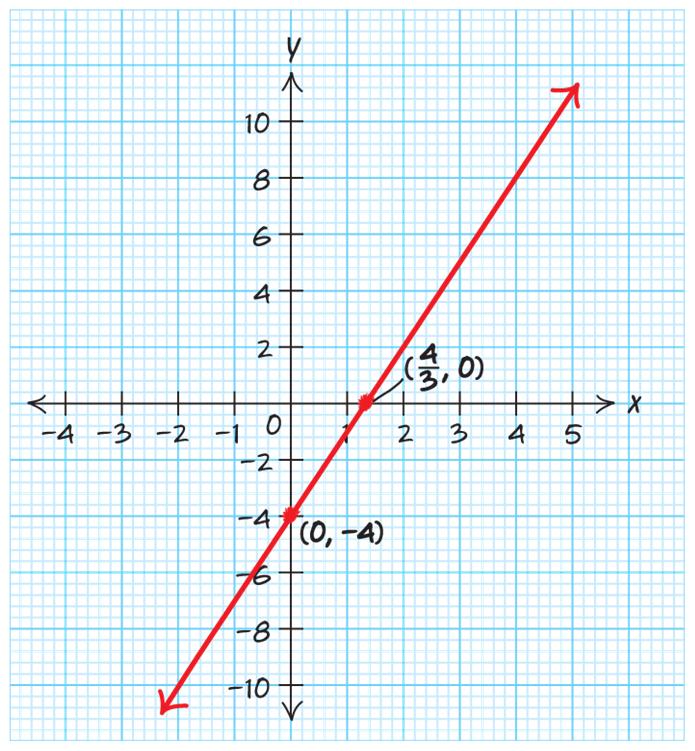
18. () 23
Since 3 the -intercept is 0,3.
To find the -intercept let 0 and solve for : 023 32 1.5
() Plot a point at the -intercept 1.5,0. Draw a line through the two points. x

To find the -intercept let 0 and solve for : 50642 0642 642 7
Plot a point at the -intercept 0,7.
To find the -intercept let 0 and solve for : 56042 5042 542 8.4
Plot a point at the -intercept 8.4,0. Draw a line through the two points. xyx
19. () () 2324
To find the -intercept let 0 and solve for : 20324 0324
Plot a point at the -intercept 0,8. xy yxy y y y y y

To find the -intercept let 0 and solve for : 23024 2024 224 12
Plot a point at the -intercept 12,0. Draw a line through the two points. xyx x

To find the -intercept let 0 and solve for : 05 05 5
y
Plot a point at the -intercept 0,5. Plot additional points to graph the curve.

To find the -intercept let 0 and solve for : 06 06 6
Plot a point at the -intercept 0,6. yx yxy y y y y
To find the -intercept let 0 and solve for : 06 6 6 2.4 xyx
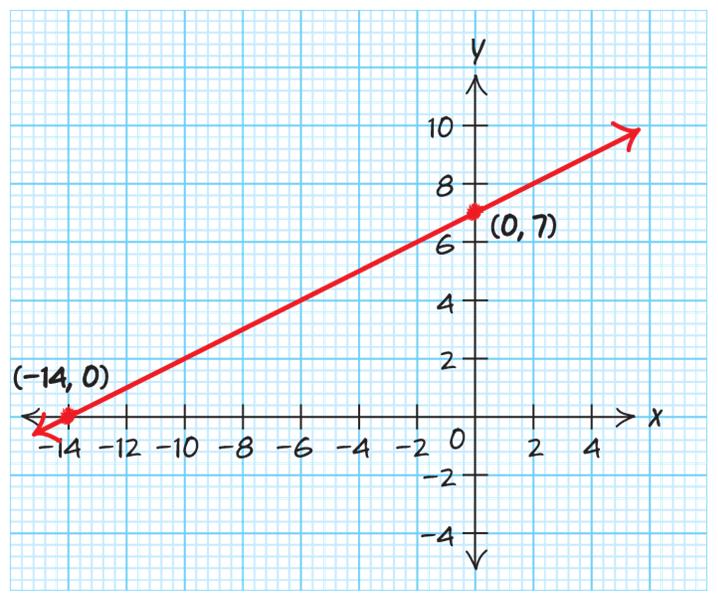
() 2 4 7 Since 4 the -intercept is 0,4. yx by

Plot the points at the -intercepts (2.4,0) and (2.4,0).
Since 7 the -intercept is 0,7. yx by =+ =
Plot additional points to graph the curve. x 23. () 1 7 2
Plot a point at the -intercept 14,0. Draw a line through the two points. xyx
To find the -intercept let 0 and solve for : 1
To find the -intercept let 0 and solve for : 2 04 7 2 4
Plot a point at the -intercept 14,0. Draw a line through the two points. xyx

Using two points: 2,7 and 7,27 27720
Find the slope: 4 725
Using 4 and 2,7. 742 78 1
Since 4 amd 1 41 m m b b b mb yx
Using two points: 4,9 and 3,23 23914
Find the slope: 2 347
Using 2 and 4,9. 924 928 99289 217 m m yx yx yx
27.
31.
a. () 0,4 is the point where the graph crosses the yaxis.
Since the lines are parallel . 312 312
Using 3 and the point 4,10 1034 10312 32 mm
b. () 1.3,0 is the point where the graph crosses the xaxis.
c. ()() Use two points from the graph 0,4 and 4,8. 8412 slope3 404 ===−
d ()48 Since when 4 8. fxy=−==−
Since the lines are parallel . 0.54
Using 0.5 and the point 2,16 160.52 160.51 0.517 mm yx m yx yx yx =
29.
Since
are
point
Since the lines are perpendicular . 2535 5235 2 7 5 m m xy yx yx =−
Since the -intercept is 0,4, then 4. Since the slope is 3, then 3. Use where 3 and 4. The equation of the line is 34. yb m ymxbmb fxx = −=−
e () 4 when 16 xfx=−= f. () ()
32.
a. (0,5) is the point where the graph crosses the yaxis.
b. (3.3,0) is the point where the graph crosses the xaxis.
c. ()() () ()
Use two points from the graph 2,8 and 2,2. 28 63 slope 2242 ===
d ()28 since when 2, 8. hxy −=−=−=−
e () 2 when 2 xhx==−
Since the -intercept is 0,5, then 5. 33
Since the slope is , then . 22 3
Use where and 5. 2 3
The equation of the line is 5. 2 yb m ymxbmb hxx −=− =
33.
a.
Using two points: 0,6 and 3,8 862
()()
Find the slope: 303 m ==
b. () 0,6
c 2 6 3 yx=+
34. a.
Using two points: 0,3 and 3,1.65 1.653
()()
Find the slope: 0.45 30 m ==−
b. () 0,3
c 0.453yx=−+
35. The electricity cost for using holiday lights 6 hours a day is $13.
36. () 309979Ptt=+
a. ()() () 1030109979 1010,279 P P =+ =
In 2010, the population of Michigan will be about 10,279 thousand.
b. 11,000309979
11,00099793099799979 102130 102130 3030 34.03 t t t t t =+ −=+− = = ≈
The population of Michigan will reach 11,000 thousand in about 2034. This may be model
breakdown if the current population growth does not continue.
37 () 28fxx=− a. ()() () 102108 1012 f f =− = b. 028 82 82 22 4 x x x x =− = = =
c. Domain: All real numbers, Range: All real numbers
38. () 2 14 3 hxx=−+ a.
c. Domain: All real numbers, Range: All real numbers
39 () 12 gx =
a. ()312 g = b. ()2012 g −=
c. Domain: All real numbers, Range: { }12
c. Domain: All real numbers, Range: All real numbers
a. t = Time in years since 2010
H(t) = The median U.S. home price in thousands of dollars
Using (1, 221.2) and (5, 308.1), 22
Rounding and using function notation, we have () 22199.Htt=+
b ()()1221199177 H −=−+= and ()() 7227199353 H =+=
Domain: 17, t −≤≤ Range: 3 773 15 H ≤≤
c. Slope = 22. The median U.S. home price is increasing by about $22 thousand per year.
d. () 20177 227199353 t →= +=
In 2017, the median U.S. home price was about $353 thousand.
e. 20022199 122 122 2222
0.05
In 2010, the median U.S. home price was about $200 thousand. 2 42yx=− ()
Since 2 the -intercept is 0,2. To find the -intercept let 0 and solve for : 042 24 1 2 1
Plot a point at the -intercept ,0. 2
Draw a line through the two points. by xyx x x
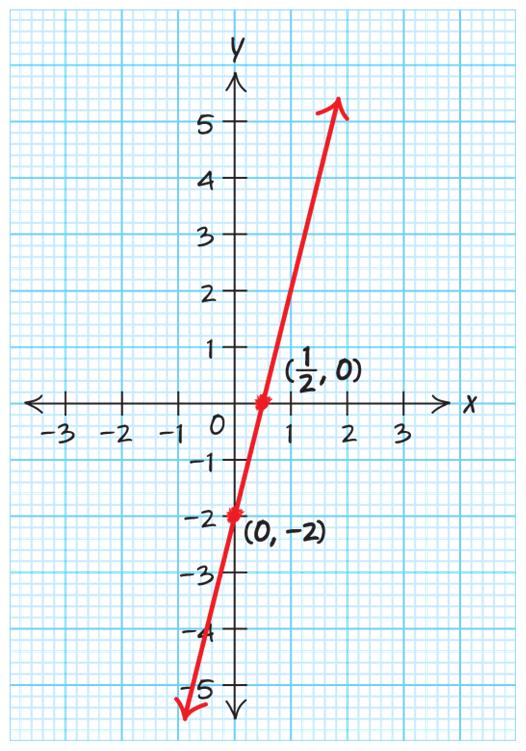
3 2 5 3 yx=−+ ()
Since 5 the -intercept is 0,5. To find the -intercept let 0 and solve for : 2 05 3 2 5 3 332 5 223 7.5
Plot a point at the -intercept 7.5,0. Draw a line through the two by xyx x x x
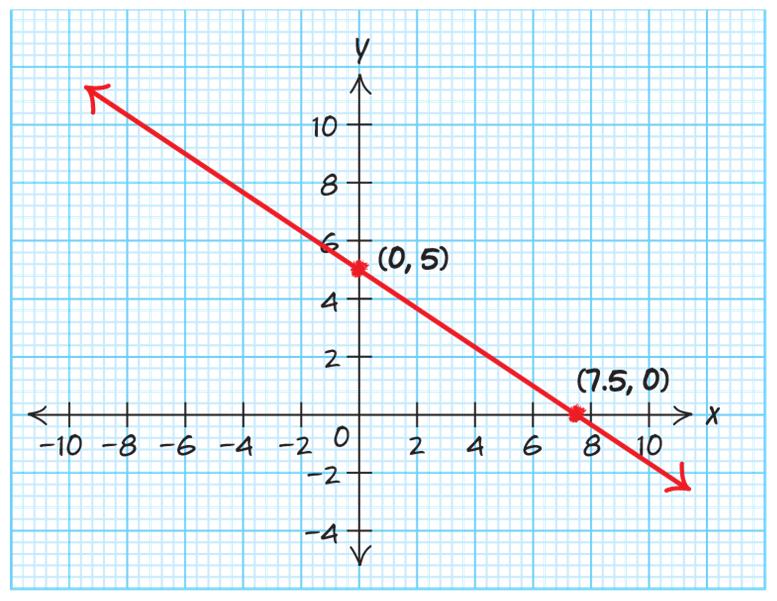
To find the -intercept let 0 and solve for : 20410 0410 410 2.5
Plot a point at the -intercept 0,2.5. yxy y y y y y =
2410 xy−= () ()
To find the -intercept let 0 and solve for : 24010 2010 210 5
Plot a point at the -intercept 5,0.
() ()
Draw a line through the two points.

5. axbyc axbybycby axcby axcby aa cby x a
Using two points: 4,8 and 6,10 1082
6. ()() ()
Find the slope: 0.2 6410 m === () () Using 0.2 and 6,10. 100.26 101.2 8.8
Since 0.2 and 8.8 0.28.8 m b b b mb yx =
7. () () 12
Using 2 and the point 5,8 825 8210 22 mm yx m yx yx yx = =− = −=− −=− =−
Since the lines are parallel . 27
8. 230Pm=+ a. () 2630 42 P P =+ =
Six months after starting to sell paintings, John Clark will sell approximately 42 paintings. b. 50230 503023030 202 202 22 10 m m m m m =+ −=+− = = =
John Clark will sell 50 painting during the 10th month after starting to sell paintings.
9.
a. t = Time in years since 2010 S(t) = The percentage share of total U.S. music revenues from streaming tS(t) 0 7 1 9 2 15 3 21 4 27 5 34
Using (1, 9) and (5, 34), 34925 6.25 514 m === ()96.251 96.256.25 996.256.259 6.252.75 St St St St −=− −=− −+=−+ =+
Using function notation, () 6.252.75.Stt=+
b ()() 06.2502.752.75 S =+= and ()() 76.2572.7546.5 S =+=
Domain: 07, t ≤≤ Range: 6 .755 24. S ≤≤
c. Slope = 6.25. The percentage share of total U.S. music revenues from streaming is increasing by about 6.25 percentage points per year.
d. The vertical intercept is (0, 2.75). In 2010, 2.75% of the total U.S. music revenues were from streaming.
e. ()() 20188 86.2582.7552.75 t S →= =+=
In 2018, about 52.75% of the total U.S. music revenues were from streaming. f.
Using two points from the chart 4,0 and 6,20 20020 slope2 6410 ===
b. The vertical intercept is () 0,8 . That is the point where the graph crosses the y-axis.
c. The horizontal intercept is () 4,0 . That is the point where the graph crosses the x-axis.
d.
()
Since the -intercept is 0,8 then 8. Since the slope is 2 then 2. Use where 2 and 8. The equation of the line is 28. yb m ymxbmb yx = = =+== =+
706.252.75
67.756.25
67.756.25
6.256.25 10.84 t t t t =+ = = =
In 2021, about 70% of the total U.S. music revenues will be from streaming. 10.
a.
Using two points from the chart 0,12 and5,8 81244 slope 5055 ===−
b.
The -intercept is (0,12) because when 0,12.yxy==
c () The -intercept is 15,0 because when 0, 15. xyx== d.
() Since the -intercept is 0,12, then 12. 44 Since the slope is , then . 55 4 Use where and 12. 5 4 The equation of the line is 12. 5 yb m ymxbmb yx = −=− =+=−= =−+
12. Domain: All real numbers, Range: All real numbers 13. 2 2 22 2 Wht Wht tt
Algebraic Step to Solve the Equation
Reason for Each Step
()() 1.5342.547 xxx +=+− This is the given equation.
1.54.541017.5 xxx +=+− Apply the distributive property to both sides. 1.54.51417.5 xx+=− Combine like terms on the right side.
1.54.54.51417.54.5 xx +−=−− 1.51422 xx=−
Subtract 4.5 from both sides to get constant terms on the same side.
May not be scanned, copied or duplicated, or posted to a publicly accessible website, in whole or in part.
1.514142214 xxxx −=−−
12.522 x −=−
Subtract –14x from both sides to get the variable terms on the same side.
12.522 12.512.5 x = Divide both sides by –12.5 to isolate the variable. 1.76 x = Solution
15. In 2016, the population of New York will be about 19.6 million.
16 () 0.205Hpp=+
a. ()() () 700.20705 7019 H H =+ =
To earn a 70% on the exam, you need to study about 19 hours.
b. ()() () 1000.201005 10025 H H =+ =
To earn a 100% on the exam, you need to study about 25 hours.
17 () 73fxx=−
a.
c. Domain: All real numbers, Range: All real numbers
c. Domain: All real numbers, Range: All real numbers
19. () 9 gx =− a. () () () 9 9 69 gx g g =− =− =−
b. Domain: All real numbers, Range: { }9
20. A relation may not be a function if the input value was paired with more than one output value.