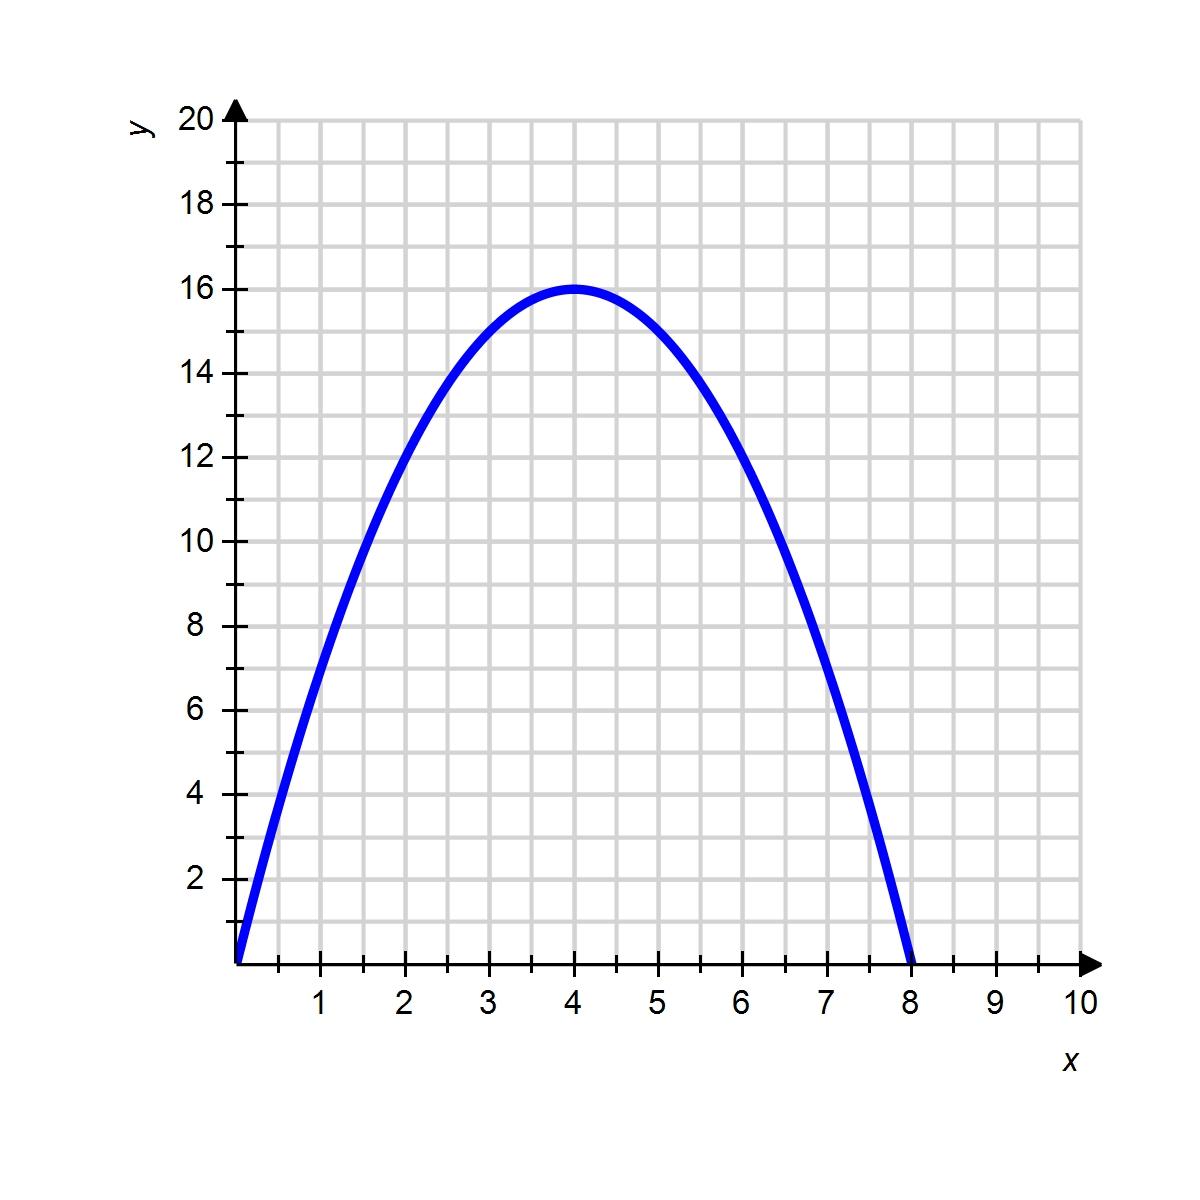
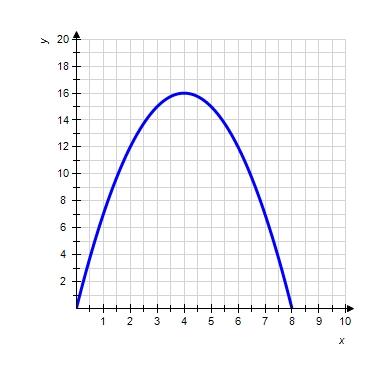
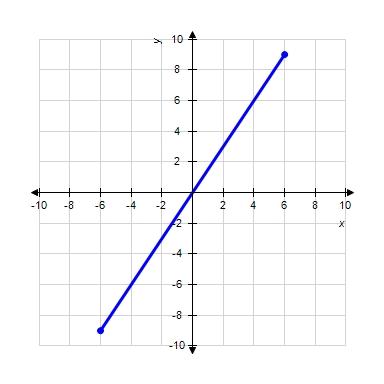
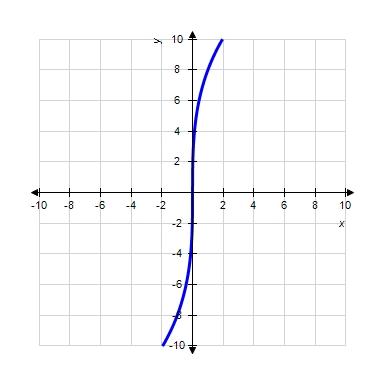
1. Use the graph of the function f to find

1.2 Functions and Models
a. 10
b. 7
c. 5
d. 3
e. 6
ANSWER: b
POINTS: 1
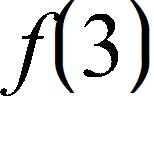
QUESTION TYPE: Multiple Choice
HAS VARIABLES: True
DATE CREATED: 2/10/2016 3:48 PM
DATE MODIFIED: 10/24/2016 1:39 AM
2. Use the graph of the function f to find

1.2 Functions and Models
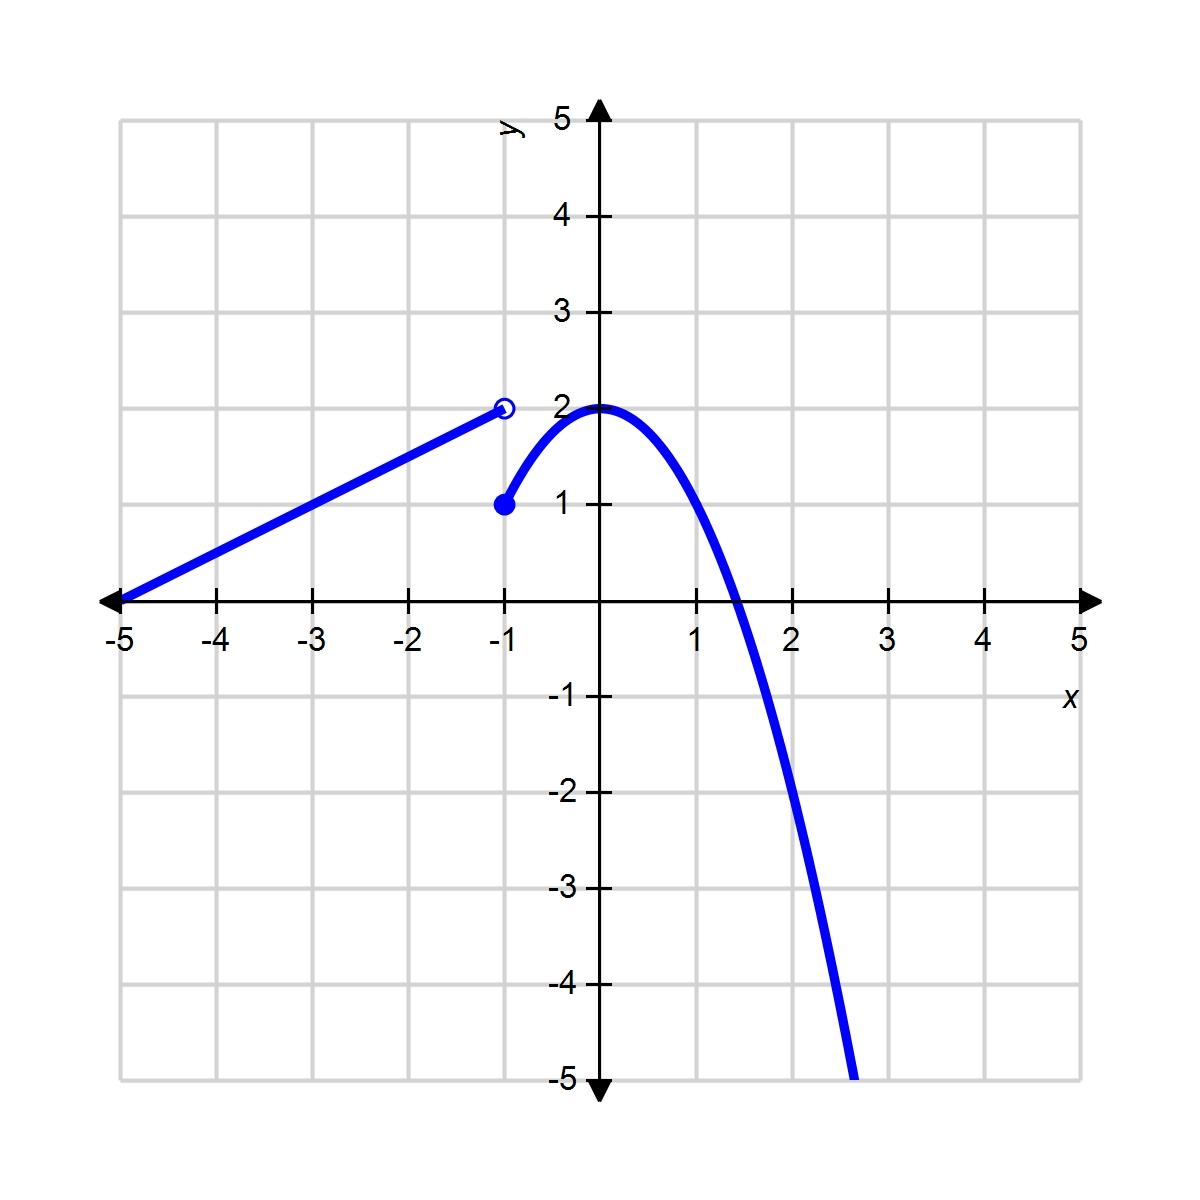
a. 1
b. –1
c. 2
d. 2.5
e. 3
ANSWER: a
POINTS: 1
QUESTION TYPE: Multiple Choice
HAS VARIABLES: True
DATE CREATED: 2/10/2016 3:48 PM
DATE MODIFIED: 4/5/2016 9:36 AM

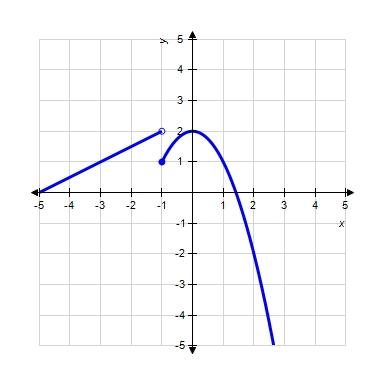
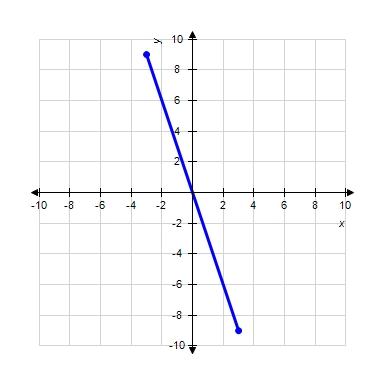
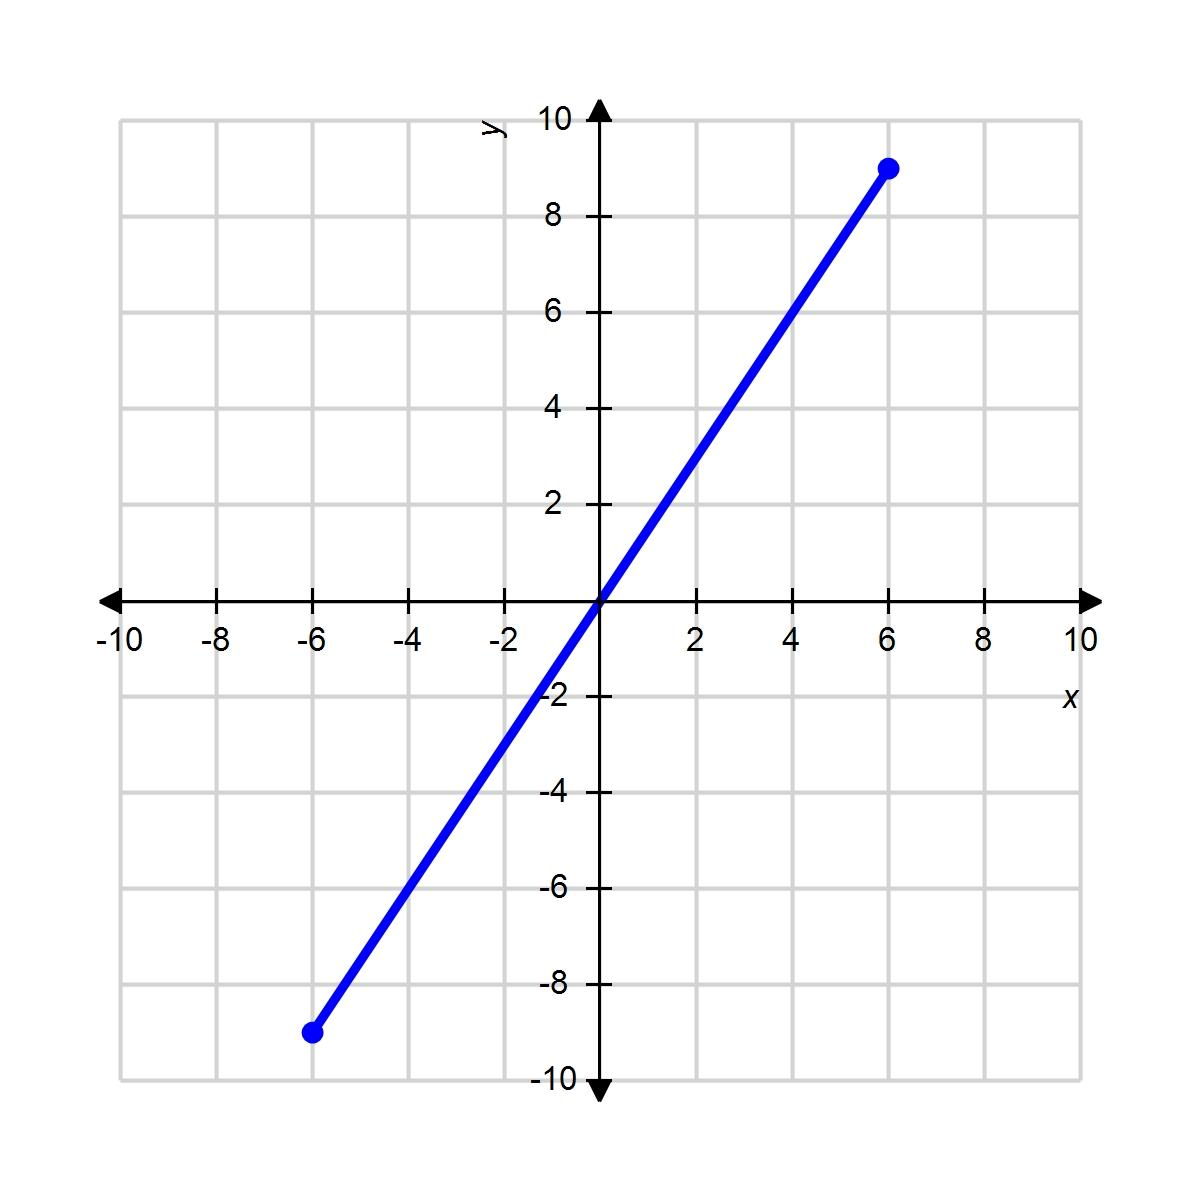
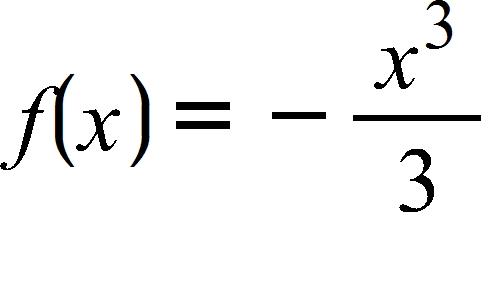
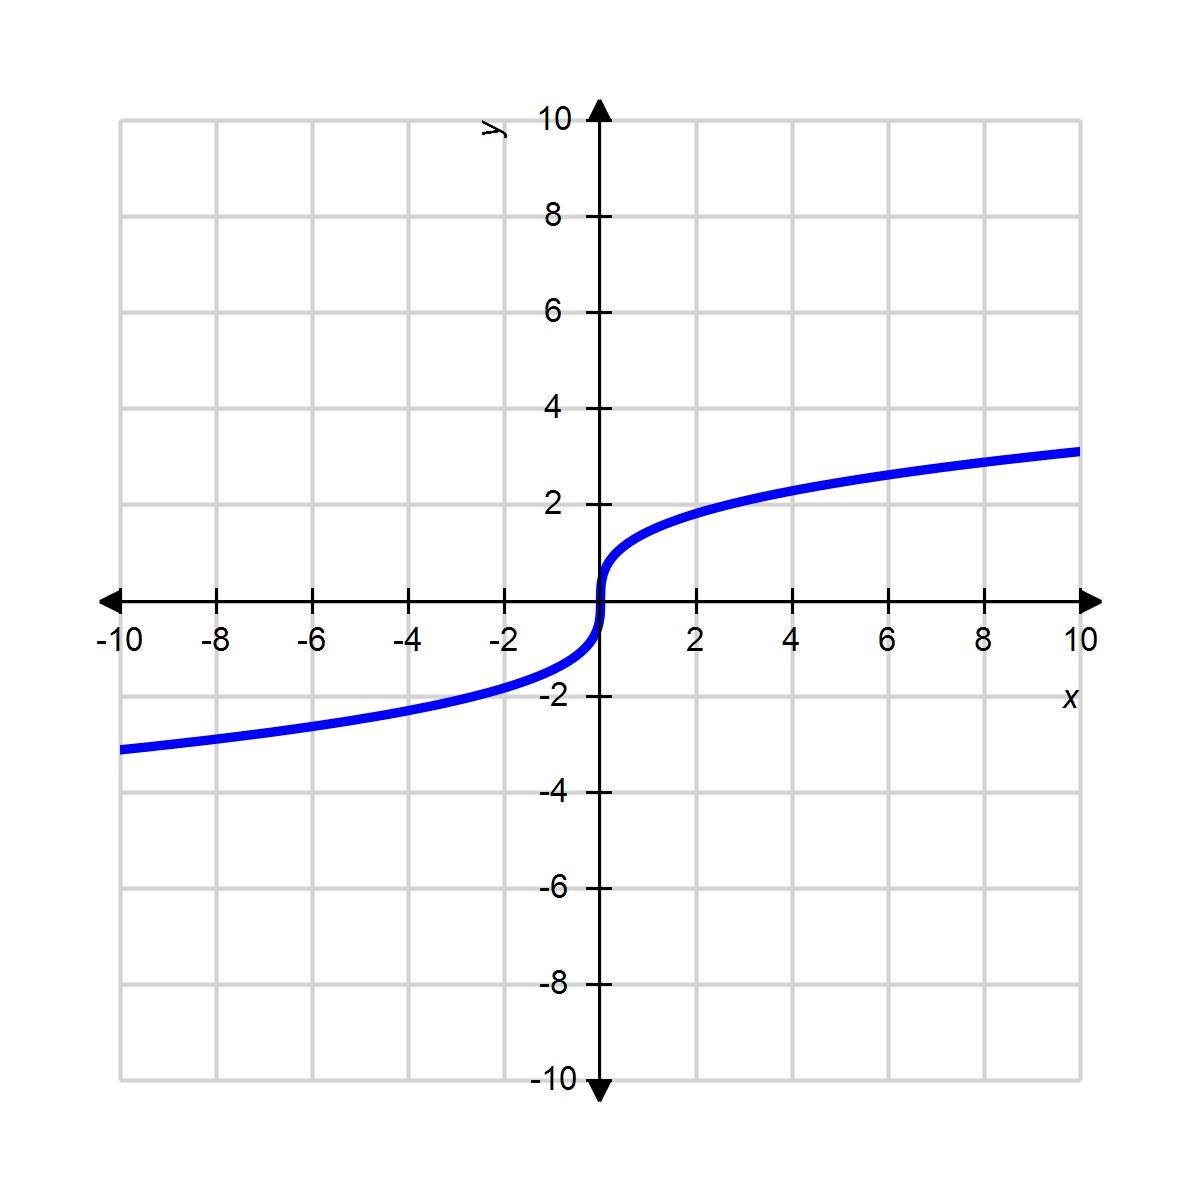
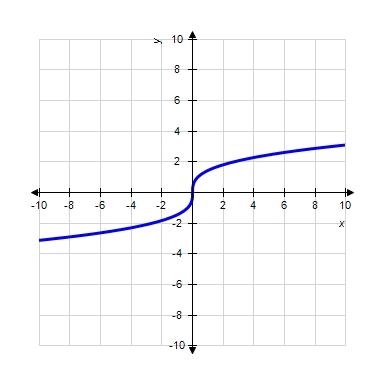
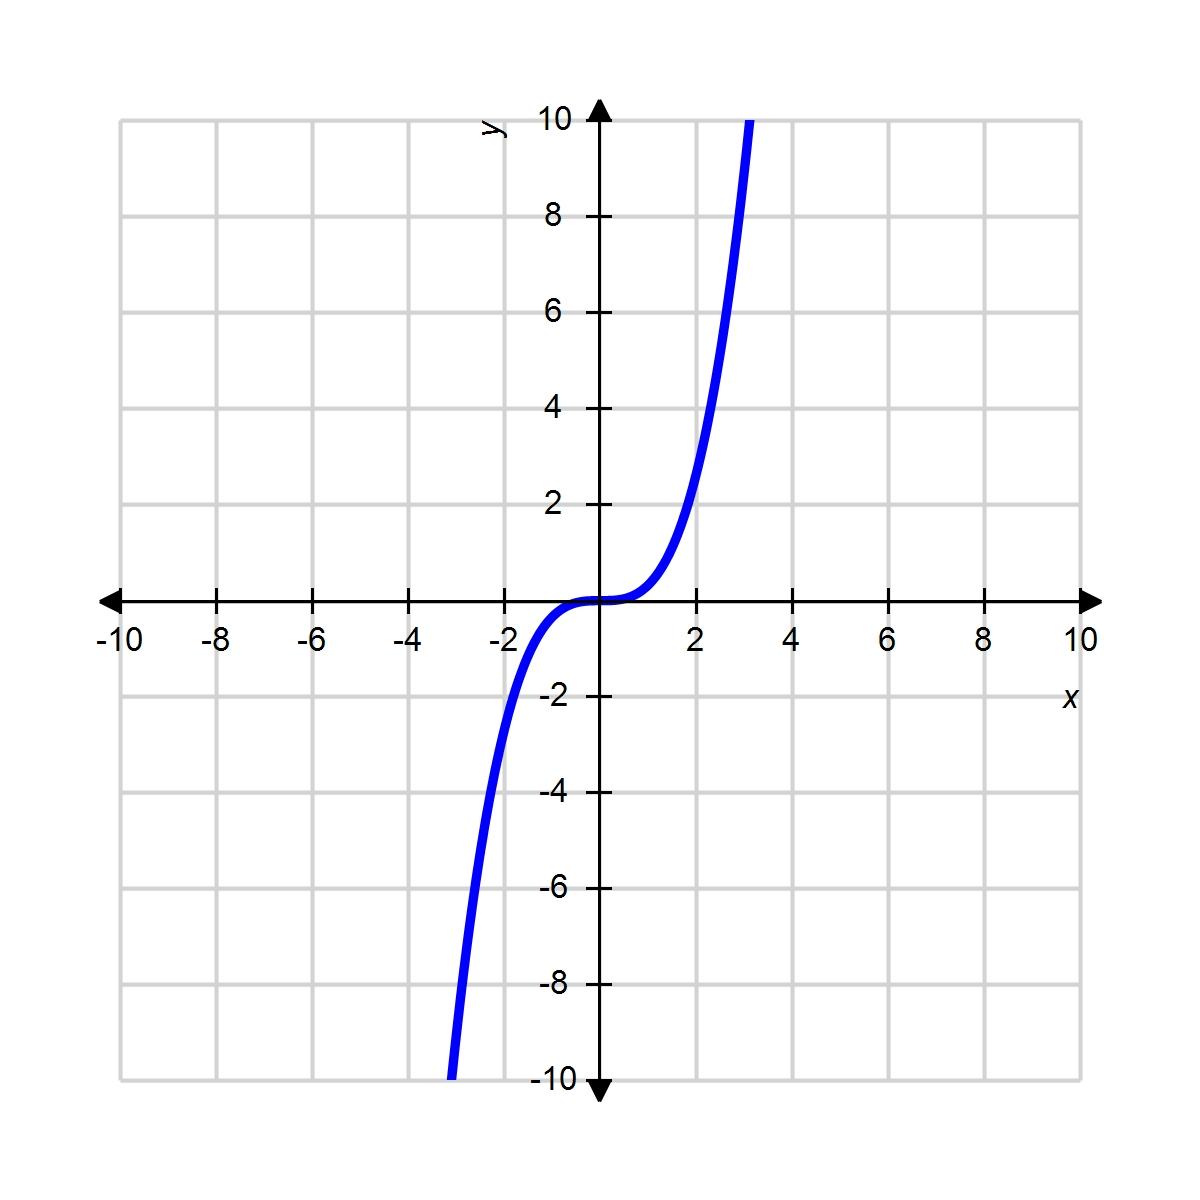
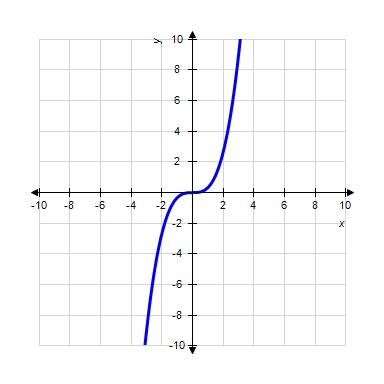
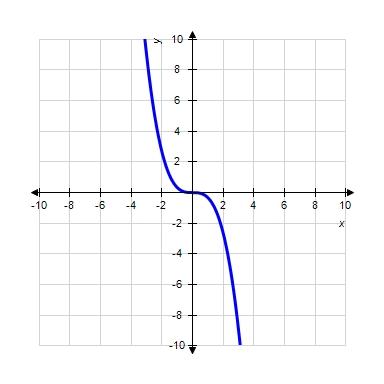
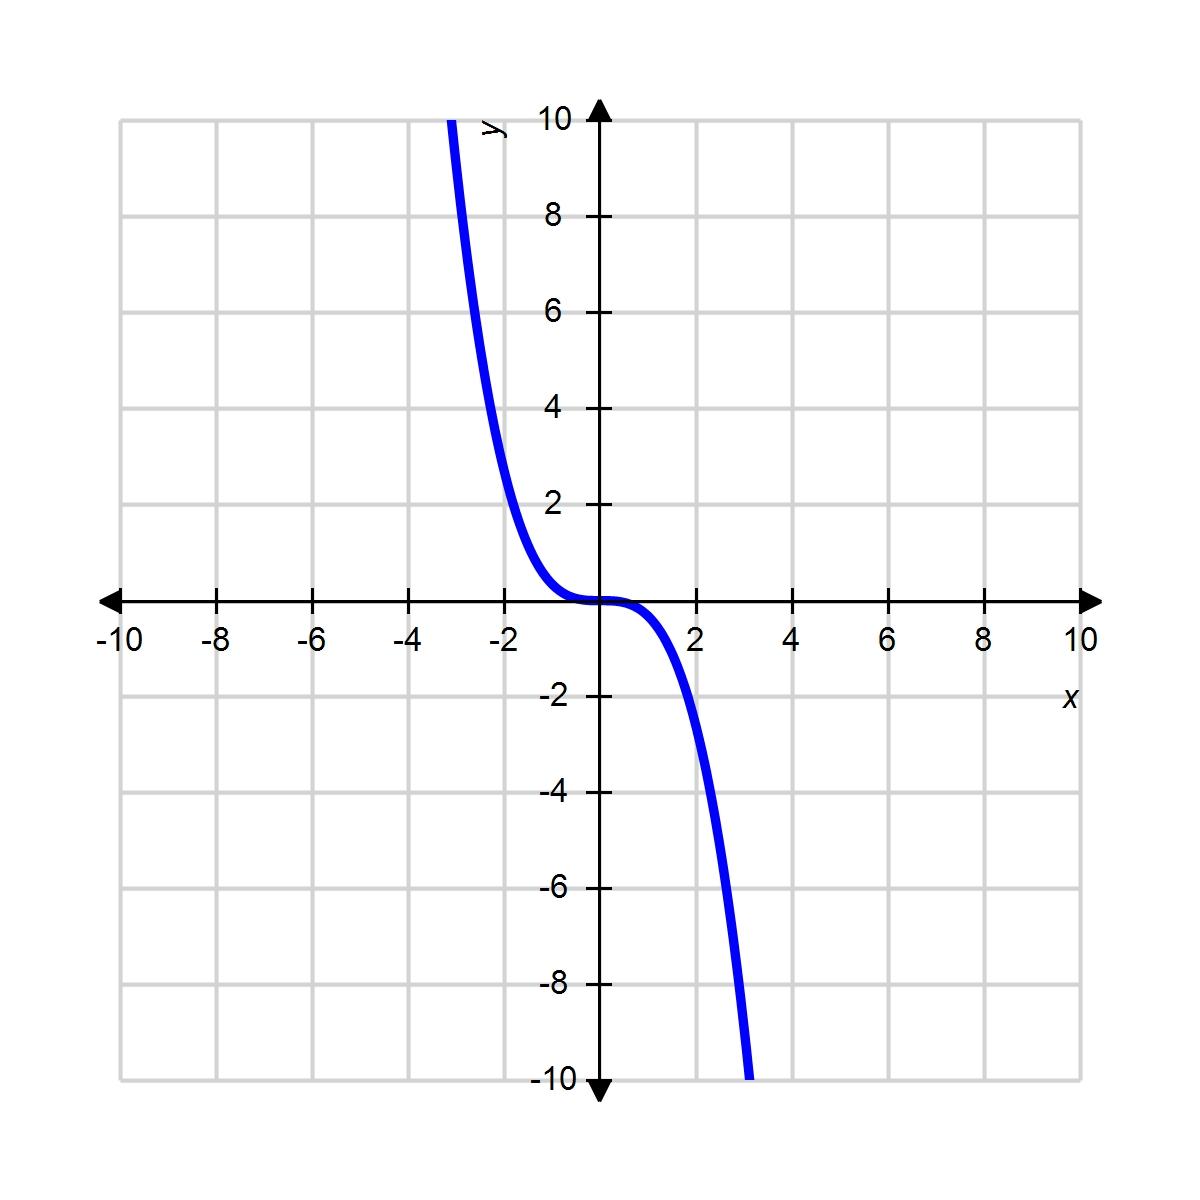
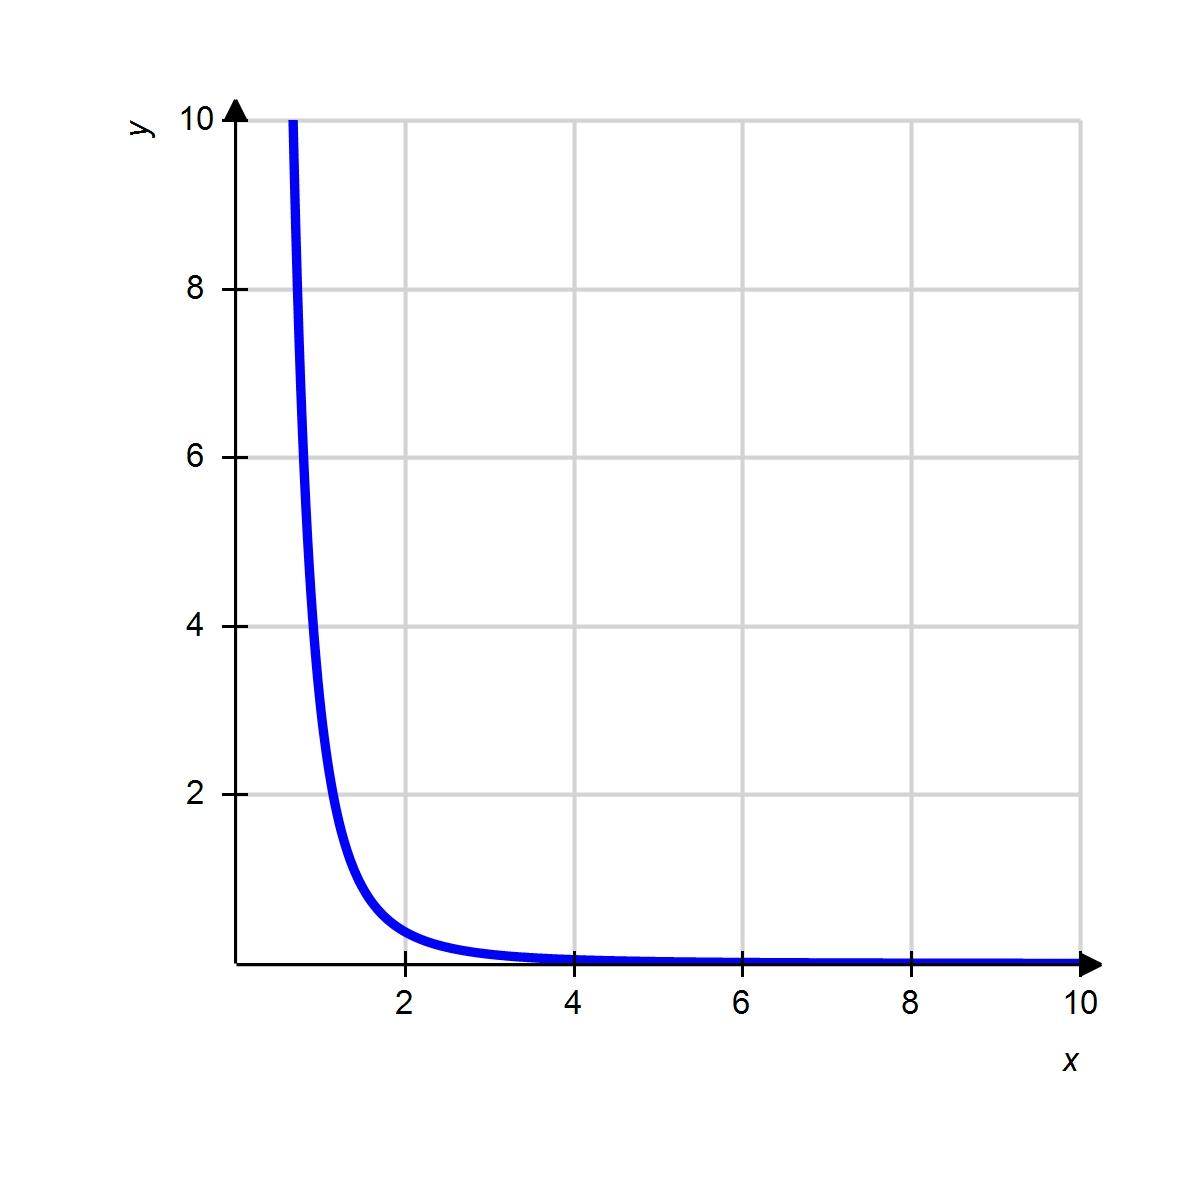
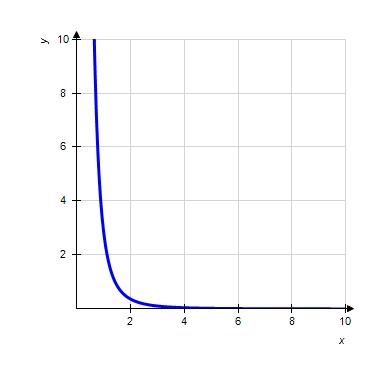
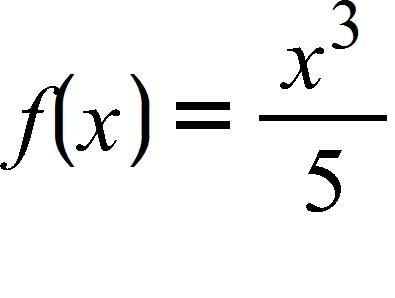
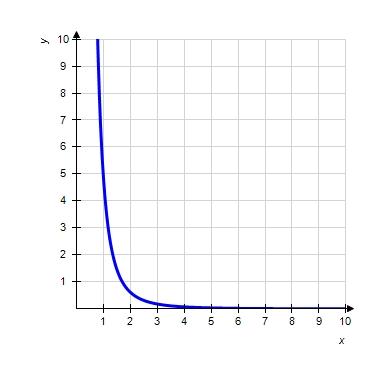
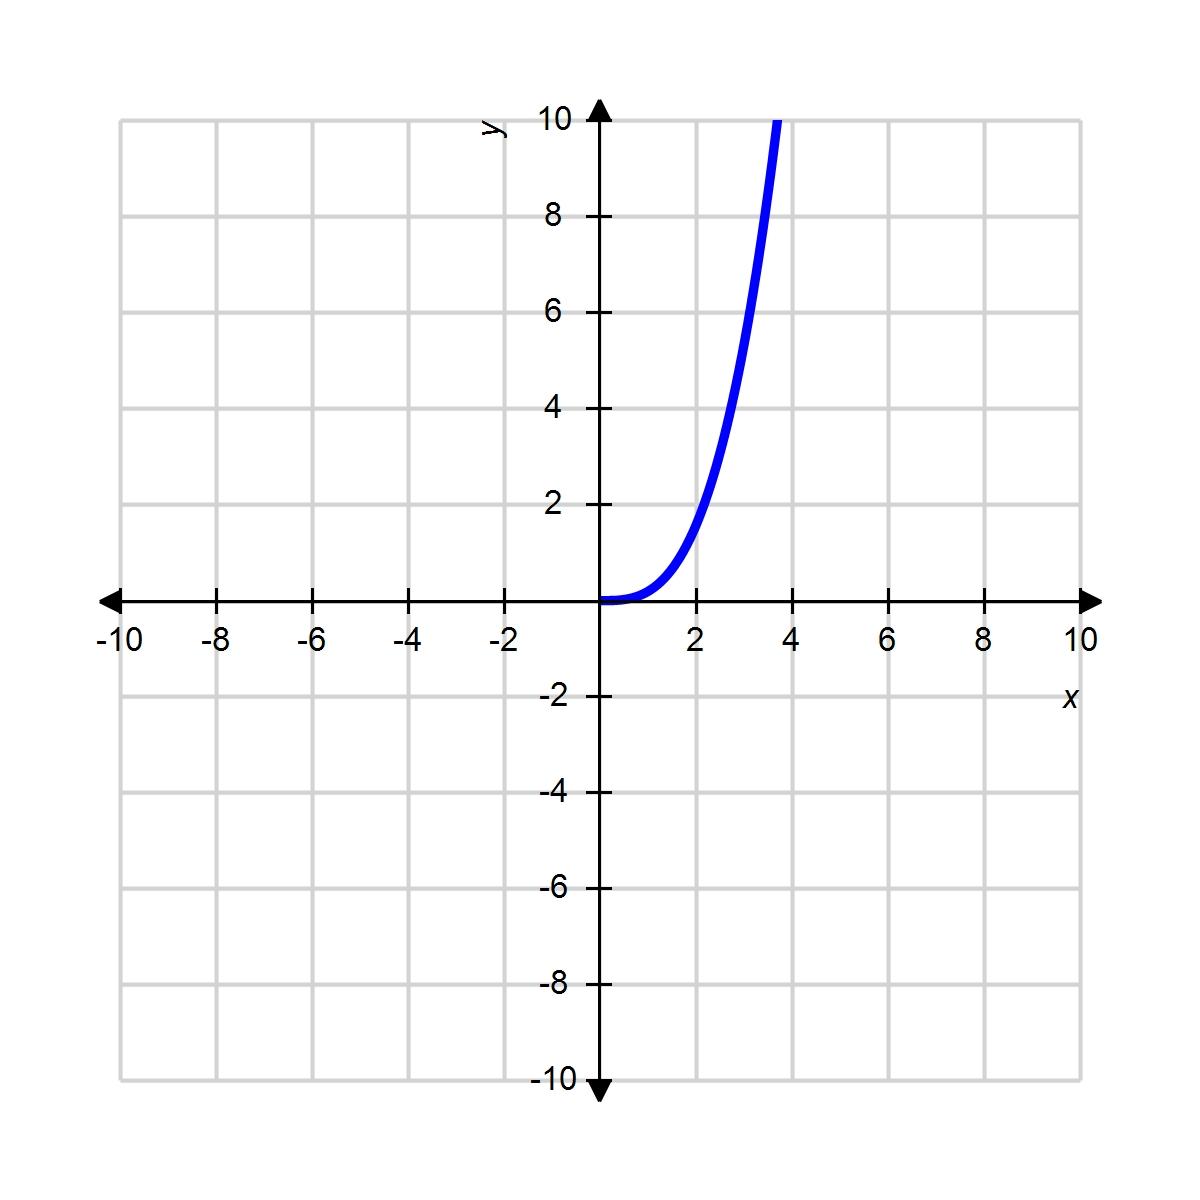
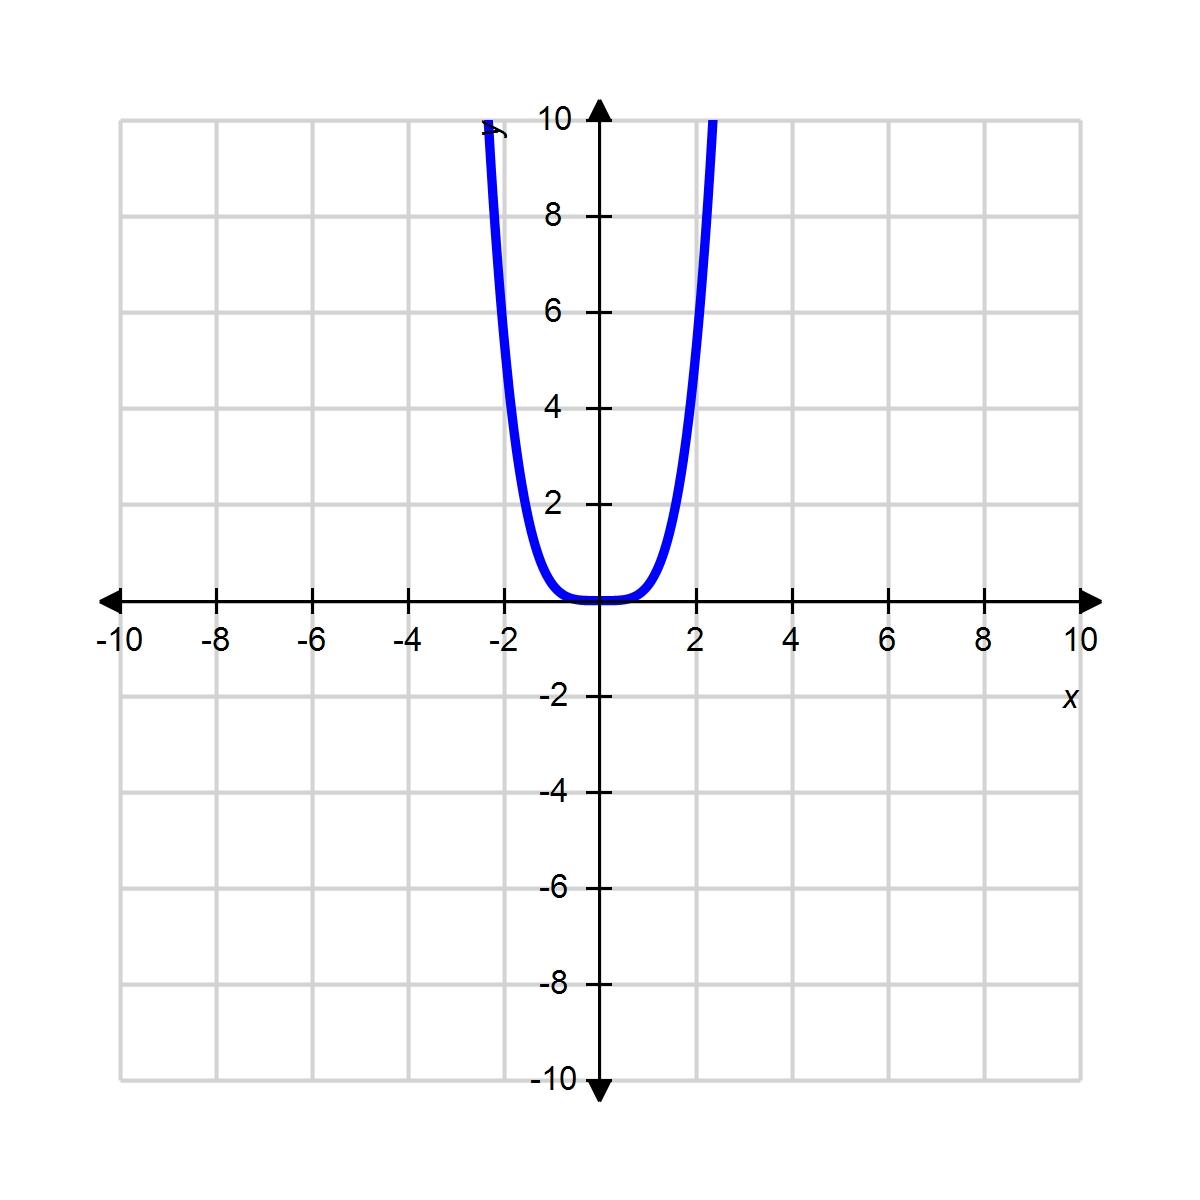
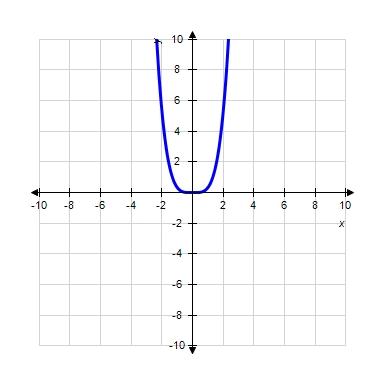
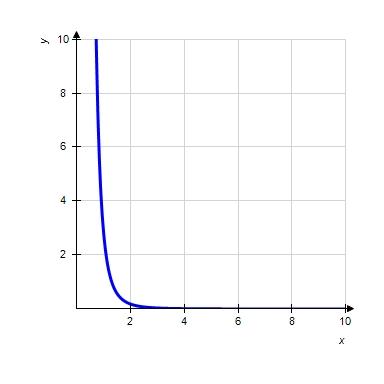
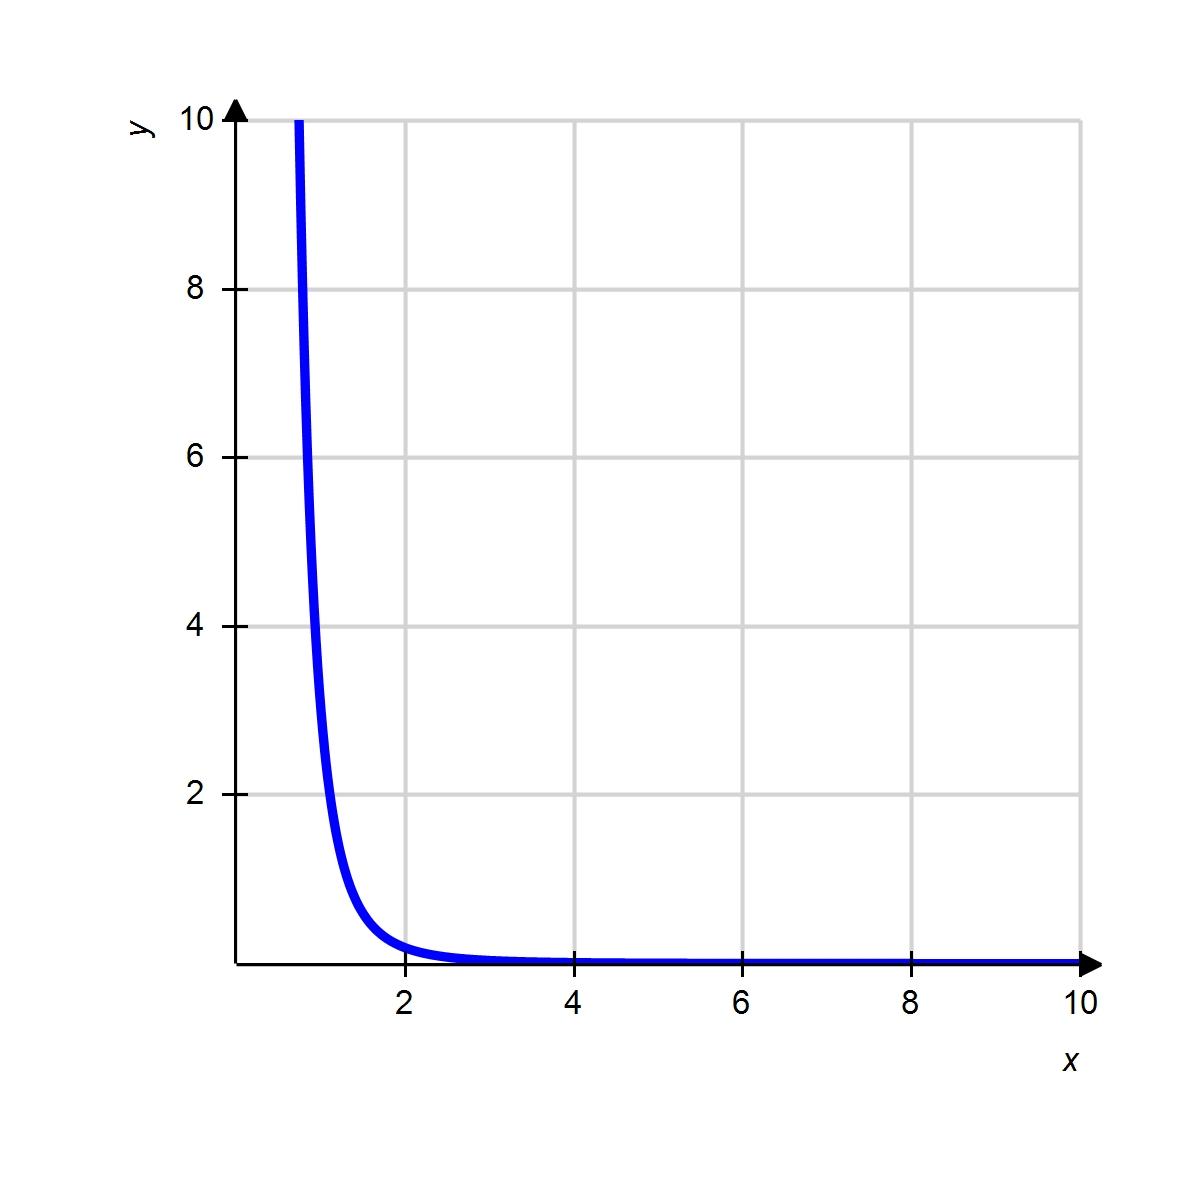
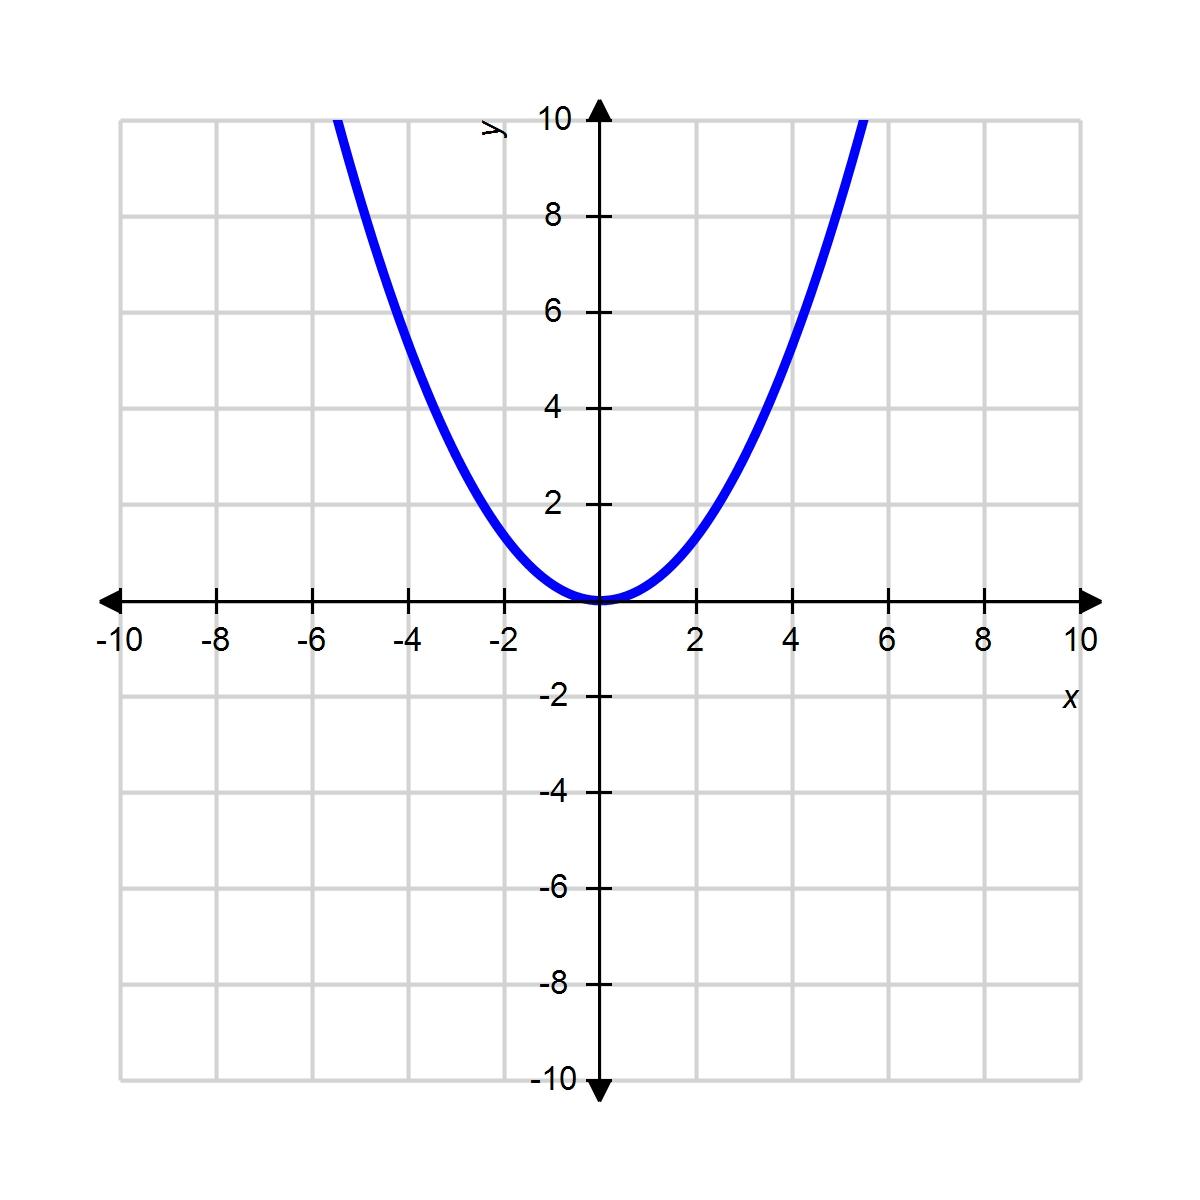
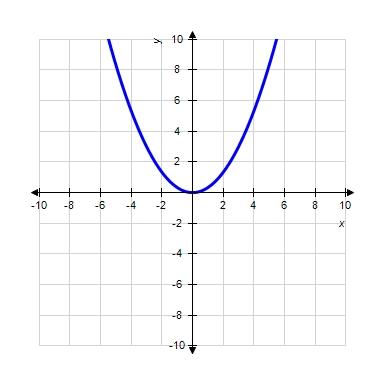
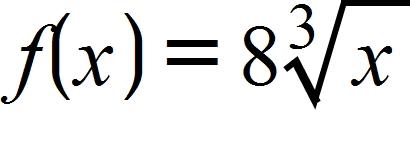
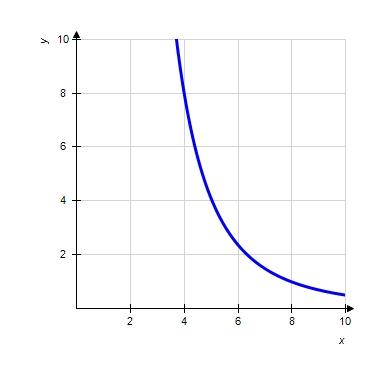
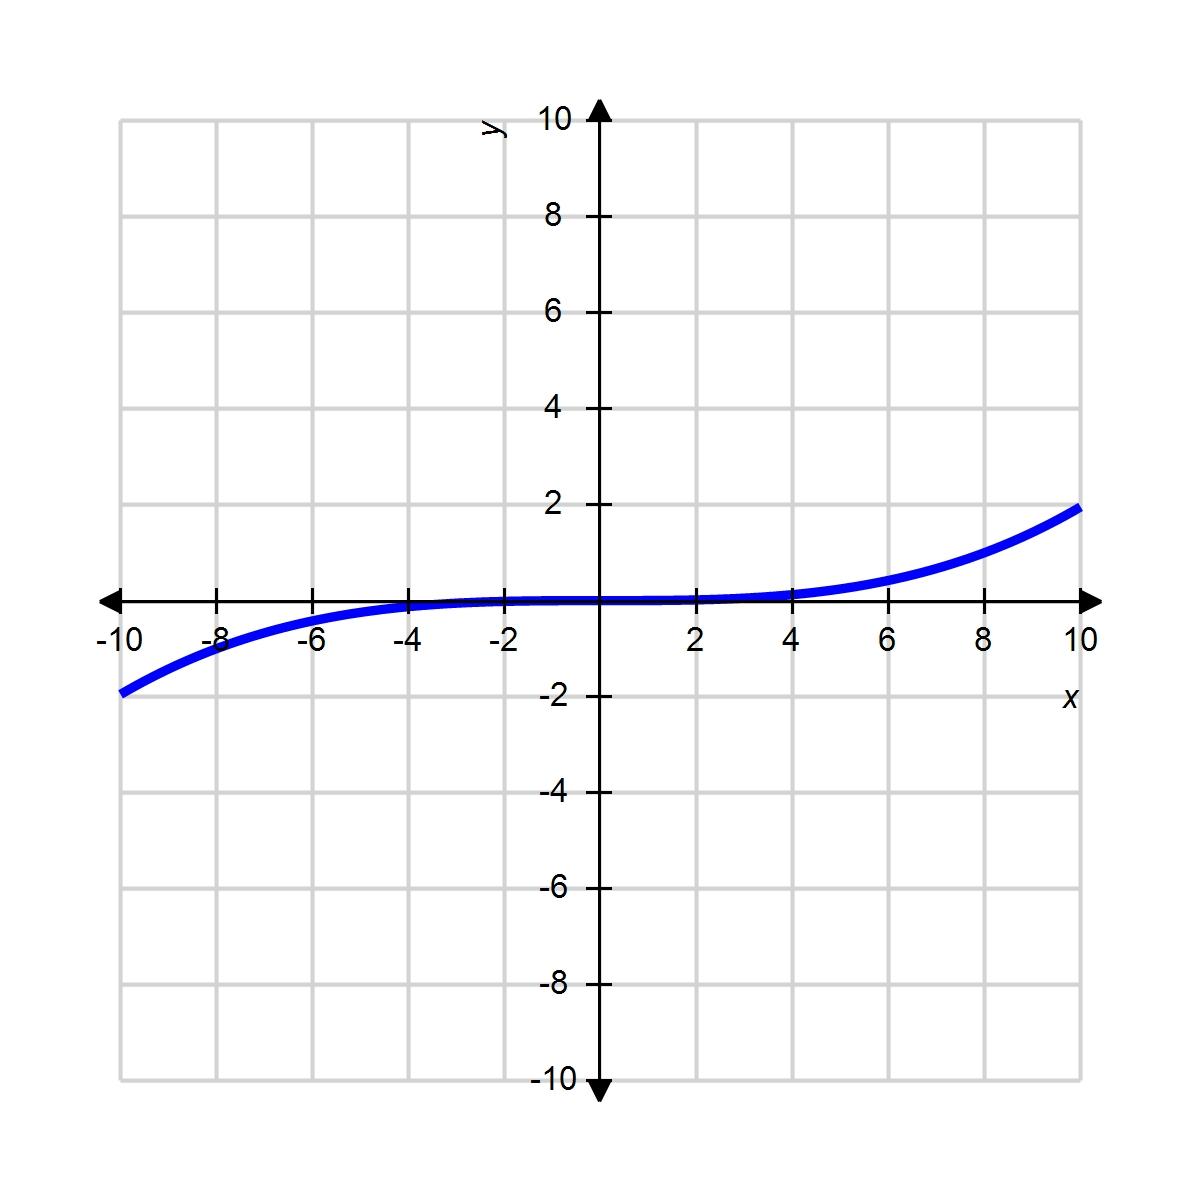
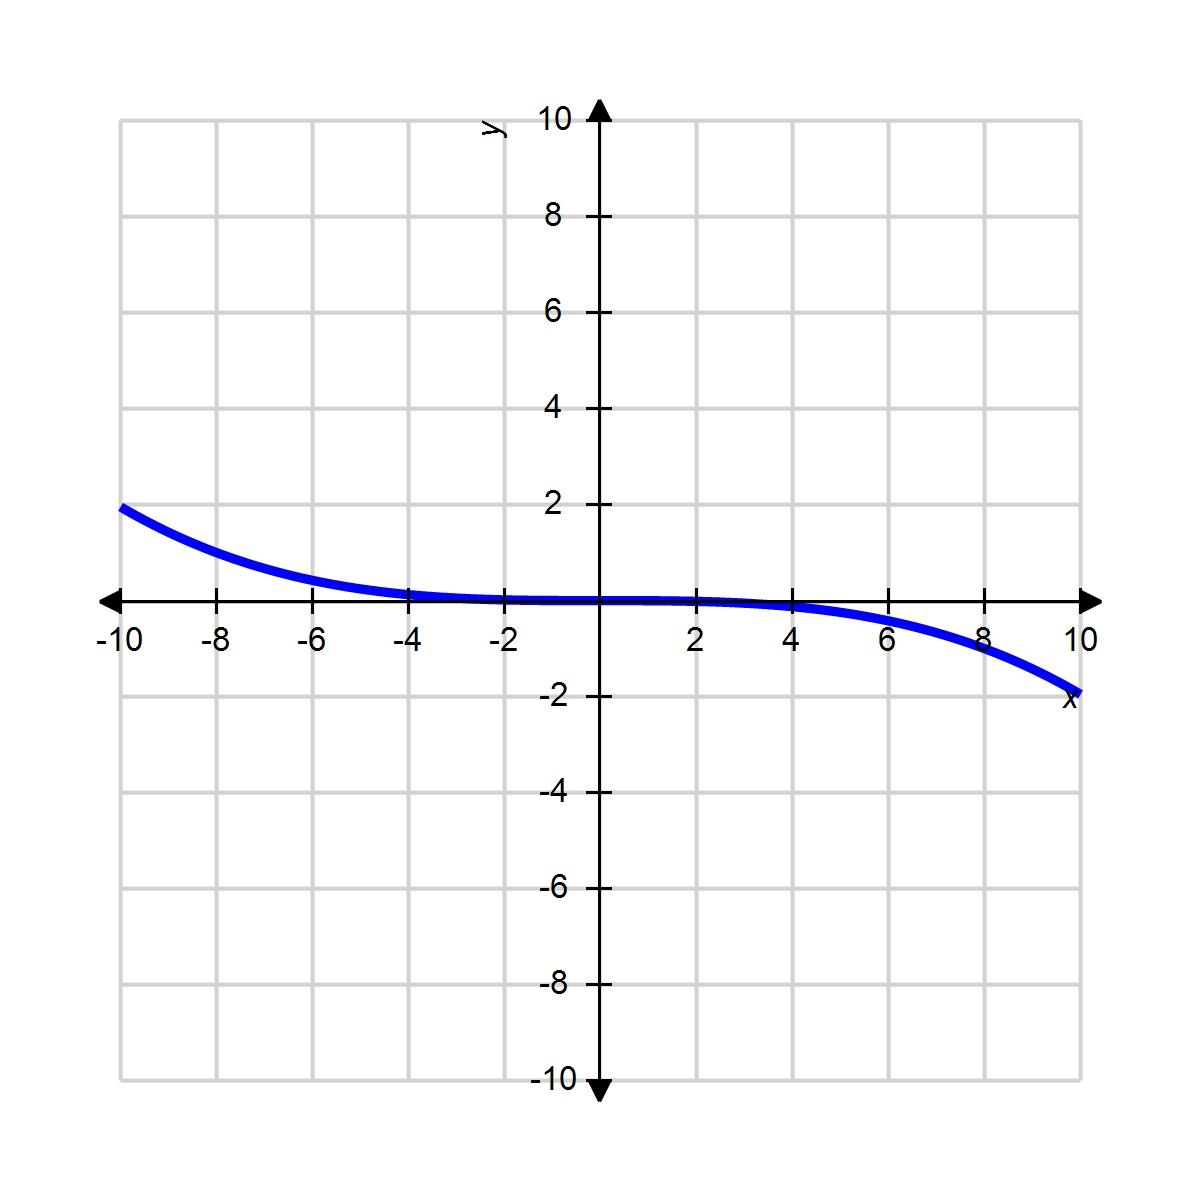
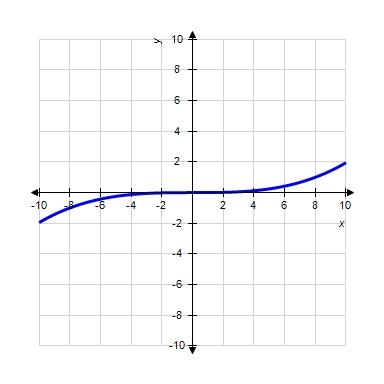
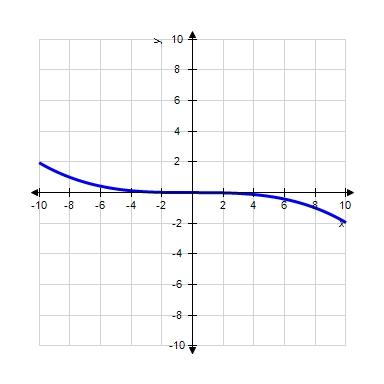
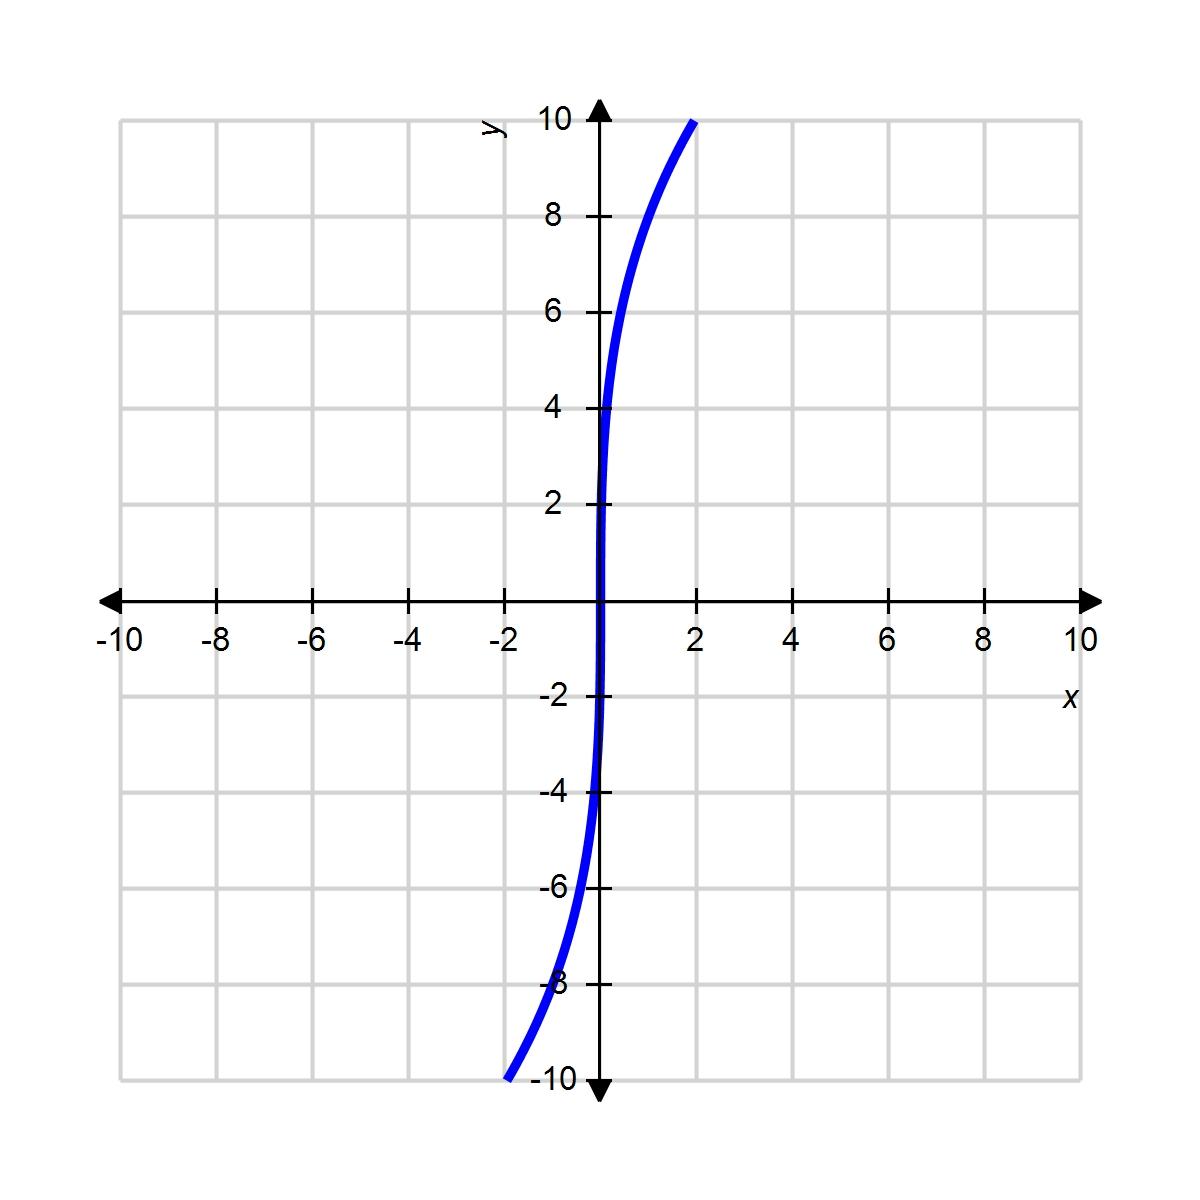
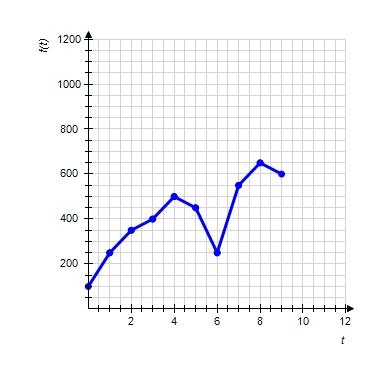
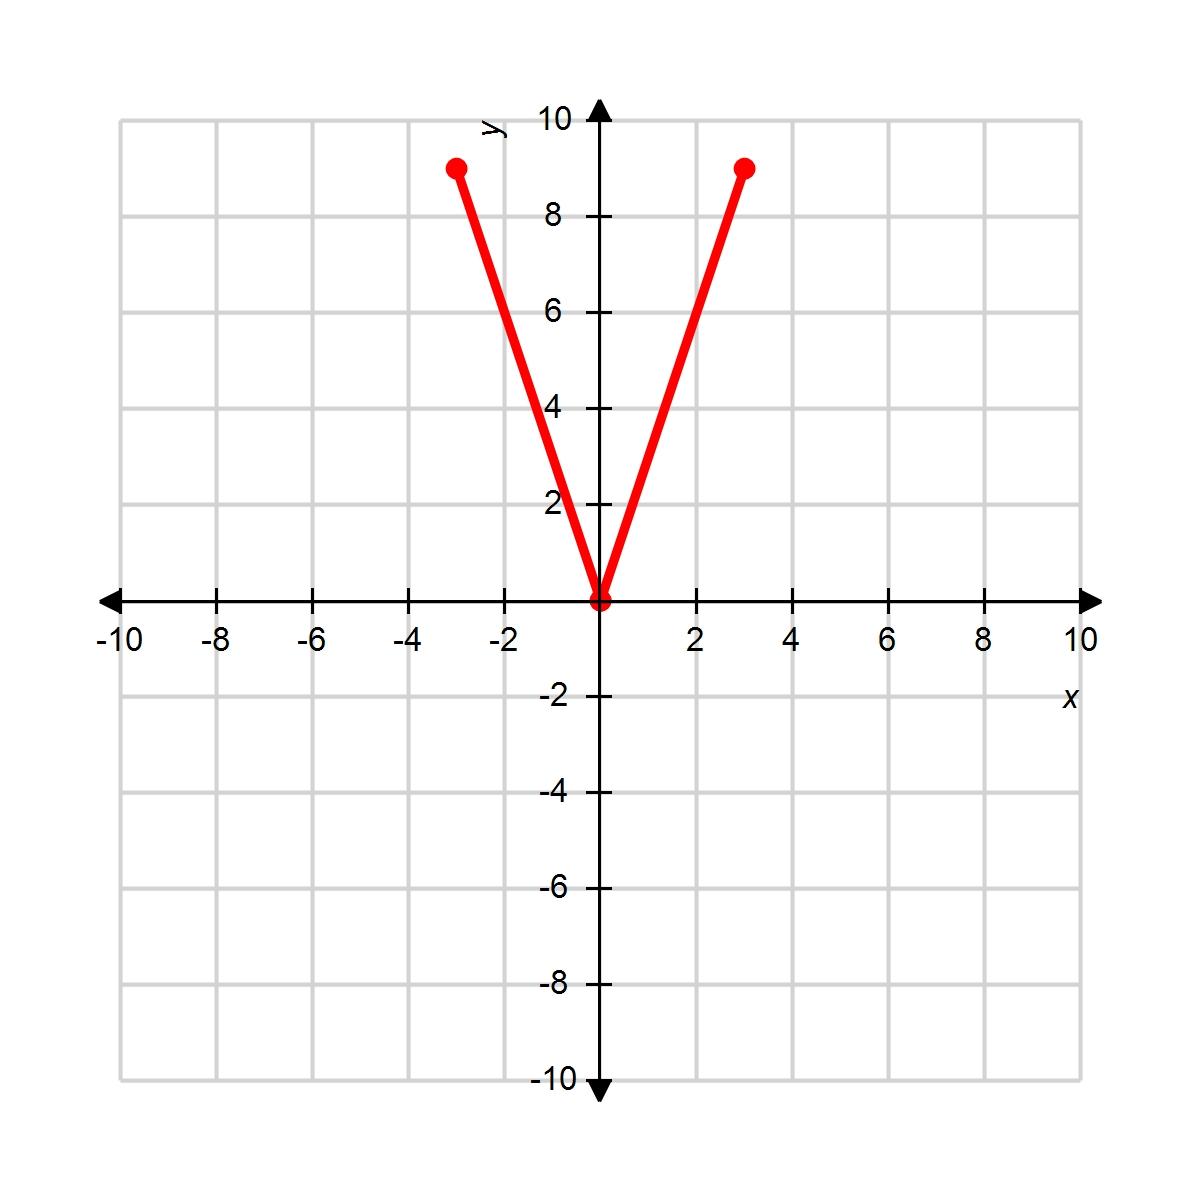
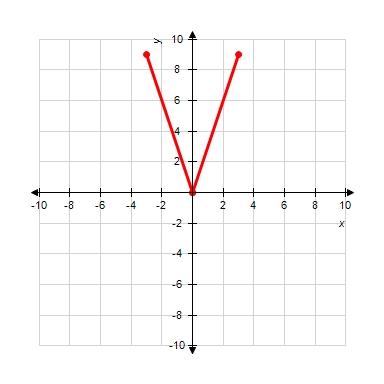
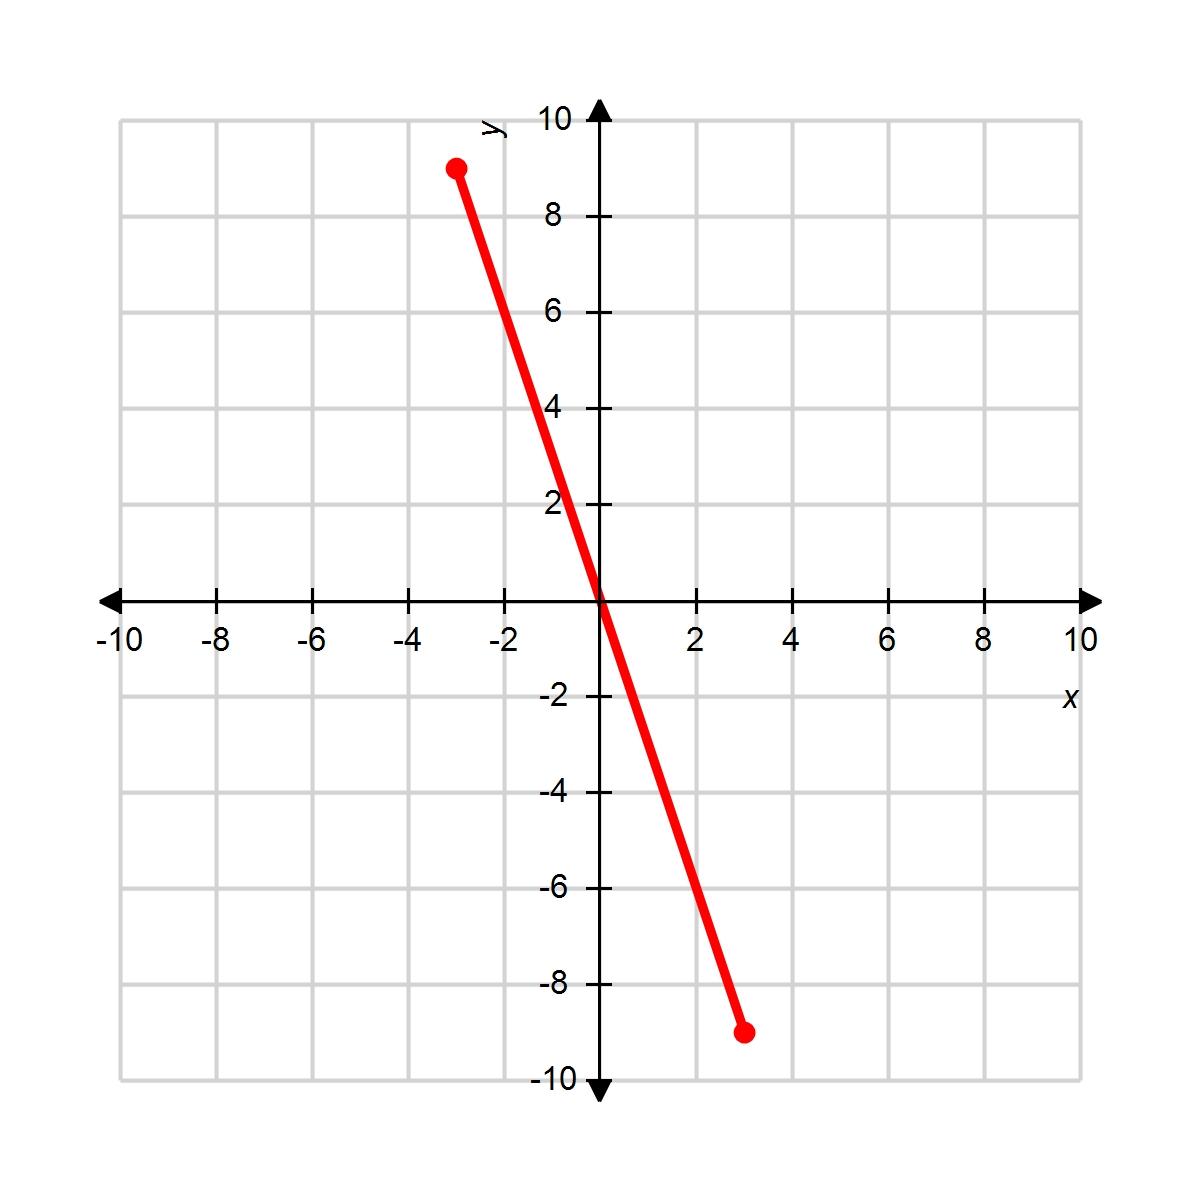
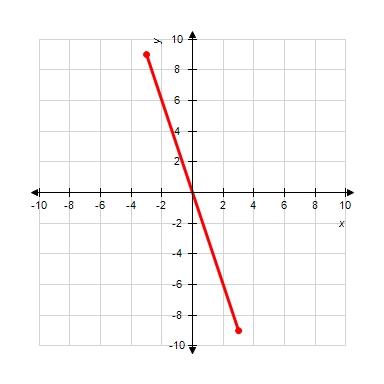
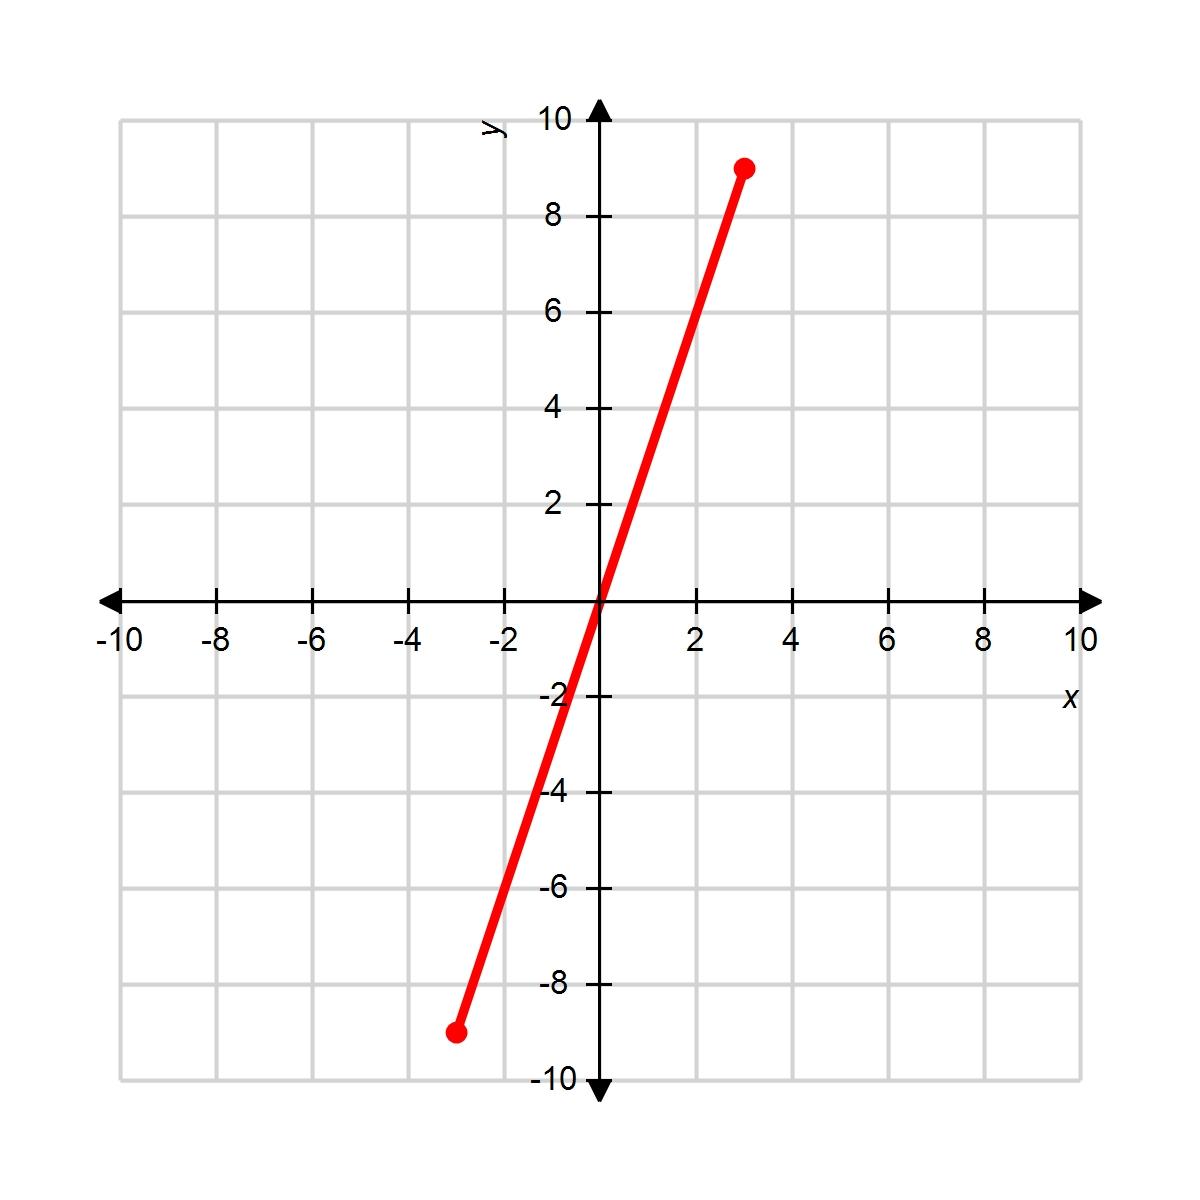
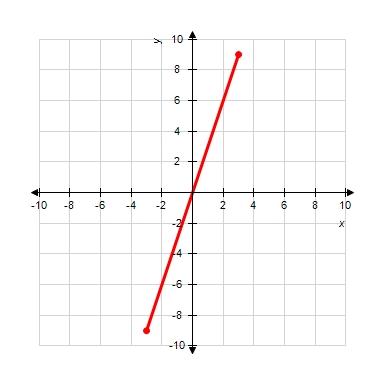
3. Choose the graph of the function , from the following:

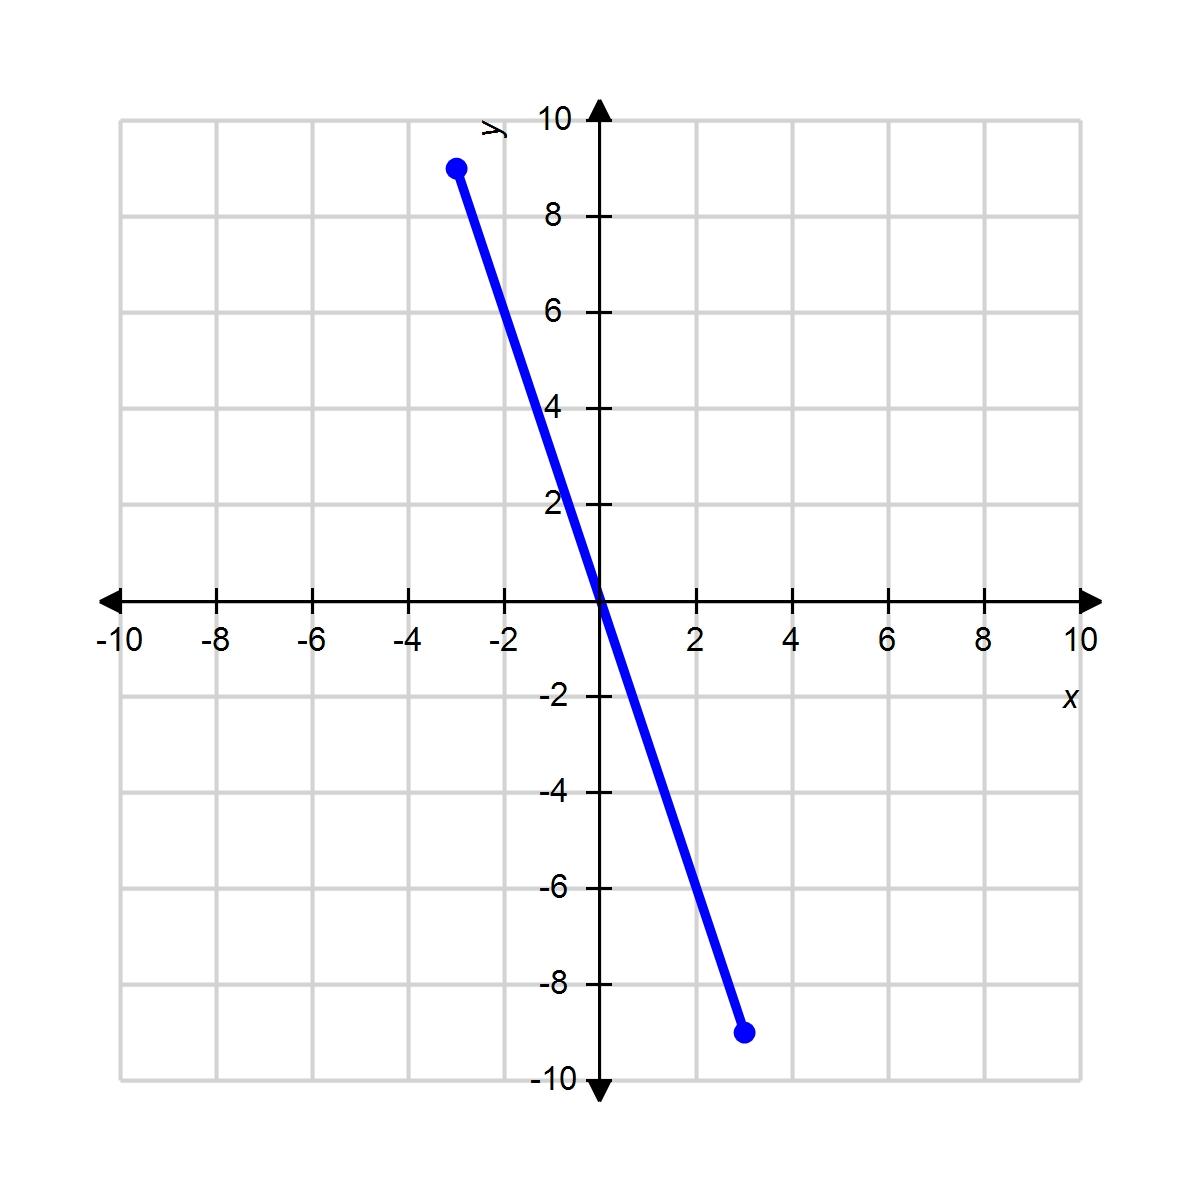
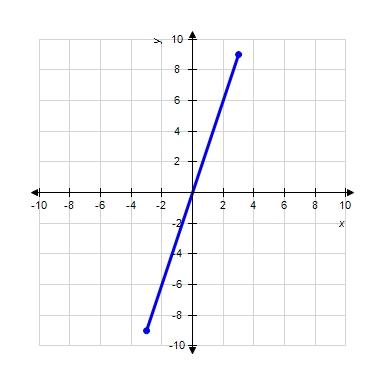
ANSWER: c
POINTS: 1
QUESTION TYPE: Multiple Choice HAS VARIABLES:
DATE CREATED: 2/10/2016 3:48 PM
DATE MODIFIED: 4/5/2016 9:22 AM

4. Choose the graph of the function , domain from the following:
1.2 Functions and Models

1.2 Functions and Models
ANSWER: c
POINTS: 1
QUESTION TYPE: Multiple Choice HAS VARIABLES: True
DATE CREATED: 2/10/2016 3:48 PM
DATE MODIFIED: 4/5/2016 9:30 AM

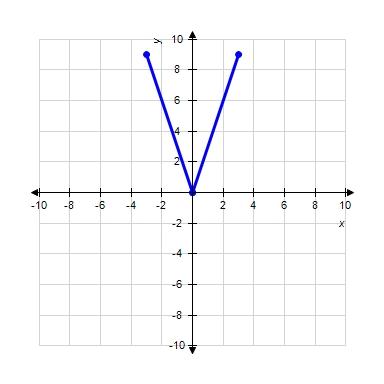
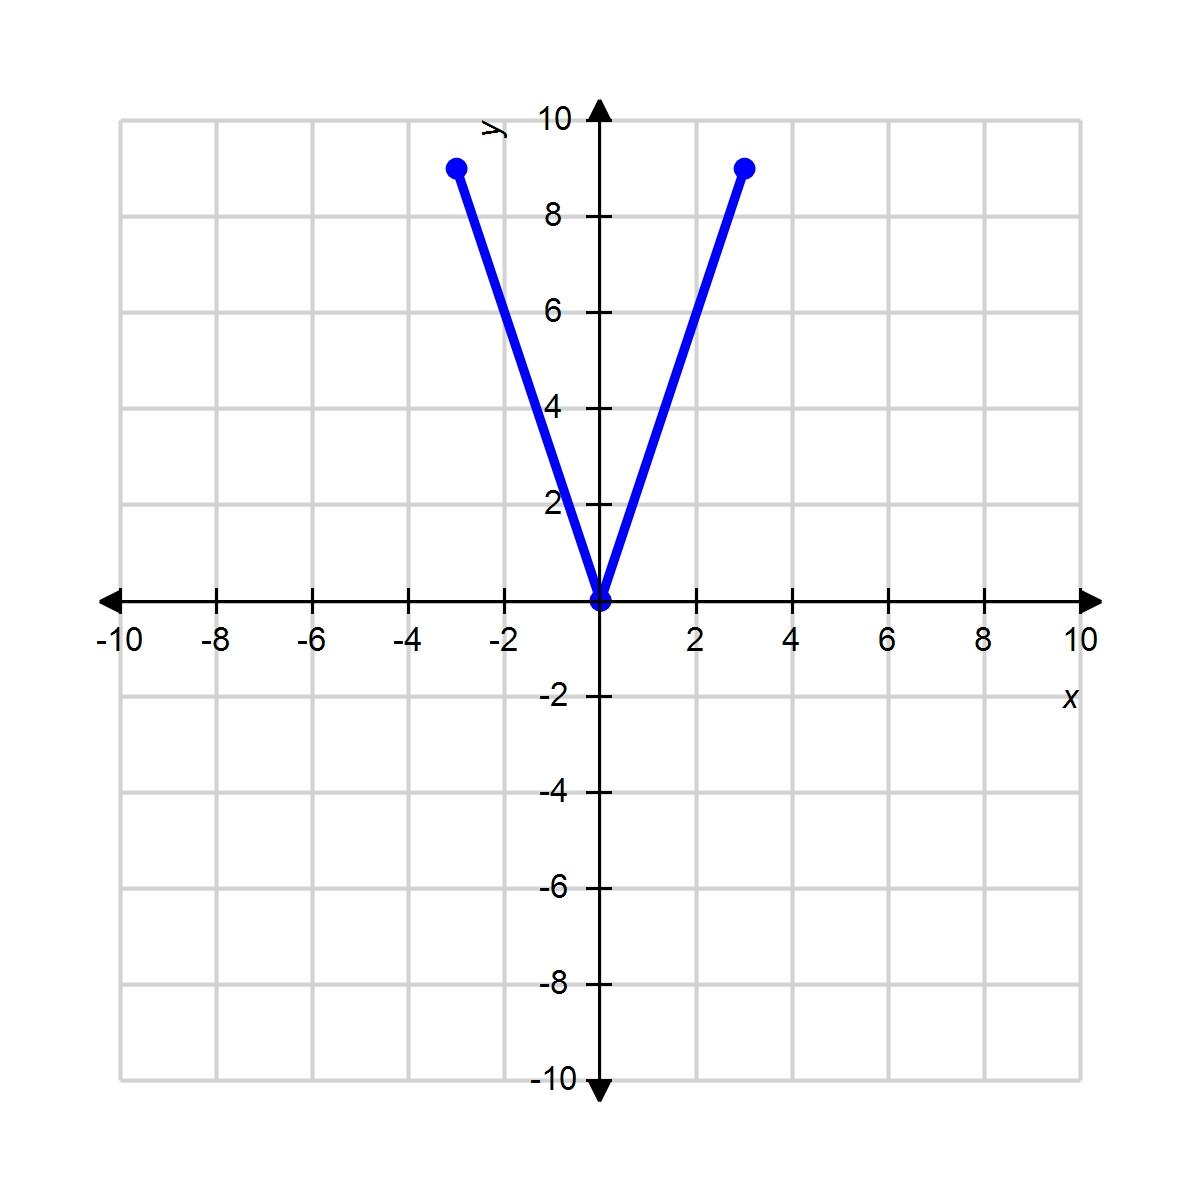
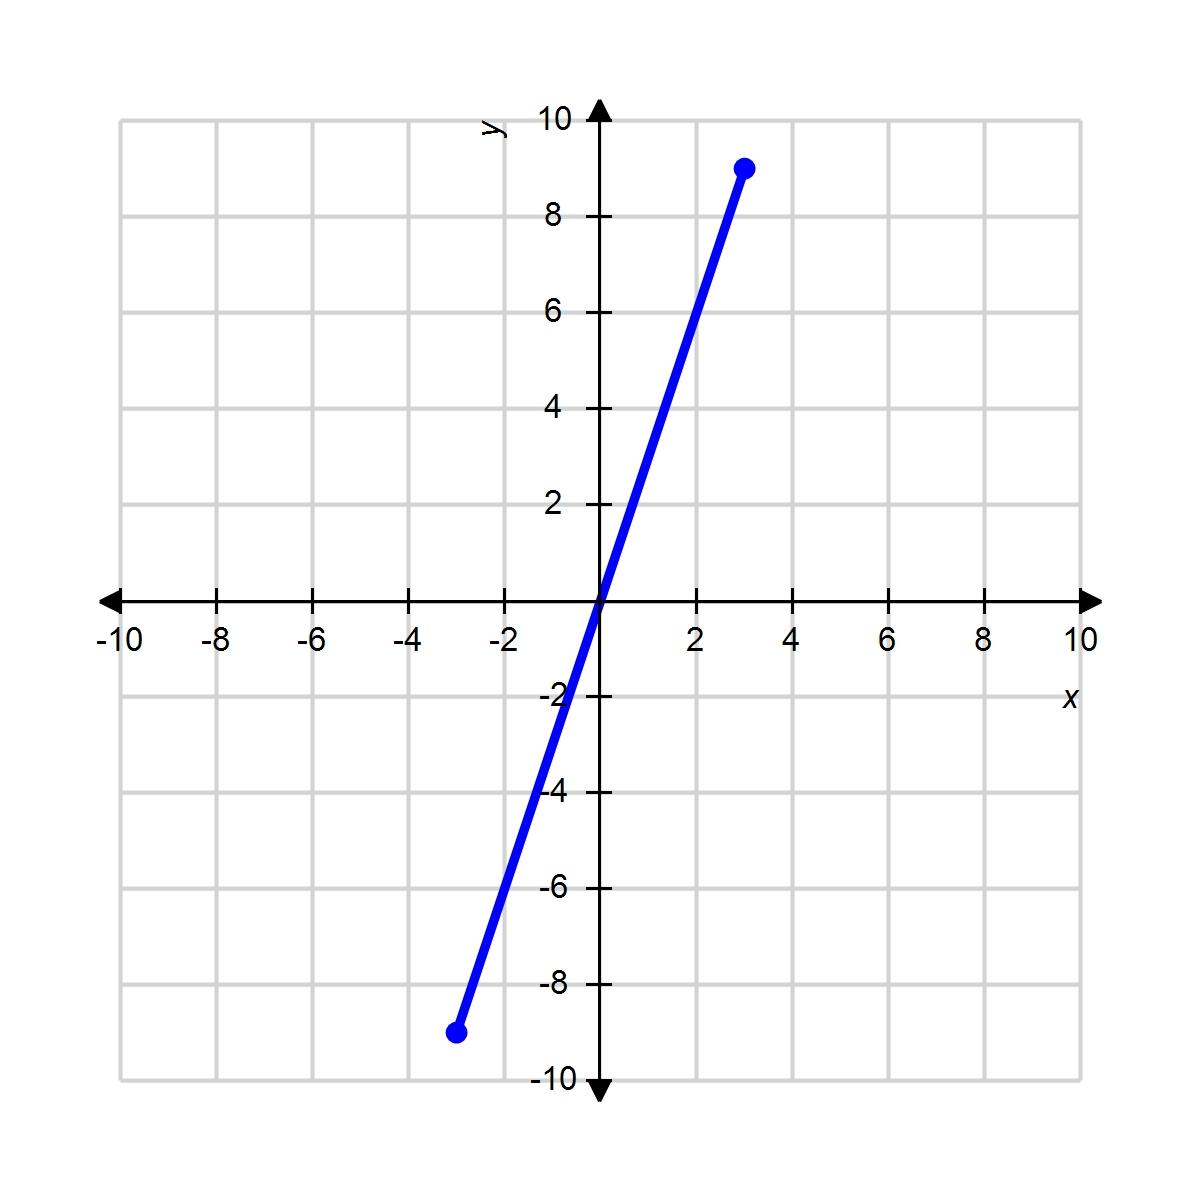
5. Choose the graph of the function , domain from the following:

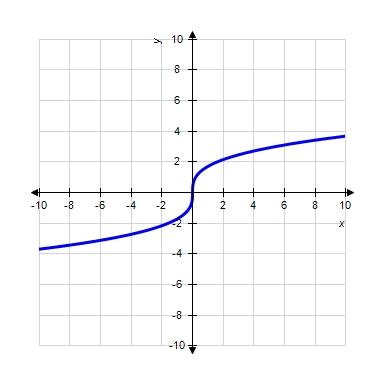
ANSWER: d
POINTS: 1
QUESTION TYPE: Multiple Choice HAS VARIABLES:

DATE CREATED: 2/10/2016 3:48 PM
DATE MODIFIED: 4/5/2016 9:42 AM


6. Choose the graph of the function , domain from the following:
1.2 Functions and Models
1.2 Functions and Models
ANSWER: b
POINTS: 1
QUESTION TYPE: Multiple Choice HAS VARIABLES: True
DATE CREATED: 2/10/2016 3:48 PM
DATE MODIFIED: 4/5/2016 11:29 AM

7. Choose the graph of the function , domain from the following: a.

ANSWER: d POINTS: 1
QUESTION TYPE:
HAS VARIABLES: True
DATE CREATED: 2/10/2016 3:48 PM
DATE MODIFIED: 5/6/2016 10:05 AM
8. Function f is
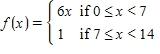
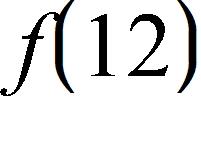
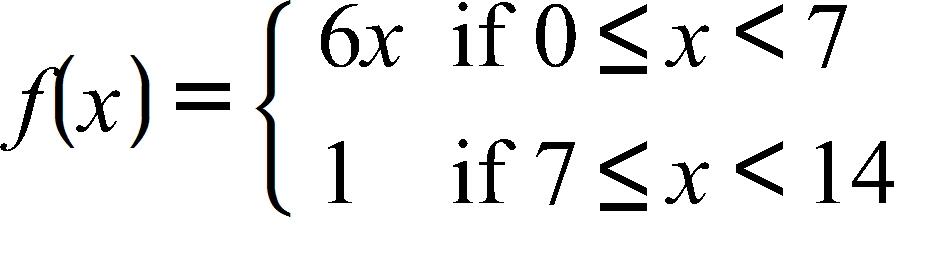

Find .
1.2 Functions and Models
a. 72
b. 1
c. 78
d. 66
e. 84
ANSWER: b
POINTS: 1
QUESTION TYPE: Multiple Choice
HAS VARIABLES: True
DATE CREATED: 2/10/2016 3:48 PM
DATE MODIFIED: 10/24/2016 1:41 AM
9. Function f is
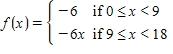
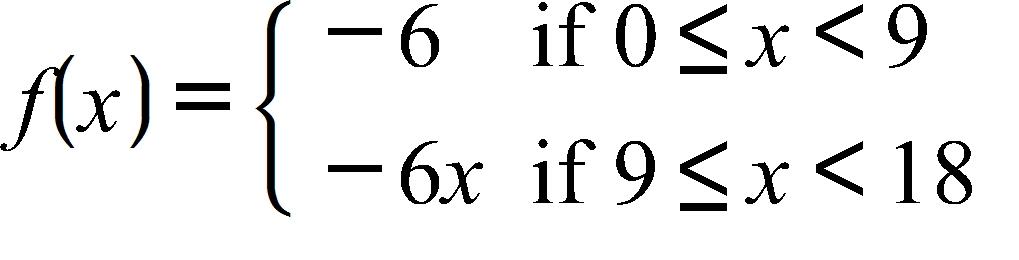
Find

a. –18
b. –6
c. 18
d. –18
e. 9
ANSWER: b
POINTS: 1
QUESTION TYPE: Multiple Choice
HAS VARIABLES: True
DATE CREATED: 2/10/2016 3:48 PM
DATE MODIFIED: 4/5/2016 11:38 AM
10. Function f is
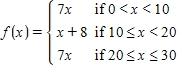
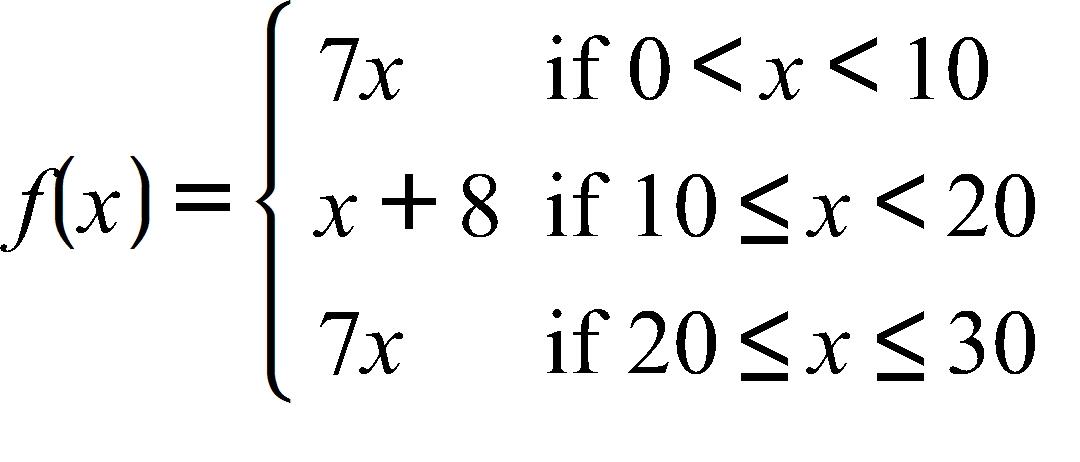
Find .
a. 22
b. 20

1.2 Functions and Models
c. 29
d. 32
e. 14
ANSWER: a
POINTS: 1
QUESTION TYPE: Multiple Choice HAS VARIABLES: True
DATE CREATED: 2/10/2016 3:48 PM
DATE MODIFIED: 10/24/2016 1:42 AM
11. Function f is
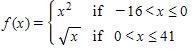
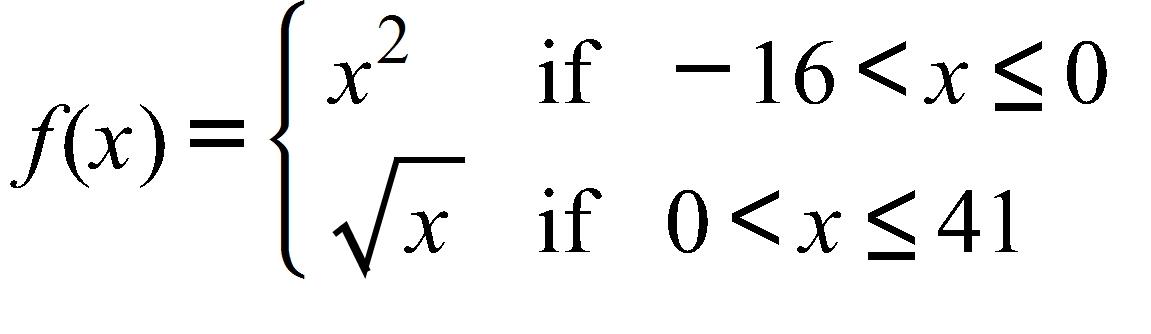
Find

a. 1296
b. 6
c. 7
d. –6
e. No solution
ANSWER: b
POINTS: 1
QUESTION TYPE: Multiple Choice HAS VARIABLES: True
DATE CREATED: 2/10/2016 3:48 PM
DATE MODIFIED: 10/24/2016 1:47 AM


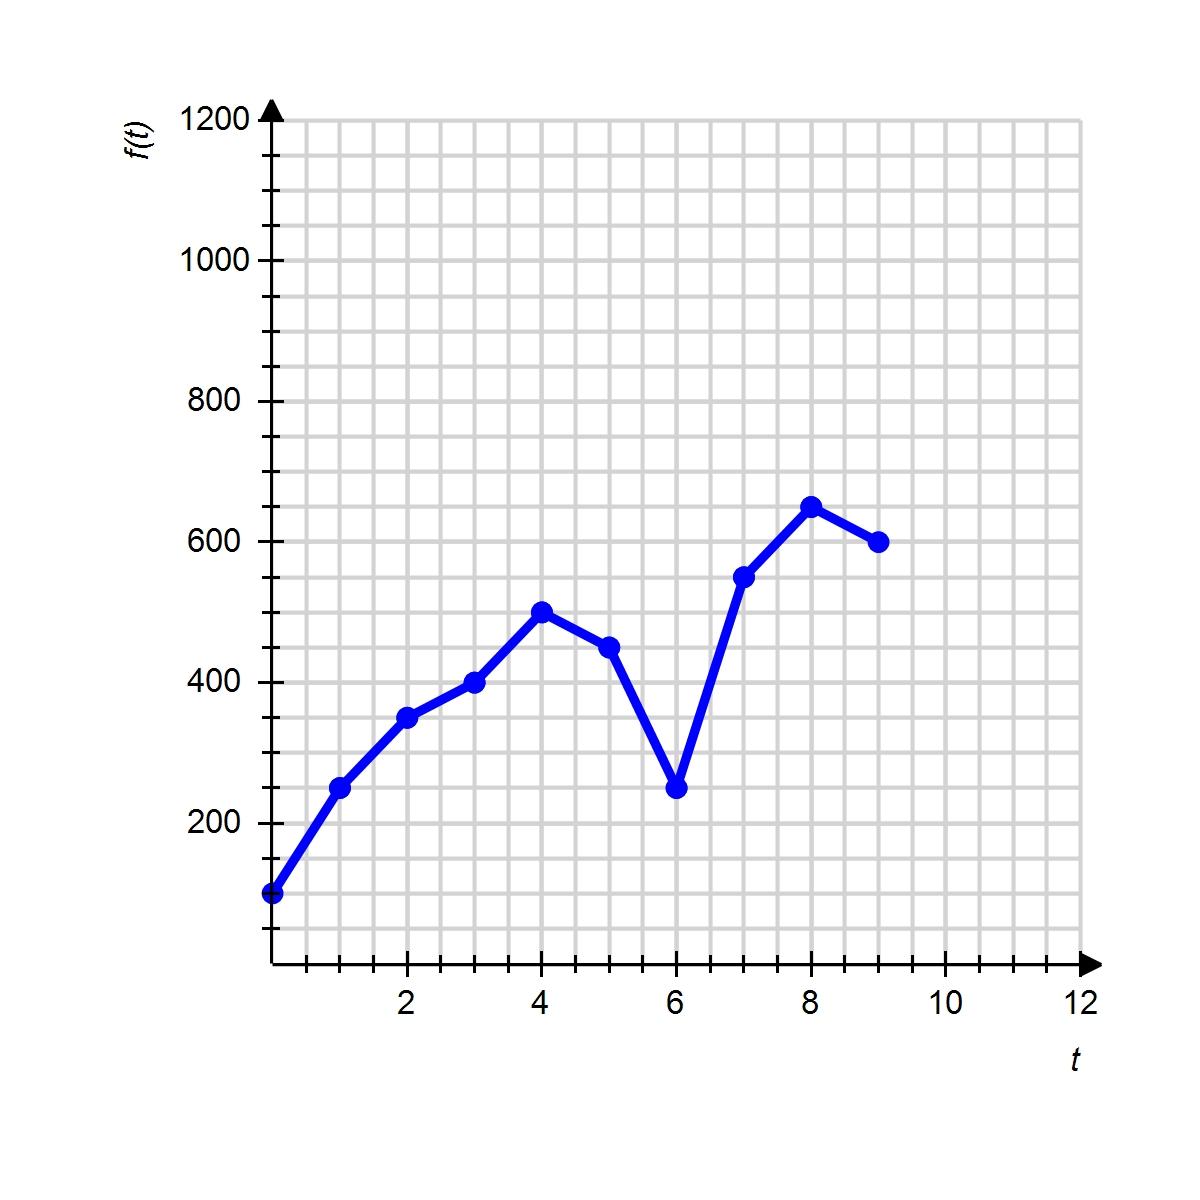
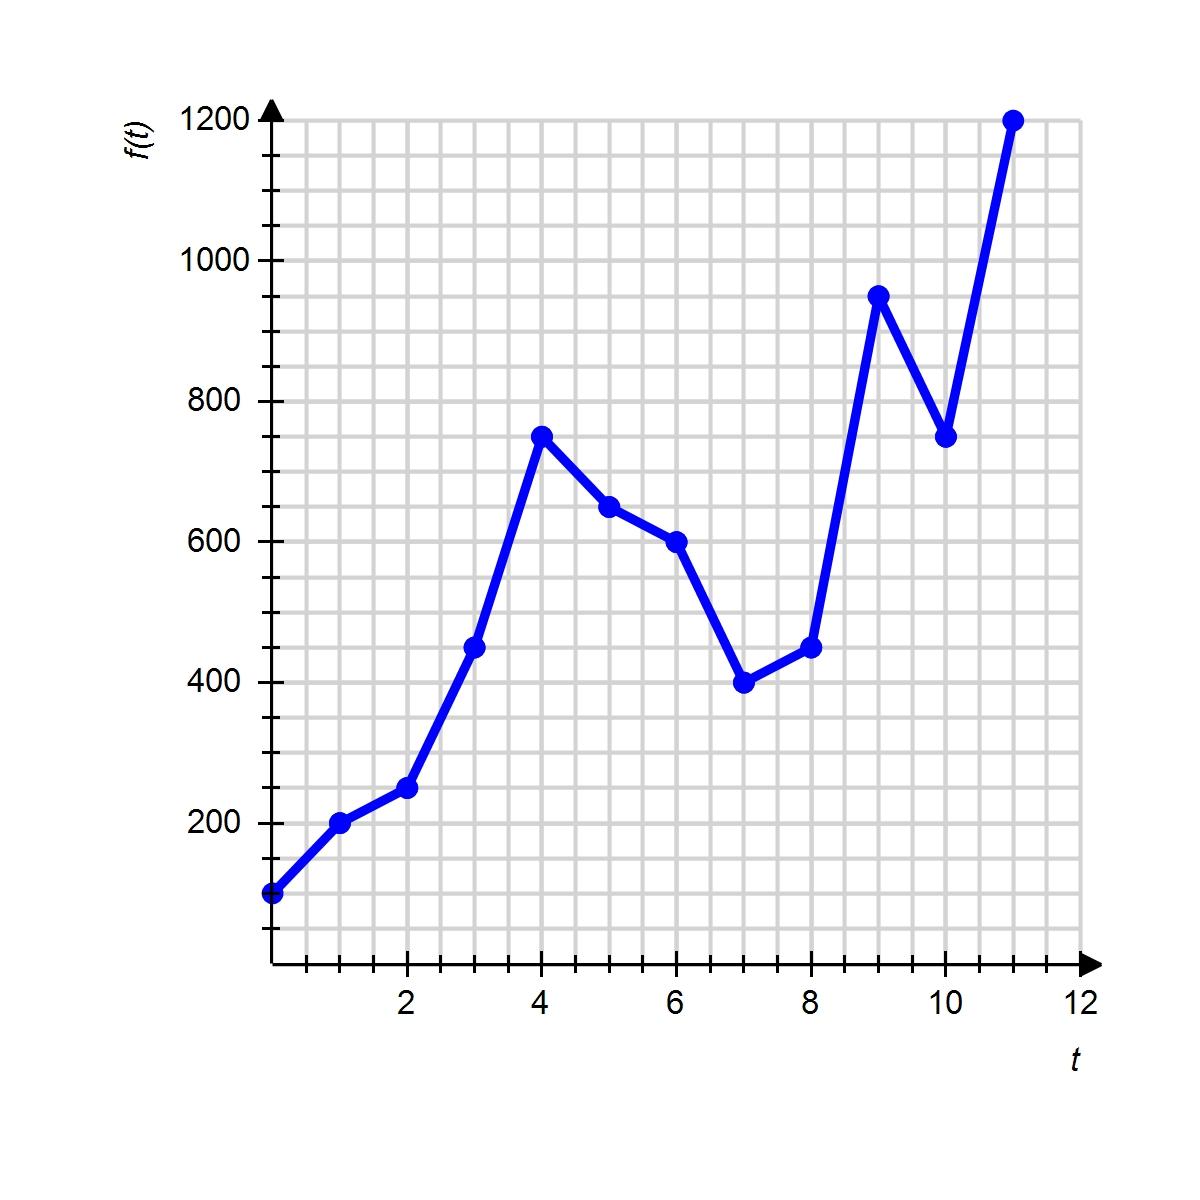
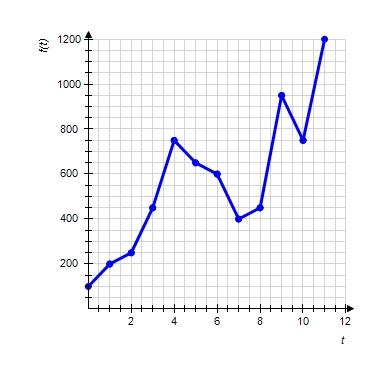
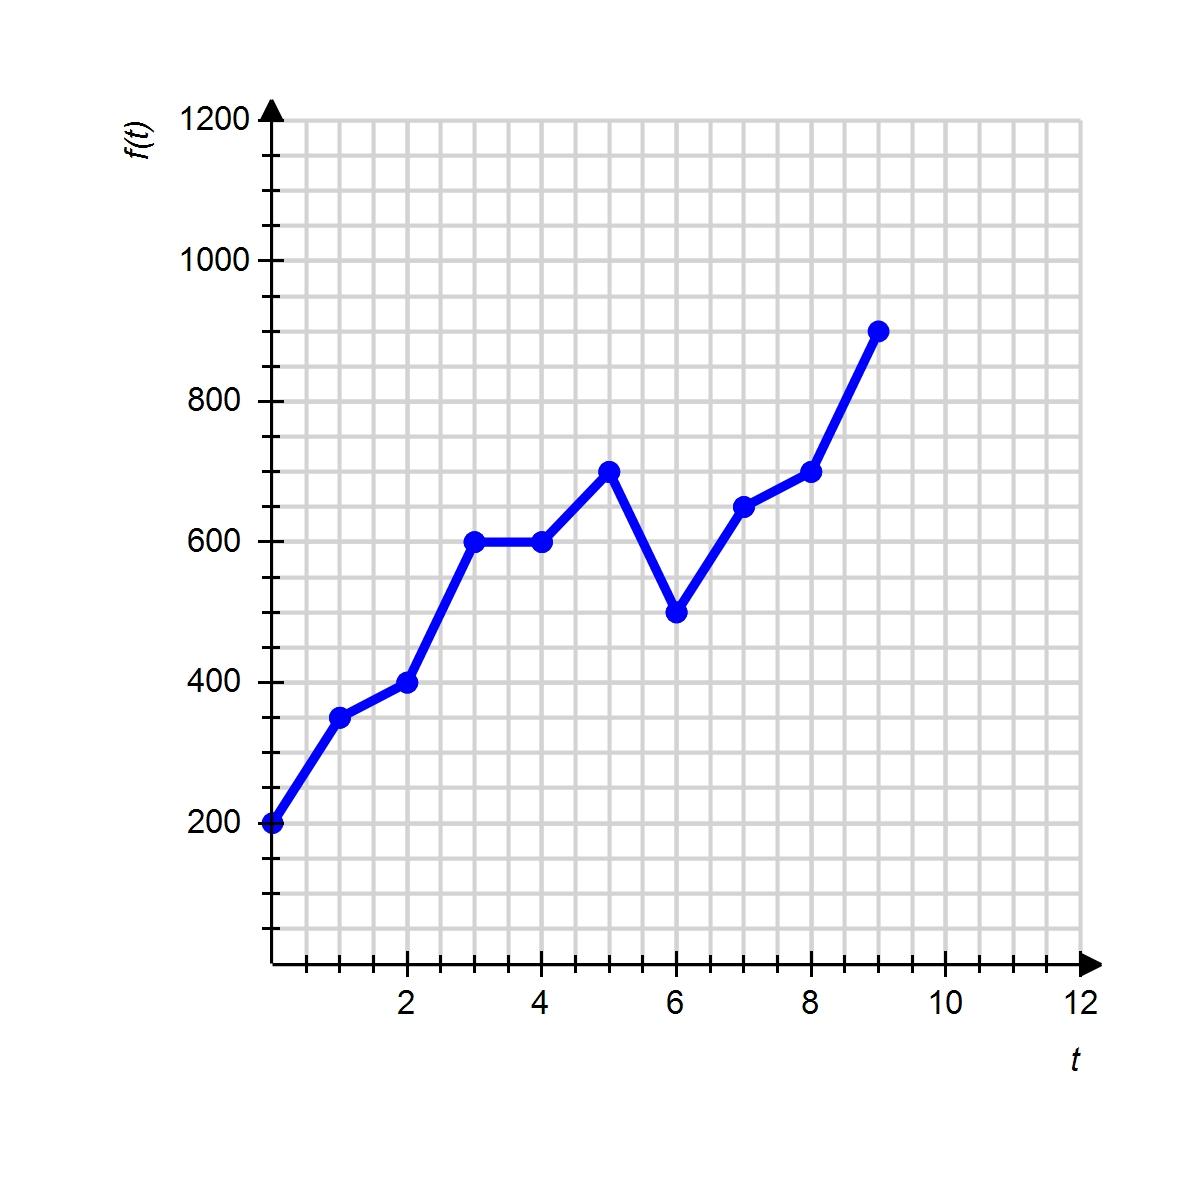
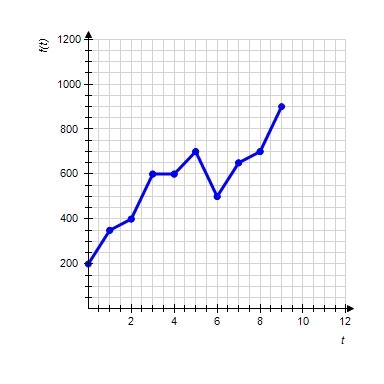
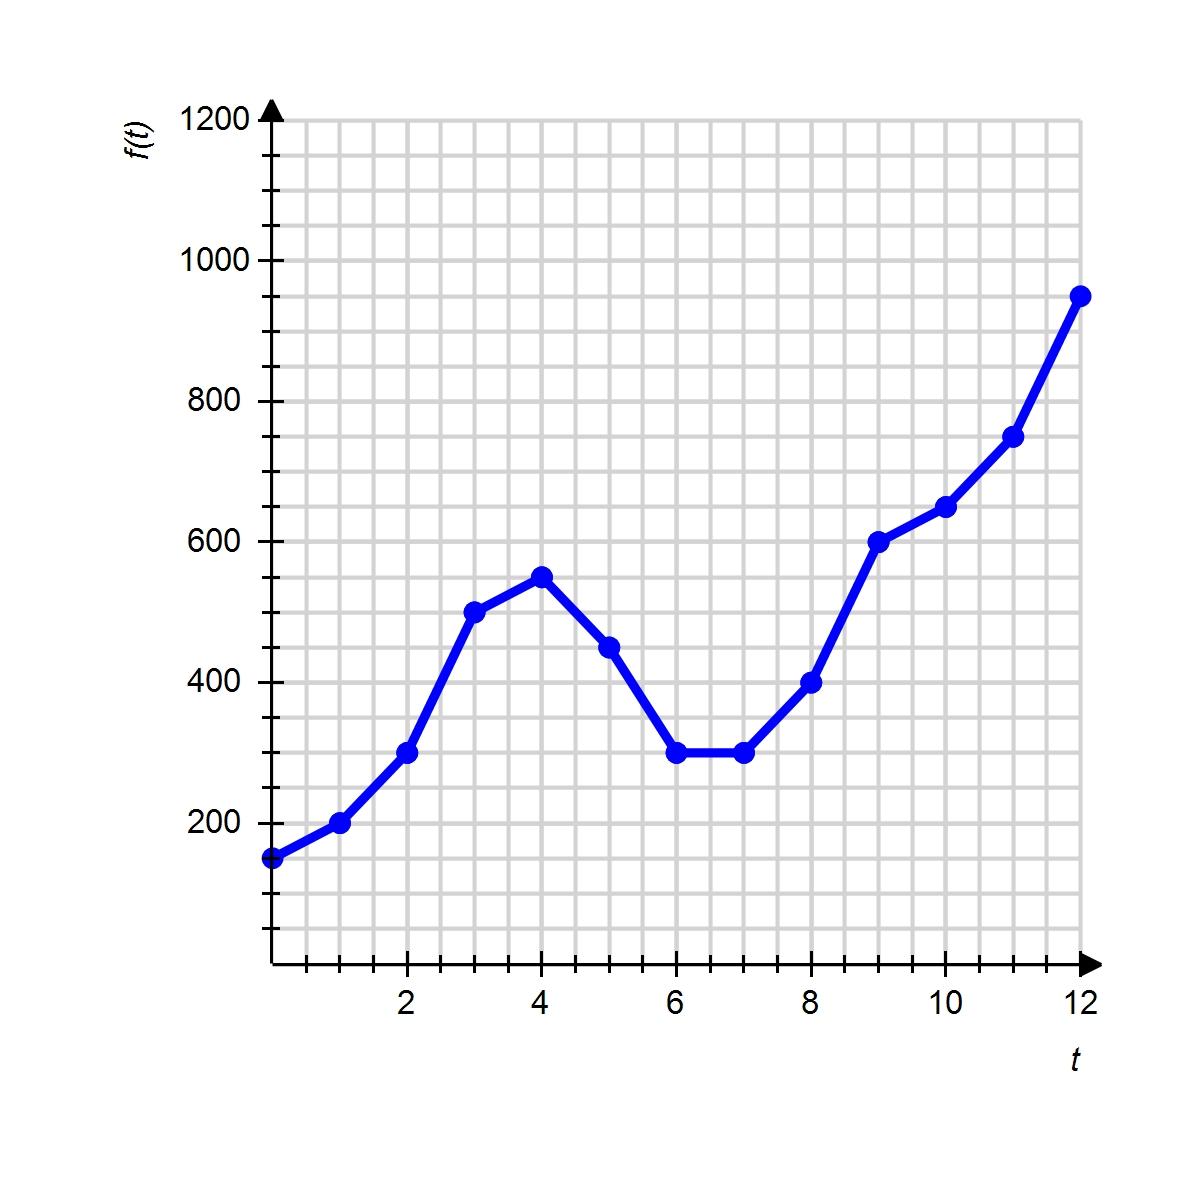
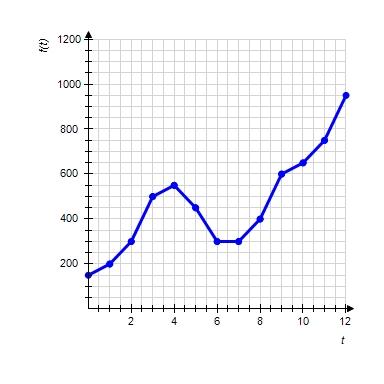
12. Graph shows the number of sports utility vehicles sold in the United States. represents sales in year t in thousands of vehicles. Find

1.2 Functions and Models

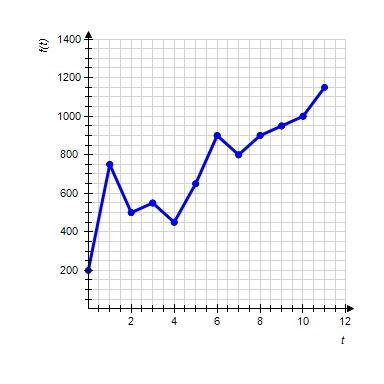
a. 1,000,000
b. 750,000
c. 450,000
d. 1,150,000
e. 950,000
ANSWER: a
POINTS: 1
QUESTION TYPE: Multiple Choice
HAS VARIABLES: True
DATE CREATED: 2/10/2016 3:48 PM
DATE MODIFIED: 11/3/2016 2:04 AM
13. Graph shows the number of sports utility vehicles sold in the United States. represents sales in year t in thousands of vehicles. Find

1.2 Functions and Models
a. 400,000
b. 500,000
c. 450,000
d. 250,000
e. 600,000
ANSWER: b
POINTS: 1
QUESTION TYPE: Multiple Choice
HAS VARIABLES: True
DATE CREATED: 2/10/2016 3:48 PM
DATE MODIFIED: 11/3/2016 2:05 AM
14. Graph shows the number of sports utility vehicles sold in the United States. represents sales in year t in thousands of vehicles. Use the graph to estimate the largest value of for

1.2 Functions and Models
a. 950,000
b. 650,000
c. 1,200,000
d. 750,000
e. 600,000
ANSWER: d
POINTS: 1
QUESTION TYPE: Multiple Choice
HAS VARIABLES: True
DATE CREATED: 2/10/2016 3:48 PM
DATE MODIFIED: 11/3/2016 1:41 AM

15. Graph shows the number of sports utility vehicles sold in the United States. represents sales in year t in thousands of vehicles. Use the graph to estimate the smallest value of for
1.2 Functions and Models
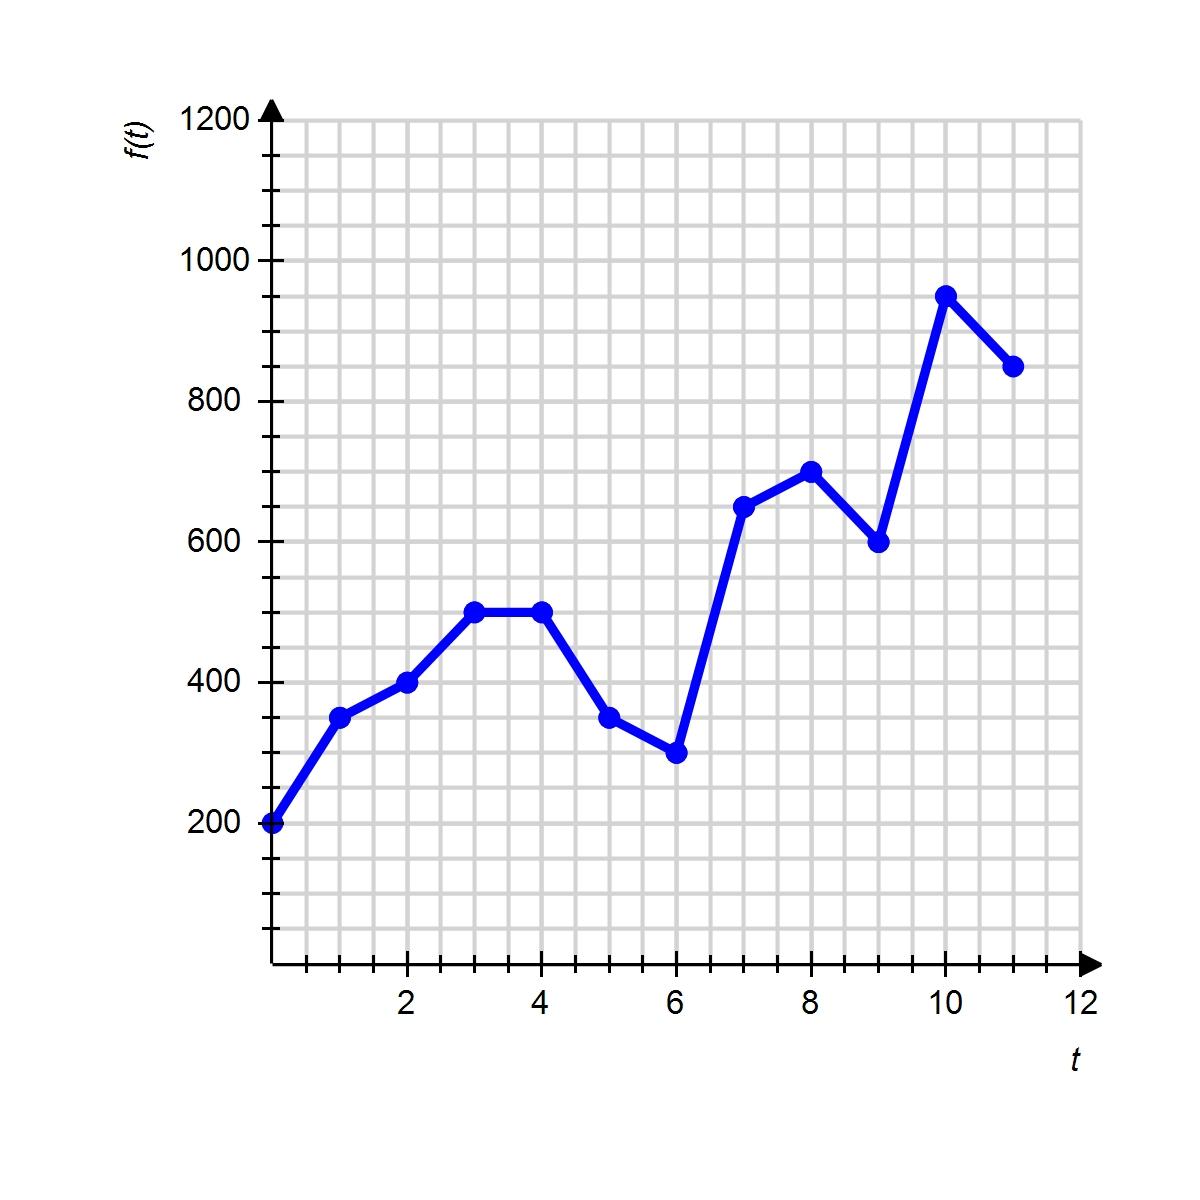
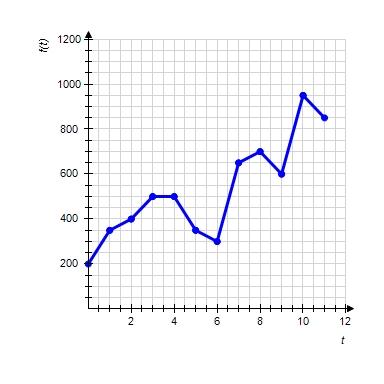
a. 300,000
b. 350,000
c. 850,000
d. 600,000
e. 500,000
ANSWER: a POINTS: 1
QUESTION TYPE: Multiple Choice
HAS VARIABLES: True
DATE CREATED: 2/10/2016 3:48 PM
DATE MODIFIED: 11/3/2016 1:41 AM
16. The following table shows the approximate value V of one Euro in U.S dollars from its introduction in January 2000 to January 2004. ( represents January, 2000.)
t (Year) 0 2 4
V (Value in $)
Which model would best fit the given data? (A, a, b, c, k, l, and m are constants.)
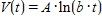
a. Logarithmic:

b. Cubic:
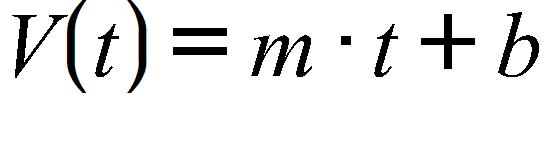
c. Linear:

1.2 Functions and Models

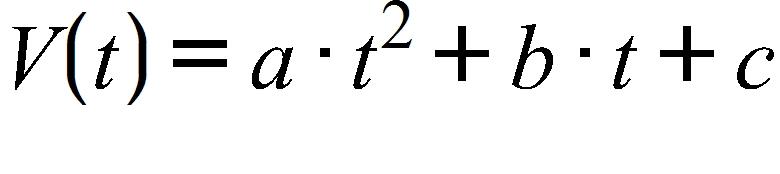
d. Quadratic:

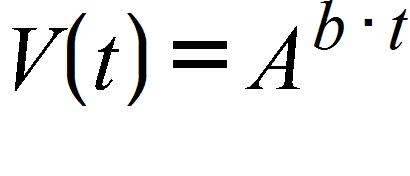
e. Exponential:

ANSWER: d
POINTS: 1
QUESTION TYPE: Multiple Choice HAS VARIABLES: True
DATE CREATED: 2/10/2016 3:48 PM
DATE MODIFIED: 10/24/2016 1:48 AM
17. The following table shows the approximate average household income in the U.S. in 1990, 2002, and 2003. ( represents 1990.)
Which of the following kinds of models would best fit the given data? (A, a, b, c, and m are constants.)
a. Exponential:

b. Logarithmic:
c. Linear:
d. Quadratic:
e. Power:

ANSWER: c
POINTS: 1
QUESTION TYPE: Multiple Choice HAS VARIABLES: True
DATE CREATED: 2/10/2016 3:48 PM
DATE MODIFIED: 5/20/2016 7:45 AM
18. Graph shows the number of sports utility vehicles sold in the United States. represents sales in year t in thousands of vehicles. Use the graph to estimate the largest value of for

1.2 Functions and Models
Please enter your answer as a number without the units.
ANSWER: 700,000
POINTS: 1
QUESTION TYPE: Numeric Response
HAS VARIABLES: True
DATE CREATED: 2/10/2016 3:48 PM
DATE MODIFIED: 11/2/2016 6:20 PM
19. Graph shows the number of sports utility vehicles sold in the United States. represents sales in year t in thousands of vehicles. Use the graph to estimate the smallest value of for

1.2 Functions and Models
Please enter your answer as a number without the units.
ANSWER: 300,000
POINTS: 1
QUESTION TYPE: Numeric Response
HAS VARIABLES: True
DATE CREATED: 2/10/2016 3:48 PM
DATE MODIFIED: 11/2/2016 6:29 PM
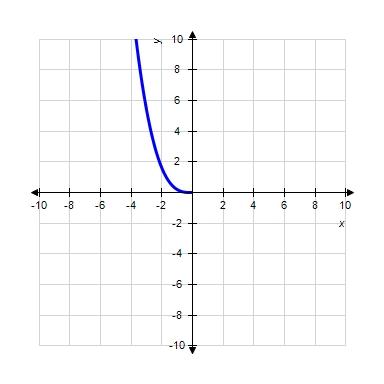
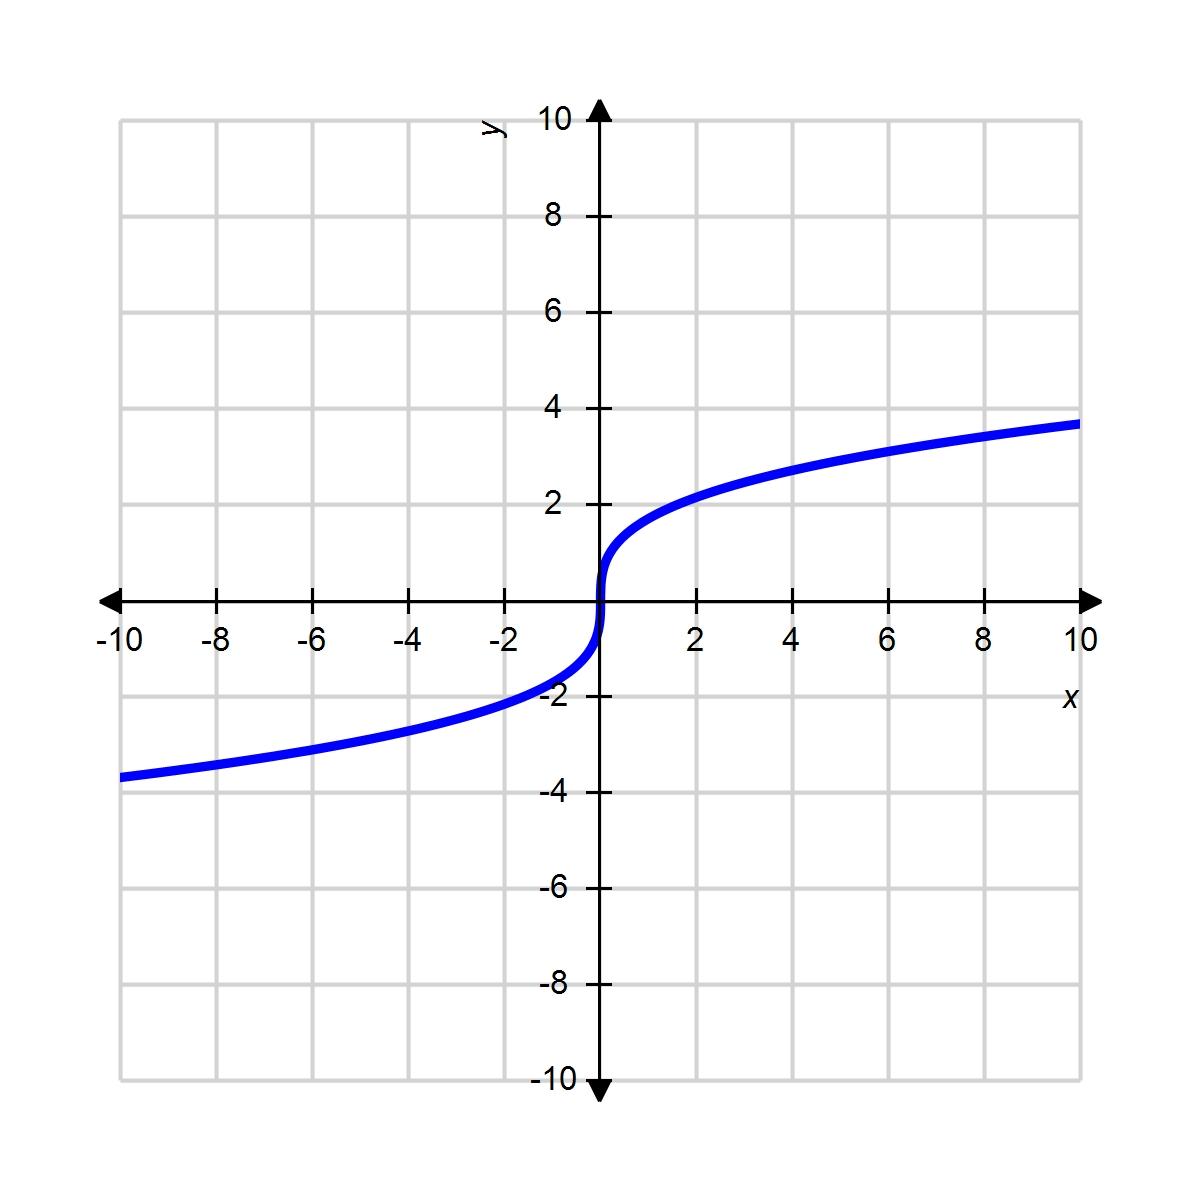
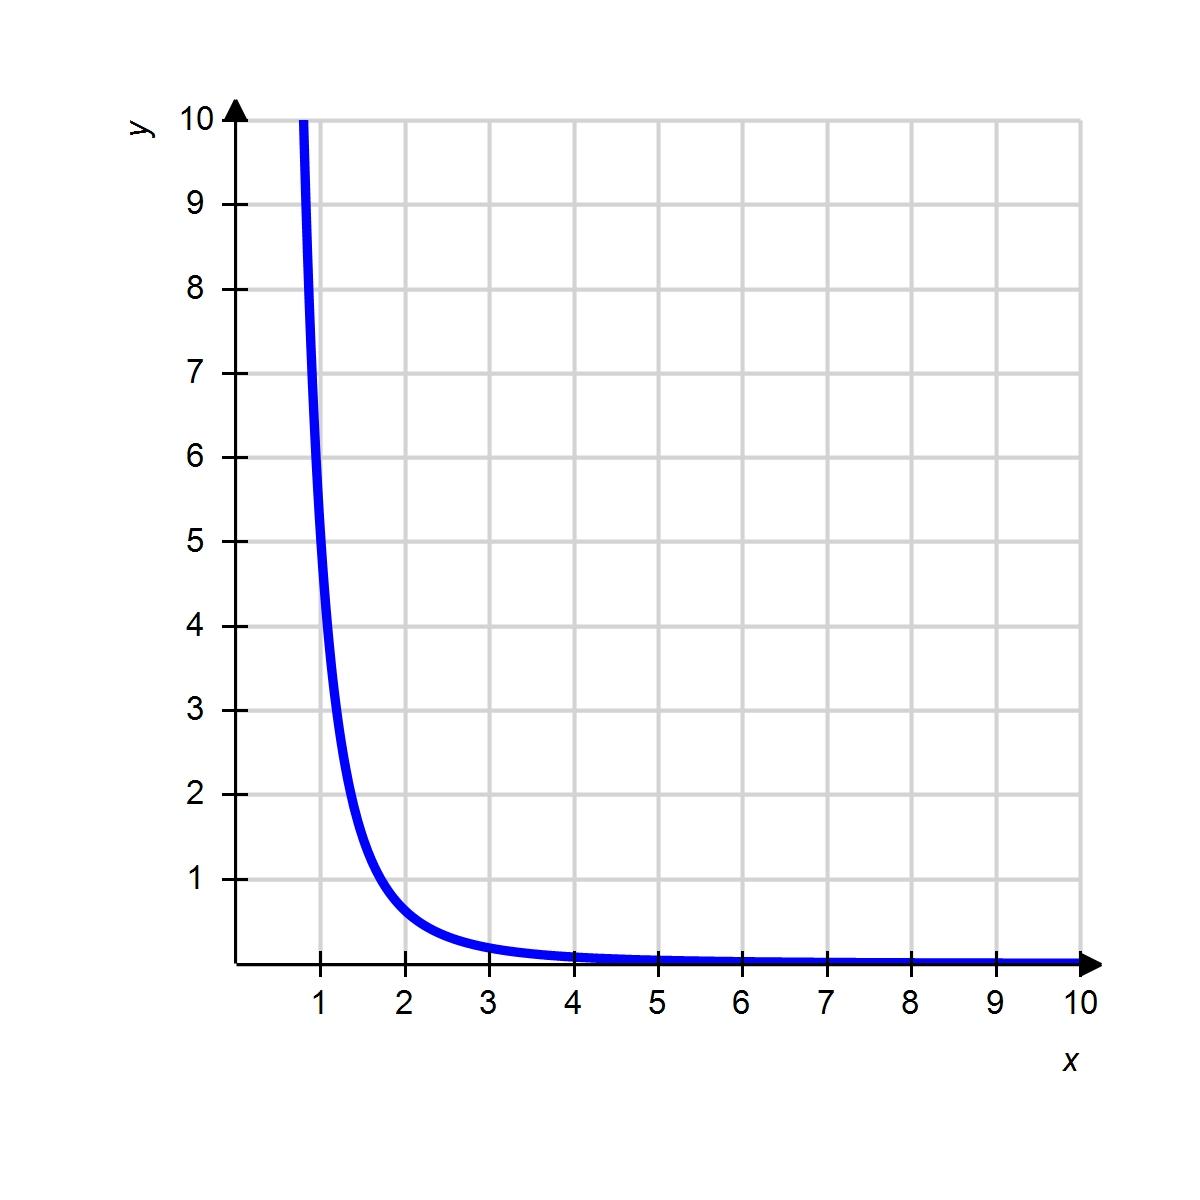
Match each function with the corresponding graph.
a.
b.

c. ,

QUESTION TYPE: Matching
HAS VARIABLES: False
DATE CREATED: 2/10/2016 3:48 PM
DATE MODIFIED: 4/5/2016 12:58 PM
1.2 Functions and Models
ANSWER: c
POINTS: 1
1.2 Functions and Models
ANSWER: b
POINTS: 1
1.2 Functions and Models
ANSWER: a POINTS: 1