Chapter 1
1. A study is conducted on students taking a statistics class. Several variables are recorded in the survey. Identify each variable as categorical or quantitative.
A. The type of car the student owns
B. The number of credit hours taken during that semester
C. The time the student waited in line at the bookstore to pay for his or her textbooks
D. The home state of the student
ANSWER: A. Categorical, B. Quantitative, C. Quantitative, D. Categorical
2. Researchers are conducting a state-wide survey for the U.S. Postal Service. The survey records many different variables of interest. Which of the following variables is categorical?
a. The county of residence
b. The number of people, both adults and children, living in the household
c. The total household income, before taxes, in 2020
d. The age of the respondent
ANSWER: a
3. A particularly common question in the study of wildlife behavior involves observing contests between “residents” of a particular area and “intruders.” In each contest, the residents either win or lose the encounter (assuming there are no ties). Observers might record several variables, some of which are listed below. Which of these variables is categorical?
a. The duration of the contest (in seconds)
b. The number of animals involved in the contest
c. Whether the residents win or lose
d. The total number of contests won by the residents
ANSWER: c
4. A description of different houses on the market includes the following three variables. Which of these variables is quantitative?
a. The square footage of the house
b. The monthly gas bill
c. The monthly electric bill
d. All of the above
ANSWER: d
5. Jason is buying a smartphone. He is comparing various models using many different variables. These variables will play an important role as he decides which smartphone he will buy. Identify each of the following variables as categorical or quantitative.
A. Does the smartphone have fast-charging capability?
B. How many megapixels does the front-facing camera have?
C. What operating system does the smartphone use?
D. How much does the smartphone cost?
ANSWER: A. Categorical, B. Quantitative, C. Categorical, D. Quantitative
6. A variable is a characteristic of a:
Chapter 1
a. case.
b. label.
c. value.
d. None of the above
ANSWER: a
7. Categorical variables place cases into group(s).
a. one
b. no
c. many
d. numeric
ANSWER: c
8. Variables that take numeric values for which arithmetic operations make sense are called _______.
a. quantitative
b. categorical
c. distributions
d. cases
ANSWER: a
9. Variables on which arithmetic operations do not make sense are called _______.
a. quantitative
b. categorical
c. distributions
d. cases
ANSWER: b
10. Variables take on ________.
a. values
b. cases
c. distributions
d. None of the above
ANSWER: a
11. What are labels used for in data sets?
a. To identify distributions
b. To identify values
c. To identify cases
d. None of the above
ANSWER: c
Chapter 1
12. We have a data set where the cases are college students. One of the variables in the data set is “gender.” The values of gender are 1 if the student is male and 2 if the student is female. What type of variable is gender?
a. Quantitative
b. Categorical
c. Quantitative and categorical
d. None of the above
ANSWER: b
13. We have a data set where the cases are college students. One of the variables in the data set is “age of the student.” What type of variable is age of the student?
a. Quantitative
b. Categorical
c. Quantitative and categorical
d. None of the above
ANSWER: a
14. We have a data set where the cases are college students. One of the variables in the data set is “hometown.” What type of variable is hometown?
a. Quantitative
b. Categorical
c. Quantitative and categorical
d. None of the above
ANSWER: b
15. Units of measurement are an important part of the description of what type of variables?
a. Quantitative
b. Categorical
c. Quantitative and categorical
d. None of the above
ANSWER: a
16. Is the distribution shown below unimodal?

a. No
b. Yes
ANSWER: a
17. Suppose you are interested in comparing the quality of different hospitals based on infections that have
Chapter 1
occurred from surgery. Which of the following would be the better way to measure such a variable?
a. Rate of infections
b. Count of infections
c. None of the above
ANSWER: a
18. Suppose you own a pizza delivery company and you are trying to determine the best campus on which to sell pizza. What would be the best measurement to make the comparison?
a. Average number of pizzas purchased
b. Count of pizzas purchased
c. Rate of pizzas purchased
d. None of the above
ANSWER: b
19. The first day of class, the professor collects information on each student to make a data set that will be analyzed throughout the semester. The information asked includes hometown, GPA, number of classes, number of siblings, and favorite subject. How many variables are in this data set?
a. 1
b. 2
c. 5
d. None of the above
ANSWER: c
20. The first day of class, the professor collects information on each student to make a data set that will be analyzed throughout the semester. The information asked includes hometown, GPA, number of classes taking, number of siblings, and favorite subject. How many quantitative variables are in this data set?
a. one
b. two
c. three
d. five
ANSWER: c
21. The first day of class, the professor collects information on each student to make a data set that will be analyzed throughout the semester. The information asked includes hometown, GPA, number of classes taking, number of siblings, and favorite subject. How many categorical variables are in this data set?
a. one
b. two
c. three
d. four
ANSWER: b
22. The first day of class, the professor collects information on each student to make a data set that will be
Chapter 1
analyzed throughout the semester. The information asked includes hometown, GPA, number of classes taking, number of siblings, and favorite subject. What are the cases in this data set?
a. The semester
b. The professor
c. The college students
d. None of the above
ANSWER: c
23. Below is a data set with information on students in a basic statistics class at a local university. Which variable is the label?
a. Student ID
b. GPA
c. Hometown
d. Major
ANSWER: a
24. Below is a data set with information on students in a basic statistics class at a local university. What is a key characteristic of the data set?
a. There are 10 students in the data set.
b. The data describe students in a class.
c. There are three variables in the data set.
Chapter 1
d. All of the above
ANSWER: d
25. Below is a data set with information on students in a basic statistics class at a local university. How many categorical variables are in this data set?
a. none
b. one
c. two
d. three
ANSWER: d
26. Categorical variables are best displayed by ______.
a. histograms
b. pie charts
c. bar graphs or histograms
d. pie charts or bar graphs
ANSWER: d
27. The distribution of a categorical variable is displayed using _______.
a. letters
b. counts only
c. percents only
d. counts or percents
ANSWER: d
28. When a pie chart id used, the sum of all the percents should be _____.
a. 0
b. 1
c. 100
d. 50
ANSWER: c
Chapter 1
29. Quantitative variables are best displayed using _______.
a. stemplots
b. histograms
c. bar graphs or stemplots
d. stemplots or histograms
ANSWER: d
30. Consider the following data, which describe the amount of time in minutes that students spend studying for a quiz:
10, 11, 11, 12, 12, 14, 15, 18, 19, 20, 22, 24, 39, 40, 41, 44, 46, 50, 52, 52, 53, 55, 70 What numbers make up the leaf of the first stem?
a. 0,1,1,2,2,4,5,8,9
b. 0,1,2,4,5,8,9
c. 0,1,1,2,2,4,5,8,9,0,2,4,9,0,1,4,6,0,2,2,3,5,0
d. None of the above
ANSWER: a
31. Consider the following data, which describe the amount of time in minutes that students spend studying for a quiz:
10, 11, 11, 12, 12, 14, 15, 18, 19, 20, 22, 24, 39, 40, 41, 44, 46, 50, 52, 52, 53, 55, 70 What numbers make up the leaf of the last stem?
a. 0,1,1,2,2,4,5,8,9
b. 0,1,4,6
c. 0,2,2,3,5,0
d. None of the above
ANSWER: d
32. Consider the following data, which describe the amount of time in minutes that students spend studying for a quiz:
10, 11, 11, 12, 12, 14, 15, 18, 19, 20, 22, 24, 39, 40, 41, 44, 46, 50, 52, 52, 53, 55, 70 What numbers make up the stem?
a. 1,2,3,4,5,6,7
b. 1,2,3,4,5,7
c. 0,1,1,2,2,4,5,8,9,0,2,4,9,0,1,4,6,0,2,2,3,5,0
d. None of the above
ANSWER: a
33. Consider the following data, which describe the amount of time in minutes that students spend studying for a quiz:
10, 11, 11, 12, 12, 14, 15, 18, 19, 20, 22, 24, 39, 40, 41, 44, 46, 50, 52, 52, 53, 55, 70 What numbers make up the leaf of the first stem if you were splitting the stems?
a. 0,1,1,2,2,4,5,8,9
1
b. 0,1,2,4,5,8,9
c. 0,1,1,2,2,4
d. 0,1,2,4
ANSWER: c
34. Consider the following data, which describe the amount of time in minutes that students spend studying for a quiz: 10, 11, 11, 12, 12, 14, 15, 18, 19, 20, 22, 24, 39, 40, 41, 44, 46, 50, 52, 52, 53, 55, 70 What numbers would make up the leaf of the last stem if you were splitting the stems?
a. 0,2,2,3,5,0
b. 0
c. 0,2,3,5
d. No leaves on the last stem ANSWER: c
35. What method is most useful in comparing two distributions using a stemplot?
a. Splitting the stem
b. Trimming the leaves
c. Back-to-back stemplots
d. None of the above ANSWER: c
36. Thirty students were asked, “How much time did you spend studying for the last quiz?” The histograms below were all used on the same data; however, the class size was changed for each one. Which histogram below best displays the data?

Chapter 1
ANSWER: a
37. The stemplot below displays data from 30 students who were asked, “How much time in minutes do you spend on the Internet?” What do you notice about the stemplot? In the stemplot, 3|2 represents 32 minutes.
Chapter 1
a. The stems are split.
b. The stems are not split.
ANSWER: a
38. Large data sets with quantitative variables are best displayed using ________.
a. stemplots
b. histograms
c. stemplots and histograms
d. none of the above
ANSWER: b
39. When histograms are made, the classes ________.
a. should be equal in width
b. do not need to be equal in width
c. should be selected randomly
d. should always be a width of 10
ANSWER: a
40. The histogram below shows data from 30 students who were asked, “How much time do you spend on the Internet in minutes?” How could you improve the histogram to better display the distribution?
a. Increase the class size.
b. Decrease the class size.
c. Do nothing the histogram is appropriate as is.
d. Add two more data points, ANSWER: a
41. The histogram below shows data from 30 students who were asked, “How much time do you spend on the Internet in minutes?” Which of the following is a feature of the data?
a. There is a potential outlier.
b. Most values are around 800.
c. The range of values is between 0 and 400.
d. None of the above
ANSWER: a
42. The appearance of a histogram changes when you _______.
a. change the class size
b. add more data
c. remove outliers
d. all of the above
ANSWER: d
43. The tails of a distribution show _______.
a. the center
b. any extreme values
c. the median
d. none of the above
ANSWER: b
Chapter 1
44. When using a histogram to display categorical values, you should make sure the categories are in alphabetical order.
a. True histograms are not useful if the categories are not in order.
b. True histograms can be used on any type of data.
c. False You cannot use histograms to display categorical data.
d. False The categories must not be in alphabetical order when categorical data are displayed.
ANSWER: c
45. When displaying the distribution of quantitative data, it is best to use:
a. pie charts.
b. bar graphs.
c. histograms.
d. stemplots or histograms.
ANSWER: d
46. A sample of employees of a large pharmaceutical company has been obtained. The length of time (in months) working for the company was recorded for each employee. A stemplot of these data is shown below. In the stemplot, 6|2 represents 62 months.
What would be a better way to represent this data set?
a. Display the data in a time plot.
b. Display the data in a boxplot.
c. Split the stems.
d. Use a histogram with class width equal to 10.
ANSWER: c
47. Data are collected from 1100 randomly selected students who graduated between 2018 and 2020 from the University of Florida. Some of the variables that were collected are listed below. Identify each of the following variables as categorical or quantitative.
A. Gender of the student
B. School or college from which the student graduated
C. Annual salary at the first job after graduation
D. Graduation date in terms of semester (e.g., fall 2018, spring 2019, etc.)
ANSWER: A. Categorical, B. Categorical, C. Quantitative, D. Categorical
Chapter 1
48. When drawing a histogram, it is important to
a. have a separate class interval for each observation to get the most informative plot.
b. make sure the heights of the bars exceed the widths of the class intervals, so that the bars are true rectangles.
c. label the vertical axis so the reader can determine the count or percent in each class interval.
d. make certain the mean and median are contained in the same class interval, so that the correct type of skewness can be identified.
ANSWER: c
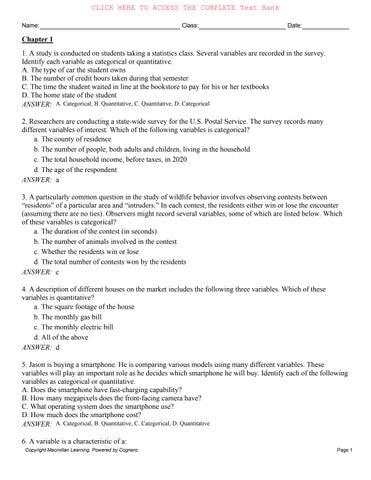
49. In a statistics class with 136 students, the professor records how much money each student has in her or his possession during the first class of the semester. The histogram shown below represents the data collected.
Which of the following description(s) is (are) correct regarding the shape of the histogram?
a. Skewed right
b. Skewed left
c. Symmetric
d. Includes an outlier
e. Unimodal
f. Bimodal
ANSWER: a, d, e
50. The histogram below represents the height (in inches) of the gold medal–winning high jumps for the Olympic Games up until Sydney 2000.
Chapter 1
What is approximately the mean height?
a. 75 inches
b. 77.5 inches
c. 82 inches
d. 90 inches
ANSWER: c
51. A consumer agency is testing appliances for a series of articles in their magazine. Currently they are working with cooktops and ranges. They have selected 16 of the most commonly used models. Using a series of tests, the agency will estimate the lifetime of these models. A histogram of these (estimated) lifetimes is shown below.

Select all correct descriptions for the shape of the histogram of the estimated lifetimes of these 16 appliances.
a. Symmetric
b. Unimodal
c. Skewed right
d. Skewed left
ANSWER: b, c
52. During the early part of the 1994 baseball season, many sports fans and baseball players noticed that the number of home runs being hit seemed to be unusually large. Below are separate stemplots for the number of home runs by American League and National League teams based on the team-by-team statistics on home runs hit through Friday, June 3, 1994 (from the Columbus Dispatch, Sunday, June 5, 1994).

Legend: In these stemplots, 2|9 represents 29. What is the median number of home runs for the American League teams?
a. 45
b. 50
c. 50.5
d. 57.5
ANSWER: d
53. During the early part of the 1994 baseball season, many sports fans and baseball players noticed that the
Name: Class: Date:
Chapter 1
number of home runs being hit seemed to be unusually large. Below are separate stemplots for the number of home runs by American League and National League teams based on the team-by-team statistics on home runs hit through Friday, June 3, 1994 (from the Columbus Dispatch, Sunday, June 5, 1994).
Legend: In these stemplots, 2|9 represents 29.
Determine whether each of the following statements is true or false.
A. The American League plot is reasonably symmetric.
B. The National League plot is bimodal.
C. The median number of home runs hit by National League teams for this time period was higher than the median number for the American League teams.
D. The lowest number of home runs hit by any team for this time period is 29.
ANSWER: A. True, B. False, C. False, D. True
54. During the early part of the 1994 baseball season, many sports fans and baseball players noticed that the number of home runs being hit seemed to be unusually large. Below are separate stemplots for the number of home runs by American League and National League teams based on the team-by-team statistics on home runs hit through Friday, June 3, 1994 (from the Columbus Dispatch, Sunday, June 5, 1994).

Legend: In these stemplots, 2|9 represents 29.
What is the mean number of home runs for the National League teams?
a. 45
b. 50
c. 50.1
d. 57.5
ANSWER: c
55. During the early part of the 1994 baseball season, many sports fans and baseball players noticed that the number of home runs being hit seemed to be unusually large. Below are separate stemplots for the number of home runs by American League and National League teams based on the team-by-team statistics on home runs hit through Friday, June 3, 1994 (from the Columbus Dispatch, Sunday, June 5, 1994).

Legend: In these stemplots, 2|9 represents 29.
What is the maximum number of home runs from a National League team?
a. 7
b. 70
c. 67
d. 48
ANSWER: c
56. The following pie chart provides information on all the majors at a university.

What conclusion can be drawn on the basis of this pie chart?
a. The most popular major is in the “Other” category, so it is not shown.
b. More than half of the students at this university are majoring in Public Health, French, Business, Computer Science, or Economics.
c. More students are majoring in Education than in French.
d. The smallest major is Mathematics/Statistics
ANSWER: b
57. Consumers Union measured the gas mileage in miles per gallon of 38 automobiles from the 1978–1979 model year on a special test track. The pie chart below provides information about the country of manufacture of the automobiles used in this study.
Which of the following bar graphs represents the same data as the pie chart? a.
Chapter 1 Copyright Macmillan Learning. Powered by Cognero.
1
ANSWER: b
58. The time plot below gives the number of burglaries committed each month for a city in Ohio. The plot is for the three-year period of January 1987 to December 1989.
Determine whether each of the following statements is true or false.
A. The number of burglaries in each month of 1988 was lower than the number of burglaries in each month of 1989.
B. The median number of burglaries per month in 1988 was a little over 25.
C. The total number of burglaries in 1989 was higher than in 1988.
D. The graph is bimodal.
ANSWER: A. False, B. False, C. True, D. False
59. 5 A study of 2007 model automobiles was conducted. In the study the following variables were considered: the Region in which the car was manufactured (Europe, North America, Asia); the Type of automobile (compact, midsize, large); the fuel economy in city driving of the automobile (MPG-City); volume of the engine in liters (EngSize); and the type of Fuel used (regular, premium, diesel).The variables Region, Type, MPG-City, EngSize, and Fuel are, respectively,
a. quantitative, categorical, categorical, quantitative, quantitative.
b. categorical, categorical, quantitative, categorical, categorical.
c. categorical, categorical, quantitative, categorical, quantitative.
d. categorical, categorical, quantitative, quantitative, categorical.
e. This cannot be determined without knowing the values of the various variables.
ANSWER: d
60. Which of the following statements is(are) FALSE?
a. The distribution of a categorical variable lists the categories and gives the counts or the percents of individuals in each category.
b. A bar chart is a useful graphical tool for describing the shape of the distribution of a categorical variable.
c. A stemplot is particularly valuable for displaying the shape of the distribution of a categorical variable when there are few observations.
1
d. A histogram shows the distribution of counts or percents among the values of a single quantitative variable.
e. Bar graphs, unlike histograms, can have blank spaces between the bars to separate the items being compared.
ANSWER: b, c
61. When examining a distribution of a quantitative variable, which of the following features do we look for?
a. Overall shape, center, and spread
b. Symmetry or skewness
c. Deviations from overall patterns, such as outliers
d. The number of peaks or modes
e. All of the above
ANSWER: e
62. In the fuel efficiency study of 2007 compact model automobiles, the following histogram of the distribution of the miles-per-gallon fuel efficiency rating in city driving (MPG-City) for automobiles manufactured in Europe was obtained.
From the histogram above, showing the distribution of MPG-City, we can see that:
a. the shape of the distribution is roughly symmetric with one peak.
b. the distribution is skewed to the left.
c. the distribution is skewed to the right.
d. the distribution is roughly symmetric with outlier values to the left.
e. the shape of the distribution would be easier to see if a stemplot had been constructed instead of the histogram.
ANSWER: b
63. The following stemplot displays the number of forest fires (in thousands) that occurred each year over the period from 1970 to 2000 in Canada, where 5|2 represents 5200 fires.
From the stemplot we can see that:
a. the distribution is skewed to the left.
b. there appears to be one large peak.
c. there were 9 years in which more than 10,000 fires occurred.
d. only 1 year had fewer than 6000 fires.
e. All of the above
ANSWER: e
64. Statistics were gathered on the number of homicides committed with guns in Australia in the years from 1980 to 2004.From these data the following graph was constructed.
This plot is a graph of a(n) _____________, and it shows that there is(are) in the data.
a. categorical variable; skewness to the right
b. histogram; multiple peaks
c. line; an increasing trend
d. quantitative variable; outlier values
e. time series; a decreasing trend
ANSWER: e
65. Which of the following variables is categorical?
Name: Class:
a. The number of Facebook friends you have
b. The amount of time a student spends on the Internet in one day
c. The available food choices in the student cafeteria
d. None of the above
ANSWER: c
66. According to the American Cancer Society, the decline in colorectal cancer mortality, primarily attributed to early detection and treatment, has not been consistent among race/ethnic groups. A colorectal exam is one method for early detection of colorectal cancer. In 2008, 29.5% of whites, 56.9% of African Americans, and 62.4% of Hispanics had not received a colorectal exam within the last 10 years. What is the best method to display these data?
a. Histogram
b. Pie chart
c. Bar graph
d. Stem-and-leaf plot
ANSWER: c
67. Malaria is a leading cause of infectious disease and death worldwide. The table below represents the mean number of reported malaria cases (between 1996 and 2006) for each of 10 West African countries, as published in the journal Statistica Neerlandica in 2010.
Country Mean number of reported malaria cases
Benin 745,340
Burkina Faso 1,098,680
Cote d’Ivoire 1,203,705
The Gambia 229,505
Ghana 2,956,957
Liberia 613,171
Mali 691,245
Senegal 1,111,249
Sierra Leone 321,340
Togo 453,837
What is the best method to display these data?
a. Histogram
b. Pie chart
c. Bar graph
d. Stem-and-leaf plot
ANSWER: c
68. Malaria is a leading cause of infectious disease and death worldwide. The table below represents the mean number of reported malaria cases (between 1996 and 2006) for each of 10 West African countries, as published in the journal Statistica Neerlandica in 2010.
Country Mean number of
Chapter 1 Copyright Macmillan Learning. Powered by Cognero.
Name: Class:
reported malaria cases
Benin 745,340
Burkina Faso 1,098,680
Cote d’Ivoire 1,203,705
The Gambia 229,505
Ghana 2,956,957
Liberia 613,171
Mali 691,245
Senegal 1,111,249
Sierra Leone 321,340
Togo 453,837
The variable “country” is a quantitative variable.
a. True
b. False
ANSWER: b
69. Malaria is a leading cause of infectious disease and death worldwide. The table below represents the mean number of reported malaria cases (between 1996 and 2006) for each of 10 West African countries, as published in the journal Statistica Neerlandica in 2010.
Country Mean number of reported malaria cases
Benin 745,340
Burkina Faso 1,098,680
Cote d’Ivoire 1,203,705
The Gambia 229,505
Ghana 2,956,957
Liberia 613,171
Mali 691,245
Senegal 1,111,249
Sierra Leone 321,340
Togo 453,837
Making a histogram of the data would tell us whether the distribution of the malaria data is symmetric.
a. True
b. False
ANSWER: b
70. Malaria is a leading cause of infectious disease and death worldwide. The table below represents the mean number of reported malaria cases (between 1996 and 2006) for each of 10 West African countries, as published in the journal Statistica Neerlandica in 2010.
Chapter 1 Copyright Macmillan Learning. Powered by Cognero.
Country Mean number of reported malaria cases
Benin 745,340
Burkina Faso 1,098,680
Cote d’Ivoire 1,203,705
Name: Class:
Chapter 1
The Gambia 229,505
Ghana 2,956,957
Liberia 613,171
Mali 691,245
Senegal 1,111,249
Sierra Leone 321,340
Togo 453,837
Why is it not appropriate to use a histogram to display these data?
a. A pie chart is much easier to read.
b. The data are categorical, so a histogram is not appropriate.
c. The width of the bins would be too large to display a histogram.
d. None of the above
ANSWER: b
71. The World Malaria Report (2008) has information on the number of reported malaria cases from 2005 and 2006 for the 10 countries listed in West Africa. The data are presented in the table below.
Country/area 2005 2006
Benin 803,462 861,847
Burkina Faso 1,615,695 2,060,867
Côte d’Ivoire
Mali 962,706 1,022,592
Senegal 1,346,158 1,555,310
Sierra Leone 233,833 160,666
Togo 437,662 566,450
The mean of the reported West African malaria cases in 2005 is ___________.
a. less than 116,698
b. greater than 1,600,000
c. 100,000
d. greater than 200,000
ANSWER: d
72. The World Malaria Report (2008) has information on the number of reported malaria cases from 2005 and 2006 for the 10 countries listed in West Africa. The data are presented in the table below.
Country/area 2005 2006
Benin 803,462 861,847
Burkina Faso 1,615,695 2,060,867
Côte d’Ivoire 1,280,914 1,253,408
The Gambia 161,698 266,188
Ghana 3,452,969 3,511,452
Liberia 116,681 1,105,272
Name: Class:
Chapter 1
Mali 962,706 1,022,592 Senegal 1,346,158 1,555,310
Sierra Leone 233,833 160,666
Togo 437,662 566,450
The median of the reported malaria cases in 2005 is _________.
a. less than 1,000,000
b. less than 200,000
c. 100,000
d. 3,000,000
ANSWER: a
73. The World Malaria Report (2008) has information on the number of reported malaria cases from 2005 and 2006 for the 10 countries listed in West Africa. The data are presented in the table below.
Country/area
Togo
The mean reported malaria cases in 2006 is _________.
a. less than 2,000,000
b. less than 200,000
c. 100,000
d. 3,000,000
ANSWER: a
74. The World Malaria Report (2008) has information on the number of reported malaria cases from 2005 and 2006 for the 10 countries listed in West Africa. The data are presented in the table below.
Country/area
Benin 803,462 861,847
Côte d’Ivoire 1,280,914 1,253,408
The Gambia 161,698 266,188
Ghana 3,452,969 3,511,452
Liberia 116,681 1,105,272
Mali 962,706 1,022,592 Senegal 1,346,158 1,555,310
Sierra Leone 233,833 160,666
Name: Class:
Chapter 1
Togo 437,662 566,450
The mean of the reported West African malaria cases in 2005 is ___________.
a. around 1,000,000
b. less than 200,000
c. 100,000
d. 3,000,000
ANSWER: a
75. The World Malaria Report (2008) has information on the number of reported malaria cases from 2005 and 2006 for the 10 countries listed in West Africa. The data are presented in the table below.
Togo
The mean number of malaria cases in 2006 is probably ______.
a. higher than in 2005
b. lower than in 2005
c. exactly the same as in 2005
ANSWER: a
76. The World Malaria Report (2008) has information on the number of reported malaria cases from 2005 and 2006 for the 10 countries listed in West Africa. The data are presented in the table below.
Benin 803,462 861,847
Côte
Liberia 116,681 1,105,272
Mali 962,706 1,022,592
Senegal 1,346,158 1,555,310
Sierra Leone 233,833 160,666
Togo 437,662 566,450
If the number of reported malaria cases in Ghana in 2005 were mistyped and reported as 30,452,969, what would happen to the mean and median?
a. Both would remain unchanged.
Chapter 1
b. The mean would change, but the median would stay the same.
c. The mean and median would change.
d. You cannot tell without doing the actual calculation.
ANSWER: b
77. The World Malaria Report (2008) has information on the number of reported malaria cases from 2005 and 2006 for the 10 countries listed in West Africa. The data are presented in the table below.
Country/area
Benin 803,462 861,847
Burkina Faso 1,615,695 2,060,867
Côte d’Ivoire 1,280,914 1,253,408
The Gambia 161,698 266,188
Ghana 3,452,969 3,511,452
Liberia 116,681 1,105,272
Mali 962,706 1,022,592
Senegal 1,346,158 1,555,310
Sierra Leone 233,833 160,666
Togo 437,662 566,450
If the number of reported malaria cases in Sierra Leone were mistyped and reported as 1,160,666, what would happen to the mean and median?
a. Both would remain unchanged.
b. The mean would change, but the median would stay the same.
c. The mean and median would change.
d. You cannot tell without doing the actual calculation.
ANSWER: c
78. The World Malaria Report (2008) has information on the number of reported malaria cases from 2005 and 2006 for the 10 countries listed in West Africa. The data are presented in the table below.
Country/area
Benin 803,462 861,847
Burkina Faso 1,615,695 2,060,867
Côte d’Ivoire 1,280,914 1,253,408
The Gambia 161,698 266,188
Ghana 3,452,969 3,511,452
Liberia 116,681 1,105,272
Mali 962,706 1,022,592
Senegal 1,346,158 1,555,310
Sierra Leone 233,833 160,666
Togo 437,662 566,450
If the number of malaria cases for Ghana were removed from this data set, what would happen to the mean of the entire data set for the year 2005?
a. The mean would not change.
b. The mean would change.
1
c. You cannot tell without doing the calculation.
ANSWER: b
79. The World Malaria Report (2008) has information on the number of reported malaria cases from 2005 and 2006 for the 10 countries listed in West Africa. The data are presented in the table below.
Country/area
Benin 803,462 861,847
Burkina Faso 1,615,695 2,060,867
Côte d’Ivoire 1,280,914 1,253,408
The Gambia 161,698 266,188
Ghana 3,452,969 3,511,452
Liberia 116,681 1,105,272
Mali 962,706 1,022,592
Senegal 1,346,158 1,555,310
Sierra Leone 233,833 160,666
Togo 437,662 566,450
If the number of malaria cases for Sierra Leone were removed from this data set, what would happen to the mean of the entire data set for the year 2006?
a. The mean would not change.
b. The mean would change.
c. You cannot tell without doing the calculation.
ANSWER: b
80. Which of the following variables is quantitative?
a. The amount of time a student spends on the Internet in a week
b. The number of tenured professors at a large university
c. The number of hurricanes each year for the years 2010 to 2020
d. All of the above
e. None of the above
ANSWER: d
81. The National Oceanic and Atmospheric Administration’s (NOAA) National Climatic Data Center (NCDC; http://www7.ncdc.noaa.gov) collects several weather variables. Indicate whether each of the listed variables from the NCDC is quantitative or categorical.
A. The amount of rainfall in 1 year in every state
B. The mean temperature in California across 25 years
C. The number of days with precipitation of at least 1 millimeter
D. The departure of precipitation from the average
ANSWER: A. Quantitative, B. Quantitative, C. Quantitative, D. Quantitative
82. On the first day of class, statistics professors ask each student to fill out a demographic questionnaire to learn information about their class. Which of the following variables is(are) categorical?
a. Gender
Chapter 1
b. Marital status
c. Highest education level of your mother (e.g., high school grad, college grad, etc.)
d. All of the above
e. None of the above
ANSWER: d
83. On the first day of class, statistics professors ask each student to fill out a demographic questionnaire to learn information about their class. Which of the following variables is(are) quantitative?
a. Gender
b. Marital status
c. Highest education level of your mother (e.g., high school grad, college grad, etc.)
d. Household income
ANSWER: d
84. A nationwide study was done to assess the programming proficiency of students taking a statistical programming class. The students were asked their proficiency in the statistical software SAS. The survey was sent to students at over 100 universities, and 112 responses were received from 21 different universities. The results were published in the journal International Mathematical Forum in 2011. The results in the form of a pie chart are shown below.
From the pie chart, we can see that most students are _____.
a. not proficient at all
b. somewhat proficient
c. very proficient
ANSWER: b
85. A nationwide study was done to assess the programming proficiency of students taking a statistical programming class. The students were asked their proficiency in the statistical software SAS. The survey was
Chapter 1
sent to students at over 100 universities, and 112 responses were received from 21 different universities. The results were published in the journal International Mathematical Forum in 2011. The results in the form of a pie chart are shown below.
It would have been better to display the data in a histogram.
a. True
b. False
c. Both displays work equally well.
ANSWER: b
86. A nationwide study was done to assess the programming proficiency of students taking a statistical programming class. The students were asked their proficiency in the statistical software SAS. The survey was sent to students at over 100 universities, and 112 responses were received from 21 different universities. The results were published in the journal International Mathematical Forum in 2011. The results in the form of a pie chart are shown below.
Chapter 1
A bar graph would give the same information.
a. True
b. False
ANSWER: a
87. The ages (to the nearest year) of the 667 people participating in a large workshop are summarized as shown below.
What is true about the median age?
a. It could be any number between 19 and 20.
b. It must be 20.
c. It must be 21.
d. It must be over 21.
ANSWER: b
88. As part of a large ongoing study on the treatment of women with breast cancer, the treatment time (in months) of eight patients whose lymph nodes were cancer-free is recorded. Treatment time is defined as the time from the moment the cancer treatment starts until the patient is declared cancer-free. 9.47
8.50 9.40 17.67 9.30
What is the mean treatment time for these eight women?
a. 10.5 months
b. 11.67 months
c. 12.325 months
d. 15 months
ANSWER: c
Name: Class: Date:
Chapter 1
89. The median age of five people in a meeting is 30 years. One of the people, whose age is 50 years, leaves the room. What is the median age of the remaining four people in the room?
a. 40 years
b. 30 years
c. 25 years
d. This cannot be determined from the information given.
ANSWER: d
90. The Environmental Protection Agency records data on the fuel economy of many different makes of cars. Some of the variables they collect are listed below. Identify each variable as categorical or quantitative.
A. The manufacturer of the car (Nissan, Ford, Toyota, etc.)
B. Mileage of the car (miles per gallon)
C. Weight of the car (in pounds)
D. Size of the car (small, medium, full-size, pick-up truck, etc.)
ANSWER: A. Categorical, B. Quantitative, C. Quantitative, D. Categorical
91. The Environmental Protection Agency records data on the fuel economy of many different makes of cars. Data on the mileage of 20 randomly selected cars are listed below. The values are ordered for convenience.
12 13 15 16 16 17 18 18 19 19
20 20 22 23 24 26 26 27 27 29 What is the median mileage for these 20 cars?
a. 17.5 miles per gallon
b. 19 miles per gallon
c. 19.5 miles per gallon
d. 20 miles per gallon
ANSWER: c
92. The Environmental Protection Agency records data on the fuel economy of many different makes of cars. Data on the mileage of 20 randomly selected cars are listed below. The values are ordered for convenience.
12 13 15 16 16 17 18 18 19 19
20 20 22 23 24 26 26 27 27 29
If the value 29 were misrecorded and had to be changed to 21, what would the median mileage be for these 20 cars?
a. It would change to 20 miles per gallon.
b. It would stay the same.
c. It would change to 21 miles per gallon.
d. We cannot determine this from the given information.
ANSWER: b
93. The Environmental Protection Agency records data on the fuel economy of many different makes of cars. Data on the mileage of 20 randomly selected cars are listed below. The values are ordered for convenience.
12 13 15 16 16 17 18 18 19 19
20 20 22 23 24 26 26 27 27 29
Chapter 1
What is the interquartile range for the mileage data?
a. 8.5 miles per gallon
b. 16.5 miles per gallon
c. 17 miles per gallon
d. 25 miles per gallon
ANSWER: a
94. A set of midterm exam scores has a median that is much larger than the mean. Which of the following statements is most consistent with this information?
a. A stemplot of the data would be symmetric.
b. A stemplot of the data would be skewed left.
c. A stemplot of the data would be skewed right.
d. The data set must be so large that it would be better to draw a histogram rather than a stemplot.
ANSWER: b
95. A consumer agency is testing appliances for a series of articles in their magazine. Currently they are working with cooktops and ranges. They selected 16 of the most commonly used models. Using a series of tests, the agency estimated the lifetime of these models. A histogram of these (estimated) lifetimes is shown below.
Answer each of the following questions with yes, no, or can’t tell.
A. Is the shortest lifetime in this data set equal to 100 months?
B. Is the median lifetime in this data set somewhere between 150 and 175 months?
C. Is the range of this data set equal to 200 months?
D. Is it possible that all of these 16 appliances had estimated lifetimes that were longer than 10 years?
ANSWER: A. Can’t tell, B. Yes, C. Can’t tell, D. Yes
Chapter 1
96. A reporter wishes to portray baseball players as overpaid. Which measure of center should he report as the average salary of major league players?
a. The mean
b. The median
c. Either the mean or median they will be equal in this case.
d. Neither the mean nor the median both will be much lower than the actual average salary.
ANSWER: a
97. The Insurance Institute for Highway Safety publishes data on the total damage suffered by compact automobiles in a series of controlled, low-speed collisions. The costs for a sample of nine cars, in hundreds of dollars, are provided below.
10 6 8 10 4 3.5 7.5 8 9
What is the median cost of the total damage suffered for this sample of cars?
a. $400
b. $730
c. $800
d. $1000
ANSWER: c
98. The Insurance Institute for Highway Safety publishes data on the total damage suffered by compact automobiles in a series of controlled, low-speed collisions. The costs for a sample of nine cars, in hundreds of dollars, are provided below.
10 6 8 10 4 3.5 7.5 8 9
What is the first quartile for the above data?
a. $350
b. $400
c. $600
d. None of the above
ANSWER: d
99. The Insurance Institute for Highway Safety publishes data on the total damage suffered by compact automobiles in a series of controlled, low-speed collisions. The costs for a sample of nine cars, in hundreds of dollars, are provided below.
10 6 8 10 4 3.5 7.5 8 9
What is the interquartile range of the above data?
a. A value less than $200
b. A value between $200 and $460
c. A value between $460 and $800
d. None of the above
ANSWER: b
100. The Insurance Institute for Highway Safety publishes data on the total damage suffered by compact automobiles in a series of controlled, low-speed collisions. The costs for a sample of nine cars, in hundreds of
Name: Class: Date:
Chapter 1
dollars, are provided below.
10 6 8 10 4 3.5 7.5 8 9
What is the mean of the total damage suffered for this sample of cars?
a. $239
b. $733
c. $800
d. $950
ANSWER: b
101. The Insurance Institute for Highway Safety publishes data on the total damage suffered by compact automobiles in a series of controlled, low-speed collisions. The costs for a sample of nine cars, in hundreds of dollars, are provided below.
10 6 8 10 4 3.5 7.5 8 9
Using the correct units, what is the value of the variance?
a. 224.85 dollars2
b. 238.48 dollars2
c. 50,555.54 dollars2
d. 56,875 dollars2
ANSWER: d
102. During the early part of the 1994 baseball season, many sports fans and baseball players noticed that the number of home runs being hit seemed to be unusually large. The numbers of home runs by American League and National League teams, based on the team-by-team statistics on home runs hit through Friday, June 3, 1994, are given below (from the Columbus Dispatch, Sunday, June 5, 1994).
American League
35 40 43 49 51 54 57 58 58 64 68 68 75 77
National League
29 31 42 46 47 48 48 53 55 55 55 63 63 67
What is the mean number of home runs hit by American League teams?
a. 48.5
b. 56.9
c. 57.5
d. 58.1
ANSWER: b
103. During the early part of the 1994 baseball season, many sports fans and baseball players noticed that the number of home runs being hit seemed to be unusually large. The numbers of home runs by American League and National League teams, based on the team-by-team statistics on home runs hit through Friday, June 3, 1994 are given below (from the Columbus Dispatch, Sunday, June 5, 1994).
American League
35 40 43 49 51 54 57 58 58 64 68 68 75 77
National League
29 31 42 46 47 48 48 53 55 55 55 63 63 67
The mean and standard deviation of the number of home runs hit by National League teams are 50 and 11,
Copyright Macmillan Learning. Powered by Cognero.
Name: Class:
Chapter 1
respectively. Suppose we wish to measure how many more home runs than last year’s average of 40 these teams have had this year by subtracting 40 from each number (a team with 55 home runs has 55 – 40 = 15 more home runs than last year’s average). What are the mean and standard deviation of these new numbers?
a. 50 and 11
b. 10 and 11
c. 50 and –29
d. 10 and –29
ANSWER: b
104. In a statistics class with 136 students, the professor records how much money each student has in his or her possession during the first class of the semester. The histogram shown below represents the data he collected.
From the histogram, which of the following statements is true?
a. The mean is larger than the median.
b. The mean is smaller than the median.
c. The mean and median are approximately equal.
d. It is impossible to compare the mean and median for these data.
ANSWER: a
105. In a statistics class with 136 students, the professor records how much money each student has in her or his possession during the first class of the semester. The histogram shown below represents the data he collected.
Chapter 1
What is the range of the data set?
a. 90
b. 100
c. 110
d. This cannot be determined from the histogram alone.
ANSWER: d
106. The Michigan Department of Transportation (M-DOT) is working on a major project: 80% of the highways in Michigan need to be repaved. To speed completion of this project, many contractors will be working for M-DOT. Contractors are currently bidding on the next part of the project. To help make a decision about which contractor to hire, M-DOT collects many variables besides just the estimated cost. One of those variables is the contractor’s estimate of the number of workdays required to finish the job. Twenty contractors have bid on the next job. The boxplot below represents their estimates of the number of work days required.
Chapter 1

What is (approximately) the interquartile range, based on the boxplot?
a. 140 days
b. 270 days
c. 360 days
d. 760 days
ANSWER: b
107. The Michigan Department of Transportation (M-DOT) is working on a major project: 80% of the highways in Michigan need to be repaved. To speed completion of this project, many contractors will be working for M-DOT. Contractors are currently bidding on the next part of the project. To help make a decision about which contractor to hire, M-DOT collects many variables besides just the estimated cost. One of those variables is the contractor’s estimate of the number of workdays required to finish the job. Twenty contractors have bid on the next job. The boxplot below represents their estimates of the number of work days required.
Chapter 1
Determine whether each of the following statements is true or false.
A. The median number of days is approximately 180.
B. The minimum number of days is approximately 40.
C. The maximum number of days is approximately 750.
D. Twenty-five percent of contractors estimated the number of days to be more than 100.
ANSWER: A. True, B. True, C. False, D. False
108. The asking prices (in thousands of dollars) for a sample of 13 houses currently on the market in Neighborville are listed below. For convenience, the data have been ordered.
175 199 204 234 259 275 299 304 317 345 355 384 549
What is the five-number summary?
a. 175 234 290 345 549
b. 175 234 299 345 549
c. 175 219 299 350 549
d. None of the above
ANSWER: c
109. The asking prices (in thousands of dollars) for a sample of 13 houses currently on the market in Neighborville are listed below. For convenience, the data have been ordered.
175 199 204 234 259 275 299 304 317 345 355 384 549
Use the 1.5 IQR rule to determine whether there are any outliers present. What is(are) the value(s) of the outlier(s)?
a. There are no outliers present.
b. One outlier: 175
c. One outlier: 549
Chapter 1
d. Two outliers: 175 and 549
ANSWER: c
110. The following boxplot represents the birth weights (in ounces) of 160 infants born in a local hospital.
The median birth weight is approximately ________________.
a. 90 ounces
b. 100 ounces
c. 110 ounces
d. 120 ounces
ANSWER: c
111. The following boxplot represents the birth weights (in ounces) of 160 infants born in a local hospital.
About 40 of the birth weights were below _______________.
a. 92 ounces
b. 102 ounces
c. 112 ounces
d. 122 ounces
ANSWER: b
112. The following boxplot represents the birth weights (in ounces) of 160 infants born in a local hospital.
Approximately children had birth weights between 102 and 122 ounces.
a. 40
b. 50
c. 80
d. 100
ANSWER: c
113. This is a standard deviation contest. Which of the following sets of four numbers has the largest possible standard deviation?
a. 7, 8, 9, 10
b. 5, 5, 5, 5
c. 0, 0, 10, 10
d. 0, 1, 2, 3
ANSWER: c
114. A sample of 16 people is taken, and their weights are measured. The standard deviation of these 16 measurements is computed to be 5.4. What is the variance of these measurements?
a. 2.24 pounds
b. 2.24 pounds2
Chapter 1 Copyright Macmillan Learning. Powered by Cognero.
Chapter 1
c. 29.16 pounds
d. 29.16 pounds2
ANSWER: d
115. There are three children aged three, four, and five, in a room. If another four-year-old child enters the room, what will happen to the mean and variance?
a. The mean will stay the same, but the variance will increase.
b. The mean will stay the same, but the variance will decrease.
c. The mean and variance will both stay the same.
d. The mean and variance will both decrease.
ANSWER: b
116. The standard deviation s is a useful measure of a characteristic of a distribution of data values. Which of the following statements about s is FALSE?
a. The standard deviation measures the spread of the data around the mean.
b. The standard deviation is appropriate as a measure of spread when the mean is chosen as the measure of center.
c. The standard deviation can never be zero.
d. The standard deviation is not resistant; a few outliers can make s very large.
e. As the data values become more spread out about their mean, s becomes larger.
ANSWER: c
117. The salaries paid to the eight employees of a small market research company are as follows: the five telephone interviewers are each paid $32,000; two administrative assistants are paid $48,000; a supervisor is paid $60,000; and the senior manager is paid $190,000.The number of employees earning more than the mean salary is:
a. four.
b. zero.
c. one.
d. two.
e. seven.
ANSWER: d
118. The following data are the magnitudes of earthquakes around the world recorded on January 13, 2008. 4.1, 4.8, 3.1, 5.3, 5.1, 4.7, 3.0, 2.9, U, 4.6, 3.1, 3.0, U, 2.5 Because of equipment problems, two earthquakes were unrecorded (U), although it was known that both had a value less than 2.7. The median magnitude of earthquakes on this date is:
a. 2.95.
b. 3.9.
c. 4.0.
d. 3.1.
e. This cannot be determined without knowing the exact value of the missing magnitudes.
Copyright Macmillan Learning. Powered by Cognero.
Name: Class: Date:
ANSWER: d
119. Agricultural fairs often hold competitions for produce grown by local gardeners. The following data are the weights (in pounds) of tomatoes entered into an annual fair in Roland, Manitoba, Canada, in 2007.
2.48 1.52 1.15 1.13 1.00 0.99 0.96 0.94 0.75
The interquartile range (IQR) for these data is:
a. a value less than 0.40 pound.
b. a value between 0.50 pound and 0.60 pound.
c. a value between 0.65 pound and 0.75 pound.
d. a value greater than 0.80 pound.
ANSWER: a
120. Agricultural fairs often hold competitions for produce grown by local gardeners. The following data are the weights (in pounds) of tomatoes entered into an annual fair in Roland, Manitoba, Canada, in 2007.
2.48 1.52 1.15 1.13 1.00 0.99 0.96 0.94 0.75
Apply the 1.5 IQR rule to the data to check for outlier values. In this case, _____________.
a. there are no outliers
b. the value 0.75 is the only outlier
c. the values 0.75 and 2.48 are both outliers
d. the value 2.48 is the only outlier
e. the values 1.52 and 2.48 are both outliers
ANSWER: d
121. At a Canadian agricultural fair held in Neguac, New Brunswick, giant pumpkins were entered into a competition. The following stem-and-leaf plot of the weight (in pounds) of the 35 pumpkins in the competition was constructed, where, for example, 9|4 represents 940 pounds.
The quartiles Q1 and Q3 for these data are:
a. Q1 = 90 and Q3 = 1190.
b. Q1 = 320 and Q3 = 640.
c. Q1 = 322 and Q3 = 716.
d. Q1 = 320 and Q3 = 660.
e. Q1 = 490 and Q3 = 660.
ANSWER: d
Chapter 1 Copyright Macmillan Learning. Powered by Cognero.
Name: Class:
Chapter 1
122. The New England Patriots are a top-ranked team in the National Football League, and the Saskatchewan Roughriders are the 2007 champions of the Canadian Football League. From the 2007 rosters of these two teams, the weight of each player was determined, and the side-by-side boxplots of their weights are provided below.
Which of the following statements about these side-by-side boxplots is(are) TRUE?
a. The weights of the New England team exhibit less overall variation than those of the Saskatchewan team.
b. The median weight for the New England team is higher than the median weight for the Saskatchewan team.
c. The IQR for the Saskatchewan team is greater than the IQR for the New England team. ANSWER: b
123. The fuel efficiencies of 2007 models of midsized automobiles were studied, and the side-by-side boxplots of the distribution of the miles per gallon in city driving (MPG-City) for automobiles manufactured in North America, Asia, and Europe are given below.

From these boxplots, we can see that:
Chapter 1
a. the MPG-City for 75% of automobiles from Asia is higher than the MPG-City for 75% of European automobiles.
b. 75% of the cars from Asia have higher fuel efficiency than 50% of the cars from North America.
c. the median fuel efficiency rating is highest for automobiles manufactured in Asia.
d. the overall variability in fuel efficiency rating is highest for European-built automobiles.
e. all of the above are correct.
f. A, B, and C are correct.
ANSWER: e
124. A study was conducted on the distance that various brand-name golf balls would travel. The study involved the use of a standard testing machine and a seven iron. A selection of results from the study is given below for the distance (in yards) for each brand of ball. 144.0 145.8 138.7 141.3 142.8 143.8 145.8 144.5
The mean and the standard deviation s of these measurements (in yards) are, respectively:
a. 143.90 and 3.10.
b. 143.34 and 2.39.
c. 142.25 and 5.73.
d. 143.34 and 2.24.
e. 143.90 and 2.39.
ANSWER: b
125. For describing the distribution of a set of data, when is the five-number summary preferred over the mean and standard deviation s?
a. When the distribution is reasonably symmetric
b. When the distribution has little skewness and there are no outliers
c. When the data are provided in increasing order of magnitude
d. When the data exhibit skewness and there are strong outliers
e. Never, because the mean and standard deviation are always more reliable
ANSWER: d
126. A sample was taken of 20 salaries of employees in a large company. The following are the annual salaries (in thousands of dollars). For convenience, the data have been ordered.
28 31 34
What is the median salary of the 20 employees?
ANSWER: $48,000
127. A sample was taken of 20 salaries of employees in a large company. The following are the annual salaries (in thousands of dollars). For convenience, the data have been ordered.
28 31 34 35 37 41 42 42 42 47
49 51 52
A histogram of the 20 salaries is slightly skewed to the right. What do we know about the mean salary of these
Chapter 1
20 salaries, based on this information?
ANSWER: The mean is probably higher than the median.
128. A sample was taken of 20 salaries of employees in a large company. The following are the annual salaries (in thousands of dollars). For convenience, the data have been ordered.
28 31 34 35 37 41 42 42 42 47
49 51 52 52 60 61 67 72 75 77
What is the first quartile of the 20 salaries?
ANSWER: $39,000
129. A sample was taken of 20 salaries of employees in a large company. The following are the annual salaries (in thousands of dollars). For convenience, the data have been ordered.
28 31 34 35 37 41 42 42 42 47 49 51 52 52 60 61 67 72 75 77
What is the interquartile range of the 20 salaries?
ANSWER: $21,500
130. A sample was taken of 20 salaries of employees in a large company. The following are the annual salaries (in thousands of dollars). For convenience, the data have been ordered.
28 31 34 35 37 41 42 42 42 47 49 51 52 52 60 61 67 72
Suppose each employee in the company receives a $3000 raise for next year (each employee’s salary is increased by $3000). Indicate how each of the following summary measures will change after the raise.
A. The median salary
B. The interquartile range of the salaries
C. The standard deviation of the salaries
ANSWER: A. The median will increase by $3000.
B. The interquartile range will remain unchanged.
C. The standard deviation will remain unchanged.
131. A boxplot of a sample of 20 salaries from a company is shown below.
Chapter 1
For each of the following sentences, fill in the blank.
A. The maximum salary is approximately __________________.
B. The minimum salary is approximately __________________.
C. The interquartile range is approximately __________________.
D. Seventy-five percent of the employees in this sample of 20 earn more than approximately _____________.
ANSWER: A. $97,000, B. $35,000, C. $20,000, D. $45,000
132. A boxplot of a sample of 20 salaries from a company is shown below.
Based on this boxplot, answer each of the following questions with yes, no, or can’t tell.
A. Is the salary distribution fairly symmetric?
Chapter 1
B. Do about 10 employees make more than $55,000?
C. Does nobody make more than $71,000?
D. Is the range of the salaries roughly $35,000?
ANSWER: A. Can’t tell, B. Yes, C. No, D. No
133. A boxplot of a sample of 20 salaries from a company is shown below.
Based on this boxplot, determine the (approximate) values of the five-number summary.
ANSWER: Min = $35,000, Q1 = $45,000, M = $55,000, Q3 = $65,000, Max = $97,000
134. Psychopathic Personality Disorder (psychopathy) is defined as a condition that negatively affects one’s level of empathy, conscience, and impulse control. A questionnaire was developed by Lilienfeld (1990) to assess one’s level of psychopathy. Ninety random people were asked to take Lilienfeld’s test. Their results are shown in the histogram below.
Chapter 1
The data would be better represented in a pie chart.
a. True
b. False
c. Both displays work equally well.
ANSWER: b
135. Psychopathic Personality Disorder (psychopathy) is defined as a condition that negatively affects one’s level of empathy, conscience, and impulse control. A questionnaire was developed by Lilienfeld (1990) to assess one's level of psychopathy. Ninety random people were asked to take Lilienfeld’s test. Their results are shown in the histogram below.
Chapter 1
The data are ______.
a. heavily skewed to the right
b. heavily skewed to the left
c. reasonably Normal
ANSWER: c
136. Psychopathic Personality Disorder (psychopathy) is defined as a condition that negatively affects one’s level of empathy, conscience, and impulse control. A questionnaire was developed by Lilienfeld (1990) to assess one's level of psychopathy. Ninety random people were asked to take Lilienfeld’s test. Their results are shown in the histogram below.
The mean score of these data is around _______.
a. 380
b. 17
c. 0
d. This cannot be determined from the data given.
ANSWER: a
137. Psychopathic Personality Disorder (psychopathy) is defined as a condition that negatively affects one’s level of empathy, conscience, and impulse control. A questionnaire was developed by Lilienfeld (1990) to assess one’s level of psychopathy. Ninety random people were asked to take Lilienfeld’s test. Their results are shown in the histogram below.
The minimum score is _____.
a. less than 300
b. greater than 500
c. 250
d. This cannot be determined from the data given.
ANSWER: a
138. Psychopathic Personality Disorder (psychopathy) is defined as a condition that negatively affects one’s level of empathy, conscience, and impulse control. A questionnaire was developed by Lilienfeld (1990) to assess one’s level of psychopathy. Ninety random people were asked to take Lilienfeld’s test. Their results are shown in the histogram below.
Chapter 1
The maximum score is _____.
a. less than 300
b. greater than 500
c. 250
d. between 450 and 460
e. none of the above
ANSWER: e
139. Psychopathic Personality Disorder (psychopathy) is defined as a condition that negatively affects one’s level of empathy, conscience, and impulse control. A questionnaire was developed by Lilienfeld (1990) to assess one’s level of psychopathy. Ninety random people were asked to take Lilienfeld’s test. Their results are shown in the histogram below.
Chapter 1
There are outliers in the data set.
a. True
b. False
c. Can’t tell
ANSWER: b
140. Psychopathic Personality Disorder (psychopathy) is defined as a condition that negatively affects one’s level of empathy, conscience, and impulse control. A questionnaire was developed by Lilienfeld (1990) to assess one’s level of psychopathy. Ninety random people were asked to take Lilienfeld’s test. Their results are shown in the histogram below.
Chapter 1
The histogram is unimodal.
a. True
b. False
c. Can’t tell
ANSWER: a
141. Consider the histogram below, which is based on data from 40 students who were asked, “How much money did you spend on textbooks this semester?” What do you estimate the mean of the data as?
Chapter 1
a. Between $600 and $700
b. Between $100 and $150
c. $700
d. Between $200 and $300
ANSWER: d
142. Consider the histogram below, which is based on data from 40 students who were asked, “How much money did you spend on textbooks this semester?” What do you estimate the median of the data as?
Chapter 1
a. $100
b. Between $600 and $700
c. Between $200 and $300
d. None of the above
ANSWER: c
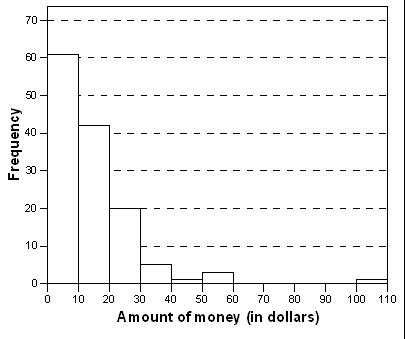
143. Minecraft is a popular video game about placing blocks to build anything you can imagine. We surveyed 20 students at each of three elementary schools to find out how much time (in minutes) they spend per week playing the game. Which histogram appears to show the highest mean?
Chapter 1
d. All three have about the same mean.
ANSWER: c
144. Minecraft is a popular video game about placing blocks to build anything you can imagine. We surveyed 20 students at each of three different elementary schools to find out how much time (in minutes) they spend per week playing the game. Which histogram appears to show the highest median?
Chapter 1
d. They all have about the same median.
ANSWER: c
145. Twenty professional athletes were asked, “At what age did you graduate from college?” The responses are displayed in the histogram below.
Chapter 1
Which of the statistics below appears to be the smallest, based on these data?
a. Max
b. Mean
c. Median
d. Range ANSWER: c
146. Twenty professional athletes were asked, “At what age did you graduate from college?” The responses are displayed in the histogram below.
Chapter 1
Do there appear to be any outliers in the data set?
a. Yes
b. No
c. Can’t tell
ANSWER: a
147. Twenty professional athletes were asked, “At what age did you graduate from college?” The responses are displayed in the histogram below.
Chapter 1
Does the distribution appear to be symmetric?
a. Yes
b. No
c. Can’t tell
ANSWER: b
148. Twenty professional athletes were asked, “At what age did you graduate from college?” The responses are displayed in the histogram below.
Chapter 1
The maximum value is:
a. 50.
b. 55.
c. 60.
d. Can’t tell ANSWER: d
149. Which density curve below has the largest standard deviation?
Chapter 1
ANSWER: b
150. Which density curve below has the smallest standard deviation? a.
Chapter 1
ANSWER: d
151. The density curve below is __________.
a. right-skewed
Chapter 1
b. left-skewed
c. symmetric
d. none of the above ANSWER: c
152. Which of the following do not adequately reveal outliers?
a. Density curves
b. Stemplots
c. Histograms
d. Modified boxplots
ANSWER: a
153. The numbers of Facebook friends that students at a university have are Normally distributed with a mean of 1200 and a standard deviation of 200. What percent of the students have at least 1000 Facebook friends?
a. 84.13%
b. 15.86%
c. 42.07%
d. None of the above ANSWER: a
154. The numbers of Facebook friends that students at a university have are Normally distributed with a mean of 1200 and a standard deviation of 200. What percent of the students have exactly 1000 Facebook friends?
a. 84.13%
b. 15.86%
c. 42.07%
d. None of the above ANSWER: d
155. Determine whether each of the following statements regarding the density curve below is true or false.
A. It is symmetric.
B. The total area under the curve is 1.
C. The median is 1.
Chapter 1
D. The mean is 1. ANSWER: A. True, B. True, C. True, D. True
156. For the density curve below, what percent of the observations lie above 1.5?
a. 25%
b. 50%
c. 75%
d. 80%
ANSWER: a
157. For the density curve below, what percent of the observations lie between 0.5 and 1.2?
a. 25%
b. 35%
c. 50%
d. 70%
ANSWER: b
158. For the density curve below, which of the following statements is TRUE?
Chapter 1

a. The mean and median are equal.
b. The mean is greater than the median.
c. The mean is less than the median.
d. The mean could be either greater than or less than the median.
ANSWER: c
159. Which of the following statements about a density curve is FALSE?
a. A density curve always has an area beneath it equal to 1.
b. A density curve can adequately describe outliers observed in data.
c. A density curve is always on or above the horizontal axis.
d. A density curve comes in many shapes, some of which are symmetric while others are skewed.
e. The area under a density curve above any range of values is the proportion of all observations that fall in that range.
ANSWER: b
160. The following curve is to be a density curve for the variable x

What must be the value of the point on the vertical axis labeled H for this to be a proper density function?
a. 1.60
b. 1.00
c. 0.80
d. 1.25
e. 0.625
ANSWER: d
161. Which of the following statements about the mean and the median of a density curve is FALSE?
a. The median is the point on the axis that divides the area under the density curve in two equal halves.
b. The median and the mean have the same value if the density curve is symmetric.
c. The mean is the “balance point” of the density curve.
d. The median of a skewed density curve is pulled away from the mean in the direction of the long tail.
e. For a symmetric density curve, both the mean and the median are at the center of the curve.
ANSWER: d
162. For the density curve displayed below, what is the mean?
a. 0.25
b. 0.50
c. 0.71
d. 0.75
ANSWER: b
163. Determine whether each of the following statements regarding a Normal density curve is true or false.
A. It is symmetric.
B. It has a peak centered above its mean.
C. The quartiles lie 1 standard deviation below and above the mean.
D. The spread of the curve is proportional to the standard deviation.
ANSWER: A. True, B. True, C. False, D. True
164. Many residents of suburban neighborhoods own more than one car but consider one of their cars to be the main family vehicle. The age of these family vehicles can be modeled by a Normal distribution with a mean of 2 years and a standard deviation of 6 months. What percent of family vehicles is between 1 and 3 years old?
Chapter 1 Copyright Macmillan Learning. Powered by Cognero.
Chapter
a. This cannot be determined from the information given.
b. 68%
c. 95%
d. 99.7%
ANSWER: c
165. Many residents of suburban neighborhoods own more than one car but consider one of their cars to be the main family vehicle. The age of these family vehicles can be modeled by a Normal distribution with a mean of 2 years and a standard deviation of 6 months. What is the standardized value for a family vehicle that is 3 years and 3 months old?
a. 0.22
b. 2.5
c. 2.6
d. 2.92
ANSWER: b
166. Items produced by a manufacturing process are supposed to weigh 90 grams. However, there is variability in the items produced, and they do not all weigh exactly 90 grams. The distribution of weights can be approximated by a Normal distribution with a mean of 90 grams and a standard deviation of 1 gram. What percentage of the items will weigh either less than 87 grams or more than 93 grams?
a. 6%
b. 94%
c. 99.7%
d. 0.3%
ANSWER: d
167. The time to complete an exam is approximately Normal with a mean of 70 minutes and a standard deviation of 10 minutes. Using the 68-95-99.7 rule, what percent of students will complete the exam in under an hour?
a. 68%
b. 32%
c. 16%
d. 5%
ANSWER: c
168. Using the standard Normal distribution tables, what is the area under the standard Normal curve corresponding to Z < 1.1?
a. 0.1357
b. 0.2704
c. 0.8413
d. 0.8643
ANSWER: d
1 Copyright Macmillan Learning. Powered by Cognero.
Name: Class: Date:
Chapter
169. Using the standard Normal distribution tables, what is the area under the standard Normal curve corresponding to Z > –1.22?
a. 0.1151
b. 0.1112
c. 0.8849
d. 0.8888
ANSWER: d
170. Using the standard Normal distribution tables, what is the area under the standard Normal curve corresponding to –0.5 < Z < 1.2?
a. 0.3085
b. 0.8849
c. 0.5764
d. 0.2815
ANSWER: c
171. The variable Z has a standard Normal distribution. Find the value z such that 85% of the observations fall below z.
a. z = –1.04
b. z = 0.80
c. z = 0.85
d. z = 1.04
ANSWER: d
172. The variable Z has a standard Normal distribution. Find the value z such that the event Z > z has proportion of 0.08.
a. z = –1.41
b. z = 0.53
c. z = 0.82
d. z = 1.41
ANSWER: d
173. The temperature at any random location in a kiln used for manufacturing bricks is Normally distributed with a mean of 1000°F and a standard deviation of 50°F. If bricks are fired at a temperature above 1125°F, they will crack and must be discarded. If the bricks are placed randomly throughout the kiln, what is the percent of bricks that crack during the firing process?
a. 0.62%
b. 2.28%
c. 47.72%
d. 49.38%
ANSWER: a
Chapter 1
174. The temperature at any random location in a kiln used for manufacturing bricks is Normally distributed with a mean of 1000°F and a standard deviation of 50°F. When glazed bricks are put in the oven, if the temperature is below 900°F, they will discolor. If the bricks are placed randomly throughout the kiln, what percent of glazed bricks will discolor?
a. 0.62%
b. 2.28%
c. 47.72%
d. 49.38%
ANSWER: b
175. The scores on a university examination are Normally distributed with a mean of 62 and a standard deviation of 11. If the bottom 5% of students will fail the course, what is the lowest mark that a student can have and still be awarded a passing grade?
a. 62
b. 57
c. 44
d. 40
ANSWER: c
176. The preparation time to mail envelopes with a weekly report to all executives in a company has a Normal distribution with a mean of 35 minutes and a standard deviation of 2 minutes. On 95% of such occasions, the mailing preparation takes less than x minutes. What is the value of x?
a. 31.71
b. 34.75
c. 35.25
d. 38.29
ANSWER: d
177. A soft drink machine can be regulated so that it discharges an average of ounces per cup. If the ounces of fill are Normally distributed with a standard deviation of 0.4 ounce, what value should be set at so that 6ounce cups will overflow only 2% of the time?
a. 5.18
b. 5.60
c. 6.00
d. 6.82
ANSWER: a
178. The weights of packets of cookies produced by a certain manufacturer have a Normal distribution with a mean of 202 grams and a standard deviation of 3 grams. What is the weight that should be stamped on the packet so that only 1% of the packets are underweight?
a. 195 grams
b. 202 grams
c. 209 grams
d. There is not enough information to tell.
ANSWER: a
179. A company produces packets of soap powder labeled “Giant size 32 ounces.” The actual weight of soap powder in such a box has a Normal distribution with a mean of 33 ounces and a standard deviation of 0.7 ounce. To avoid dissatisfied customers, a box of soap is considered underweight if it weighs less than 32 ounces. To avoid losing money, the top 5% (the heaviest 5%) is labeled overweight. What proportion of boxes is underweight?
a. 0.0766
b. 0.2420
c. 0.7580
d. 0.9234
ANSWER: a
180. A company produces packets of soap powder labeled “Giant size 32 ounces.” The actual weight of soap powder in such a box has a Normal distribution with a mean of 33 ounces and a standard deviation of 0.7 ounce. To avoid dissatisfied customers, a box of soap is considered underweight if it weighs less than 32 ounces. To avoid losing money, the top 5% (the heaviest 5%) is labeled overweight. How heavy does a box have to be in order to be labeled overweight?
a. 31.60 ounces
b. 31.85 ounces
c. 34.15 ounces
d. 34.40 ounces
ANSWER: c
181. Chocolate bars produced by a certain machine are labeled with 8.0 ounces. The distribution of the actual weights of these chocolate bars is Normal with a mean of 8.1 ounces and a standard deviation of 0.1 ounce. A chocolate bar is considered underweight if it weighs less than 8.0 ounces. What proportion of chocolate bars weighs less than 8.0 ounces?
a. 0.159
b. 0.341
c. 0.500
d. 0.841
ANSWER: a
182. Chocolate bars produced by a certain machine are labeled with 8.0 ounces. The distribution of the actual weights of these chocolate bars is Normal with a mean of 8.1 ounces and a standard deviation of 0.1 ounce. A chocolate bar is considered underweight if it weighs less than 8.0 ounces. What proportion of chocolate bars weighs between 8.2 and 8.3 ounces?
a. 0.136
b. 0.477
Chapter 1 Copyright Macmillan Learning. Powered by Cognero.
Chapter
c. 0.636
d. 0.819
ANSWER: a
183. Chocolate bars produced by a certain machine are labeled with 8.0 ounces. The distribution of the actual weights of these chocolate bars is Normal with a mean of 8.1 ounces and a standard deviation of 0.1 ounce. A chocolate bar is considered underweight if it weighs less than 8.0 ounces. How should the chocolate bar wrappers be labeled so that only 1% of such bars are underweight?
a. 7.77 ounces
b. 7.87 ounces
c. 8.23 ounces
d. 8.33 ounces
ANSWER: b
184. A market research company employs a large number of typists to enter data into a computer database. The time it takes for potential new typists to learn the computer system is known to have a Normal distribution with a mean of 90 minutes and a standard deviation of 18 minutes. A candidate is automatically hired if she learns the computer system in less than 100 minutes. A cutoff time is set at the slowest 10% of the learning distribution. Anyone slower than this cutoff time is definitely not hired. What proportion of candidates take more than 2 hours to learn the computer system?
a. 0.048
b. 0.452
c. 0.711
d. 0.952
ANSWER: a
185. A market research company employs a large number of typists to enter data into a computer database. The time it takes for potential new typists to learn the computer system is known to have a Normal distribution with a mean of 90 minutes and a standard deviation of 18 minutes. A candidate is automatically hired if she learns the computer system in less than 100 minutes. A cutoff time is set at the slowest 10% of the learning distribution. Anyone slower than this cutoff time is definitely not hired. What proportion of candidates will be hired automatically?
a. 0.048
b. 0.452
c. 0.711
d. 0.952
ANSWER: c
186. A market research company employs a large number of typists to enter data into a computer database. The time it takes for potential new typists to learn the computer system is known to have a Normal distribution with a mean of 90 minutes and a standard deviation of 18 minutes. A candidate is automatically hired if she learns the computer system in less than 100 minutes. A cutoff time is set at the slowest 10% of the learning distribution. Anyone slower than this cutoff time is definitely not hired.
1 Copyright Macmillan Learning. Powered by Cognero.
Chapter 1
What is the cutoff time that the market research company uses?
a. 1 hour and 7 minutes
b. 1 hour and 53 minutes
c. 2 hours
d. 2 hours and 8 minutes
ANSWER: b
187. Which of the following statements about the standardized z-score of a value of a variable X, which has a mean of m and a standard deviation of s, is(are) TRUE?
a. The z-score has a mean equal to 0.
b. The z-score has a standard deviation equal to 1.
c. The z-score tells us how many standard deviation units from the original observation fall away from the mean.
d. The z-score tells us the direction in which an observation falls away from the mean.
e. All of the above statements about the z-score are true.
ANSWER: e
188. A well-known maker of jams and jellies packages its jams in jars labeled “250 milliliters.” The process used to fill the jars is known to dispense an amount of jam that is a Normally distributed variable with milliliters and milliliter. What proportion of the jars filled by the process will contain less than 250 milliliters?

a. 0.5
b. 0.9868
c. 0.0068
d. 0.0131
e. 0
ANSWER: d

189. A well-known maker of jams and jellies packages its jams in jars labeled “250 milliliters.” The process used to fill the jars is known to dispense an amount of jam that is a Normally distributed variable with milliliters and milliliter. What proportion of jars from this filling process will contain no more than 253.5 milliliters?
a. 0.9678
b. 0.9522
c. 0.9973
d. 0.0027
e. 0.0475
ANSWER: b
190. A well-known maker of jams and jellies packages its jams in jars labeled “250 milliliters.” The process used to fill the jars is known to dispense an amount of jam that is a Normally distributed variable with
Name: Class: Date:
Chapter 1
milliliters and milliliter. What percent of jars will be filled with between 251 milliliters and 254 milliliters?
a. 85.3%
b. 1.3%
c. 14.7%
d. 13.4%
e. 8.5%
ANSWER: a
191. A well-known maker of jams and jellies packages its jams in jars labeled “250 milliliters.” The process used to fill the jars is known to dispense an amount of jam that is a Normally distributed variable with milliliters and milliliter. What proportion of jars will be filled with what the label claims is 250 milliliters?
a. 0.9868
b. 0
c. 0.0068
d. 0.0132
e. 0.0027
ANSWER: b
192. A well-known maker of jams and jellies packages its jams in jars labeled “250 milliliters.” The process used to fill the jars is known to dispense an amount of jam that is a Normally distributed variable with milliliters and milliliter. If changing while keeping the same were possible for this process, what should be set at so that the percent of jars filled with less than 250 milliliters will be at most 0.2%?
a.

b.
c.

d.
e. It should not be within 0.2 of any of the above.
ANSWER: c
193. A tool and die company has been contracted to produce metal castings into which a hole is to be drilled to a diameter of 2.5 centimeters. Because of the variability in the drilling process, the actual diameter of the hole is a Normally distributed variable with a mean of 2.5 centimeters and a standard deviation of 0.1 centimeter. The proportion of castings produced by this process with a hole whose diameter is within 0.2 centimeter of the desired value is
a. 0.9772.
b. 0.9549.
c. 0.9974.
d. 0.6826.
Copyright Macmillan Learning. Powered by Cognero.
Name: Class:
e. 0.0228.
ANSWER: b
194. In 1998 the World Health Organization reported the findings of a major study on the quality of blood pressure monitoring around the world. In its report it stated that for Canada, the results for diastolic blood pressure had a mean of 78 mmHg and a standard deviation of 11 mmHg. Assuming that diastolic blood pressure measurements are Normally distributed, the DBP reading that represents the 80th percentile of the distribution is:
a. 85.4.
b. 93.6.
c. 87.3
d. 86.8.
e. 68.8.
ANSWER: c
195. A stemplot of a set of data is roughly symmetric, but a quantile plot does not show a straight line. What conclusion can we draw?
a. The data are Normal but not standard Normal.
b. The data are standard Normal.
c. The data are not Normal.
d. The data are Normal.
ANSWER: c
196. Consider the following Normal quantile plot.

What is the most striking feature of the plot?
a. The granularity
Chapter 1 Copyright Macmillan Learning. Powered by Cognero.
b. The strong skewness indicated by the plot
c. The many outliers evident in the plot
Chapter 1
d. The fact that Y is categorical ANSWER: a
197. A quantile plot of the horsepower of a sample of 65 cars is shown below.

Which of the following descriptions best describes the shape of the distribution of horsepower?
a. Normal
b. Normal with some outliers
c. Left-skewed
d. Right-skewed
ANSWER: c
198. Which of the following statements about Normal quantile plots is(are) FALSE?
a. In constructing a Normal quantile plot, each data point is plotted against its corresponding Normal score.
b. The Normal quantile plot is a very useful graphical tool for assessing the adequacy of the Normal model.
c. If the points on a Normal quantile plot lie nearly on a straight line, the plot indicates that the Normal model is an adequate representation for the data.
d. Because you will see the usual mound-like appearance of the Normal distribution on a histogram, it is more helpful than the quantile plot for assessing Normality.
e. On a quantile plot, outliers will appear as points that are far away from the overall pattern of the plot.
ANSWER: d
199. Battery packs in electric go-carts need to last a fairly long time. The run-times (time until recharging is needed) of the battery packs made by a particular company are Normally distributed with a mean of 2 hours and a standard deviation of 20 minutes. What percent of these battery packs last longer than 3 hours?
ANSWER: 0.13%
Chapter 1
200. Battery packs in electric go-carts need to last a fairly long time. The run-times (time until recharging is needed) of the battery packs made by a particular company are Normally distributed with a mean of 2 hours and a standard deviation of 20 minutes. What is the third quartile for the run-time distribution?
ANSWER: 2 hours and 13.5 minutes
201. Battery packs in electric go-carts need to last a fairly long time. The run-times (time until recharging is needed) of the battery packs made by a particular company are Normally distributed with a mean of 2 hours and a standard deviation of 20 minutes. Battery packs that have a runtime in the highest 10% of the run-time distribution are highly sought after by go-cart drivers. How long does the battery pack have to last for it to fall in this highly sought-after class?
ANSWER: 2 hours and 25.6 minutes
202. A machine fills 64-ounce jugs with detergent. Assume the distribution of the amount of detergent in these jugs is Normal. Under standard circumstances, the mean amount should be 64 ounces with a standard deviation of 0.4 ounce. A quality control inspector regularly checks the amount poured into the jugs to see whether the machine needs an adjustment, which is needed when the machine either overfills or underfills the jugs. If the machine is running on target, what proportion of jugs receive more than 65 ounces of detergent?
ANSWER: 0.0062
203. A machine fills 64-ounce jugs with detergent. Assume the distribution of the amount of detergent in these jugs is Normal. Under standard circumstances, the mean amount should be 64 ounces with a standard deviation of 0.4 ounce. A quality control inspector regularly checks the amount poured into the jugs to see whether the machine needs an adjustment, which is needed when the machine either overfills or underfills the jugs. The quality control inspector will adjust the machine if he finds too many jugs that fall in the most extreme 5% of the distribution. “Most extreme” is defined as either too little detergent (bottom 2.5%) or too much detergent (top 2.5%). If the machine is running on target, what are the bounds for which the machine will be classified as working fine?
ANSWER: 63.2 ounces and 64.8 ounces