Chapter 2
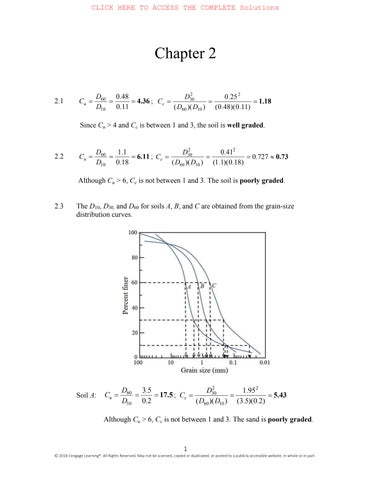
Since Cu >4and Cc isbetween1and3,thesoilis well graded.
Although Cu >6, Cc isnotbetween1and3.Thesoilis poorly graded
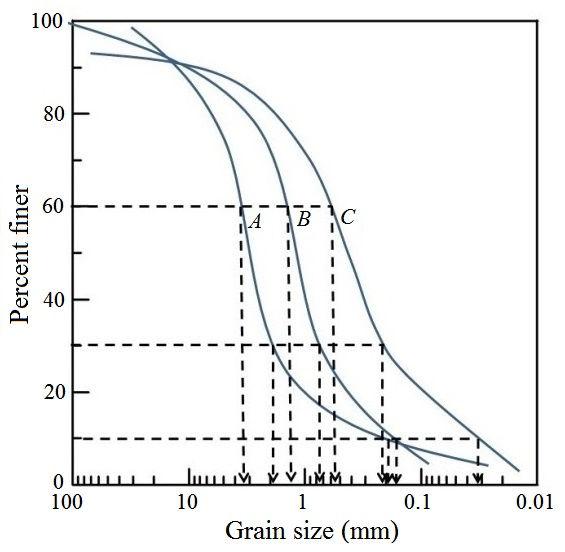
2.3 The D10, D30, and D60 forsoils A, B,and C areobtainedfromthegrain-size distributioncurves.
Although Cu >6, Cc isnotbetween1and3.Thesandis poorly graded
Cu >6,and Cc isbetween1and3.Thesandis well graded.
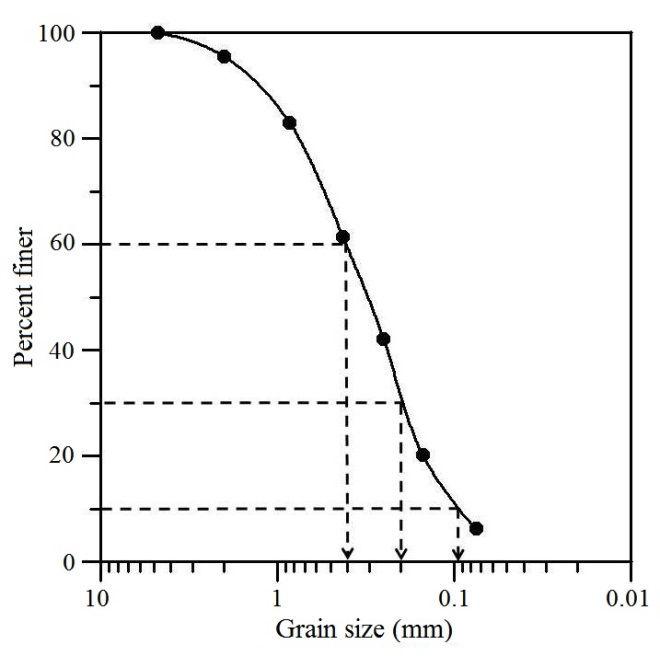
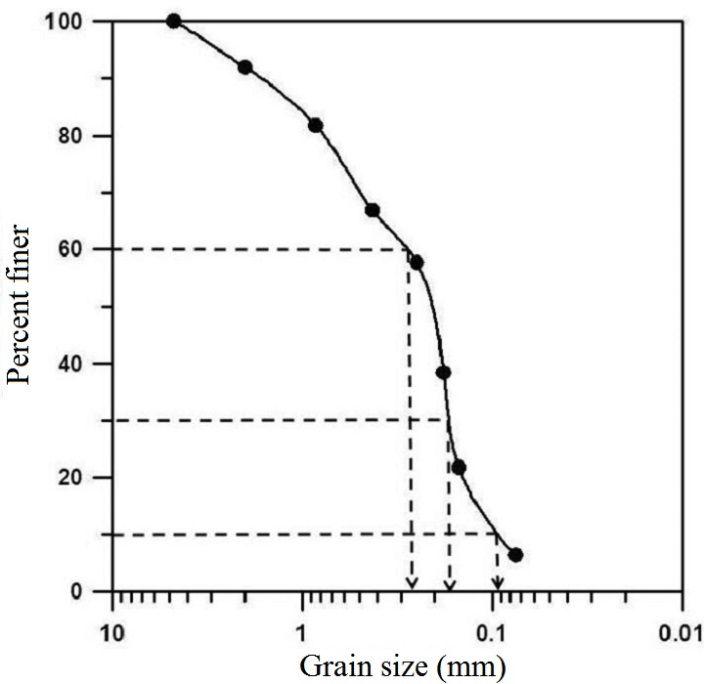
Thegrain-sizedistributionisshowninthefigure. b. D60 = 0.4 mm; D30 = 0.2 mm; D10 = 0.095 mm
Thegrain-sizedistributionisshowninthefigure.
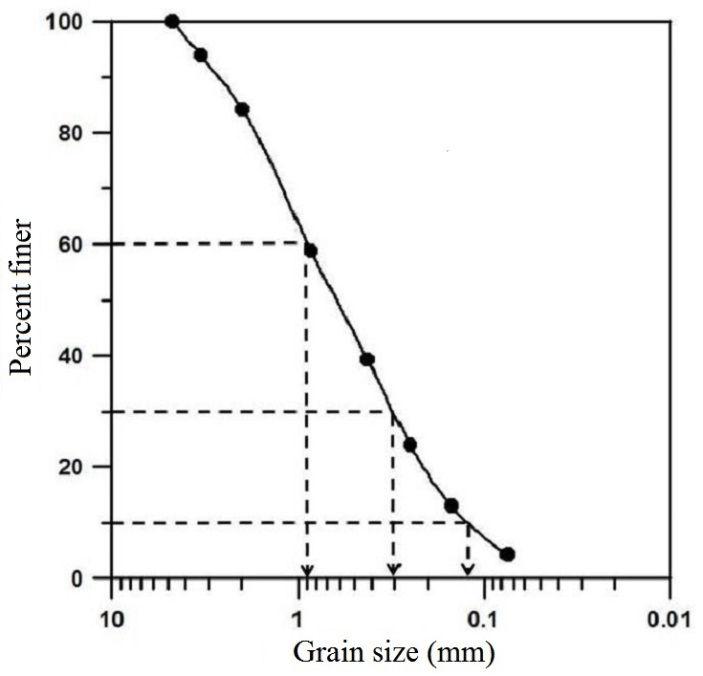
Thegrain-sizedistributionisshowninthefigure.
Thegrain-sizedistributionisshowninthefigure.
a. Thegrain-sizedistributioncurveisshowninthefigure
b. Percentpassing2mm=100
Percentpassing0.06mm=84
Percentpassing0.002mm=11
c. Percentpassing2mm=100
Percentpassing0.05mm=80
Percentpassing0.002mm=11
d. Percentpassing2mm=100
Percentpassing0.075mm=90
Percentpassing0.002mm=11
GRAVEL: 100–100= 0%
SAND: 100–84= 16%
SILT: 84–11= 73%
CLAY: 11–0= 11%
GRAVEL: 100–100= 0%
SAND: 100–80= 20%
SILT: 80–11= 69%
CLAY: 11–0= 11%
GRAVEL: 100–100= 0%
SAND: 100–90= 10%
SILT: 90–11= 79%
CLAY: 11–0= 11%
a. Thegrain-sizedistributioncurveisshowninthefigure.
b. Percentpassing2mm=100
Percentpassing0.06mm=73
Percentpassing0.002mm=9
c. Percentpassing2mm=100
Percentpassing0.05mm=68
Percentpassing0.002mm=9
d. Percentpassing2mm=100
Percentpassing0.075mm=80
Percentpassing0.002mm=9
(mm)
GRAVEL: 100–100= 0%
SAND: 100–73= 27%
SILT: 73–9= 64%
CLAY: 9–0= 9%
GRAVEL: 100–100= 0%
SAND: 100–68= 32%
SILT: 68–9= 59%
CLAY: 9–0= 9%
GRAVEL: 100–100= 0%
SAND: 100–80= 20%
SILT: 80–9= 71%
CLAY: 9–0= 9%
2.10
a. Thegrain-sizedistributioncurveisshowninthefigure.
b. Percentpassing2mm=100
Percentpassing0.06mm=30
Percentpassing0.002mm=5
c. Percentpassing2mm=100
Percentpassing0.05mm=28
Percentpassing0.002mm=5
d. Percentpassing2mm=100
Percentpassing0.075mm=34
Percentpassing0.002mm=5
GRAVEL: 100–100= 0%
SAND: 100–30= 70%
SILT: 30–5= 25%
CLAY: 5–0= 5%
GRAVEL: 100–100= 0%
SAND: 100–28= 72%
SILT: 28–5= 23%
CLAY: 5–0= 5%
CLAY: 5–0= 5% Grain size (mm)
GRAVEL: 100–100= 0%
SAND: 100–34= 66%
SILT: 34–5= 29%
2.11
a. Thegrain-sizedistributioncurveisshowninthefigure.
b. Percentpassing2mm=100
Percentpassing0.06mm=65
Percentpassing0.002mm=35
c. Percentpassing2mm=100
Percentpassing0.05mm=62
Percentpassing0.002mm=35
d. Percentpassing2mm=100
Percentpassing0.075mm=70
Percentpassing0.002mm=35
Grain size (mm)
GRAVEL: 100–100= 0%
SAND: 100–65= 35%
SILT: 65–35= 30%
CLAY: 35–0= 35%
GRAVEL: 100–100= 0%
SAND: 100–62= 38%
SILT: 62–35= 27%
CLAY: 35–0= 35%
GRAVEL: 100–100= 0%
SAND: 100–70= 30%
SILT: 70–35= 35%
CLAY: 35–0= 35%
2.12
a. Thegrain-sizedistributioncurveisshowninthefigure.
b. Percentpassing2mm=100
GRAVEL: 100–100= 0%
Percentpassing0.06mm=96 SAND: 100–96= 4%
Percentpassing0.002mm=42 SILT: 96–42= 54% CLAY: 42–0= 42%
c. Percentpassing2mm=100
GRAVEL: 100–100= 0%
Percentpassing0.05mm=95 SAND: 100–95= 5%
Percentpassing0.002mm=42
d. Percentpassing2mm=100
SILT: 95–42= 53%
CLAY: 42–0= 42%
GRAVEL: 100–100= 0%
Percentpassing0.075mm=97 SAND: 100–97= 3%
Percentpassing0.002mm=42 SILT: 97–42= 55%
CLAY: 42–0= 42%
2.13
a. Thegrain-sizedistributioncurveisshownbelow.
b. Percentpassing2mm=100
GRAVEL: 100–100= 0%
Percentpassing0.06mm=84 SAND: 100–84= 16%
Percentpassing0.002mm=28 SILT: 84–28= 56%
c. Percentpassing2mm=100
28–0= 28%
GRAVEL: 100–100= 0%
Percentpassing0.05mm=83 SAND: 100–83= 17%
Percentpassing0.002mm=28 SILT: 83–28= 55%
d. Percentpassing2mm=100
Eq.(2.6): (min) (cm) (mm) t L K D = Grain size (mm)
CLAY: 28–0= 28%
GRAVEL: 100–100= 0%
Percentpassing0.075mm=90 SAND: 100–90= 10%
Percentpassing0.002mm=28 SILT: 90–28= 62%
CLAY: 28–0= 28%
2.14 Gs =2.65;temperature=26°;time=45min.; L =10.4cm.
FromTable2.9for Gs =2.65andtemperature=26° , K =0.01272 0.006mm 45 10.4 01272 = = D
2.15 Gs =2.75;temperature=21°C;time=88min.; L =11.7cm
Eq.(2.6): (min) (cm) (mm) t L K D =
FromTable2.6for Gs =2.75andtemperature=21° , K =0.01309 0.0047mm 88 11.7 01309 = = D
CRITICALTHINKINGPROBLEMS
b. Soil A iscoarserthanSoil C.Ahigherpercentageofsoil C isfinerthanany givensizecomparedtoSoil A.Forexample,about15%isfinerthan1mmfor Soil A,whereasalmost30%isfinerthan1mmincaseofSoil C.
c. Particlesegregationmaytakeplaceinaggregatestockpilessuchthatthereisa separationofcoarserandfinerparticles.Thismakesrepresentativesampling difficult.Therefore,Soils A, B,and C demonstratequitedifferentparticlesize distribution.
d. Soil A
Percentpassing4.75mm=29
Percentpassing0.075mm=1
Soil B
Percentpassing4.75mm=45
Percentpassing0.075mm=2
Soil C
Percentpassing4.75mm=53
GRAVEL: 100−29= 71%
SAND: 29−1= 28%
FINES: 1−0= 1%
GRAVEL: 100–45= 55%
SAND: 45−2= 43%
FINES: 2−0= 2%
GRAVEL: 100–53= 47%
Percentpassing0.075mm=3 SAND: 53−3= 50%
FINES: 3−0= 3%
2.C.2 a. Totalmassintheternarymix=8000 × 3=24,000kg
Percentofeachsoilinthemix=
Massofeachsoilusedinthesieveanalysis,
Ifasieveanalysisisconductedontheternarymixusingthesamesetof sieves,thepercentofmassretainedoneachsieve, mM (%),canbecomputed asfollows:
Thecalculatedvaluesareshowninthefollowingtable.
b. Thegrain-sizedistributioncurveforthemixtureisdrawnbelow.
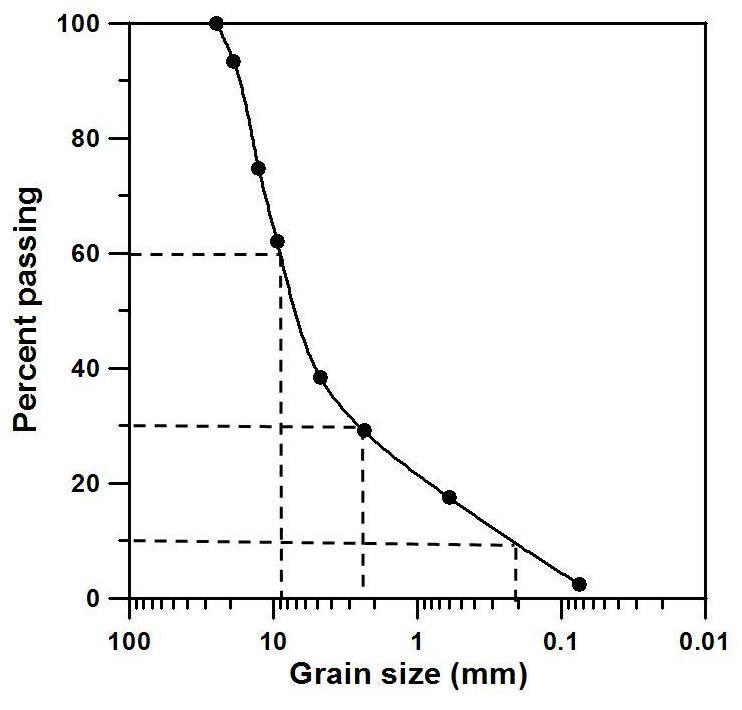
Grain size (mm)
Fromthecurve, D10 =0.21; D30 =2.5; D60 =9.0