Chapter 2
Linear Equations, Graphs, and Functions
2.1 Linear Equations in Two Variables
Classroom Examples, Now Try Exercises
1. To complete the ordered pairs, substitute the given value of x or y in the equation.
For (0, ____), let 0. x = 3412
3(0)412 412 3 xy y y y
The ordered pair is (0,3).
For (____, 0) let 0. y = 3412
34(0)12 312 4 xy x x x −= −= = = The ordered pair is (4, 0).
For (____,2), let 2. y =− 3412
34(2)12 3812 34 4 3 xy x x x x −= −−= += = =
The ordered pair is 4 ,2. 3 ⎛⎞ ⎜⎟ ⎝⎠
For (6,____), let 6. x =− 3412
3(6)412 18412 430 3015 42 xy y y y y
The ordered pair is 15 6,. 2 ⎛⎞ ⎜⎟ ⎝⎠
The completed table follows.
N1. To complete the ordered pairs, substitute the given value of x or y in the equation. For (0, ____), let 0. x = 24
2(0)4 4 4 xy y y y
The ordered pair is (0,4).
For (____, 0) let 0. y = 24 204 24 2 xy x x x
The ordered pair is (2, 0). For (4, ____), let 4. x = 24
2(4)4 84 4 4 xy y y y y −=
The ordered pair is (4, 4).
For (____, 2), let 2. y = 24 224 26 3 xy x x x
The ordered pair is (3, 2).
completed table follows.
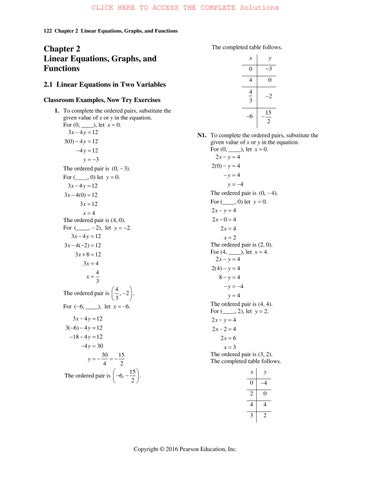
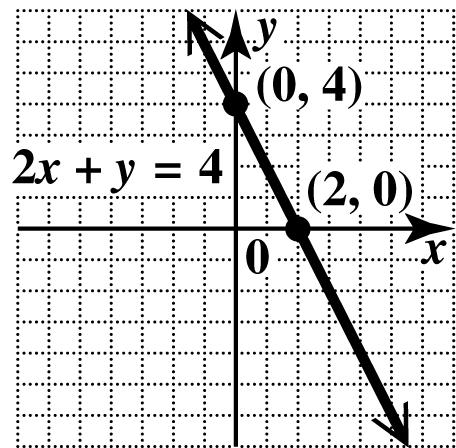
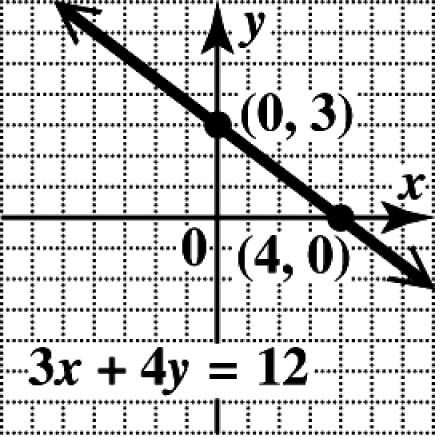
2. To find the x -intercept, let 0. y = 24 204 24 2 xy x x x −= −= = =
The x-intercept is (2, 0).
To find the y -intercept, let 0. x = 24 2(0)4 4 4 xy y y y −=
The y-intercept is (0,4).
Plot the intercepts, and draw the line through them.
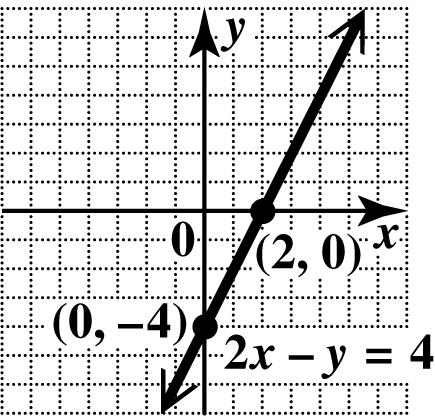
N2. To find the x -intercept, let 0. y = 24 2(0)4 4 xy x x −= −= = The x-intercept is (4, 0).
To find the y -intercept, let 0. x = 24 024 24 2 xy y y y −= −= −= =−
The y-intercept is (0,2).
Plot the intercepts, and draw the line through them.
3. To find the x -intercept, let 0. y = 300 30 0 x x x −= = =
Since the x-intercept is (0, 0), the y-intercept is also (0, 0).
Find another point. Let 1. x = 3(1)0 30 3 y y y −= −= =
This gives the ordered pair (1, 3). Plot (1, 3) and (0, 0) and draw the line through them.
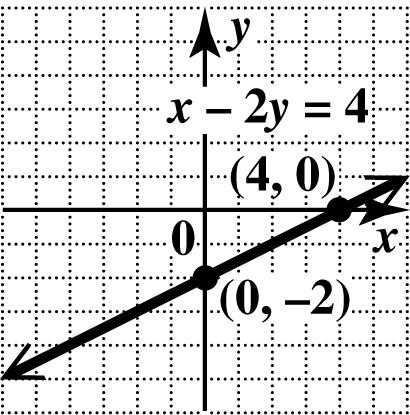
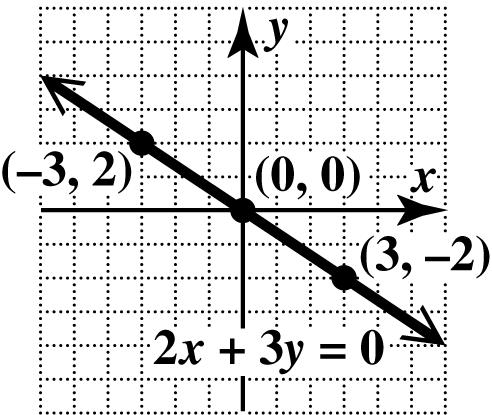
N3. To find the x -intercept, let 0. y = 23(0)0 20 0 x x x += = = Since the x-intercept is (0, 0), the y-intercept is also (0, 0).
Find another point. Let 3. x = 2(3)30 630 36 2 y y y y += += =− =−
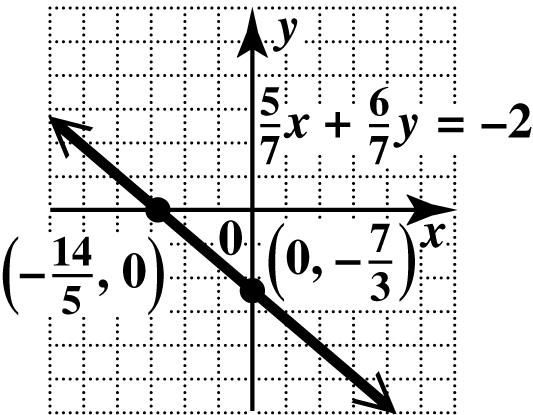
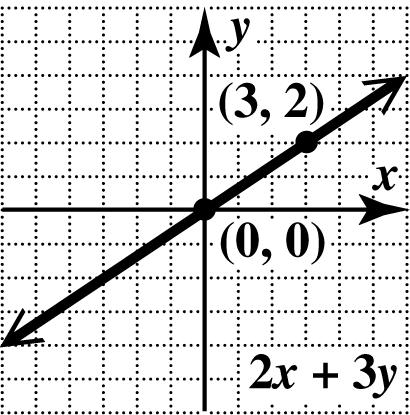
This gives the ordered pair (3,2). Plot (3,2) and (0, 0) and draw the line through them.
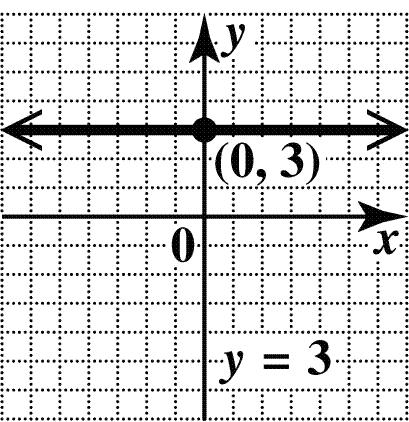
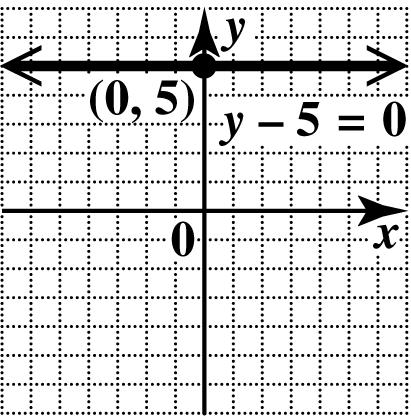
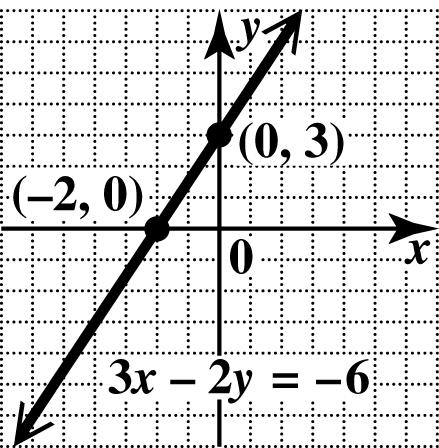
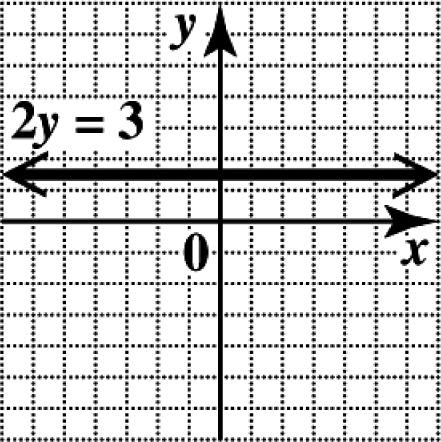
4. (a) In standard form, the equation is 03. xy+= Every value of x leads to 3, y = so the y-intercept is (0, 3). There is no x-intercept. The graph is the horizontal line through (0, 3).
Copyright © 2016 Pearson Education, Inc.
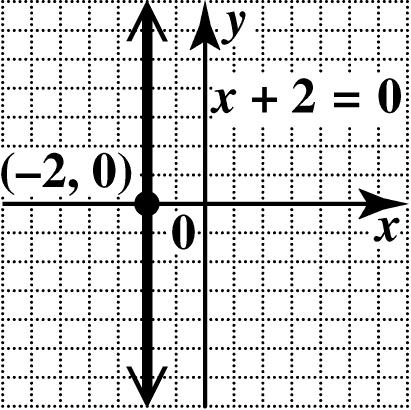
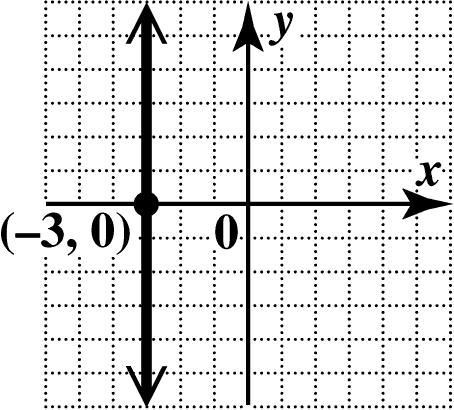
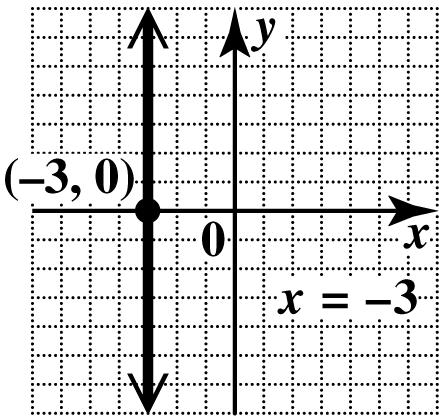
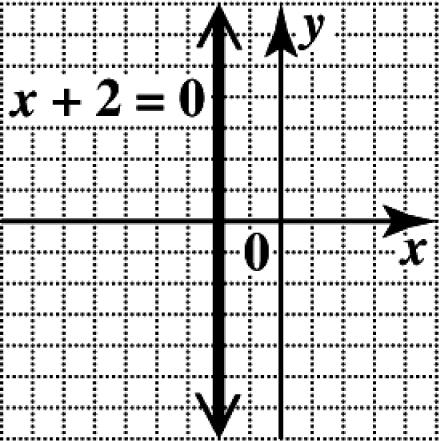
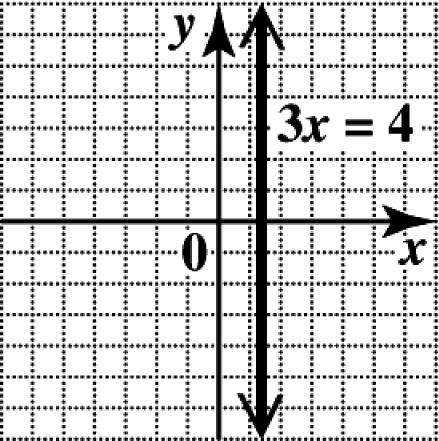
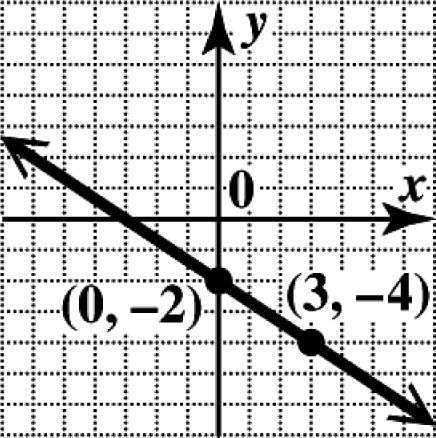
(b) In standard form, the equation is 02.xy+=− Every value of y leads to 2, x =− so the x-intercept is (2,0). There is no y-intercept. The graph is the vertical line through (2,0).
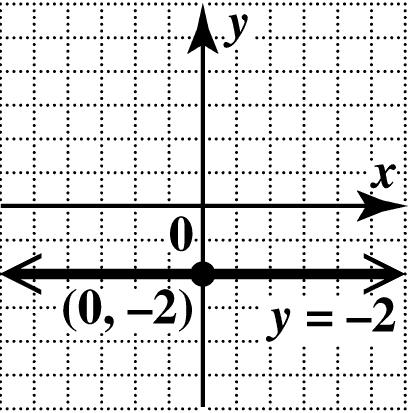
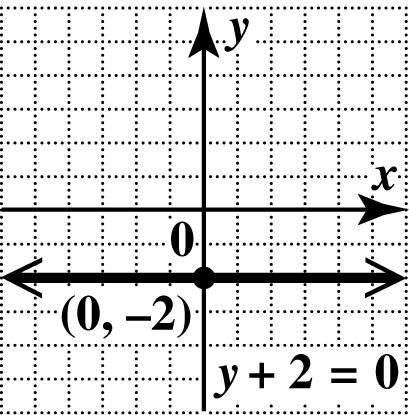
N4. (a) In standard form, the equation is 02. xy+=− Every value of x leads to 2, y =− so the y-intercept is (0,2). There is no x-intercept. The graph is the horizontal line through (0,2).
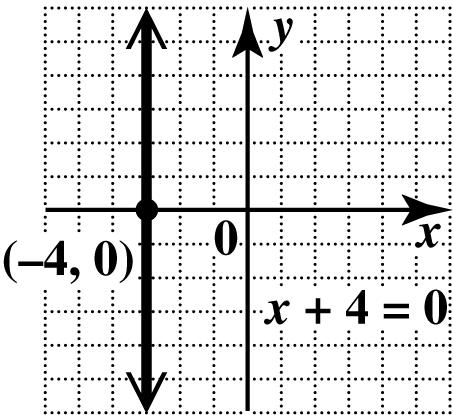
(b) In standard form, the equation is 03.xy+=− Every value of y leads to 3, x =− so the x-intercept is (3,0). There is no y-intercept. The graph is the vertical line through (3,0).
5. By the midpoint formula, the midpoint of the segment with endpoints (5,8) and (2, 4) is 5284312 ,,(1.5,6). 2222 −++−
N5. By the midpoint formula, the midpoint of the segment with endpoints (2,5) and (4,7) is 2(4)5722,,(1,1). 2222 +−−+−
Exercises
1. The point with coordinates (0, 0) is the origin of a rectangular coordinate system.
2. For any value of x, the point ( x, 0) lies on the x-axis. For any value of y, the point (0, y) lies on the y -axis.
3. The x-intercept is the point where a line crosses the x-axis. To find the x-intercept of a line, we let y equal 0 and solve for x The y-intercept is the point where a line crosses the y-axis. To find the y-intercept of a line, we let x equal 0 and solve for y.
4. The equation y = 4 has a horizontal line as its graph. The equation x = 4 has a vertical line as its graph.
5. To graph a straight line, we must find a minimum of two points. The points () 3,2 and () 6,4 lie on the graph of 230. xy−=
6. The equation of the x -axis is 0. y = The equation of the y -axis is 0. x =
7. (a) x represents the year; y represents the personal spending on medical care in billions of dollars.
(b) The dot above the year 2012 appears to be at about 2360, so the spending in 2012 was about $2360 billion.
(c) The ordered pair is ()() ,2012,2360.xy =
(d) In 2008, personal spending on medical care was about $2000 billion.
8. (a) x represents the year; y represents the percentage of Americans who moved.
(b) The dot above the year 2013 appears to be at about 11, so about 11% of Americans moved in 2013.
(c) The ordered pair is ()() ,2013,11.xy =
(d) In 1960, the percentage of Americans who moved was about 20%.
9. (a) The point (1, 6) is located in quadrant I, since the x- and y-coordinates are both positive.
(b) The point (4,2) is located in quadrant III, since the x- and y-coordinates are both negative.
(c) The point (3,6) is located in quadrant II, since the x-coordinate is negative and the y-coordinate is positive.
Copyright © 2016 Pearson Education, Inc.
(d) The point (7,5) is located in quadrant IV, since the x-coordinate is positive and the y-coordinate is negative.
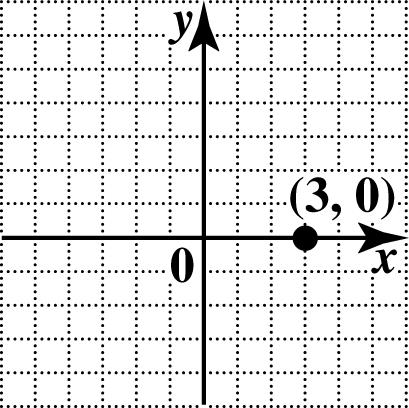
(e) The point (3,0) is located on the x-axis, so it does not belong to any quadrant.
(f) The point (0,0.5) is located on the y-axis, so it does not belong to any quadrant.
10. (a) The point (2,10) is located in quadrant III, since the x- and y-coordinates are both negative.
(b) The point (4, 8) is located in quadrant I, since the x- and y-coordinates are both positive.
(c) The point (9,12) is located in quadrant II, since the x-coordinate is negative and the y-coordinate is positive.
(d) The point (3,9) is located in quadrant IV, since the x-coordinate is positive and the y-coordinate is negative.
(e) The point (0,8) is located on the y-axis, so it does not belong to any quadrant.
(f) The point (2.3, 0) is located on the x-axis, so it does not belong to any quadrant.
11. (a) If 0, xy > then both x and y have the same sign.
(x, y) is in quadrant I if x and y are positive.
(x, y) is in quadrant III if x and y are negative.
(b) If 0, xy < then x and y have different signs.
(x, y) is in quadrant II if 0 x < and 0. y >
(x, y) is in quadrant IV if0 x > and 0. y <
(c) If 0, x y < then x and y have different signs.
(x, y) is in either quadrant II or quadrant IV.
(See part (b).)
(d) If 0, x y > then x and y have the same sign.
(x, y) is in either quadrant I or quadrant III.
(See part (a).)
12. Any point that lies on an axis must have one coordinate that is 0.
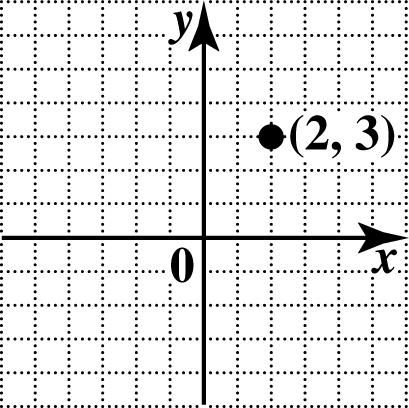
13. To plot ()2,3, go 2 units from zero to the right along the x-axis, and then go 3 units up parallel to the y-axis.
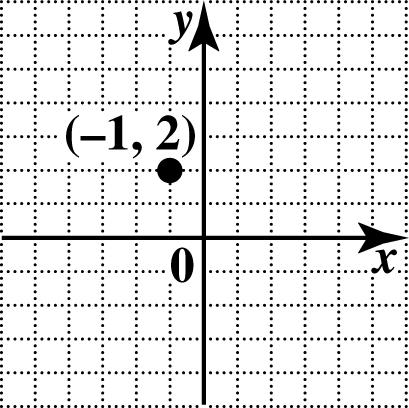
14. To plot (1,2), go 1 unit in the negative direction—that is, left—on the x-axis and then 2 units up.
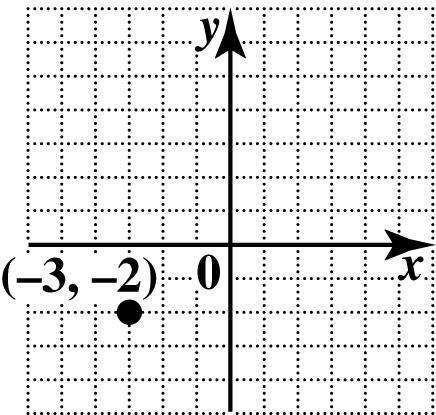
15. To plot (3,2), go 3 units from zero to the left along the x-axis, and then go 2 units down parallel to the y-axis.
16. To plot (1,4), go 1 unit right on the x-axis and then 4 units down.
17. To plot ()0,5, do not move along the x-axis at all since the x-coordinate is 0. Move 5 units up along the y-axis.
Copyright © 2016 Pearson Education, Inc.
18. To plot (2,4), go 2 units left on the x-axis and then 4 units down.
19. To plot (2,4), go 2 units from zero to the left along the x-axis, and then go 4 units up parallel to the y-axis.
20. To plot ()3,0, go 3 units right on the x-axis and then stop since the y-coordinate is 0.
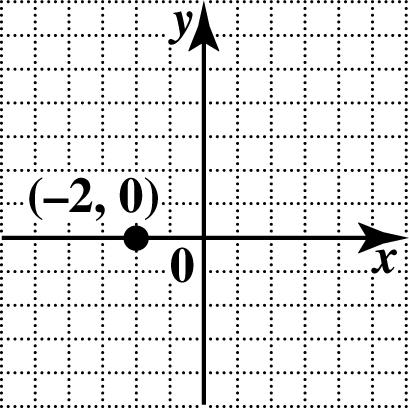
21. To plot (2,0), go 2 units to the left along the x-axis. Do not move up or down since the y-coordinate is 0.
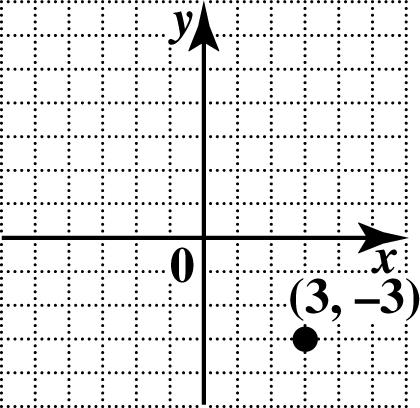
22. To plot (3,3), go 3 units right on the x-axis and then 3 units down.
23. (a) To complete the table, substitute the given values for x and y in the equation.
For0:4 04 4(0,4) xyx y y ==− =− =−−
For1:4 14 3(1,3) xyx y y ==− =− =−−
For2:4 24 2(2,2) xyx y y ==− =− =−−
For3:4 34 1(3,1) xyx y y ==− =− =−−
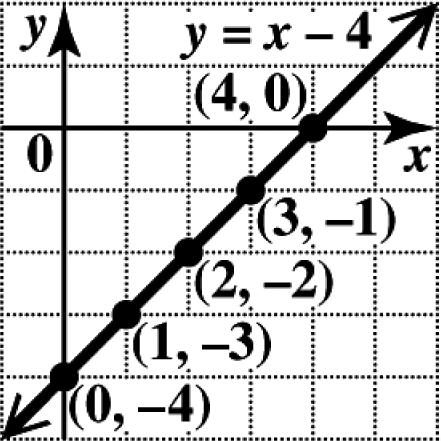
For4:4 44 0(4,0) xyx y y ==− =− = This is shown in the table below. xy 0 4 1 3 2 2 3 1 4 0
(b) Plot the ordered pairs and draw the line through them.
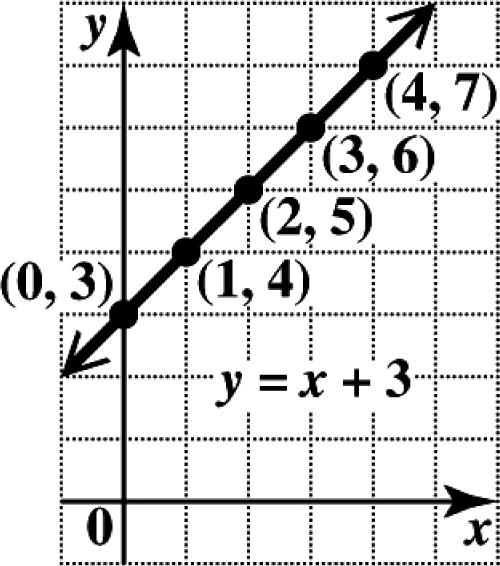
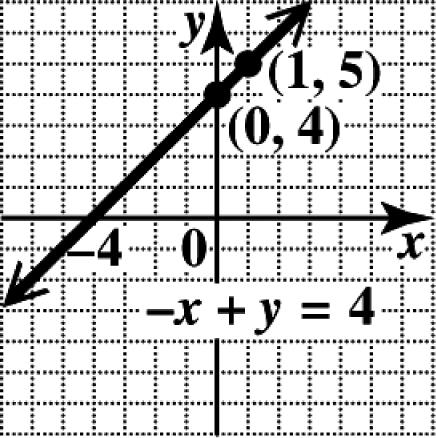
24. (a) To complete the table, substitute the given values for x and y in the equation.
For0:3 03 3(0,3) xyx y y ==+ =+ =
For1:3 13 4(1,4) xyx y y ==+ =+ =
For2:3 23 5(2,5) xyx y y ==+ =+ =
For3:3 33 6(3,6) xyx y y ==+ =+ =
© 2016 Pearson Education,
For4:3 43 7(4,7) xyx y y ==+ =+ =
This is shown in the table below. xy 0 3 1 4 2 5 3 6 4 7
(b) Plot the ordered pairs and draw the line through them.
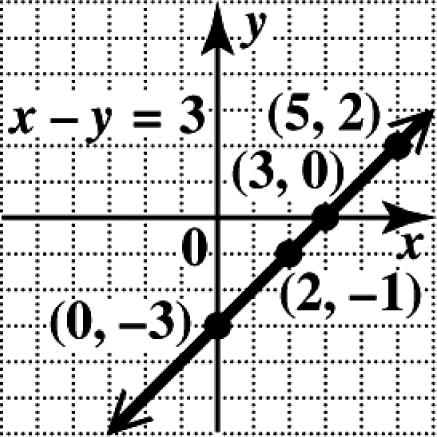
25. (a) To complete the table, substitute the given values for x and y in the equation.
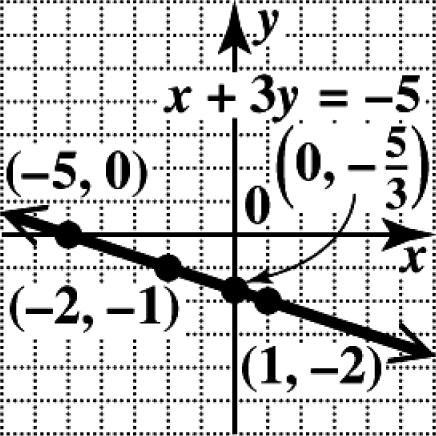
For0:3 03 3(0,3) xxy y y =−= −= =−−
For0:3 03 3(3,0) yxy x x =−= −= =
For5:3 53 2 2(5,2) xxy y y y =−= −= −=− =
For2:3 23 1 1(2,1) xxy y y y =−= −= −= =−− xy 0 3 3 0 5 2 2 1
2.1 Linear Equations in Two Variables
(b) Plot the ordered pairs and draw the line through them.
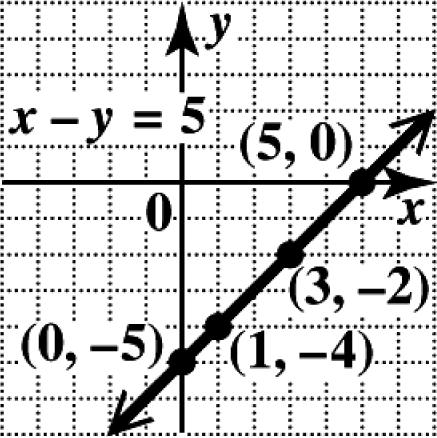
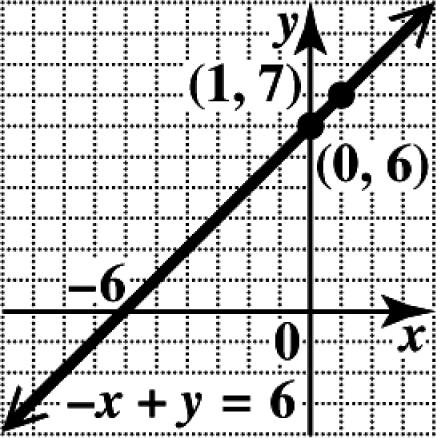
26. (a) For0:05 5 5(0,5) xy y y =−= −= =−−
For0:05 5(5,0) yx x =−= =
For1:15 4 4(1,4) xy y y =−= −= =−−
For3:35 2 2(3,2) xy y y =−= −= =−− xy 0 5 5 0 1 4 3 2
(b) Plot the ordered pairs and draw the line through them.
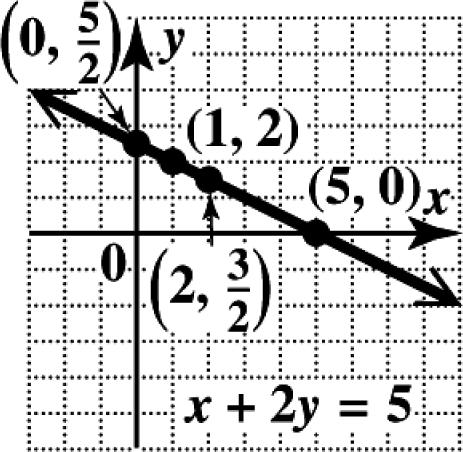
27. (a) To complete the table, substitute the given values for x or y in the equation.
For0:25 025 25 55 0, 22 xxy y y y =+= += = ⎛⎞ = ⎜⎟ ⎝⎠
For0:25 2(0)5 05 5(5,0) yxy x x x =+= += += =
Copyright © 2016 Pearson Education, Inc.
For2:25 225 23 33 2, 22 xxy y y y =+= += = ⎛⎞ = ⎜⎟ ⎝⎠
For2:25 2(2)5 45 1(1,2) yxy x x x =+= += += = xy
(b) Plot the ordered pairs and draw the line through them.
28. (a) For0:035 35 55 0, 33 xy y y =+=− =− ⎛⎞ =−−⎜⎟ ⎝⎠
For0:3(0)5 5(5,0) yx x =+=− =−−
For1:135 36 2(1,2) xy y y =+=− =− =−−
For1:3(1)5 35 2(2,1) yx x x =−+−=−
Chapter 2 Linear Equations, Graphs, and Functions Copyright © 2016 Pearson Education, Inc.
(b) Plot the ordered pairs and draw the line through them.
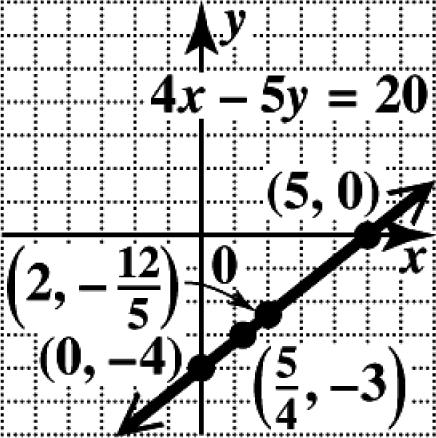
29. (a) For0:4520 4(0)520 520 4(0,4) xxy y y y =−= −= −= =−−
For0:4520 45(0)20 420 5(5,0) yxy x x x =−= −= = =
For2:4520 4(2)520 8520 512 1212 2, 55 xxy y y y y =−=
For3:4520 45(3)20 41520 45 55 ,3 44 yxy x x x x =−−= −−= += = ⎛⎞ =−⎜⎟ ⎝⎠ xy 0 4 5 0 2 12 5 5 4 3
(b) Plot the ordered pairs and draw the line through them.
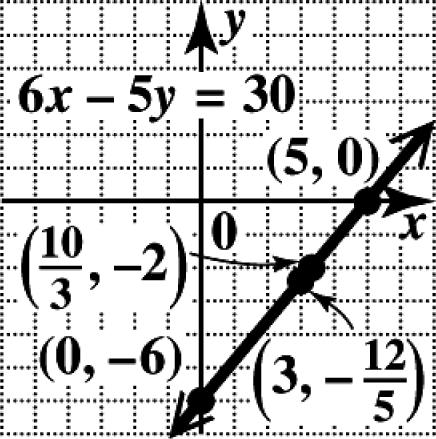
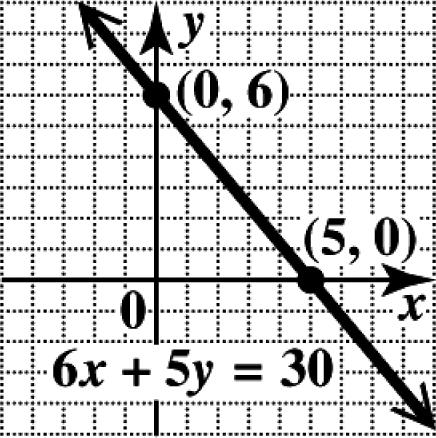
30. (a) For0:6(0)530 530 6(0,6) xy y y =−= −= =−−
For0:65(0)30 630 5(5,0) yx x x =−= = =
For3:6(3)530 18530 512 1212 3, 55 xy y y y =−= −= −=
For2: 65(2)30 61030 620 201010 ,2 633 y x x x x =− −−= += =
xy 0 6 5 0 3 12 5 10 3 2
(b) Plot the ordered pairs and draw the line through them.
2.1 Linear Equations in Two Variables
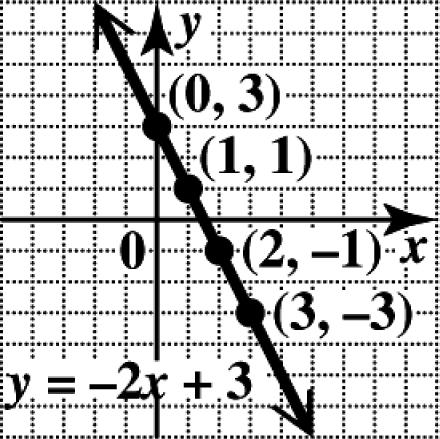
31. (a) () For0:2(0)3 30,3 xy y ==−+ = ()
For1:2(1)3 11,1 xy y ==−+ = ()
For2:2(2)3 12,1 xy y ==−+ =−− ()
For3:2(3)3 33,3 xy y ==−+ =−− xy 0 3 1 1 2 1 3 3
(b) Notice that as the value of x increases by 1, the value of y decreases by 2.
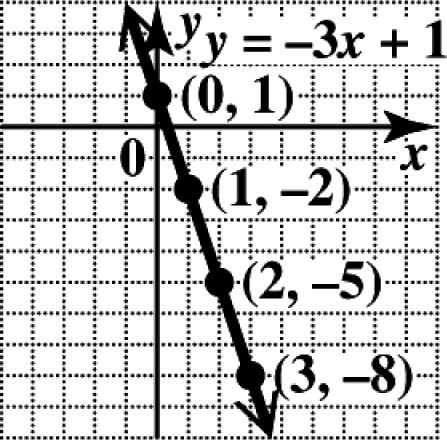
32. (a) () For0:3(0)1 10,1 xy y ==−+ = ()
For1:3(1)1 21,2 xy y ==−+ =−− ()
For2:3(2)1 52,5 xy y ==−+ =−− ()
For3:3(3)1 83,8 xy y ==−+ =−− xy 0 1 1 2 2 5 3 8
(b) Notice that as the value of x increases by 1, the value of y decreases by 3.
Copyright © 2016 Pearson Education, Inc.
33. (a) The y-values corresponding to the x-values for Exercise 23 are 4,3,2, and 1. The difference between each is 1 unit. Therefore, for every increase in x by 1 unit, y increases by 1 unit.
(b) The y-values corresponding to the x-values for Exercise 31 are 3,1,1, and 3. The difference between each is 2 units, and the values are decreasing. Therefore, for every increase in x by 1 unit, y decreases by 2 units.
(c) It appears that the y-value increases (or decreases) by the value of the coefficient of x. So for 24,yx=+ a conjecture is “for every increase in x by 1 unit, y increases by 2 units.”
For0:2(0)4 40,4 xy y ==+ =
For1:2(1)4
For2:2(2)4
For3:2(3)4
The difference between each y -value is 2 units, and the values are increasing. Therefore, the conjecture is true.
34. The choices C and D are horizontal lines. The equation 30 y += can be rewritten as 3. y =−
Because y always equals 3, there is no corresponding value to 0 y = and so the graph has no x-intercept. Since the line never crosses the x-axis, it must be horizontal. Because y always equals 10, there is no corresponding value to 0 y = and so the graph has no x-intercept. Since the line never crosses the x-axis, it must also be horizontal.
The choices A and E are vertical lines. The equation 60 x −= can be rewritten as 6. x = Because x always equals 6, there is no corresponding value to 0 x = and so the graph
has no y-intercept. Since the line never crosses the y-axis, it must be vertical. The equation 15 x += can be rewritten as 4. x = Because x always equals 4, there is no corresponding value to 0 x = and so the graph has no y-intercept. Since the line never crosses the y-axis, it must also be vertical.
The equation 0 xy+= is neither horizontal nor vertical. Neither the x -coordinate nor the y-coordinate is a fixed value, and the line crosses both the x -axis and y-axis.
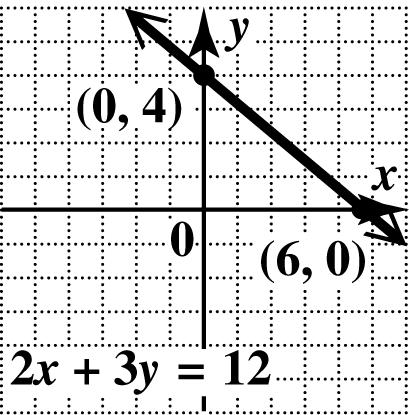
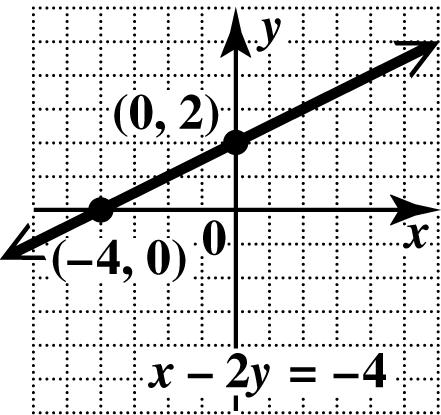
35. To find the x -intercept, let 0. y = 2312
23(0)12
212 6 xy x x x += += = =
The x-intercept is (6, 0).
To find the y -intercept, let 0. x = 2312
2(0)312
312 4 xy y y y += += = =
The y-intercept is (0, 4).
Plot the intercepts and draw the line through them.
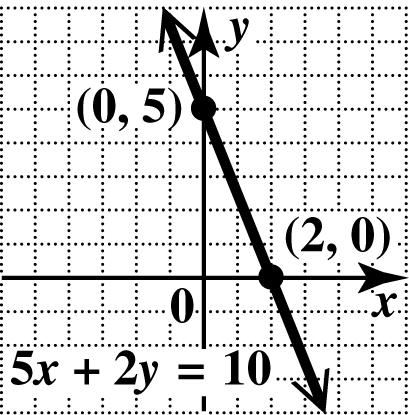
36. 5210 xy+=
To find the x -intercept, let 0. y =
52(0)10 510 2 x x x += = =
The x-intercept is (2, 0).
To find the y -intercept, let 0. x = 5(0)210
210 5 y y y += = =
The y-intercept is (0, 5).
Plot the intercepts and draw the line through them.
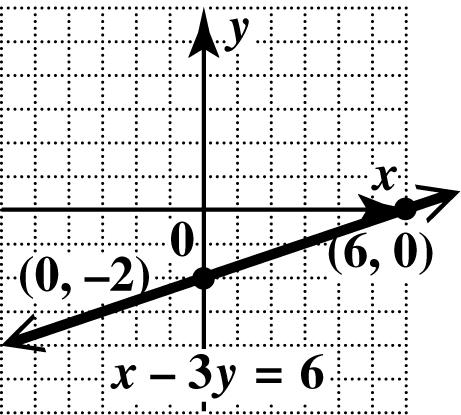
37. To find the x -intercept, let 0. y = 36 3(0)6 06 6 xy x x x −= −= −= = The x-intercept is (6, 0).
To find the y -intercept, let 0. x = 36 036 36 2 xy y y y −= −= −= =−
The y-intercept is (0,2).
Plot the intercepts and draw the line through them.
38. To find the x -intercept, let 0. y = 2(0)4 4 x x −=− =−
The x-intercept is (4,0).
To find the y -intercept, let 0. x = 024 24 2 y y y −=− −=− =
The y-intercept is (0, 2).
Plot the intercepts and draw the line through them.
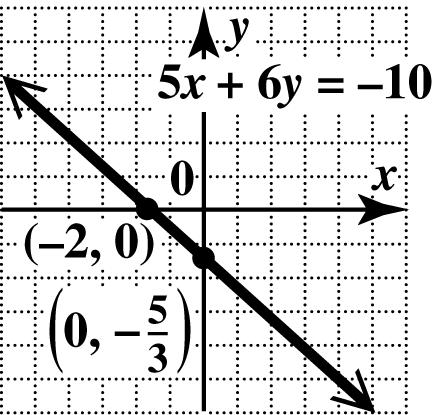
39. To find the x-intercept, let 0. y = 56(0)10 510 2 x x x +=− =− =−
The x-intercept is (2,0).
To find the y-intercept, let 0. x = 5(0)610 610 105 63 y y y +=− =− =−=−
The y-intercept is 5 0,. 3 ⎛⎞ ⎜⎟ ⎝⎠
Plot the intercepts and draw the line through them.
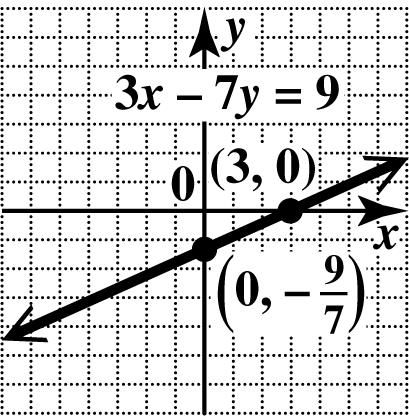
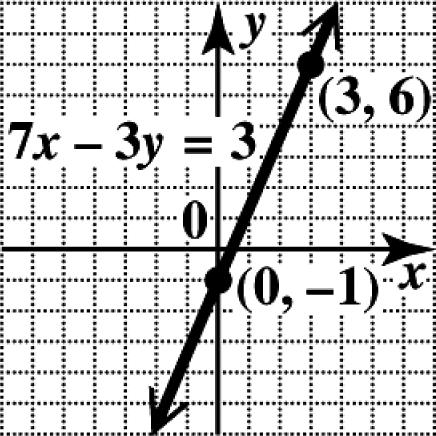
40. To find the x-intercept, let 0. y = 379 37(0)9 39 3 xy x x x −= −= = =
The x-intercept is (3, 0).
To find the y-intercept, let 0. x = 379 3(0)79 79 9 7 xy y y y −= −= −= =−
The y-intercept is 9 0,. 7 ⎛⎞ ⎜⎟ ⎝⎠
Plot the intercepts and draw the line through them.
Copyright © 2016 Pearson Education, Inc.
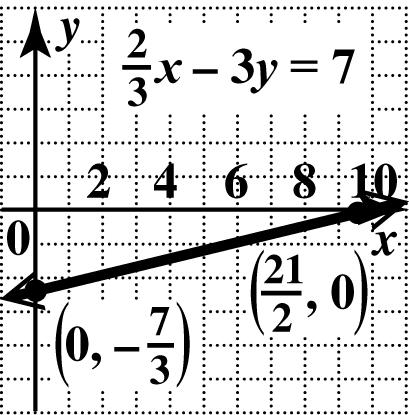
41. To find the x -intercept, let 0. y = 2 3(0)7 3 2 7 3 321 7 22 x x x −= = =⋅=
The x-intercept is 21 ,0. 2 ⎛⎞ ⎜⎟ ⎝⎠
To find the y -intercept, let 0. x = 2 (0)37 3 37 7 3 y y y −=
The y-intercept is 7 0,. 3 ⎛⎞ ⎜⎟ ⎝⎠
Plot the intercepts and draw the line through them.
42. To find the x -intercept, let 0. y = 56 (0)2 77 5 2 7 714 (2) 55 x x x +=− =− =−=−
The x-intercept is 14 ,0. 5 ⎛⎞ ⎜⎟ ⎝⎠
To find the y -intercept, let 0. x = 56 (0)2 77 6 2 7 77 (2) 63 y y y +=− =− =−=−
The y-intercept is 7 0,. 3 ⎛⎞ ⎜⎟ ⎝⎠
Plot the intercepts and draw the line through them.
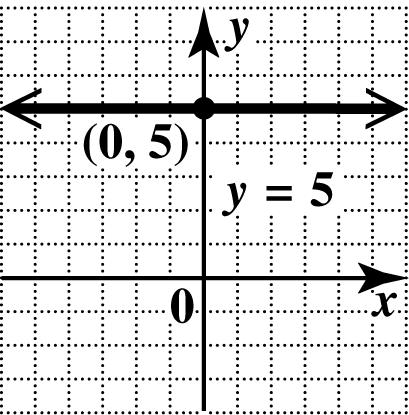
43. This is a horizontal line. Every point has y-coordinate 5, so no point has y-coordinate 0. There is no x-intercept. Since every point of the line has y-coordinate 5, the y-intercept is ()0,5. Draw the horizontal line through ()0,5.
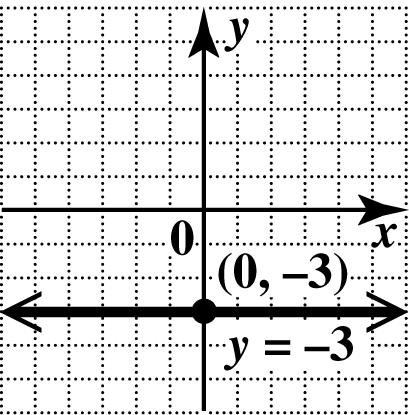
44. This is a horizontal line. Every point has y-coordinate 3, so no point has y -coordinate 0. There is no x-intercept. Since every point of the line has y-coordinate 3, the y-intercept is (0,3). Draw the horizontal line through (0,3).
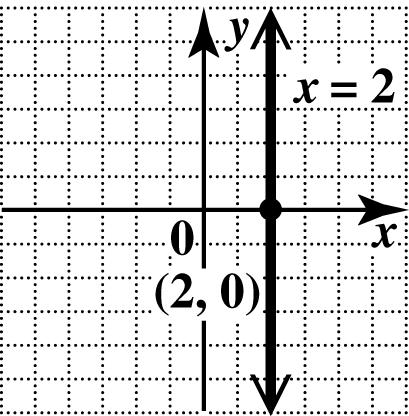
45. This is a vertical line. Every point has x-coordinate 2, so the x-intercept is ()2,0. Since every point of the line has x-coordinate 2, no point has x -coordinate 0. There is no y-intercept. Draw the vertical line through ()2,0.
46. This is a vertical line. Every point has x-coordinate 3, so the x-intercept is (3,0).
Since every point of the line has x-coordinate 3, no point has x -coordinate 0. There is no y-intercept. Draw the vertical line through (3,0).
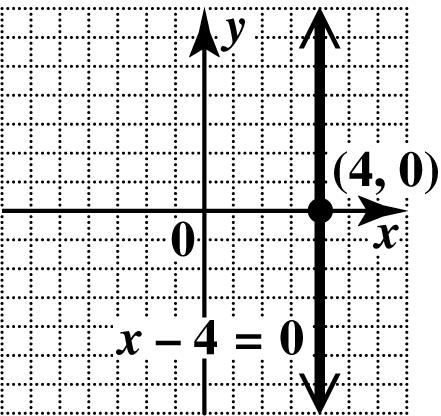
47. This is a vertical line. Every point has x-coordinate 4, so the x-intercept is (4,0). Since every point of the line has x-coordinate 4, no point has x -coordinate 0. There is no y-intercept. Draw the vertical line through (4,0).
48. This is a vertical line. Every point has x-coordinate 4, so the x-intercept is ()4,0.
Since every point of the line has x-coordinate 4, no point has x -coordinate 0. There is no y-intercept. Draw the vertical line through ()4,0.
49. This is a horizontal line. Every point has y-coordinate 2, so no point has y -coordinate 0. There is no x-intercept. Since every point of the line has y-coordinate 2, the y-intercept is (0,2). Draw the horizontal line through (0,2).
50. This is a horizontal line. Every point has y-coordinate 5, so no point has y-coordinate 0. There is no x-intercept.
Since every point of the line has y-coordinate 5, the y-intercept is ()0,5. Draw the horizontal line through ()0,5.
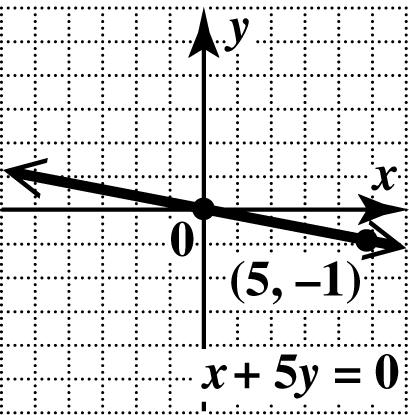
51. To find the x -intercept, let 0. y = 50 5(0)0 0 xy x x += += =
The x-intercept is (0, 0), and since 0, x = this is also the y-intercept. Since the intercepts are the same, another point is needed to graph the line. Choose any number for y, say 1, y =− and solve the equation for x 50 5(1)0 5 xy x x += +−= =
This gives the ordered pair (5,1). Plot (5,1) and ()0,0, and draw the line through them.
52. To find the x -intercept, let 0. y = 3(0)0 0 x x −= =
The x-intercept is (0, 0), and since 0, x = this is also the y-intercept. Since the intercepts are the same, another point is needed to graph the line. Choose any number for y, say 1, y = and solve the equation for x 3(1)0 3 x x −= =
This gives the ordered pair (3,1). Plot (3,1) and ()0,0,and draw the line through them.
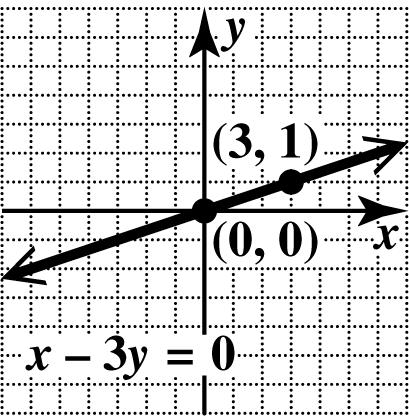
53. If 0, x = then 0, y = so the x - and y-intercepts are ()0,0. To get another point, let 3. x = 2(3)3
2 y y = =
Plot () 3,2 and ()0,0, and draw the line through them.
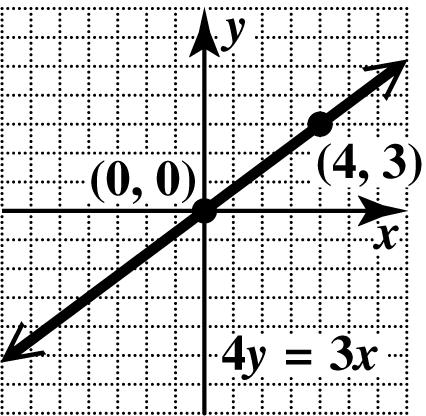
54. If 0, x = then 0, y = so the x - and y-intercepts are ()0,0. To get another point, let 4. x = 43(4) 3 y y = =
Plot () 4,3 and ()0,0, and draw the line through them.
55. If 0, x = then 0, y = so the x - and y-intercepts are ()0,0. To get another point, let 3. y =− 2 (3) 3
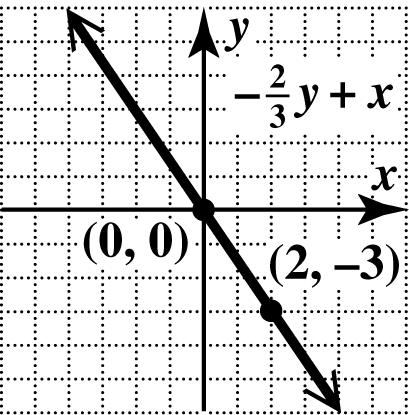
2 x x −−= = Plot (2,3) and ()0,0, and draw the line through them.
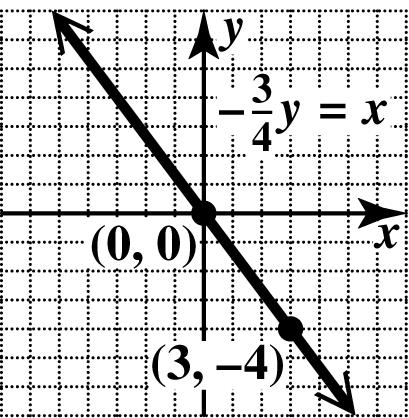
56. If 0, x = then 0, y = so the x - and y-intercepts are ()0,0. To get another point, let 4. y =−
3 (4) 4 3 x x −−= =
Plot () 3,4 and ()0,0, and draw the line through them.
57. (a) From the table, when 0,2,yx==− so the x-intercept is ()2,0. When 0,3,xy== so the y-intercept is ()0,3.
(b) Find the intercepts in each equation and compare them to the table to see which of the choices is correct.
Find the intercepts in equation A. ()
36 2 xy x x x += += = =
326 3206
326
3(0)26
26 3 xy y y y += += = =
The intercepts are () 2,0 and ()0,3. This is not the correct choice.
Find the intercepts in equation B.
326
32(0)6
36 2 xy x x x −=− −=− =− =−
326 3(0)26
26 3 xy y y y −=− −=− −=− =
The intercepts are () 2,0 and ()0,3.This is the correct choice. So equation B corresponds to the given table. (Note: Equations C and D would be tested similarly if the correct choice had not yet been found.)
(c) Plot the x-intercept and y-intercept. Draw the line through them.
58. (a) From the table, when 0,2,yx== so the x-intercept is ()2,0. When 0,4,xy== so the y-intercept is ()0,4.
(b) Find the intercepts in each equation and compare them to the table to see which of the choices is correct.
Find the intercepts in equation A. 24
2(0)4
2
4 4
The intercepts are () 2,0 and ()0,4. This is not the correct choice.
Find the intercepts in equation B. 24
2(0)4 24 2 xy x x x +=− +=− =− =− 24
2(0)4 4 xy y y +=− +=− =−
The intercepts are () 2,0 and ()0,4. This is not the correct choice.
Find the intercepts in equation C. 24
2(0)4 24 2 xy x x x += += = = 24 2(0)4 4 xy y y += += =
The intercepts are () 2,0 and ()0,4. This is not the correct choice.
So equation C corresponds to the given table.
(Note: Equation D would be tested similarly if the correct choice had not yet been found.)
(c) Plot the x-intercept and y-intercept. Draw the line through them.
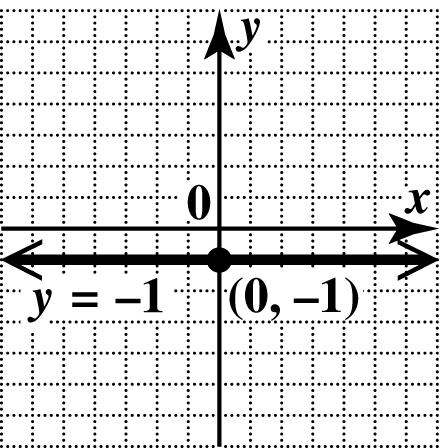
59. (a) From the table, when 0,1,xy==− so the y-intercept is ()0,1. Note that the y-coordinate of all the points is 1, so the equation is a horizontal line, with no x-intercept.
(b) The equation is a horizontal line through ()0,1. Since the y-coordinate is always 1, the equation is 1. y =−
So equation A corresponds to the given table.
(c) Plot the x-intercept and y-intercept. Draw the line through them.
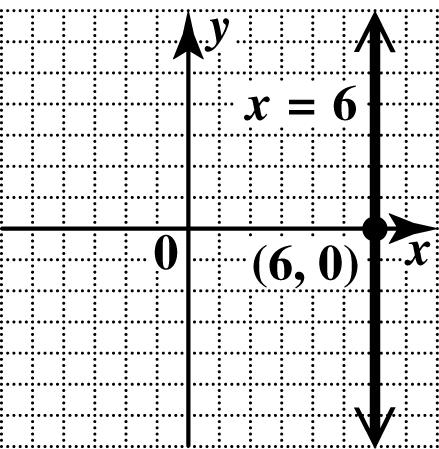
60. (a) From the table, when 0,6,yx== so the x-intercept is ()6,0. Note that the x-coordinate of all the points is 6, so the equation is a vertical line, with no y-intercept.
(b) The equation is a vertical line through ()6,0. Since the x-coordinate is always 6, the equation is 6. x =
So equation D corresponds to the given table.
Copyright © 2016 Pearson Education, Inc.
(c) Draw the line through the x -intercept.
61. Find the intercepts first since they are plotted on the graph. To find the x-intercept, let 0. y =
33 3(0)3 03 3 xy x x x += += += =
The x-intercept is ()3,0.
To find the y -intercept, let 0. x =
The y-intercept is (0,1).
Graph C has these intercepts.
62. Find the intercepts first since they are plotted on the graph. To find the x-intercept, let 0. y = 33 3(0)3 03 3 xy x x x −=−
The x-intercept is ()3,0.
To find the y -intercept, let 0. x = 33 033 33 1 xy y y y
The y-intercept is (0,1).
Graph D has these intercepts
63. Find the intercepts first since they are plotted on the graph. To find the x-intercept, let 0. y = 33 3(0)3 03 3 xy x x x −= −= −= =
The x-intercept is ()3,0.
To find the y -intercept, let 0. x = 33 033 33 1 xy y y y −= −= −= =−
The y-intercept is (0,1).
Graph B has these intercepts.
64. Find the intercepts first since they are plotted on the graph. To find the x-intercept, let 0. y = 33 3(0)3 03 3 xy x x x +=− +=− +=− =−
The x-intercept is ()3,0.
To find the y -intercept, let 0. x = 33 033 33 1 xy y y y +=− +=− =− =−
The y-intercept is (0,1).
Graph A has these intercepts.
65. By the midpoint formula, the midpoint of the segment with endpoints (8,4) and (2,6) is 8(2)4(6)102,,(5,1). 2222
⎝⎠⎝⎠
66. By the midpoint formula, the midpoint of the segment with endpoints (5, 2) and (1,8) is 5(1)28410,,(2,5). 2222 +−+ ⎛⎞⎛⎞ ==⎜⎟⎜⎟ ⎝⎠⎝⎠
67. By the midpoint formula, the midpoint of the segment with endpoints () 3,6 and (6, 3) is 36639393 ,,,. 222222 +−+− ⎛⎞⎛⎞⎛⎞ ==− ⎜⎟⎜⎟⎜⎟ ⎝⎠⎝⎠⎝⎠
68. By the midpoint formula, the midpoint of the segment with endpoints () 10,4 and (7, 1) is 107413535 ,,,. 222222 −++− ⎛⎞⎛⎞⎛⎞ ==− ⎜⎟⎜⎟⎜⎟ ⎝⎠⎝⎠⎝⎠
69. By the midpoint formula, the midpoint of the segment with endpoints () 9,3 and (9, 8) is 993801111 ,,0,. 22222 −++ ⎛⎞⎛⎞⎛⎞ == ⎜⎟⎜⎟⎜⎟ ⎝⎠⎝⎠⎝⎠
70. By the midpoint formula, the midpoint of the segment with endpoints () 4,3 and () 1,3 is ()41 33303 ,,,0. 22222 +−
71. By the midpoint formula, the midpoint of the segment with endpoints (2.5, 3.1) and () 1.7,1.3 is
72. By the midpoint formula, the midpoint of the segment with endpoints () 6.2,5.8 and () 1.4,0.6 is
73. By the midpoint formula, the midpoint of the segment with endpoints 11 , 23 ⎛⎞ ⎜⎟ ⎝⎠ and 35 , 23 ⎛⎞ ⎜⎟ ⎝⎠ is () 134156 22 222333,,,1,1. 222222
+ + ⎜⎟⎜⎟ ⎛⎞ ===⎜⎟⎜⎟ ⎜⎟ ⎝⎠ ⎜⎟⎜⎟ ⎜⎟⎜⎟ ⎝⎠⎝⎠
74. By the midpoint formula, the midpoint of the segment with endpoints 212 , 45 ⎛⎞ ⎜⎟ ⎝⎠ and 73 , 45 ⎛⎞ ⎜⎟ ⎝⎠ is 21728235 71 444555 ,,,. 222222
⎛⎞⎛⎞ + + ⎜⎟⎜⎟ ⎛⎞ ==⎜⎟⎜⎟ ⎜⎟ ⎝⎠ ⎜⎟⎜⎟ ⎜⎟⎜⎟ ⎝⎠⎝⎠
75. By the midpoint formula, the midpoint of the segment with endpoints 12 , 37 ⎛⎞ ⎜⎟ ⎝⎠ and 11 , 214 ⎛⎞ ⎜⎟ ⎝⎠ is 11 215 5 55 32 7146 14 ,,,. 22221228 ⎛⎞ ⎛⎞ ⎛⎞ −+− +− ⎜⎟ ⎜⎟ ⎜⎟ ⎛⎞ ⎝⎠ ⎜⎟ ==− ⎜⎟ ⎜⎟ ⎜⎟ ⎝⎠ ⎜⎟ ⎜⎟ ⎜⎟ ⎝⎠ ⎝⎠
76. By the midpoint formula, the midpoint of the segment with endpoints 31 , 53 ⎛⎞ ⎜⎟ ⎝⎠ and 17 , 22 ⎛⎞ ⎜⎟ ⎝⎠ is 17 311123 1123 32 52106 ,,,. 22222012 ⎛⎞ ⎛⎞ ⎛⎞ −+− +− ⎜⎟ ⎜⎟ ⎜⎟ ⎛⎞ ⎝⎠ ⎜⎟ ==− ⎜⎟ ⎜⎟ ⎜⎟ ⎝⎠ ⎜⎟ ⎜⎟ ⎜⎟ ⎝⎠
77. midpoint of P(5, 8) and ()(,)8,2QxyM = () 58 ,8,2 22 xy++ ⎛⎞ = ⎜⎟ ⎝⎠
The x- and y-coordinates must be equal. 58 82 22 51684 114 xy xy xy ++ == +=+= ==−
Thus, the endpoint Q is () 11,4.
78. midpoint of P(7, 10) and ()() ,5,3QxyM = 710 ,(5,3) 22 xy++ ⎛⎞ = ⎜⎟ ⎝⎠
The x- and y-coordinates must be equal.
710 53 22 710106 34 xy xy xy ++ == +=+= ==−
Thus, the endpoint Q is ()3,4.
79. midpoint of P(1.5, 1.25) and (),(3,1)QxyM = ()
1.51.25 ,3,1 22 xy++ ⎛⎞ = ⎜⎟ ⎝⎠
The x- and y-coordinates must be equal.
1.51.25 31 22
1.561.252
4.50.75 xy xy xy ++ == +=+= ==
Thus, the endpoint Q is (4.5, 0.75).
80. midpoint of P(2.5, 1.75) and ()() ,3,2QxyM = ()
2.51.75 ,3,2 22 xy++ ⎛⎞ = ⎜⎟ ⎝⎠
The x- and y-coordinates must be equal.
2.51.75 32 22
2.561.754
3.52.25 xy xy xy ++ == +=+= ==
Thus, the endpoint Q is (3.5, 2.25).
Copyright © 2016 Pearson Education, Inc.
2.2 The Slope of a Line
Classroom Examples, Now Try Exercises
1. If () () 1,1 6,9 xy =− and ()() 22,3,5,xy =− then 21 21 591414 3(6)99 yy m xx ====− The slope is 14 9
N1. If ()() 11,2,6xy =− and ()() 22,3,5,xy =− then () 21 21 56 1111 . 3255 yy m xx ====−
The slope is 11 5
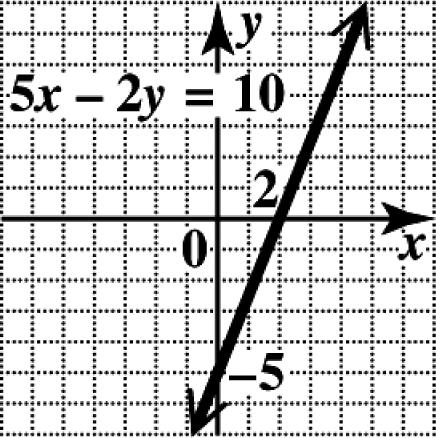
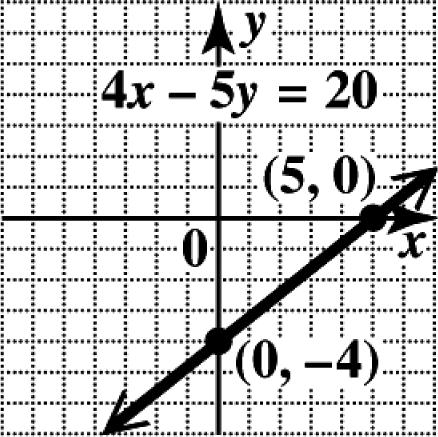
2. To find the slope of the line with equation 3412, xy−= first find the intercepts. The x-intercept is (4, 0), and the y-intercept is ()0,3. The slope is then 3033
0444 m ===
N2. To find the slope of the line with equation 3721, xy−= first find the intercepts. The x-intercept is (7, 0), and the y-intercept is ()0,3. The slope is then 3033
0777 m ===
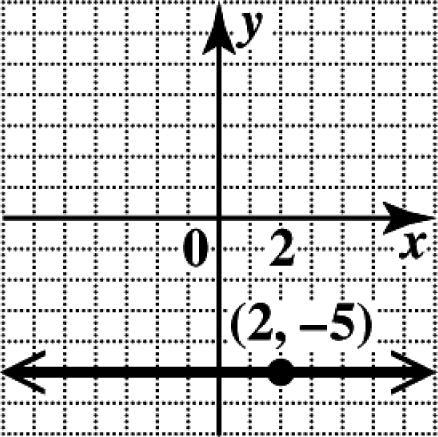
3. (a) To find the slope of the line with equation 30, y += select two different points on the line, such as () 0,3 and ()2,3, and use the slope formula.
()33 0 0 202 m ===
The slope is 0.
(b) To find the slope of the line with equation 6, x =− select two different points on the line, such as () 6,0 and ()6,3, and use the slope formula.
() 303 660 m ==
Since division by zero is undefined, the slope is undefined.
N3. (a) To find the slope of the line with equation 4, x = select two different points on the line, such as (4, 0) and (4, 3), and use the slope formula.
303 440 m ==
Since division by zero is undefined, the slope is undefined.
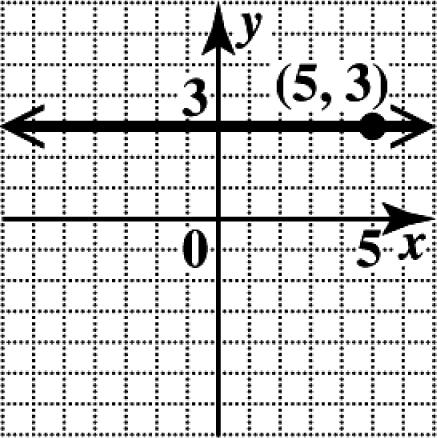
(b) To find the slope of the line with equation 60, y −= select two different points on the line, such as (0, 6) and (2, 6), and use the slope formula.
660 0
202 m ===
The slope is 0.
4. Solve the equation for y 349 439Subtract3. 39
Divideby4. 44 xy yxx yx += =−+ =−+
The slope is given by the coefficient of x, so the slope is 3 4
N4. Solve the equation for y 547 457Subtract5. 57
Divideby4. 44 xy yxx yx −= −=−+ =−−
The slope is given by the coefficient of x, so the slope is 5 4
5. Through ()3,2; 1 2 m =
Locate the point () 3,2 on the graph. Use the slope formula to find a second point on the line. changein1 changein2 y m x ==
From ()3,2, move up 1 unit and then 2 units to the right to ()1,1. Draw the line through the two points.
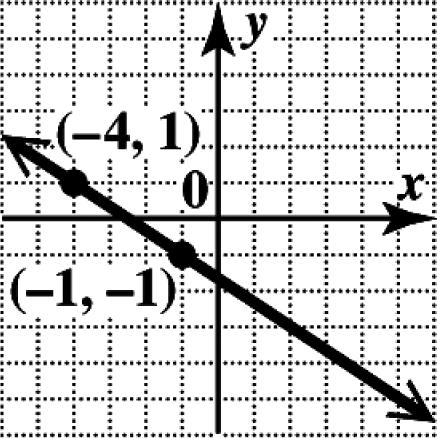
N5. Through ()4,1; 2 3 m =−
Locate the point () 4,1 on the graph. Use the slope formula to find a second point on the line. changein2 changein3 y m x ==
From ()4,1, move down 2 units and then 3 units to the right to ()1,1. Draw the line through the two points.
6. Find the slope of each line.
The line through () 1,2 and (3, 5) has slope
1 523 3(1)4 m ==
The line through (4, 7) and (8, 10) has slope
2 1073 844 m ==
The slopes are the same, so the lines are parallel.
N6. Find the slope of each line.
The line through (2, 5) and (4, 8) has slope
1 853 422 m ==
The line through (2, 0) and () 1,2 has slope
2 2022 . 1233 m ===
The slopes are not the same, so the lines are not parallel.
7. Solve each equation for y.
The slope is.The slope 53is.
Since 12 35 1, 53 mm ⎛⎞⎛⎞ =−=−
⎝⎠⎝⎠ the lines are perpendicular
N7. Solve each equation for y 2724 2724 17 24 22 1
The slope is.The slope is2. 2 xyxy yxyx yxyx mm +==− =−+−=−− =−+=+ =−=
Since () 12 1 21, 2 mm ⎛⎞ =−=− ⎜⎟ ⎝⎠ the lines are perpendicular.
8. Solve each equation for y 4248 4248 1 422 4 1
The slope is4.The slope is. 4 xyxy yxyx yxyx mm −=−=− −=−+−=−− =−=+ ==
Since 12 , mm ≠ the lines are not parallel. Since 12 1 41, 4 mm ⎛⎞ == ⎜⎟ ⎝⎠ the lines are not perpendicular either. Therefore, the answer is neither
N8. Solve each equation for y 2426 2426 24
The slope is2.The slope is2. xyxy yxyx yx mm −=+= −=−+=−+ =− ==−
Since 12 , mm ≠ the lines are not parallel. Since () 12 224, mm =−=− the lines are not perpendicular either. Therefore, the answer is neither
9. ()() 11,2010,45xy = and ()() 22,2012,47.xy = 21 21 averagerateofchange 4745 20122010 2 1 2 yy xx = = ==
The average rate of change is about 1 million customers per year. This is less than the average rate of change from 2007 to 2012, which is 2 million customers per year.
Copyright © 2016 Pearson Education, Inc.
N9. ()() 11,2008,40xy = and ()() 22,2012,47.xy =
The average rate of change is about 1.75 million customers per year. This is less than the average rate of change from 2007 to 2012, which is 2 million customers per year.
10. ()11,(2000,943)xy = and ()() 22,2011,241.xy =
Thus, the average rate of change from 2000 to 2011 was about 64 million CDs per year.
N10. ()() 11,2010,1150xy = and ()() 22,2013,137.xy =
Thus, the average rate of change in sales of digital camcorders in the United States from 2010 to 2013 was about $338 million per year.
Exercises
1. changeinverticalposition slope= changeinhorizontalposition 30feet 100feet =
Choices A, 0.3; B, 3 ; 10 D, 30 ; 100 and F, 30%, are all correct.
2. changeinverticalposition slope= changeinhorizontalposition 2feet 24feet = Choices B, 2 ; 24 C, 1 ; 12 and E, 8.3%, are all correct.
3. change in verticalposition slope= change in horizontalposition 15feet 3 change in horizontalposition 3change15 15 change5 3 = ×= ==
So the change in horizontal position is 5 feet.
4. changeinverticalposition slope= changeinhorizontalposition changeinverticalposition 0.05 50feet = So the change in vertical position is () 0.0550feet2.5feet. =
5. (a) Graph C indicates that sales leveled off during the second quarter.
(b) Graph A indicates that sales leveled off during the fourth quarter.
(c) Graph D indicates that sales rose sharply during the first quarter and then fell to the original level during the second quarter.
(d) Graph B is the only graph that indicates that sales fell during the first two quarters.
6. Answers will vary, but the graphs will all rise, level off, and then fall.
7. To get to B from A, we must go up 2 units and move right 1 unit. Thus, slope of rise2 2. run1 AB ===
8. slope of rise0 0 run4 BC ===
9. slope of rise7 , run0 CD == which is undefined.
10. slope of rise11 run33 DE ===−
11. slope of rise3 1 run3 EF ===
12. slope of rise4 4 run1 FG ===−
13. slope of rise3 1 run3 AF ===−
14. slope of rise77 run44 BD ===
15. (a) “The line has positive slope” means that the line goes up from left to right. This is line B.
(b) “The line has negative slope” means that the line goes down from left to right. This is line C.
(c) “The line has slope 0” means that there is no vertical change—that is, the line is horizontal. This is line A.
(d) “The line has undefined slope” means that there is no horizontal change—that is, the line is vertical. This is line D.
16. B and D are correct. Choice A is wrong because the order of subtraction must be the same in the numerator and denominator. Choice C is wrong because slope is defined as the change in y divided by the change in x
17. 624 2 532 m ===
18. 5721 4263 m ===
19. () () 41 415 35352 m + === −−−−+
20. () 606 2 033 m ===−
21. ()55 550 0 3211 m −+ ====
22. () () 22 220 0 43437 m −+ ==== −−+
23. () 3855 , 22220 m === −−−−+ which is undefined.
24. () 5611 , 88880 m === −−−−+ which is undefined.
25. (a) Let ()() 11,2,3xy =−− and ()() 22,1,5.xy =− Then () () 21 21 53 8 8. 121 yy m xx ====
The slope is 8.
(b) The slope is positive, so the line rises.
26. (a) Let ()() 11,4,1xy =− and ()() 22,3,4.xy =− Then () 21 21 413 3 341 yy m xx ====
The slope is 3.
(b) The slope is positive, so the line rises.
27. (a) Let ()() 11,4,1xy =− and ()() 22,2,6.xy =
Then () 21 21 615 . 246 yy m xx ===
The slope is 5 . 6
(b) The slope is positive, so the line rises.
28. (a) Let ()() 11,3,3xy =−− and ()() 22,5,6.xy = Then () () 21 21 63 9 538 yy m xx ===
The slope is 9 8
(b) The slope is positive, so the line rises.
29. (a) Let ()() 11,2,4xy = and ()() 22,4,4.xy =− Then 21 21 440 0. 426 yy m xx ====
The slope is 0.
(b) The slope is zero, so the line is horizontal.
Copyright © 2016 Pearson Education, Inc.
30. (a) Let ()() 11,6,3xy =− and ()() 22,2,3.xy =
Then () 21 21 330 0. 268 yy m xx ====
The slope is 0.
(b) The slope is zero, so the line is horizontal.
31. (a) Let ()() 11,2,2xy =− and ()() 22,4,1.xy =− Then () 21 21 1231 . 4262 yy m xx ====−
The slope is 1 . 2
(b) The slope is negative, so the line falls.
32. (a) Let ()() 11,3,1xy =− and ()() 22,6,2.xy =− Then () 21 21 2131 . 6393 yy m xx ====−
The slope is 1 . 3
(b) The slope is negative, so the line falls.
33. (a) Let ()() 11,5,3xy =− and ()() 22,5,2.xy =
Then () 21 21 23 5 . 550 yy m xx ===
The slope is undefined.
(b) The slope is undefined, so the line is vertical.
34. (a) Let ()() 11,4,1xy =− and ()() 22,4,3.xy = Then () 21 21 31 4 . 440 yy m xx ===
The slope is undefined.
(b) The slope is undefined, so the line is vertical.
35. (a) Let ()() 11,1.5,2.6xy = and ()() 22,0.5,3.6.xy = Then 21 21 3.62.61 1. 0.51.51 yy m xx ====−
The slope is 1.
(b) The slope is negative, so the line falls.
36. (a) Let ()() 11,3.4,4.2xy = and ()() 22,1.4,10.2.xy = Then 21 21 10.24.26 3. 1.43.42 yy m xx ====−
The slope is 3.
(b) The slope is negative, so the line falls.
37. Let () 11 11 ,,62xy ⎛⎞ = ⎜⎟ ⎝⎠ and () 22 59 ,,. 62 xy ⎛⎞ = ⎜⎟ ⎝⎠ Then 21 21 918 3 222 46. 514 2 666 yy m xx ====⋅=
The slope is 6.
38. Let () 11 31 ,,43xy ⎛⎞ = ⎜⎟ ⎝⎠ and () 22 510 ,,. 43 xy ⎛⎞ = ⎜⎟ ⎝⎠
Then 21 21 1019 333 326. 532 344 yy m xx ====⋅=
The slope is 6.
39. Let () 11 25 ,,918xy ⎛⎞ =−⎜⎟ ⎝⎠ and () 22 15 ,,. 189 xy ⎛⎞ =−⎜⎟ ⎝⎠ Then 21 21 5515 91818 5 12 18 189 1518 3. 185 yy m xx === ⎛⎞ ⎜⎟ ⎝⎠ =−⋅=−
The slope is 3.
40. Let () 11 49 ,,510xy ⎛⎞ =−⎜⎟ ⎝⎠ and () 22 31 ,,. 105 xy ⎛⎞ =−⎜⎟ ⎝⎠ Then 21 21 197 51010 5 34 10 105 7107 . 1055 yy m xx === ⎛⎞ ⎜⎟ ⎝⎠ =−⋅=−
The slope is 7 5
Copyright © 2016 Pearson Education,
41. Since the points lie on a line, the slope between any two points will be the same. To find the slope, any two points can be used, but using the x- and y-intercepts will make the calculations simple. Let ()() 11,0,6xy = and ()() 22,3,0.xy = Then
21 21 066 2. 303 yy m xx ====−
The slope is 2.
42. Since the points lie on a line, the slope between any two points will be the same. To find the slope, any two points can be used, but using the x- and y-intercepts will make the calculations simple. Let ()() 11,1,0xy =− and ()() 22,0,3.xy =− Then ()
21 21 303 3. 011 yy m xx ====−
The slope is 3.
43. Since the points lie on a line, the slope between any two points will be the same. To find the slope, any two points can be used, but using the x- and y-intercepts will make the calculations simple. Let ()() 11,3,0xy =− and ()() 22,0,4.xy = Then ()
21 21 404 033 yy m xx ===
The slope is 4 3
44. Since the points lie on a line, the slope between any two points will be the same.To find the slope, any two points can be used, but using the x- and y-intercepts will make the calculations simple. Let ()() 11,0,2xy =− and ()() 22,5,0.xy = Then () 21 21 02 2 . 505 yy m xx ===
The slope is 2 5
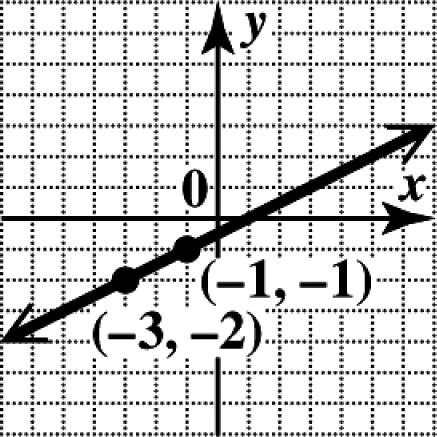
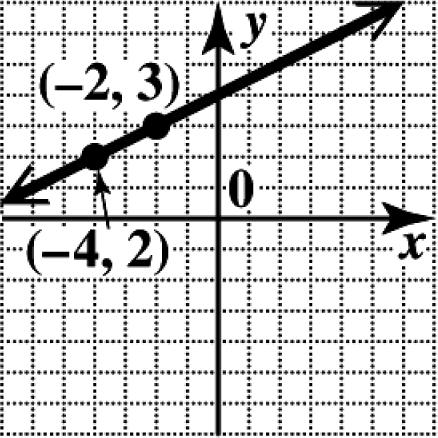
45. The points shown on the line are () 3,3 and ()1,2. The slope is () 2355 1322 m ===−
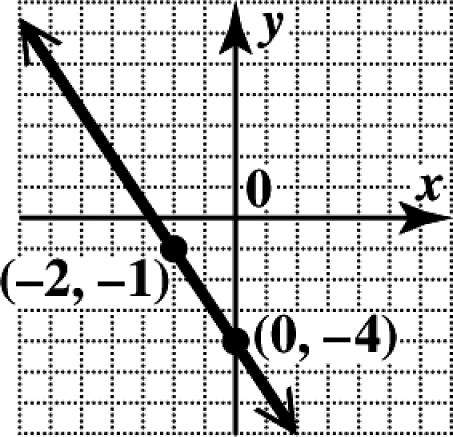
46. The points shown on the line are () 1,1 and ()3,3. The slope is ()31 4 2. 312 m ===
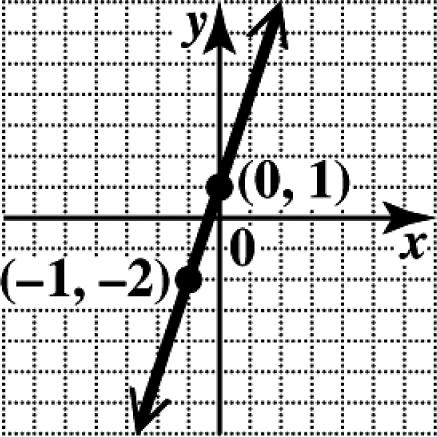
47. The points shown on the line are () 3,3 and ()3,3. The slope is 336 , 330 m == which is undefined.
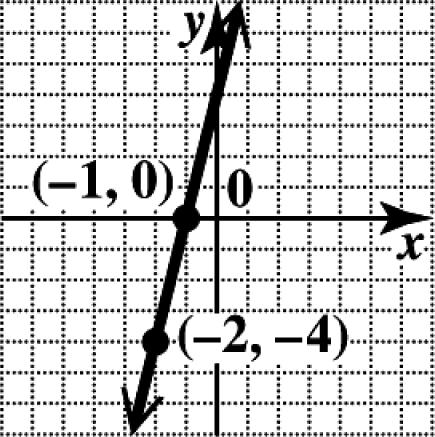
48. The points shown on the line are () 2,2 and ()2,2. The slope is 220 0. 224 m ===
49. (a) Answers will vary. The intercepts are () 4,0 and ()0,8.
Let ()() 11,4,0xy = and ()() 22,0,8.xy =−
Then 21 21 808 2. 044 yy m xx ====
The slope is 2.
(b) 28 28 28 xy yx yx −= −=−+ =−
From this equation, the slope is also 2. (c) 218 xy−= 2 A = and 1, B =− so 2 2. 1 A B −=−=
50. (a) Answers will vary. The intercepts are () 2,0 and ()0,6. Let ()() 11,2,0xy =− and ()() 22,0,6.xy = Then () 21 21 606 3. 022 yy m xx ====
The slope is 3.
(b) 36 36 36 xy yx yx −=− −=−− =+
From this equation, the slope is also 3. (c) 316 xy−=− 3 A = and 1, B =− so 3 3. 1 A B −=−=
Copyright © 2016 Pearson Education, Inc.
51. (a) Answers will vary. The intercepts are () 4,0 and ()0,3. Let ()() 11,4,0xy = and ()() 22,0,3.xy = Then 21 21 3033 0444 yy m xx ====−
The slope is 3 4
(b) 3412 4312 3 3 4 xy yx y += =−+ =−+
From this equation, the slope is also 3 4
(c) 3412 xy+= 3 A = and 4, B = so 3 4 A B −=−
52. (a) Answers will vary. The intercepts are () 5,0 and ()0,6. Let ()() 11,5,0xy = and ()() 22,0,6.xy = Then 21 21 6066 0555 yy m xx ====−
The slope is 6 . 5
(b) 6530 5630 6 6 5 xy yx yx += =−+ =−+
From this equation, the slope is also 6 . 5
(c) 6530 xy+= 6 A = and 5, B = so 6 5 A B −=−
53. (a) Answers will vary. The intercepts are () 3,0 and ()0,3. Let ()() 11,3,0xy =− and ()() 22,0,3.xy =− Then ()
21 21 303 1. 033 yy m xx ====−
The slope is 1.
(b) 3 3 xy yx +=− =−−
From this equation, the slope is also 1.
(c) 113 xy+=− 1 A = and 1, B = so 1 1. 1 A B −=−=−
54. (a) Answers will vary. The intercepts are () 4,0 and ()0,4. Let ()() 11,4,0xy = and ()() 22,0,4.xy =− Then 21 21 404 1. 044 yy m xx ====
The slope is 1.
(b) 4 4 4 xy yx yx −= −=−+ =−
From this equation, the slope is also 1. (c) 114 xy−= 1 A = and 1, B =− so 1 1. 1 A B −=−=
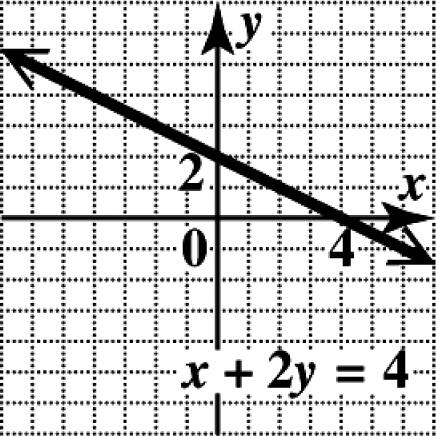
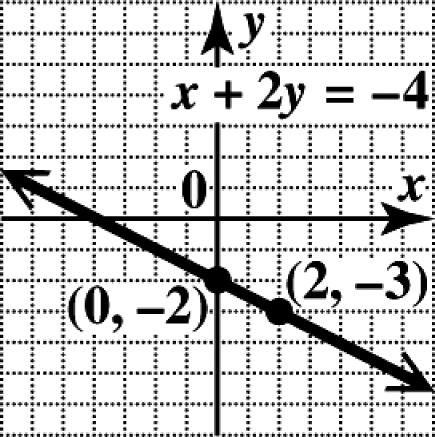
55. To find the slope of 24,xy+= first find the intercepts. Replace y with 0 to find that the x-intercept is (4, 0); replace x with 0 to find that the y-intercept is (0, 2). The slope is then 2021 . 0442 m ==−=−
To sketch the graph, plot the intercepts and draw the line through them.
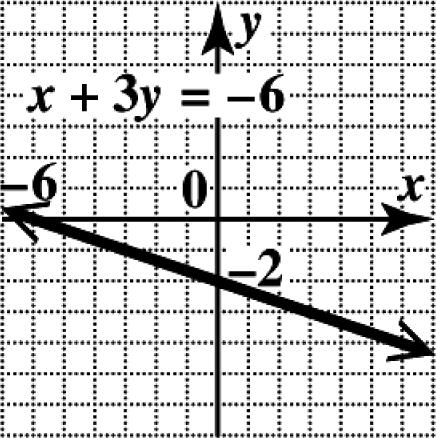
56. To find the slope of 36,xy+=− first find the intercepts. Replace y with 0 to find that the x-intercept is ()6,0; replace x with 0 to find that the y-intercept is ()0,2. The slope is then () 2021 0663 m ===−
To sketch the graph, plot the intercepts and draw the line through them.
Copyright © 2016 Pearson Education,
57. To find the slope of 5210, xy−= first find the intercepts. Replace y with 0 to find that the x-intercept is ()2,0; replace x with 0 to find that the y-intercept is ()0,5. The slope is then 5055 . 0222 m ===
To sketch the graph, plot the intercepts and draw the line through them.
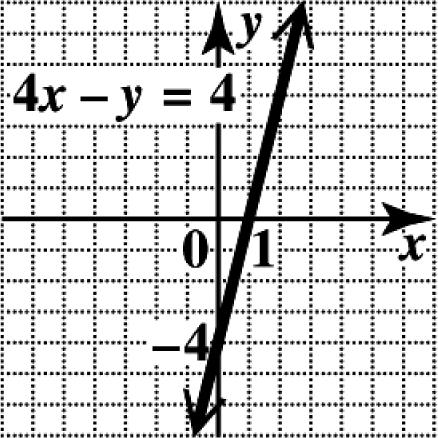
58. To find the slope of 44, xy−= first find the intercepts. Replace y with 0 to find that the x-intercept is ()1,0; replace x with 0 to find that the y-intercept is ()0,4. The slope is then 404 4. 011 m ===
To sketch the graph, plot the intercepts and draw the line through them.
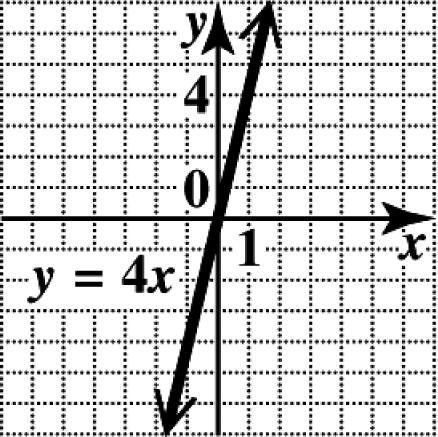
59. In the equation 4,yx = replace x with 0 and then x with 1 to get the ordered pairs () 0,0 and ()1,4, respectively. (There are other possibilities for ordered pairs.) The slope is then 404 4. 101 m ===
To sketch the graph, plot the two points and draw the line through them.
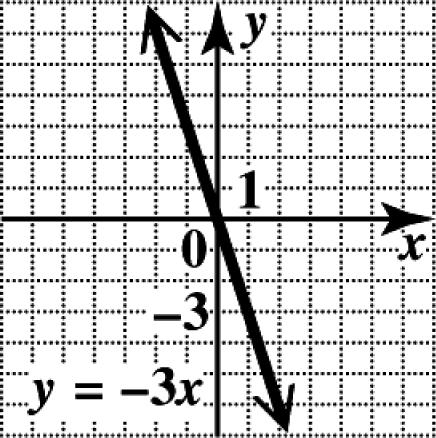
60. In the equation 3,yx =− replace x with 0 and then x with 1 to get the ordered pairs () 0,0 and (1,3), respectively. (There are other possibilities for ordered pairs.) The slope is then 303 3. 101 m ===−
To sketch the graph, plot the two points and draw the line through them.
61. ()303xx−==
The graph of 3 x = is the vertical line with x-intercept ()3,0. The slope of a vertical line is undefined.
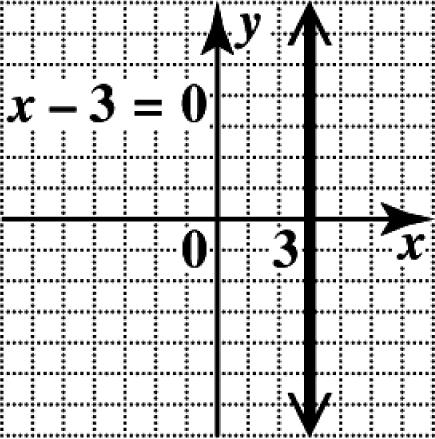
62. ()202xx+==−
The graph of 2 x =− is the vertical line with x-intercept ()2,0. The slope of a vertical line is undefined.
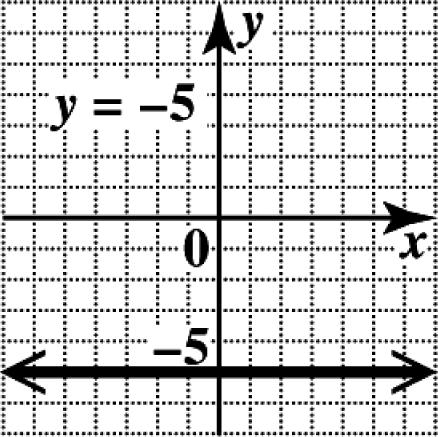
63. 5 y =−
The graph of 5 y =− is the horizontal line with y-intercept ()0,5. The slope of a horizontal line is 0.
Copyright © 2016 Pearson Education, Inc.
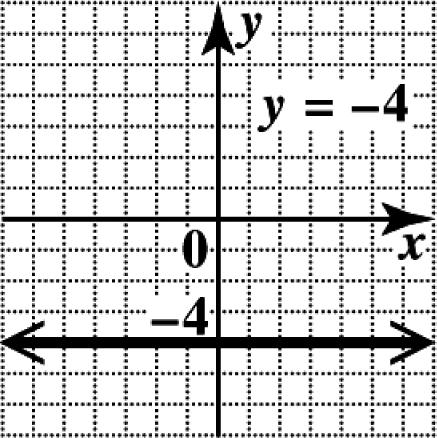
64. 4 y =−
The graph of 4 y =− is the horizontal line with y-intercept ()0,4. The slope of a horizontal line is 0.
65. 3 23 2 yy ⎛⎞ ==⎜⎟ ⎝⎠
The graph of 3 2 y = is the horizontal line with y-intercept 3 0,. 2 ⎛⎞ ⎜⎟ ⎝⎠ The slope of a horizontal line is 0.
66. 4 34 3 xx ⎛⎞ ==⎜⎟ ⎝⎠
The graph of 4 3 x = is the vertical line with x-intercept 4 ,0. 3 ⎛⎞ ⎜⎟ ⎝⎠ The slope of a vertical line is undefined.
67. To graph the line through () 4,2 with slope 1 , 2 m = locate () 4,2 on the graph. To find a second point, use the definition of slope. changein1 changein2 y m x ==
From ()4,2, go up 1 unit. Then go 2 units to the right to get to ()2,3. Draw the line through () 4,2 and ()2,3.
68. To graph the line through () 2,3 with slope 5 , 4 m = locate () 2,3 on the graph. To find a second point, use the definition of slope. changein5 changein4 y m x ==
From ()2,3, go up 5 units. Then go 4 units to the right to get to (2, 2). Draw the line through () 2,3 and (2, 2).
69. To graph the line through () 0,2 with slope 2 , 3 m =− locate the point () 0,2 on the graph.
To find a second point on the line, use the definition of slope, writing 2 3 as 2 3 changein2 changein3 y m x ==
From ()0,2, move 2 units down and then 3 units to the right. Draw a line through this second point and (0,2). (Note that the slope could also be written as 2 3 In this case, move 2 units up and 3 units to the left to get another point on the same line.)
70. To graph the line through () 0,4 with slope 3 , 2 m =− locate the point () 0,4 on the graph. To find a second point on the line, use the definition of slope, writing 3 2 as 3 2 changein3 changein2 y m x ==
From ()0,4, move 3 units down and then 2 units to the right. Draw a line through this second point and ()0,4. The slope could also be written as 3 . 2 In this case, move 3 units up and 2 units to the left to get another point on the same line, as shown in the figure.
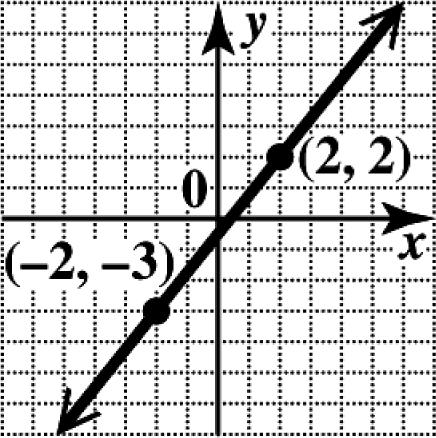
71. Locate ()1,2. Then use 3 3 1 m == to go 3 units up and 1 unit right to (0, 1). Draw the line through () 1,2 and (0, 1).
72. Locate ()2,4. Then use 4 4 1 m == to go 4 units up and 1 unit right to ()1,0. Draw the line through () 2,4 and 5. k =
73. Locate ()2,5. A slope of 0 means that the line is horizontal, so 5 y =− at every point. Draw the horizontal line through ()2,5.
74. Locate (5, 3). A slope of 0 means that the line is horizontal, so 3 y = at every point. Draw the horizontal line through (5, 3).
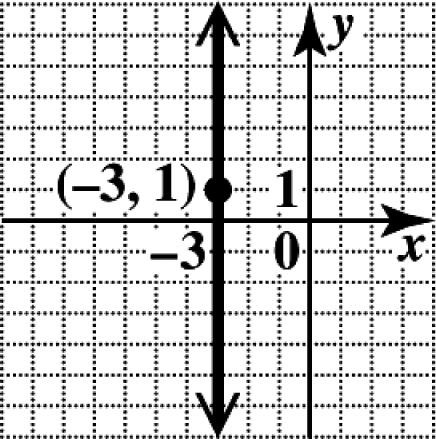
75. Locate ()3,1. Since the slope is undefined, the line is vertical. The x-value of every point is 3. Draw the vertical line through ()3,1.
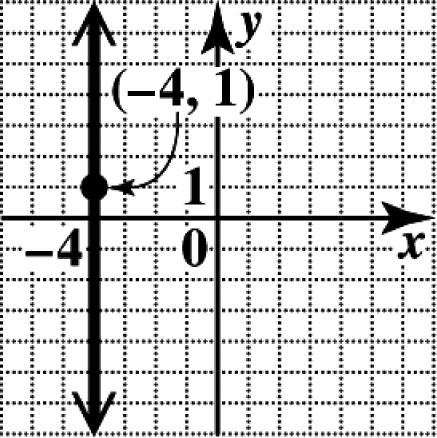
76. Locate ()4,1. Since the slope is undefined, the line is vertical. The x-value of every point is 4. Draw the vertical line through ()4,1.
77. If a line has slope 4 , 9 then any line parallel to it has slope 4 9 (the slope must be the same), and any line perpendicular to it has slope 9 4 (the slope must be the negative reciprocal).
Copyright © 2016 Pearson Education, Inc.
78. If a line has slope 0.2, then any line parallel to it has slope 0.2 (the slope must be the same), and any line perpendicular to it has slope 1 5 0.2 =− (the slope must be the negative reciprocal).
79. The slope of the line through (15, 9) and () 12,7 is 791616 . 121533 m ===
The slope of the line through () 8,4 and () 5,20 is ()204 1616 5833 m ===
Since the slopes are equal, the two lines are parallel.
80. The slope of the line through (4, 6) and () 8,7 is 7611 841212 m ===−
The slope of the line through () 5,5 and () 7,4 is () 4511 . 751212 m ===−
Since the slopes are equal, the two lines are parallel.
81. Solve the equations for y 4743 4743 17 43 44 xyxy
The slopes, 1 4 and 4, are negative reciprocals of one another, so the lines are perpendicular.
82. Solve the equations for y 257521 527251 2751 5522 xyxy yxyx yxyx +=−−= =−−−=−+ =−−=−
The slopes, 2 5 and 5 , 2 are negative reciprocals of one another, so the lines are perpendicular.
83. Solve the equations for y 436342 346432 431 2 342 xyxy yxyx yxyx −=−= −=−+−=−+ =−=−
The slopes are 4 3 and 3 4 The lines are neither parallel nor perpendicular.
84. Solve the equations for y. 264 264 4 xyxy yxyx yx +=−= =−+−=−+ =−
The slopes are 2 and 1. The lines are neither parallel nor perpendicular.
85. The second equation can be simplified as 2. x =− Both lines are vertical lines, so they are parallel.
86. The slope of the first line is the coefficient of x, namely 3. Solve the second equation for y. 265 265 5 3 2 yx yx yx −= =+ =+
The slope of the second line is also 3, so the lines are parallel.
87. Solve the equations for y. 40582 5 44 2 xyxy yxxy +=−= =−−=
The slopes are 4 and 5 2 The lines are neither parallel nor perpendicular.
88. Solve the equations for y 258625 528526 2826 5555 xyxy yxyx yxyx +=−+= =−−=+ =−−=+
The slopes are 2 5 and 2 . 5 The lines are neither parallel nor perpendicular.
89. Solve the equations for y 2323 2323 13 22 xyyx xyyx yx =++= −==−+ =−+
The slopes, 2 and 1 , 2 are negative reciprocals of one another, so the lines are perpendicular.
90. Solve the equations for y 4384312 3484312 483 3
The slopes, 4 3 and 3 , 4 are negative reciprocals of one another, so the lines are perpendicular.
91. Let y be the vertical rise. Since the slope is the vertical rise divided by the horizontal run, 0.13. 150 y = Solving for y gives 0.13(150)19.5. y == The vertical rise could be a maximum of 19.5 ft.
92. The vertical change is 63 ft, and the horizontal change is 25016090ft. −=
The slope is 637 9010 =
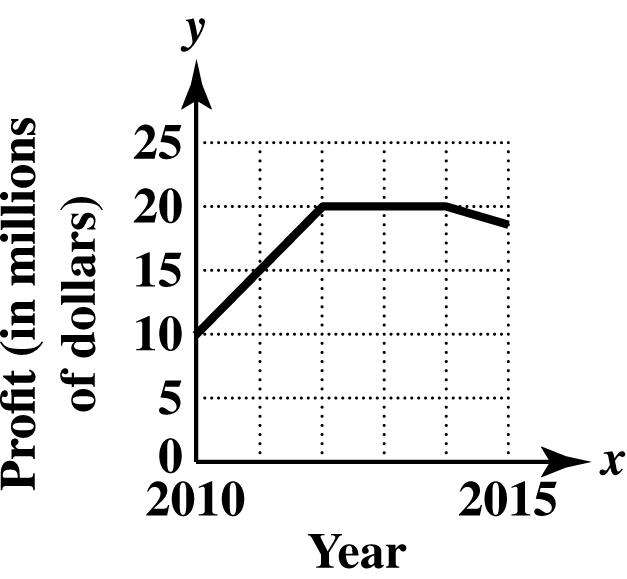
93. Use the points (0, 20) and (4, 4). average rate of change changein42016 4 changein404 y x ====−
The average rate of change is $4000 per year—that is, the value of the machine is decreasing $4000 each year during these years.
94. Use the points (0, 0) and (4, 200). average rate of change changein2000200 50 changein404 y x ====
The average rate of change is $50 per month— that is, the amount saved is increasing $50 each month during these months.
95. We can see that there is no change in the percent of pay raise. Thus, the average rate of change is 0% per year—that is, the percent of pay raise is not changing; it is 3% each year during these years.
96. If the graph of a linear equation rises from left to right, then the average rate of change is positive. If the graph of a linear equation falls from left to right, then the average rate of change is negative
97. (a) In 2012, there were 326 million wireless subscriber connections in the United States.
(b) 32625571 14.2
201220075 m ===
(c) The number of subscribers increased by an average of 14.2 million per year from 2007 to 2012.
98. (a) In 2012, 38% of U.S. households were wireless-only households.
(b) 381622 4.4
201220075 m ===
(c) The percent of wireless-only housleholds increased by an average of 4.4% per year from 2007 to 2012.
99. (a) Use () 2005,402 and () 2012,350. 35040252 7.4 201220057 m ==≈−
The average rate of change is about 7 theaters per year.
(b) The negative slope means that the number of drive-in theaters decreased by an average of 7 each year from 2005 to 2012.
100. (a) Use () 2000,15,189 and () 2011,11,595. 11,59515,1893594 326.7 2011200011 m ==≈−
The average rate of change is about 327 thousand travelers per year.
(b) The negative slope means that the number of U.S. travelers to Canada decreased by an average of 327 thousand each year from 2000 to 2011.
101. Use () 1980,1.22 and () 2012,3.70. 3.701.222.48 0.078 2012198032 m ==≈
The average rate of change is about 7.8 cents per year—that is, the price of a gallon of gasoline increased by an average of $0.08 per year from 1980 to 2012.
102. Use () 1990,4.23 and () 2012,7.96. 7.964.233.73 0.17 2012199022 m ==≈
The average rate of change is about 17 cents per year—that is, the price of a movie ticket increased by an average of $0.17 per year from 1990 to 2012.
Copyright © 2016 Pearson Education, Inc.
m ==≈−
103. Use () 2010,7246 and () 2013,1670. 167072465576 1858.7 201320103
The average rate of change is about 1858.7 digital cameras sold per year—that is, the number of digital cameras sold decreased by an average of 1859 thousand per year from 2010 to 2013.
104. Use () 2010,7390 and () 2013,6876. 68767390514 171.3 201320103
m ==≈−
The average rate of change is about 171.3 sales of desktop computers per year— that is, the sales of desktop computers decreased by an average of $171 million per year from 2010 to 2013.
105. Label the points as shown in the figure.
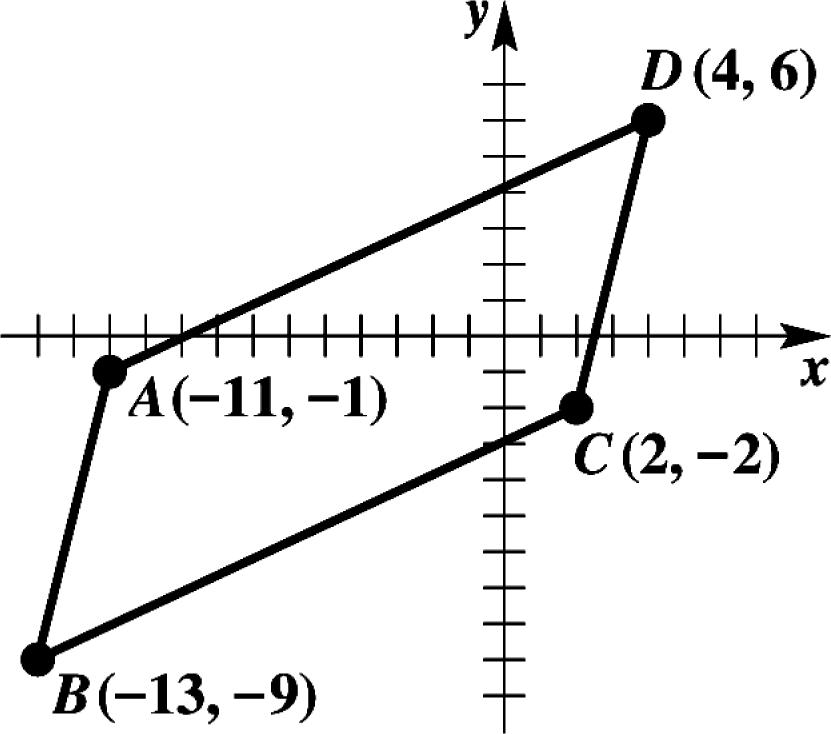
In order to determine whether ABCD is a parallelogram, we need to show that the slope of AB equals the slope of CD and that the slope of AD equals the slope of BC
Slope of 9(1)8 4 13(11)2 AB ===
Slope of 6(2)8 4 422 CD ===
Slope of 6(1)7 4(11)15 AD ==
Slope of 2(9)7 2(13)15 BC ==
Thus, the figure is a parallelogram.
106. Label the points as shown in the figure.
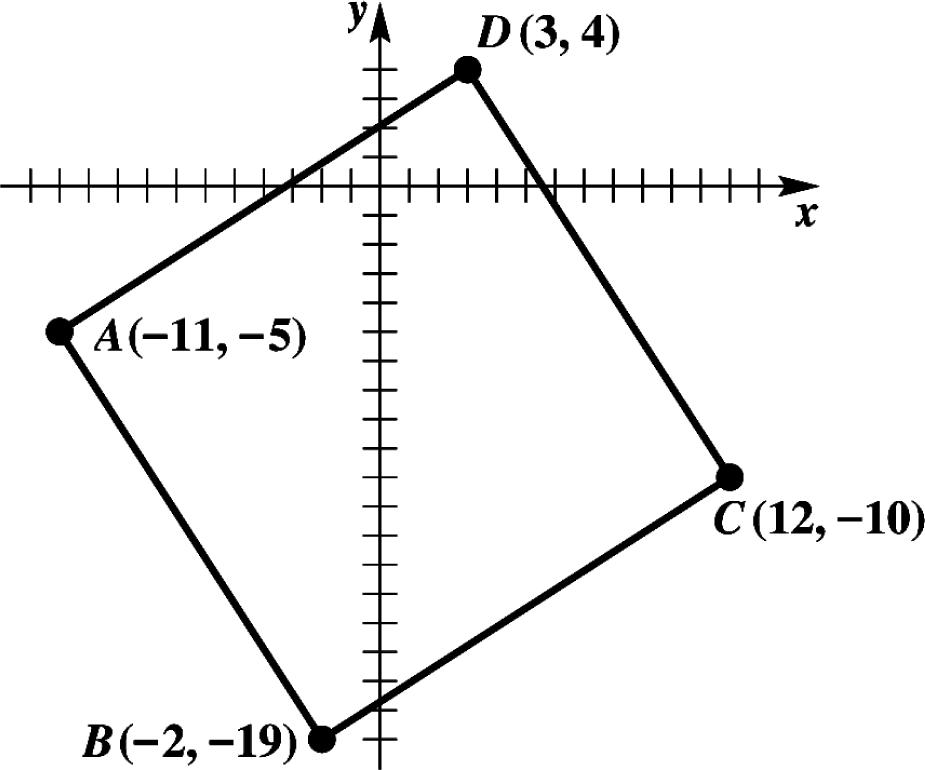
In order to determine whether ABCD is a parallelogram, we need to show that the slope of AB equals the slope of CD and that the slope of AD equals the slope of BC
Slope of 19(5)1414 2(11)99 AB ===−
Slope of 4(10)1414 31299 CD ===−
Slope of 4(5)9 3(11)14 AD ==
Slope of 10(19)9 12(2)14 BC ==
Thus, the figure is a parallelogram. If two adjacent sides form a right angle, the parallelogram is a rectangle. A right angle is formed by perpendicular lines. Notice AB is perpendicular to BC since 149 1. 914 ⎛⎞ −=− ⎜⎟ ⎝⎠
Therefore, the figure is a rectangle.
107. For A(3, 1) and B(6, 2), the slope of AB is 211 633 m ==
108. For B(6, 2) and C(9, 3), the slope of BC is 321 963 m ==
109. For A(3, 1) and C(9, 3), the slope of AC is 3121 9363 m ===
110. The slope of slopeof slopeof 1 3 ABBC AC = = =
Copyright © 2016 Pearson Education,
111. For (1,2)A and (3,1), B the slope of AB is 1(2)1 312 m ==
For (3,1) B and C(5, 0), the slope of BC is 0(1)1 532 m ==
For (1,2)A and C(5, 0), the slope of AC is 0(2)21 5142 m ===
Since the three slopes are the same, the three points are collinear.
112. For A(0, 6) and (4,5), B the slope of AB is 561111 4044 m ===−
For (4,5) B and (2,12), C the slope of BC is 12(5)1717 . 2466 m ===−
Since these two slopes are not the same, the three points are not collinear.
2.3 Writing Equations of Lines
Classroom Examples, Now Try Exercises
1. Slope 2; y-intercept (0,3)
Here 2 m = and 3. b =− Substitute these values into the slope-intercept form. 2(3) 23 ymxb yx yx =+ =+− =−
N1. Slope 2 ; 3 y-intercept (0, 1)
Here 2 3 m = and 1. b = Substitute these values into the slope-intercept form. 2 1 3 ymxb yx =+ =+
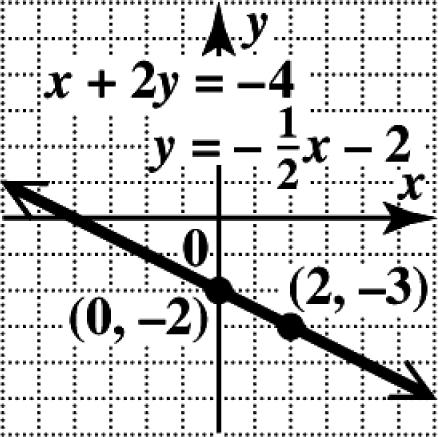
2. 24xy+=−
Solve the equation for y. 24 1 2 2 yx yx =−− =−−
Plot the y-intercept (0,2). The slope can be interpreted as either 1 2 or 1 2 Using 1 , 2 move from (0,2) down 1 unit and to the right 2 units to locate the point (2,3). Draw a line through the two points.
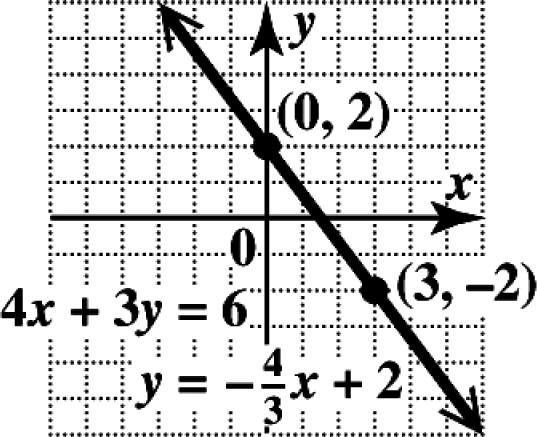
N2. 436 xy+= Solve the equation for y 346 4 2 3 yx yx =−+ =−+
Plot the y-intercept (0, 2). The slope can be interpreted as either 4 3 or 4 . 3 Using 4 , 3 move from (0, 2) down 4 units and to the right 3 units to locate the point (3,2). Draw a line through the two points.
3. Through (3,4); 2 slope 5 m ==
Use the point-slope form with 11 (,)(3,4) xy =− and 2 . 5 m = 11() 2 (4)(3) 5 2 4(3) 5 26 4 55 2620 555 226 55 yymxx yx yx yx yx yx −=− −−=− +=− +=− =−− =−
Copyright © 2016 Pearson Education, Inc.
N3. Through (5,3); 1 slope 5 m ==−
Use the point-slope form with 11 (,)(5,3) xy =− and 1 . 5 m =− 11() 1 (3)(5) 5 1 3(5) 5 1 31 5 1 2 5 yymxx yx yx yx yx −=− −−=−− +=−− +=−+ =−−
4. Through (2,6) and (1, 4) 4622 1(2)33 m ===−
Let 11 (,)(1,4). xy = 11() 2 4(1) 3 31222 2314Standard form yymxx yx yx xy −=− −=−− −=−+ +=
N4. Through (3,4) and (2,1) 1(4)33 2355 m ===−
Let 11 (,)(3,4). xy =− 11() 3 (4)(3) 5 3 4(3) 5 52039 3511Standard form yymxx yx yx yx xy −=− −−=−− +=−− +=−+ +=−
5. (a) Through (2,1); m undefined
This is a vertical line since the slope is undefined. A vertical line through the point (a, b) has equation .xa = Here the x-coordinate is 2, so the equation is 2. x =
(b) Through (2,1); 0 m =
Since the slope is 0, this is a horizontal line. A horizontal line through the point (a, b) has equation .yb = Here the y-coordinate is 1, so the equation is 1. y =−
N5. (a) Through (4,4); m undefined
This is a vertical line since the slope is undefined. A vertical line through the point (a, b) has equation .xa = Here the x-coordinate is 4, so the equation is 4. x =
(b) Through (4,4); 0 m =
Since the slope is 0, this is a horizontal line. A horizontal line through the point (a,b) has equation .yb = Here the y-coordinate is 4, so the equation is 4. y =−
6. (a) Through (8,3); parallel to the line 2310 xy−=
Find the slope of the given line. 2310 3210 210 33 xy yx yx −= −=−+ =−
The slope is 2 , 3 so a line parallel to it also has slope 2 3 Use 2 3 m = and 11 (,)(8,3) xy =− in the point-slope form. 11() 2 3[(8)] 3 2 3(8) 3 216 3 33 2169 333 225 33 yymxx yx yx yx yx yx −=− −=−− −=+ −=+ =++ =+
Copyright © 2016 Pearson Education,
(b) Through (8,3); perpendicular to 2310 xy−=
The slope of 2310 xy−= is 2 3 The negative reciprocal of 2 3 is 3 , 2 so the slope of the line through (8,3) is 3 2 11() 3 3[(8)] 2 3 3(8) 2
N6. (a) Through (6,1); parallel to the line 357 xy−=
Find the slope of the given line. 357 537 37 55 xy yx yx −= −=−+ =−
The slope is 3 , 5 so a line parallel to it also has slope 3 5 Use 3 5 m = and 11 (,)(6,1) xy =− in the point-slope form. 11() 3 (1)(6) 5 318 1
(b) Through (6,1); perpendicular to 357 xy−=
The slope of 357 xy−= is 3 5 The negative reciprocal of 3 5 is 5 , 3 so the slope of the line through (6,1) is 5 3
7. Since the price you pay is $0.10 per minute plus a flat rate of $0.20, an equation that gives the cost y in dollars for a call of x minutes is 0.10.2.yx=+
N7. Since the price you pay is $85 per month plus a flat fee of $100, an equation that gives the cost y in dollars for x months of service is 85100.yx=+
8. (a) Use (0, 34.3) for 1950 and (60, 87.1) for 2010.
87.134.352.8 0.88 60060 0.8834.3 m ymxb yx === =+ =+
(b) For 2012, 2012195062. x =−= 0.8834.3 0.88(62)34.3Let62. 54.5634.3 88.86 yx yx y y =+ =+= =+ = About 88.9% of the U.S. population 25 yr or older were at least high school graduates in 2012.
N8. (a) Use (0, 2787) for 2009 and (3, 3216) for 2012. 32162787429 143 303 1432787 m ymxb yx === =+ =+
Copyright © 2016 Pearson Education, Inc.
(b) For 2011, 201120092. x =−=
1432787
143(2)2787Let2. 2862787 3073 yx yx y y =+ =+= =+ =
According to the model, average tuition and fees for in-state students at public two-year colleges in 2011 were about $3073.
9. (a) Use (9, 255) and (11, 262).
2622557 3.5 1192 m ===
Use the point-slope form with 11 (,)(9,255). xy = 11()
2553.5(9)
2553.531.5 3.5223.5 yymxx yx yx yx −=− −=− −=− =+
(b) For 2014, 2014200014. x =−=
3.5223.5
3.5(14)223.5Let14. 49223.5
272.5 yx yx y y =+ =+= =+ = The estimated retail spending on prescription drugs in 2014 is $272.5 billion.
N9. (a) Use (8, 243) and (12, 263).
26324320 5 1284 m ===
Use the point-slope form with 11 (,)(8,243). xy = 11()
2435(8)
243540 5203 yymxx yx yx yx −=− −=− −=− =+
(b) For 2015, 2015200015. x =−= 5203 5(15)203Let15. 75203 278 yx yx =+ =+= =+ = The estimated retail spending on prescription drugs in 2015 is $278 billion.
Exercises
1. Choice A, 325, xy−= is in the form AxByC += with 0 A ≥ and integers A, B, and C having no common factor (except 1).
2. Choice C, 32(1),yx−=− is in the form 11().yymxx −=−
3. Choice A, 62,yx=+ is in the form .ymxb =+
4. 23(4) 2312 310 yx yx yx +=−− +=−+ =−+
5. 23(4) 2312 310Standard form yx yx xy +=−− +=−+ +=
6. Solve 10770 xy−= for y 71070 10 10 7 yx yx −=−+ =−
7. This line is in slope-intercept form with slope 2 m = and y-intercept (0,)(0,3). b = The only graph with positive slope and with a positive y-coordinate of its y -intercept is A.
8. This line is in slope-intercept form with slope 2 m =− and y-intercept (0,)(0,3). b = The only graph with negative slope and with a positive y-coordinate of its y -intercept is D.
9. This line is in slope-intercept form with slope 2 m =− and y-intercept (0,)(0,3). b =− The only graph with negative slope and with a negative y -coordinate of its y -intercept is C.
10. This line has slope 2 m = and y-intercept (0,)(0,3). b =− The only graph with positive slope and with a negative y -coordinate of its y-intercept is F.
11. This line has slope 2 m = and y-intercept (0,)(0,0). b = The only graph with positive slope and with y -intercept (0, 0) is H.
12. This line has slope 2 m =− and y-intercept (0,)(0,0). b = The only graph with negative slope and with y -intercept (0, 0) is G.
13. This line is a horizontal line with y -intercept (0, 3). Its y-coordinate is positive. The only graph that has these characteristics is B.
14. This line is a horizontal line with y -intercept (0,3). Its y-coordinate is negative. The only graph that has these characteristics is E.
Copyright © 2016 Pearson Education, Inc.
15. 5 and 15 mb==
Substitute these values in the slope-intercept form.
515 ymxb yx =+ =+
16. 2 and 12 mb==
Substitute these values in the slope-intercept form.
212 ymxb yx =+ =+
17. 24 and 35 mb=−=
Substitute these values in the slope-intercept form.
24 35 ymxb yx =+ =−+
18. 51 and 83 mb=−=−
Substitute these values in the slope-intercept form.
51 83 ymxb yx =+ =−−
19. Here, 1 m = and 1. b =− Substitute these values in the slope-intercept form.
11,or1 ymxb yxyx =+ =−=−
20. Here, 1 m =− and 3. b =− Substitute these values in the slope-intercept form.
13,or3 ymxb yxyx =+ =−−=−−
21. Here, 2 5 m = and 5. b = Substitute these values in the slope-intercept form.
2 5 5 ymxb yx =+ =+
22. Here, 3 4 m =− and 7. b = Substitute these values in the slope-intercept form.
3 7 4 ymxb yx =+ =−+
23. To get to the point (3, 3) from the y-intercept (0, 1), we must go up 2 units and to the right 3 units, so the slope is 2 3 The slope-intercept form is 2 1. 3 yx=+
24. To get to the point (2, 2) from the y-intercept (0,3), we must go up 5 units and to the right 2 units, so the slope is 5 . 2 The slope-intercept
form is 5 3. 2 yx=−
25. To get to the point (3,1) from the y -intercept (0,2), we must go up 3 units and to the left 3 units, so the slope is 3 1. 3 =− The slopeintercept form is 12,or2.yxyx =−−=−−
26. To get to the point (3,1) from the y -intercept (0, 2), we must go down 3 units and to the right 3 units, so the slope is 3 1. 3 =− The slopeintercept form is 12,or2.yxyx =−+=−+
27. Use the points (0,4) and (1,2) to find the slope of the line.
()24 24 2 101 m −+ ===
The slope is 2. The y-intercept is (0,4).
The equation in slope-intercept form is 24.yx=−
28. Use the points (0,3) and (2,9) to find the slope of the line.
936 3 202 m ===
The slope is 3. The y-intercept is (0,3).
The equation in slope-intercept form is 33.yx=+
29. Use the points (0,3) and (5,0) to find the slope of the line.
0333 5055 m ===−
The slope is 3 5 The y-intercept is (0,3).
The equation in slope-intercept form is 3 3. 5 yx=−+
30. Use the points (0,5) and (2,10) to find the slope of the line. ()105 10555 20222 m −+− ====−
The slope is 5 2 The y-intercept is (0,5).
The equation in slope-intercept form is 5 5. 2 yx=−−
31. (a) Solve for y to get the equation in slopeintercept form. 4 4 xy yx −+= =+
(b) The slope is the coefficient of x, 1.
(c) The y-intercept is the point (0, b), or (0, 4). (d)
32. (a) Solve for y to get the equation in slopeintercept form. 6 6 xy yx −+= =+
(b) The slope is the coefficient of x, 1.
(c) The y-intercept is the point (0, b), or (0, 6). (d)
33. (a) Solve for y to get the equation in slopeintercept form. 6530 5630 6 6 5 xy yx yx += =−+ =−+
(b) The slope is the coefficient of x, 6 5
(c) The y-intercept is the point (0, b), or (0, 6). (d)
34. (a) Solve for y to get the equation in slopeintercept form. 3412 4312 3 3 4 xy yx yx += =−+ =−+
(b) The slope is the coefficient of x, 3 . 4
(c) The y-intercept is the point (0, b), or (0, 3). (d)
35. (a) Solve for y to get the equation in slopeintercept form. 4520 5420 4 4 5 xy yx yx −= −=−+ =−
(b) The slope is the coefficient of x, 4 . 5
(c) The y-intercept is the point (0, b), or (0,4). (d)
Copyright © 2016 Pearson Education,
36. (a) Solve for y to get the equation in slopeintercept form.
373 7 1 3 xy yx yx −= −=−+ =−
(b) The slope is the coefficient of x, 7 3
(c) The y-intercept is the point (0, b), or (0,1).
(d)
37. (a) Solve for y to get the equation in slopeintercept form. 24 24 1 2 2 xy yx yx +=− =−− =−−
(b) The slope is the coefficient of x, 1 . 2
(c) The y-intercept is the point (0, b), or (0,2).
(d)
38. (a) Solve for y to get the equation in slopeintercept form. 39 39 1 3 3 xy yx yx +=− =−− =−−
(b) The slope is the coefficient of x, 1 . 3
(c) The y-intercept is the point (0, b), or (0,3).
(d)
39. (a) Use the slope-intercept formula with the given slope and point. ()825 810 18 218 b b b yx =−+ =−+ = =−+
(b) Use the equation in part (a) and rewrite it in standard form. 218 218 yx xy =−+ +=
40. (a) Use the slope-intercept formula with the given slope and point. ()10112 1012 2 2 b b b yx =+ =+ −= =−
(b) Use the equation in part (a) and rewrite it in standard form. 2 2 2 yx xy xy =− −+=− −=
41. (a) Use the slope-intercept formula with the given slope and point. () 3 42 4 3 4 2 832 52 5 2 35 42 b b b b b yx =−−+ =+ =+ = = =−+
(b) Use the equation in part (a) and rewrite it in standard form.
42. (a) Use the slope-intercept formula with the given slope and point.
44. (a) Use the slope-intercept formula with the given slope and point.
(b) Use the equation in part (a) and rewrite it in standard form.
43. (a) Use the slope-intercept formula with the given slope and point.
(b) Use the equation in part (a) and rewrite it in standard form.
(b) Use the equation in part (a) and rewrite it in standard form.
45. (a) Use the slope-intercept formula with the given slope and point. ()043 012 12 412 b b b
(b) Use the equation in part (a) and rewrite it in standard form. 412 412 412 yx xy
46. (a) Use the slope-intercept formula with the given slope and point. ()052 010 10 510 b b b yx =−−+ =+ −= =−−
(b) Use the equation in part (a) and rewrite it in standard form. 510 510 yx xy =−− +=−
47. (a) Use the slope-intercept formula with the given slope and point.
()6.81.42 6.82.8 4 1.44 b b b yx =+ =+ = =+
(b) Use the equation in part (a) and rewrite it in standard form. 1.44 1.44 7520 yx xy xy =+ −+= −=−
48. (a) Use the slope-intercept formula with the given slope and point.
()1.20.86 1.24.8 6 0.86 b b b yx −=+ −=+ −= =−
(b) Use the equation in part (a) and rewrite it in standard form. 0.86 0.86 4530 yx xy xy =− −+=− −=
49. Find the slope. 844 2 532 m ===
Use the point-slope form with 11 (,)(3,4) xy = and 2. m = 11() 42(3) 426 22 22 yymxx yx yx xy xy −=−
50. Find the slope. 14(2)16 2 358 m ===−
Use the point-slope form with 11 (,)(5,2). xy =− 11() (2)2(5) 2210 28 yymxx yx yx xy −=− −−=−− +=−+ +=
51. Find the slope. 5141 2682 m ===−
Use the point-slope form with 11 (,)(6,1) xy = and 1 2 m =− 11() 1 1(6) 2 2(1)1(6) 226 28 yymxx yx yx yx xy −=−
+=
52. Find the slope. 1542 8(2)63 m ===
Let 11 (,)(2,5). xy =− 2 5[(2)] 3 3(5)2(2) 31524 2319 2319 yx yx yx xy xy
−=+ −=+ −+= −=−
53. Find the slope. 550 0 121 m ===
A line with slope 0 is horizontal. A horizontal line through the point (x, k) has equation , yk = so the equation is 5. y =
54. Find the slope. 220 0 4(2)6 m ===
A line with slope 0 is horizontal. A horizontal line through the point (x, k) has equation , yk = so the equation is 2. y =
55. Find the slope. 8614 Undefined 770 m ==
A line with undefined slope is a vertical line. The equation of a vertical line is , xk = where k is the common x-value. So the equation is 7. x =
56. 156 Undefined 13130 m ==
A line with undefined slope is a vertical line. The equation of a vertical line is , xk = where k is the common x-value. So the equation is 13. x =
Copyright © 2016 Pearson Education, Inc.
57. Find the slope. 3(3)0 0 217 326 m ===
A line with slope 0 is horizontal. A horizontal line through the point (x, k) has equation , yk = so the equation is 3. y =−
58. 6(6)0 0 136 124 63 79 m === ⎛⎞ ⎜⎟ ⎝⎠
A line with slope 0 is horizontal. A horizontal line through the point (x, k) has equation , yk = so the equation is 6. y =−
59. Find the slope. 22106 3515 206 42 15 35 4 42 15 26 2613 15 m == + ⎛⎞
Use the point-slope form with () 11 22 ,,55xy ⎛⎞ =−⎜⎟ ⎝⎠ and 2 13 m
60. 2828 333 23815 5420 6 2040 3 (2) 7 77 20 m == ⎛⎞ =−== ⎜⎟ ⎝⎠ Let 11 38 (,),. 43 xy ⎛⎞ = ⎜⎟ ⎝⎠ 8403 374 83 740 34 56 74030 3 34 407 3 1202134 yx yx yx xy xy ⎛⎞
61. A line with slope 0 is a horizontal line. A horizontal line through the point (x, k) has equation . yk = Here 5, k = so an equation is 5. y =
62. An equation of this line is 2. y =−
63. A vertical line has undefined slope and equation .xc = Since the x -value in (9, 10) is 9, the equation is 9. x =
64. A line with undefined slope is a vertical line in the form .xc = The equation of this line is 2. x =−
65. The equation of this line is 3 2 y =−
66. The equation of this line is 9 . 2 y =−
67. A horizontal line through the point (x, k) has equation , yk = so the equation is 8. y =
68. A horizontal line through the point (x, k) has equation , yk = so the equation is 7. y =−
69. A vertical line through the point (k, y) has equation . xk = Here 0.5, k = so the equation is 0.5. x =
70. A vertical line through the point (k, y) has equation . xk = Here 0.1, k = so the equation is 0.1. x =
71. (a) Find the slope of 38. xy−= 38 38 yx yx −=−+ =−
The slope is 3, so a line parallel to it also has slope 3. Use 3 m = and 11 (,)(7,2) xy = in the point-slope form. 11() 23(7) 2321 319 yymxx yx yx yx −=− −=− −=− =−
(b) 319 319 319 yx xy xy =− −+=− −=
72. (a) Find the slope of 2510. xy+= 5210 2 2 5 yx yx =−+ =−+
The slope is 2 5 We are to find the equation of a line parallel to this line, so its slope is also 2 5 Use 2 5 m =− and 11 (,)(4,1) xy = in the point-slope form. 2 1(4) 5 28 1 55 213 55 yx yx yx −=−− −=−+ =−+ (b) 213 55 5213Multiply by 5. 2513 yx yx xy =−+ =−+ +=
73. (a) Find the slope of 210.xy −+= 210 1 5 2 yx yx =+ =+
The slope is 1 , 2 so a line parallel to it also has slope 1 . 2 Use 1 2 m = and 11 (,)(2,2) xy =−− in the point-slope form. 11() 1 (2)[(2)] 2 1 2(2) 2 1 21 2 1 1 2 yymxx yx yx yx yx −=− −−=−− +=+ +=+ =− (b) 1 1 2
22Multiply by 2. 22 22 yx yx xy xy =− =− −+=− −=
74. (a) Find the slope of 312.xy −+= 312 1 4 3 yx yx =+ =+
The slope of the required line is the same as the slope of this line, 1 3 Use 1 3 m = and 11 (,)(1,3) xy =− in the point-slope form. 1 3[(1)] 3 1 3(1) 3 11 3 33 110 33 yx yx yx yx −=−− −=+ −=+ =+ (b) 110 33 310Multiply by 3. 310 310 yx yx xy xy =+ =+ −+= −=−
Copyright © 2016 Pearson Education, Inc.
75. (a) Find the slope of 27. xy−= 27 27 yx yx −=−+ =−
The slope of the line is 2. Therefore, the slope of the line perpendicular to it is 1 2 since 1 21. 2 ⎛⎞ −=−⎜⎟ ⎝⎠ Use 1 2 m =− and 11 (,)(8,5) xy = in the point-slope form.
11() 1 5(8) 2 1 54 2 1 9 2 yymxx yx yx yx −=− −=−− −=−+ =−+ (b) 1 9 2 218Multiply by 2. 218 yx yx xy =−+ =−+ +=
76. (a) Find the slope of 5218. xy+= 1 2518 5 9 2 5 2 yx yx m =−+ =−+ =−
We wish to find 2m such that 12 1, mm =− or 2 1 1 m m = 2 122 (1) 5 55 2 m ⎛⎞ ==−−= ⎜⎟ ⎝⎠
Use the point-slope form. 2 (7)(2) 5 24 7 55 239 55 yx yx yx −−=− +=− =− (b) 239 55 5239Multiply by 5. 2539 2539 yx yx xy xy =− =− −+=− −=
77. (a) 9 x = is a vertical line, so a line perpendicular to it will be a horizontal line. It goes through (2,7), so its equation is 7. y =
(b) 7 y = is already in standard form.
78. (a) 3 x =− is a vertical line, so a line perpendicular to it will be a horizontal line. It goes through (8, 4), so its equation is 4. y =
(b) 4 y = is already in standard form.
79. Distance = (rate)(time), so 45.yx =
x 45 yx = Ordered Pair
0 45(0)0 = (0, 0)
5 45(5)225 = (5, 225)
10 45(10)450 = (10, 450)
80. Total cost = (cost/t-shirt)(number of t-shirts), so 26.yx =
x 26 yx = Ordered Pair
0 26(0)0 = (0, 0)
5 26(5)130 = (5, 130)
10 26(10)260 = (10, 260)
81. Total cost = (cost/gal)(number of gallons), so 3.75. yx =
x 3.75 yx = Ordered Pair
0 3.75(0)0 = (0, 0)
5 3.75(5)18.75 = (5, 18.75)
10 3.75(10)37.50 = (10, 37.50)
82. Total cost = (cost/day)(number of days), so 4.50. yx =
x 4.50 yx = Ordered Pair
0 4.50(0)0 = (0, 0)
5 4.50(5)22.50 = (5, 22.50)
10 4.50(10)45.00 = (10, 45.00)
Copyright © 2016 Pearson Education,
83. Total cost = (cost/credit)(number of credits), so 140.yx =
x 140 yx = Ordered Pair
0 140(0)0 = (0, 0)
5 140(5)700 = (5, 700)
10 140(10)1400 = (10, 1400)
84. Total cost = (cost/ticket)(number of tickets), so 125.yx =
x 125 yx = Ordered Pair
0 125(0)0 = (0, 0)
5 125(5)625 = (5, 625)
10 125(10)1250 = (10, 1250)
85. (a) The fixed cost is $15, so that is the value of b. The variable cost is $149, so 14915.ymxbx=+=+
(b) If 5,149(5)15760.xy==+= The ordered pair is (5, 760). The cost of five tickets and a parking pass is $760.
(c) If 2,149(2)15313.xy==+= The cost of two tickets and a parking pass is $313.
86. (a) The fixed cost is $20, so that is the value of b. The variable cost is $105.90, so 105.9020.ymxbx =+=+
(b) If 5,105.90(5)20549.50.xy==+= The ordered pair is (5, 549.5). The cost of five credit hours and the application fee is $549.50.
(c) If 15,105.90(15)201608.50.xy==+= The cost of 15 credit hours and the application fee is $1608.50.
87. (a) The fixed cost is $99, so that is the value of b. The variable cost is $41, so 4199.ymxbx=+=+
(b) If 5,41(5)99304.xy==+= The ordered pair is (5, 304). The cost for a five-month membership is $304.
(c) If 12,41(12)99591.xy==+= The cost for the first year’s membership is $591.
88. (a) The fixed cost is $159, so that is the value of b. The variable cost is $57, so 57159.ymxbx=+=+
(b) If () 5, 575159444 xy==+= The ordered pair is (5, 444). The cost of a five-month membership is $444.
(c) For 12 months, 12, x = so () 5712159843. y =+= The cost for a one-year membership is $843.
89. (a) The fixed cost is $36, so that is the value of b. The variable cost is $95, so 9536.ymxbx=+=+
(b) If 5,95(5)36511.xy==+= The ordered pair is (5, 511). The cost of a plan over a five-month contract is $511.
(c) For a two-year contract, 24, x = so 95(24)362316. y =+= The cost of a plan over a two-year contract is $2316.
90. (a) The fixed cost is $36$99$135, += so that is the value of b. The variable cost is $110, so 110135.ymxbx=+=+
(b) If 5,110(5)135685.xy==+= The ordered pair is (5, 685). The cost of a plan over a five-month contract is $685.
(c) For a two-year contract, 24, x = so 110(24)1352775. y =+= The cost of a plan over a two-year contract is $2775.
91. (a) The fixed cost is $30, so that is the value of b. The variable cost is $6, so 630.ymxbx=+=+
(b) If 5,6(5)3060.xy==+= The ordered pair is (5, 60). It costs $60 to rent the saw for five days.
(c) 138630Let138. 1086
108 18 6 xy x x =+= = == The saw is rented for 18 days.
92. (a) The fixed cost is $50, so that is the value of b. The variable cost is $0.45, so 0.4550.ymxbx =+=+
Copyright © 2016 Pearson Education, Inc.
(b) If 5,0.45(5)5052.25.xy==+= The ordered pair is (5, 52.25). The charge for driving 5 miles is $52.25.
96. (a) Use (7, 95.9) and (12, 68.7).
68.795.927.2 5.44 1275 m ===−
Now use the point-slope form.
(c) 127.850.4550Let127.85.
77.850.45 77.85 173 0.45 xy x x =+= = ==
The car was driven 173 miles.
93. (a) Use (0, 7030) and (3, 2959).
295970304071 1357
303 m ===−
The equation is 13577030.yx=−+ The slope tells us that the sales of portable media/MP3 players in the United States decreased by $1357 million per year from 2010 to 2013.
(b) The year 2011 corresponds to 1, x = so portable media/MP3 player sales were approximately 1357(1)7030$5673million y =−+= in the United States in 2011.
94. (a) Use (0, 17.6) and (3, 37.9).
37.917.620.3 6.8
303 m ==≈
The equation is 6.817.6.yx=+ The slope tells us that the sales of smartphones in the United States increased by $6.8 billion per year from 2010 to 2013.
(b) The year 2011 corresponds to 1, x = so smartphone sales were approximately 6.8(1)17.6$24.4billion y =+= in the United States in 2011.
95. (a) Use (8, 62.3) and (12, 77.8).
77.862.315.5 3.875 1284 m ===
Now use the point-slope form.
62.33.875(8)
62.33.87531 3.87531.3 yx yx yx −=− −=− =+
(b) The year 2011 corresponds to 11, x = so spending on home health care was approximately 3.875(11)31.3$73.9 billion y ≈+≈ in 2011. This value is very close to the actual value.
95.95.44(7)
95.95.4438.08
5.44133.98 yx yx yx −=−− −=−+ =−+
(b) The year 2010 corresponds to 10, x = so the number of pieces of mail was approximately 5.44(10)133.9879.6 billion y ≈−+≈ in 2010. This value is greater than the actual value.
97. When 0, C =° 32. F =° When 100, C =° 212. F =°
98. The two points of the form (C, F) would be (0, 32) and (100, 212).
99. 212321809 10001005 m ===
100. Let 9 5 m = and 11 (,)(0,32). xy =
9 32 5 FC=+ If 9 30,(30)32 5 543286. CF==+ =+= Thus, when 30,86.CF=°=°
Copyright © 2016 Pearson Education,
103. 5 (32) 9 CF=− 5 When50,(5032) 9 5 (18)10. 9 FC==− ==
Thus, when 50,10.FC=°=°
104. Let FC = in the equation obtained in Exercise 100. 9 32 5 9 32Let be . 5 9 5532Multiply by 5. 5 59160 4160Subtract9. 40Divide by 4.
(The same result may be found by using either form of the equation obtained in Exercise 101.)
The Celsius and Fahrenheit temperatures are equal () FC = at 40 degrees.
Summary Exercises Finding Slopes and Equations of Lines
1. The slope is ()63 33 . 8355 m ===−
2. The slope is ()55 0 0. 145 m ===
3. Rewrite the equation to have a coefficient next to the x-variable. 15yx=−
Compare this to the slope-intercept form, ymxb =+
The slope can be identified as 1 m = by inspection.
4. Solve the equation for y. 3721 7321 3 3 7 xy yx yx −= −=−+ =−
The slope is 3 7
5. The graph of 40, x −= or 4, x = is a vertical line with x -intercept (4, 0). The slope of a vertical line is undefined because the denominator equals zero in the slope formula.
6. Solve the equation for y 473 743 43 77 xy yx yx += =−+ =−+
The slope is 4 7
7. (a) The slope-intercept form of a line, ,ymxb =+ becomes 0.52,yx=−− or 1 2, 2 yx=−− which is choice B.
(b) 2021 0442 m ===−
Using 1 2 m =− and a y-intercept of (0, 2), we get 1 2. 2 yx=−+ Changing this equation to the standard form gives us 24, yx=−+ or 24,xy+= which is choice F.
(c) 0(2)21 0442 m =−==−
Using 1 2 m =− and a y-intercept of (0, 0), we get 1 0, 2 yx=−+ or 1 , 2 yx =− which is choice A.
(d) Use the point-slope form with 11 (,)(2,2) xy =−− and 1 2 m = 11() 1 (2)[(2)] 2 1 2(2) 2 2(2)2 242 22 yymxx yx yx yx yx xy −=− −−=−− +=+ +=+ +=+ =−
This is choice C.
Copyright © 2016 Pearson Education,
(e) Use the point-slope form with 11 (,)(0,0) xy = and 1 . 2 m = 11() 1 0(0) 2 1 or2 2 yymxx yx yxyx −=− −=− ==
This is choice E.
(f) The slope-intercept form of a line, ,ymxb =+ becomes 20,yx=+ or 2,yx = which is choice D.
8. The only equation written in standard from with a positive whole number x coefficient and no common factor is C.
A. 47 47 yx xy =−− +=−
B. 3412 3412 xy xy −+= −=−
D. 1 0 2 20 xy xy += += E. 6210 35 xy xy −= −= F. 3515 5315 yx xy −=− −=
9. (a) The slope is 1655 4(2)66 m ===−
Use the point-slope form. 11() 5 6[(2)] 6 55 6 63 5518 633 513 63 yymxx yx yx yx yx −=− −=−−− −=−− =−−+ =−+ (b) 513 63 6526Multiply by 6. 5626 yx yx xy =−+ =−+ +=
10. (a) A slope of 0 means that the line is a horizontal line of the form , yk = where k is the y -coordinate of any point on the line. It goes through (5,8) so its equation is 8. y =−
(b) 8 y =− is already in standard form.
11. (a) Use the point-slope form with 11 (,)(4,2) xy =− and 3. m =− 11() (2)3(4) 2312 310 yymxx yx yx yx −=− −−=−− +=−+ =−+ (b) 310 310 yx xy =−+ +=
12. (a) The slope is 12(8)205 . 4482 m ===−
Use the point-slope form. 11() 5 (8)(4) 2 5 810 2 5 2 2 yymxx yx yx yx −=− −−=−− +=−+ =−+
(b) 5 2 2
254Multiply by 2. 524 yx yx xy =−+ =−+ +=
13. (a) 2 3 x = is a vertical line, so a line perpendicular to it will be a horizontal line. It goes through 37 49,, ⎛⎞ ⎜⎟ ⎝⎠ so its equation is 7 9 y =−
(b) 7 9
97Multiply by 9. y y =− =−
Copyright © 2016 Pearson Education, Inc.
14. (a) Use the point-slope form with 11 (,)(3,6) xy =− and 2 3 m = 11() 2 6[(3)] 3 2 62 3 2 8 3 yymxx yx yx yx −=− −=−− −=+ =+
(b) 2 8 3 3224Multiply by 3. 2324 2324 yx yx xy xy =+ =+ −+= −=−
15. (a) Find the slope of 256. xy−= 526 26 55 yx yx −=−+ =− The slope of the line is 2 . 5 Therefore, the slope of the line perpendicular to it is 5 2 since 25 1. 52 ⎛⎞ −=−⎜⎟ ⎝⎠ Use 5 2 m =− and 11 (,)(0,0) xy = in the point-slope form. 11() 5 0(0) 2 5 2 yymxx yx
(b) 5 2 25 520 yx yx xy =− =− +=
16. (a) Find the slope of 34. xy−= 34 34 yx yx −=−+ =− The slope is 3, so a line parallel to it also has slope 3. Use 3 m = and 11 (,)(2,5) xy =− in the point-slope form.
11() 53[(2)] 53(2) 536 311 yymxx yx yx yx yx −=− −=−− −=+ −=+ =+ (b) 311 311 311 yx xy xy =+ −+= −=−
17. (a) The slope of the line through (3, 9) and (6, 11) is 1192 633 m == Use the point-slope form with 11 (,)(4,2) xy =− and 2 3 m = (since the slope of the desired line must equal the slope of the given line).
11() 2 2[(4)] 3 2 2(4) 3 28 2 33 286 333 214 33 yymxx yx yx yx yx yx −=− −=−− −=+ −=+ =++ =+ (b) 214 33 3214 2314 2314 yx yx xy xy =+ =+ −+= −=−
Copyright © 2016 Pearson Education,
18. (a) The slope of the line through (3, 7) and (5, 6) is 6711 5322 m ===−
The slope of a line perpendicular to the given line is 2 (the negative reciprocal of 1 ). 2 Use the point-slope form with 11 (,)(4,2) xy =− and 2. m = 11() (2)2(4) 228 210 yymxx yx yx yx −=− −−=− +=− =−
(b) 210 210 210 yx xy xy =− −+=− −=
2.4 Linear Inequalities in Two Variables
Classroom Examples, Now Try Exercises
1. 4 xy+≤
Step1
Graph the line, 4, xy+= which has intercepts (4, 0) and (0, 4), as a solid line since the inequality involves . ≤
Step 2
Test (0, 0). ? 4 004
04True xy+≤ +≤ ≤
Step3
Since the result is true, shade the region that contains (0, 0).
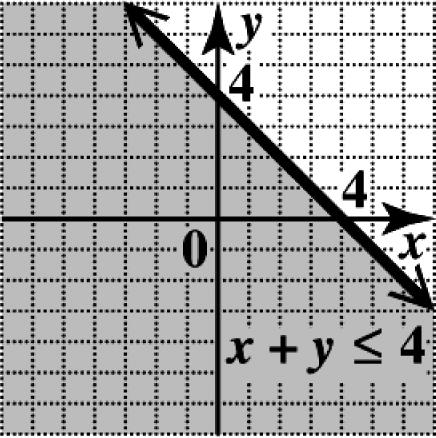
N1. 24xy −+≥
Step1
Graph the line, 24,xy −+= which has intercepts () 4, 0 and (0, 2), as a solid line since the inequality involves . ≤
Step2
Test (0, 0).
? 4 004 04False xy+≥ +≥ ≥
Step3
Since the result is false, shade the region that does not contain (0, 0).
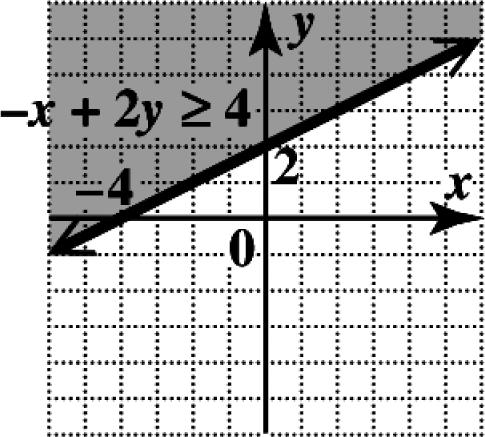
2. Solve the inequality for y 0
Subtract . xy yxx +> >−
Graph the boundary line, yx =− [which has slope 1 and y-intercept (0, 0)], as a dashed line because the inequality symbol is >. Since the inequality is solved for y and the inequality symbol is >, we shade the half-plane above the boundary line.
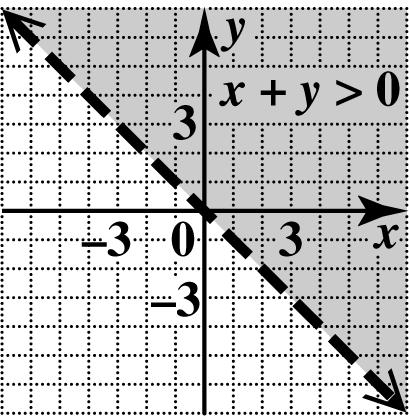
N2. Solve the inequality for y 320
23Subtract3. 3
Divideby2. 2 xy yxx yx −< −<− >−
Graph the boundary line, 3 2 yx = [which has slope 3 2 and y-intercept (0, 0)], as a dashed line because the inequality symbol is >. Since the inequality is solved for y and the inequality symbol is >, we shade the half-plane above the boundary line.
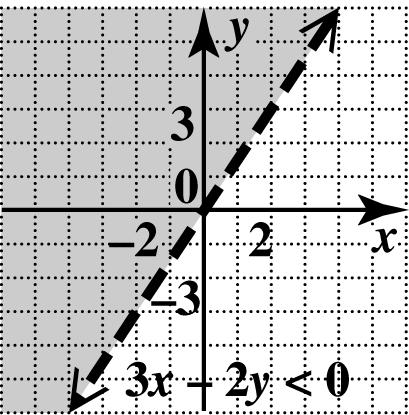
Copyright © 2016 Pearson
3. Solve the inequality for y 40
4Subtract 4. y y +≤ ≤−
Graph the boundary line, 4 y =− [which has slope 0 and y-intercept () 0, 4], as a solid line because the inequality symbol is ≤ . Since the inequality is solved for y and the inequality symbol is ,≤ we shade the half-plane below the boundary line.
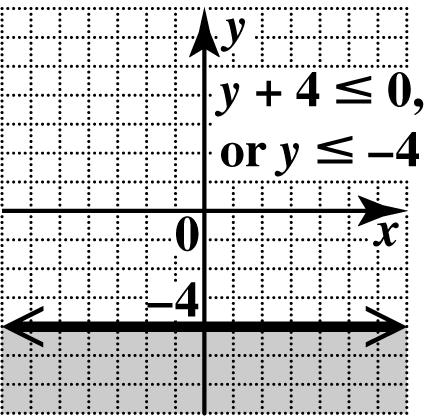
N3. Solve the inequality for x 20
2Subtract2. x x +> >−
Graph the boundary line, 2 x =− (which has an undefined slope and no y-intercerpt) as a dashed line because the inequality symbol is >. Since the inequality is solved for y and the inequality symbol is >, we shade the half-plane to the right of the boundary line.
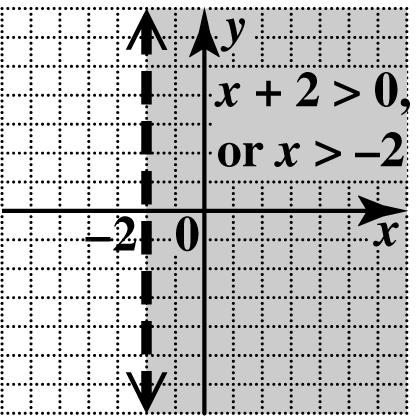
4. Graph 4, xy−= which has intercepts (4, 0) and () 0, 4, as a solid line since the inequality involves . ≤ Test (0, 0), which yields 04, ≤ a true statement. Shade the region that includes (0, 0).
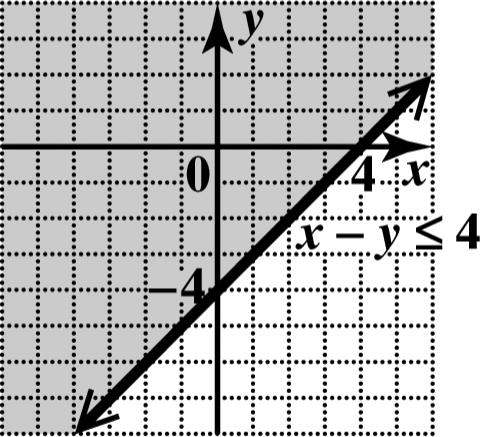
Graph 2 x =− as a solid vertical line through () 2, 0. Shade the region to the right of 2. x =−
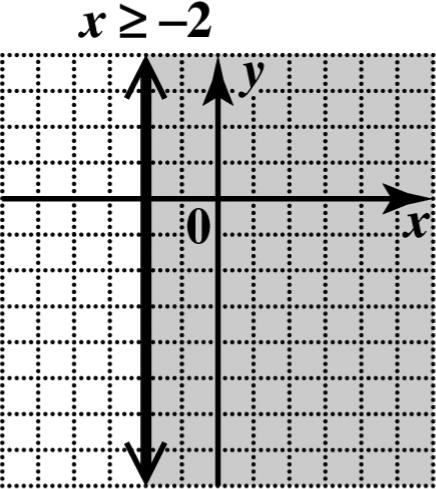
The graph of the intersection is the region common to both graphs.
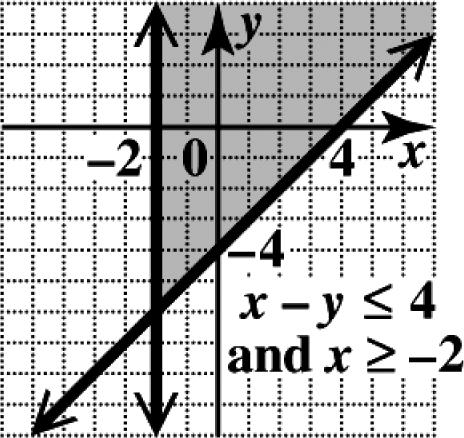
N4. Graph 3, xy+= which has intercepts (3, 0) and (0, 3), as a dashed line since the inequality involves . < Test (0, 0), which yields 03, < a true statement. Shade the region that includes (0, 0).
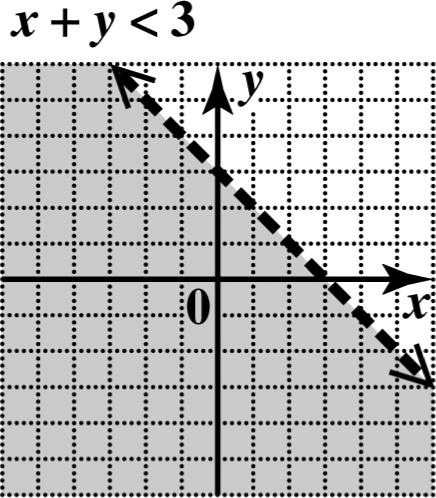
Graph 2 y = as a solid horizontal line through (0, 2). Shade the region below 2. y =
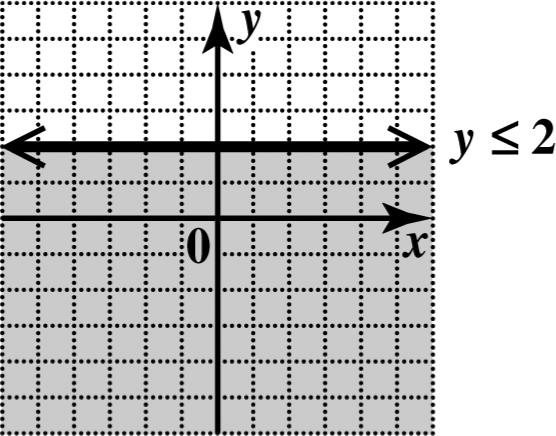
The graph of the intersection is the region common to both graphs.
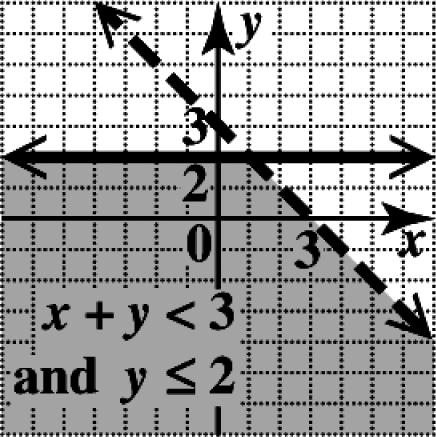
Copyright © 2016 Pearson
5. Graph 7321 xy−= as a dashed line through its intercepts (3, 0) and () 0, 7. Test (0, 0), which yields 021, < a true statement. Shade the region that includes (0, 0).
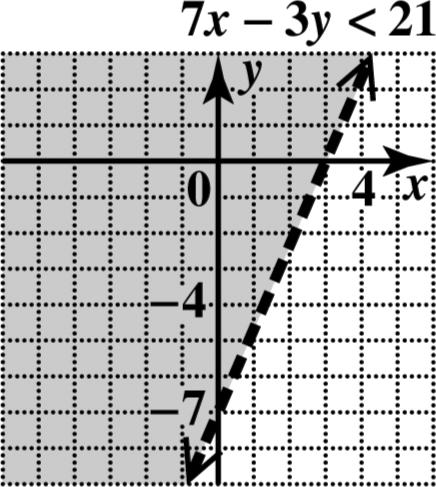
Graph 2 x = as a dashed vertical line through (2, 0). Shade the region to the right of 2. x =
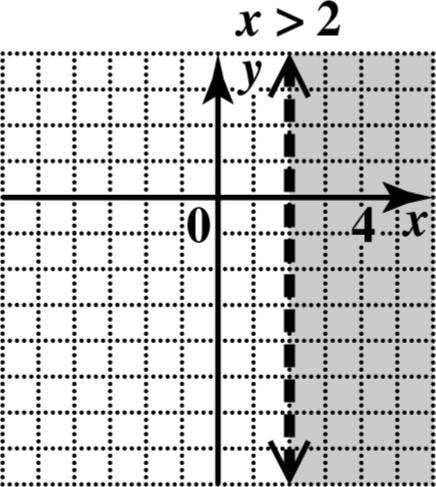
The graph of the union is the region that includes all the points in both graphs.
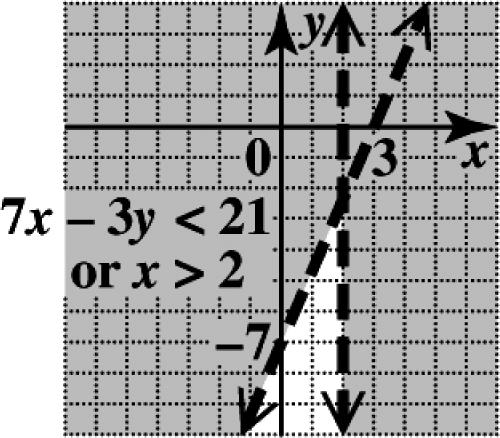
N5. Graph 3515 xy−= as a dashed line through its intercepts (5, 0) and () 0, 3. Test (0, 0), which yields 015, < a true statement. Shade the region that includes (0, 0).
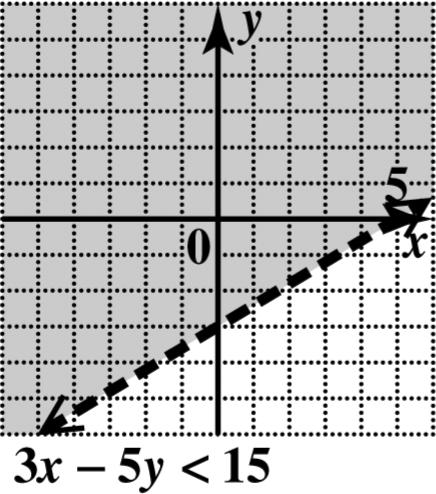
Graph 4 x = as a dashed vertical line through (4, 0). Shade the region to the right of 4. x =
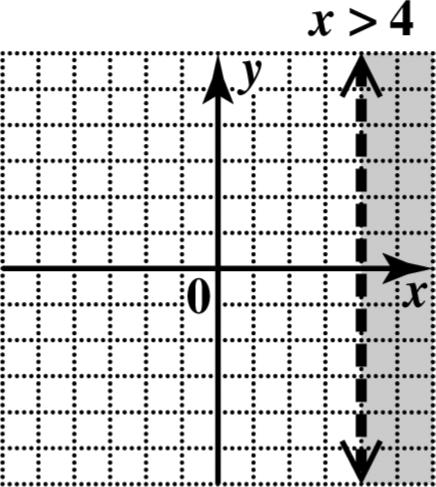
The graph of the union is the region that includes all the points in both graphs.
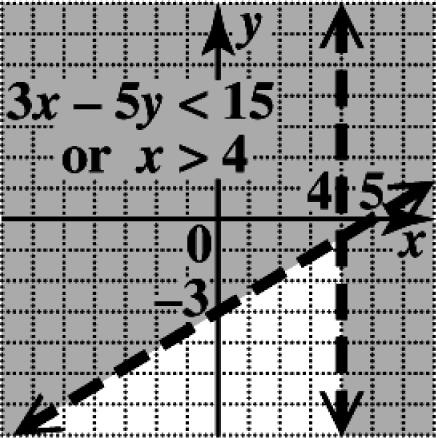
Exercises
1. (a) () ? 24 0204 04True xy−≤ −≤ ≤
The ordered pair (0, 0) is a solution.
(b) () ? 24 2214 44True xy−≤ −−≤ ≤
The ordered pair () 2, 1 is a solution.
(c) () ? 24 7214 54False xy−≤ −≤ ≤
The ordered pair (7, 1) is not a solution.
(d) () ? 24 0224 44True xy−≤ −≤ −≤
The ordered pair (0, 2) is a solution.
2. (a) ? 0 000 00False xy+> +> >
The ordered pair (0, 0) is not a solution.
(b) ? 0 210 10False xy+> −+> −>
The ordered pair () 2, 1 is not a solution.
(c) ? 0 210 10True xy+> −> >
The ordered pair () 2, 1 is a solution.
Copyright © 2016 Pearson
(d) ? 0 460 20True xy+> −+> >
The ordered pair () 4, 6 is a solution.
3. (a) ? 50 050 50False x −> −> −>
The ordered pair (0, 0) is not a solution.
(b) ? 50 550 00False x −> −> >
The ordered pair () 5, 0 is not a solution.
(c) ? 50 150 60False x −> −−> −>
The ordered pair () 1, 3 is not a solution.
(d) ? 50 650 10True x −> −> >
The ordered pair () 6, 2 is a solution.
4. (a) ? 1 01 01True y ≤ ≤ ≤
The ordered pair (0, 0) is a solution.
(b) ? 1 11 11True y ≤ ≤ ≤
The ordered pair () 3, 1 is a solution.
(c) ? 1 11 11True y ≤ −≤ −≤
The ordered pair () 2, 1 is a solution. (d) ? 1 31 31False y ≤ ≤ ≤
The ordered pair () 3, 3 is not a solution.
5. The boundary of the graph of 2 yx≤−+ will be a solid line (since the inequality involves ≤ ), and the shading will be below the line (since the inequality sign is ≤ or <).
6. The boundary of the graph of 2 yx<−+ will be a dashed line (since the inequality involves <), and the shading will be below the line (since the inequality sign is ≤ or <).
7. The boundary of the graph of 2 yx>−+ will be a dashed line (since the inequality involves >), and the shading will be above the line (since the inequality sign is ≥ or >).
8. The boundary of the graph of 2 yx≥−+ will be a solid line (since the inequality involves ≥ ), and the shading will be above the line (since the inequality sign is ≥ or >).
9. The graph has a solid line and is shaded to the left of 4. x = 4 x ≤
10. The graph has a solid line and is shaded above 3. y =− 3 y ≥−
11. The graph has a dashed line and is shaded above the line 32.yx=− 32yx>−
12. The graph has a dashed line and is shaded below the line 3. yx=−+ 3 yx<−+
13. Graph the line 2 xy+= by drawing a solid line (since the inequality involves ≤ ) through the intercepts (2, 0) and (0, 2). Test a point not on this line, such as (0, 0). ? 2 002 02True xy+≤ +≤ ≤
Shade the side of the line containing the test point (0, 0).
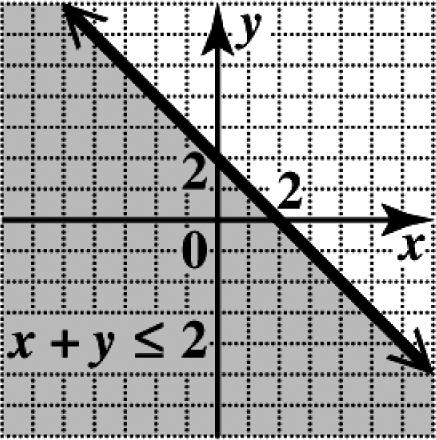
14. Graph the line 3 xy+=− by drawing a solid line (since the inequality involves ≤ ) through the intercepts () 3, 0 and () 0, 3.
Test a point not on this line, such as (0, 0).
? 3 003
03False xy+≤− +≤− ≤−
Shade the side of the line not containing the test point (0, 0).
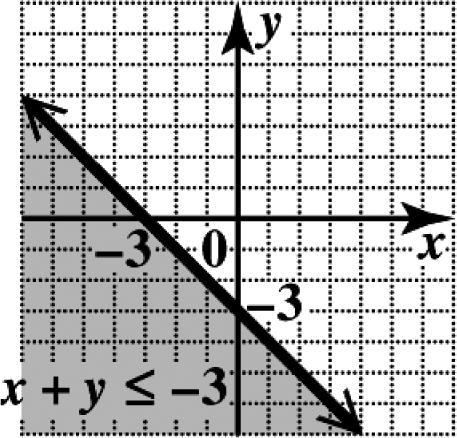
15. Graph the line 44 xy−= by drawing a dashed line (since the inequality involves <) through the intercepts (1, 0) and () 0, 4. Instead of using a test point, we will solve the inequality for y.
44 yx yx −<−+ >−
44
Since we have “” y > in the last inequality, shade the region above the boundary line.
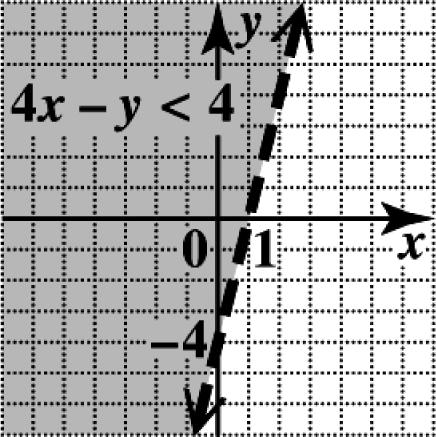
16. Graph the line 33 xy−= by drawing a dashed line (since the inequality involves <) through the intercepts (1, 0) and () 0, 3. Instead of using a test point, we will solve the inequality for y.
33 yx yx −<−+ >−
33
Copyright © 2016 Pearson
Since we have “” y > in the last inequality, shade the region above the boundary line.
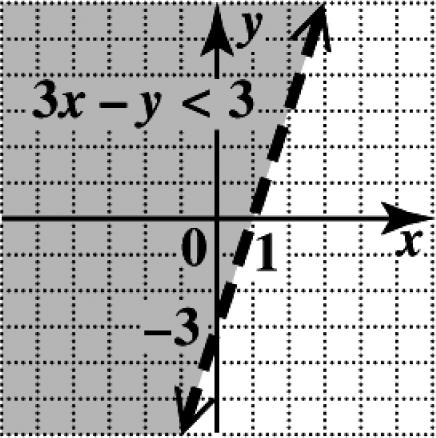
17. Graph the solid line 32xy+=− (since the inequality involves ≥ ) through the intercepts
() 2, 0 and 2 0, . 3 ⎛⎞ ⎜⎟ ⎝⎠
Test a point not on this line, such as (0, 0).
? 03(0)2 02True +≥− ≥−
Shade the side of the line containing the test point (0, 0).
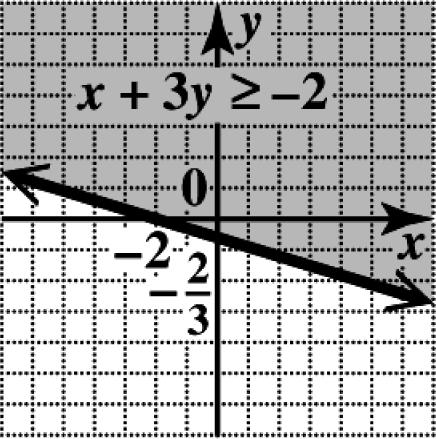
18. Graph the solid line 43xy+=− (since the inequality involves ≥ ) through the intercepts () 3, 0 and 3 0, . 4 ⎛⎞ ⎜⎟ ⎝⎠
Test a point not on this line, such as (0, 0).
? 04(0)3 03True +≥− ≥−
Shade the side of the line containing the test point (0, 0).
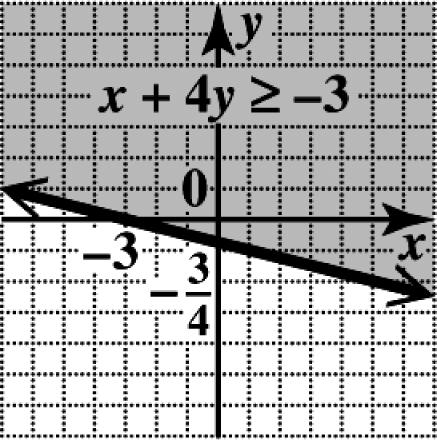
19. Graph the dashed line 1 3 2 yx=+ (since the inequality involves < ) through the intercepts () 6,0 and () 0, 3. Test a point not on this line, such as (0, 0).
() ? 1 003 2 03True <+ <
Shade the side of the line containing the test point (0, 0).
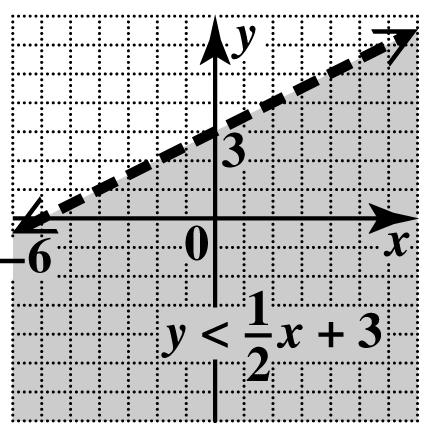
20. Graph the dashed line 1 2 3 yx=− (since the inequality involves < ) through the intercepts () 6,0 and () 0, 2. Test a point not on this line, such as (0, 0).
() ? 1 002 3 02False <− <−
Shade the side of the line not containing the test point (0, 0).
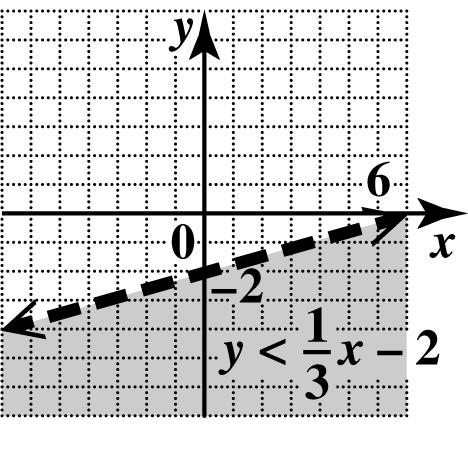
21. Graph the solid line 2 2 5 yx=−+ (since the inequality involves ≥ ) through the intercepts () 5,0 and () 0, 2. Test a point not on this line, such as (0, 0).
() ? 2 002 5 02False ≥−+ ≥
Shade the side of the line not containing the test point (0, 0).
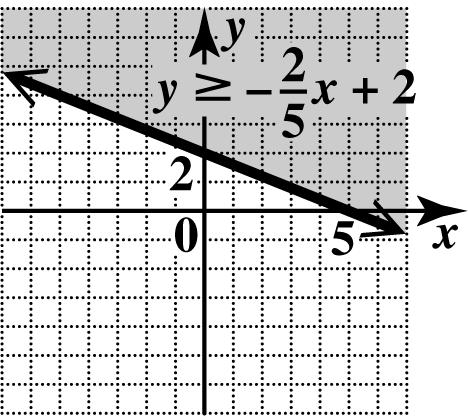
22. Graph the solid line 3 3 2 yx=−+ (since the inequality involves ≥ ) through the intercepts () 2,0 and () 0, 3. Test a point not on this line, such as (0, 0).
() ? 3 003 2 03False ≥−+ ≥
Shade the side of the line not containing the test point (0, 0).
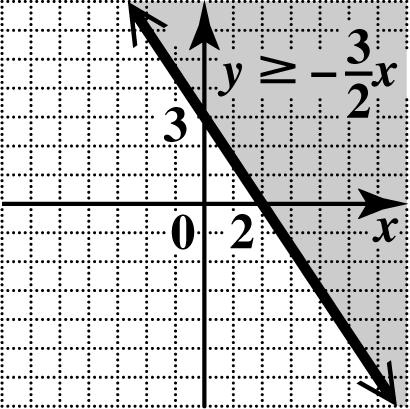
23. Graph the solid line 236 xy+= (since the inequality involves ≥ ) through the intercepts (3, 0) and (0, 2). Test a point not on this line, such as (0, 0).
? 2(0)3(0)6 06False +≥ ≥
Shade the side of the line not containing the test point (0, 0).
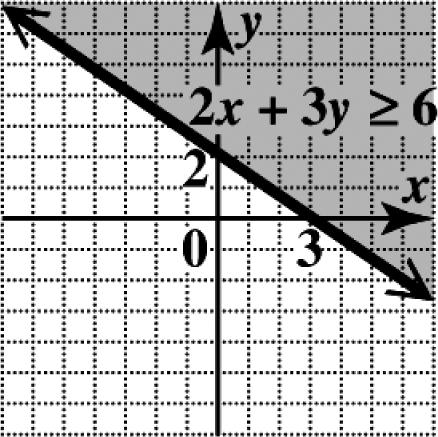
24. Graph the solid line 3412 xy+= (since the inequality involves ≥ ) through the intercepts (4, 0) and (0, 3). Test a point not on this line, such as (0, 0).
? 3(0)4(0)12 012False +≥ ≥
Shade the side of the line not containing the test point (0, 0).
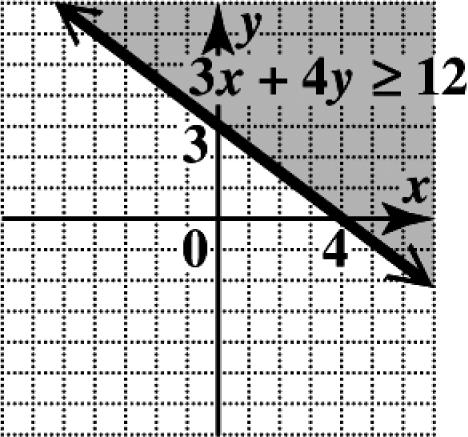
25. Graph the dashed line 5315 xy−= (since the inequality involves >) through the intercepts (3, 0) and () 0, 5. Test a point not on this line, such as (0, 0).
? 5(0)3(0)15 015False −> >
Copyright © 2016 Pearson Education,
Shade the side of the line not containing the test point (0, 0).
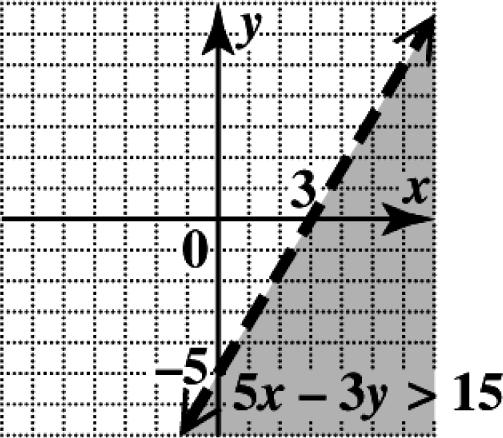
26. Graph the dashed line 4520 xy−= (since the inequality involves >) through the intercepts (5, 0) and () 0, 4. Test a point not on this line, such as (0, 0). ? 4(0)5(0)20 020False −> >
Shade the side of the line not containing the test point (0, 0).
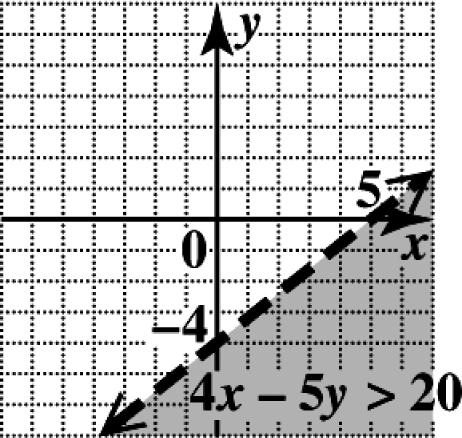
27. Graph the line 0, xy+= which includes the points (0, 0) and () 2, 2, as a dashed line (since the inequality involves >). Solving the inequality for y gives us .yx >− So shade the region above the boundary line.
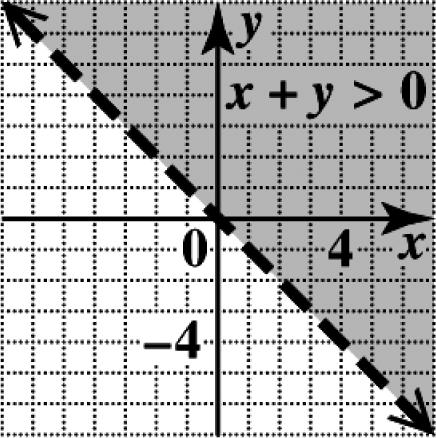
28. Graph the line 20,xy+= which includes the points (0, 0) and () 4, 2, as a dashed line (since the inequality involves >). Solving the inequality for y gives us 1 2 yx >− So shade the region above the boundary line.
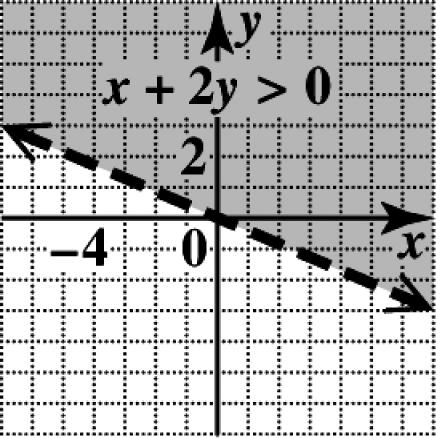
29. Graph the solid line 30xy−= through the points (0, 0) and (3, 1). Solve the inequality for y 3 1 3 yx yx −≤− ≥
Shade the region above the boundary line.
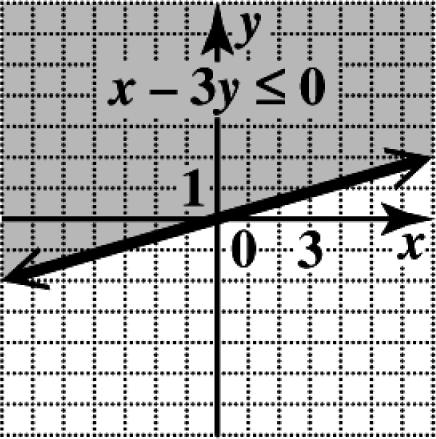
30. Graph the solid line 50xy−= through the points (0, 0) and (5, 1). Solve the inequality for y. 5 1 5 yx yx −≤− ≥
Shade the region above the boundary line.
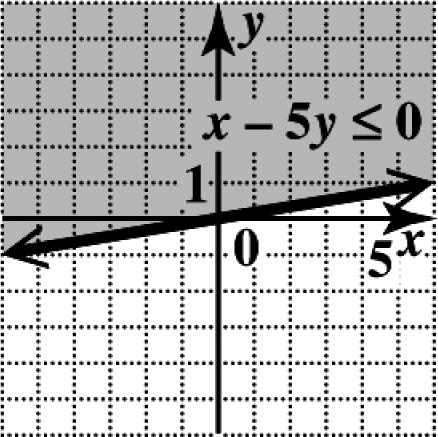
31. Graph the dashed line yx = through (0, 0) and (2, 2). Since we have “” y < in the inequality, shade the region below the boundary line.
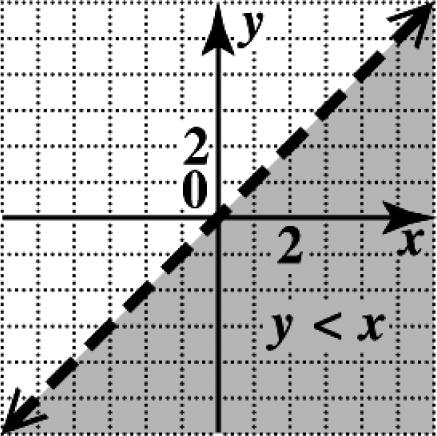
32. Graph the solid line 4 yx = through (0, 0) and (1, 4). Since we have “” y ≤ in the inequality, shade the region below the boundary line.
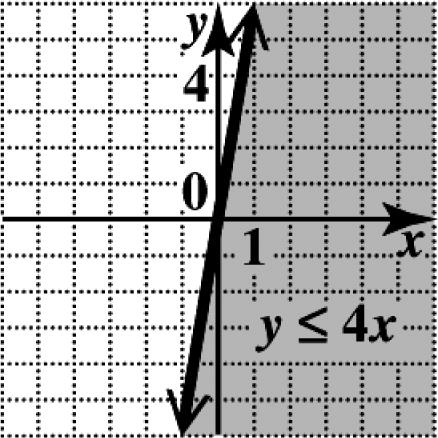
33. The line 30 x +≥ has an intercept at () 3, 0 and is a vertical line. Graph the solid line 3 x =− (since the inequality involves ≥ ).
Shade the region to the right of the boundary line.
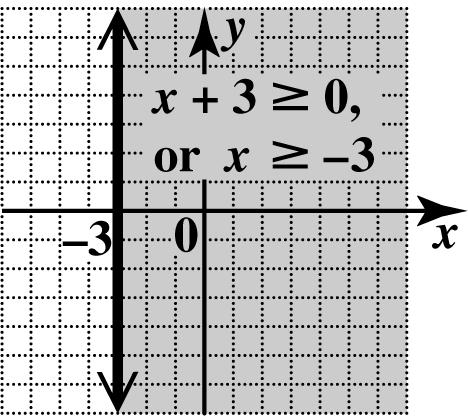
34. The line 10 x −≤ has an intercept at () 1, 0 and is a vertical line. Graph the solid line 1 x = (since the inequality involves ≤ ). Shade the region to the left of the boundary line.
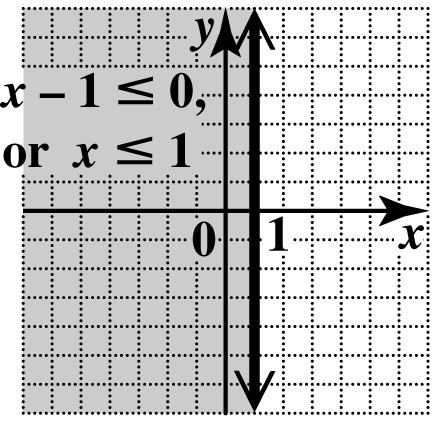
35. The line 52 y +< has an intercept at () 0, 3 and is a horizontal line. Graph the dashed line 3 y =− (since the inequality involves < ). Shade the region below the boundary line.
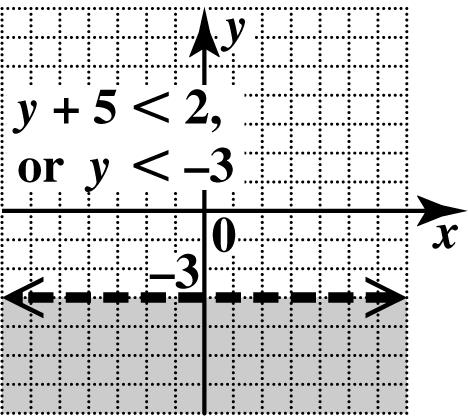
36. The line 13 y −> has an intercept at () 0, 4 and is a vertical line. Graph the dashed line 4 y = (since the inequality involves > ). Shade the region above the boundary line.
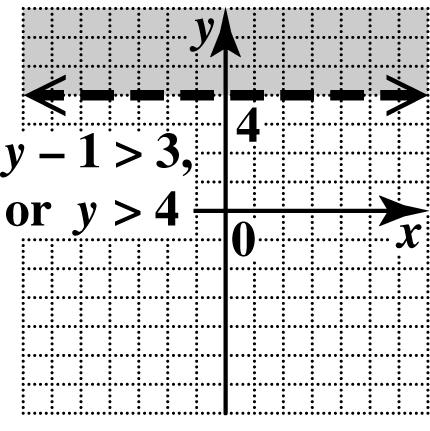
37. ()() () 2, 0 and 0, 4 04 4 2 202 m ===
Slope: 2
y-intercept: () 0, 4
Equation: 24yx=−
The boundary line here is solid, and the region above it is shaded.
The inequality symbol to indicate this is . ≥
Inequality for the graph: 24yx≥−
38. ()() () 3, 0 and 0, 2 02 22 3033 m ===−
Slope: 2 3
y-intercept: () 0, 2
Equation: 2 2 3 yx=−+
The boundary line here is dashed, and the region below it is shaded.
The inequality symbol to indicate this is . < Inequality for the graph: 2 2 3 yx<−+
39. Graph the solid line 1 xy+= through (0, 1) and (1, 0). The inequality 1 xy+≤ can be written as 1, yx≤−+ so shade the region below the boundary line.
Graph the solid vertical line 1 x = through (1, 0) and shade the region to the right. The required graph is the common shaded area as well as the portions of the lines that bound it.
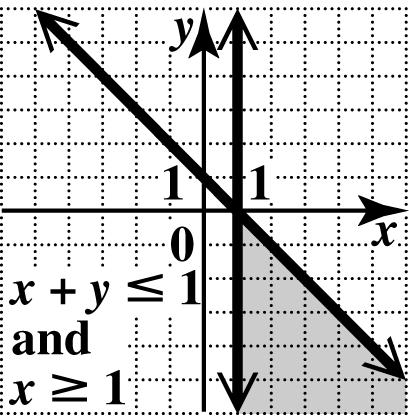
40. Graph 2 xy−= as a solid line through (2, 0) and () 0, 2. Test (0, 0). ? 002 02False −≥ ≥
The graph is the region that does not contain (0, 0).
Graph 3 x = as a solid vertical line through (3, 0). The graph of the inequality is the region to the right of the line. Shade the region that includes the overlap of the two graphs.
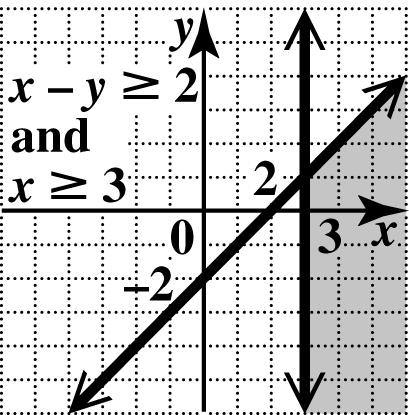
Copyright © 2016 Pearson
41. Graph the solid line 22 xy−= through the intercepts (1, 0) and () 0, 2. Test (0, 0) to get 02, ≥ a false statement. Shade the side of the line not containing (0, 0).
To graph 4 y < on the same axes, graph the dashed horizontal line through (0, 4). Test (0, 0) to get 04, < a true statement. Shade the side of the dashed line containing (0, 0). The word “and” indicates the intersection of the two graphs. The final solution set consists of the region where the two shaded regions overlap.
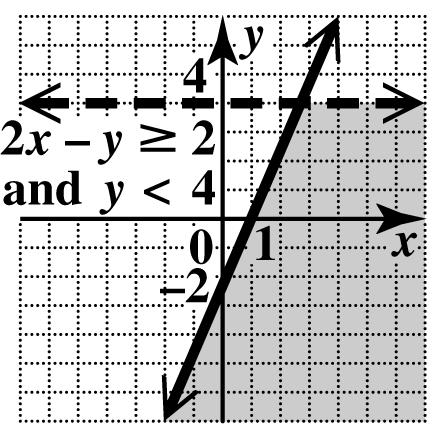
42. Graph 33 xy−= as a solid line through (1, 0) and () 0, 3. Test (0, 0).
? 3(0)03
03False −≥ ≥
The graph is the region that does not contain (0, 0).
Graph 3 y = as a dashed horizontal line through (0, 3). The graph of the inequality is the region below the dashed line. Shade the region that includes the overlap of the two graphs.
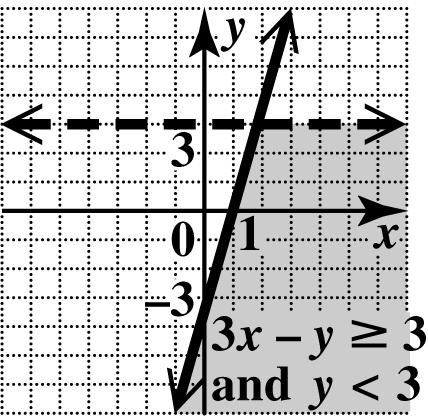
43. Graph 5, xy+=− which has intercepts () 5, 0 and () 0, 5, as a dashed line. Test (0, 0), which yields 05, >− a true statement. Shade the region that includes (0, 0).
Graph 2 y =− as a dashed horizontal line. Shade the region below 2. y =− The required graph of the intersection is the region common to both graphs.
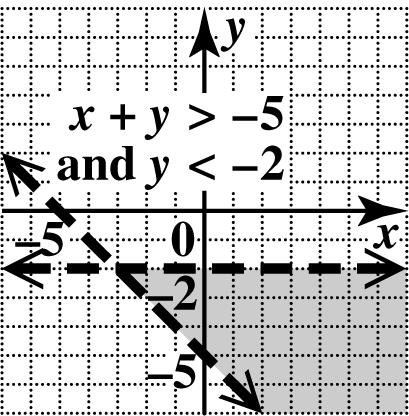
44. Graph the dashed line 6410 xy−= through 5 ,0 3 ⎛⎞ ⎜⎟ ⎝⎠ and 5 0,. 2 ⎛⎞ ⎜⎟ ⎝⎠ Test (0, 0).
? 6(0)4(0)10 01True −< <
The graph includes the region that includes (0, 0).
Graph the dashed horizontal line 2 y = through (0, 2). The graph includes the region above the line. Shade the region that includes the overlap of the two graphs.
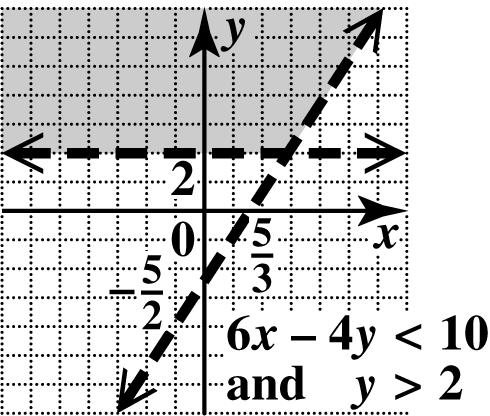
45. ||3 x < can be rewritten as 33. x −<< The boundaries are the dashed vertical lines 3 x =− and 3. x = Since x is between 3 and 3, the graph includes all points between the lines.
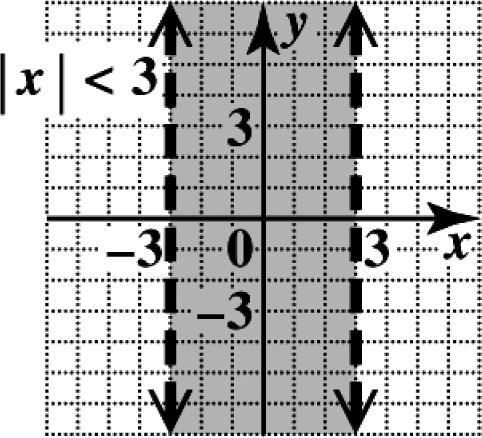
46. ||5 y < can be rewritten as 55. y −<< The boundaries are the dashed horizontal lines 5 y =− and 5. y = Since y is between 5 and 5, the graph includes all points between the lines.
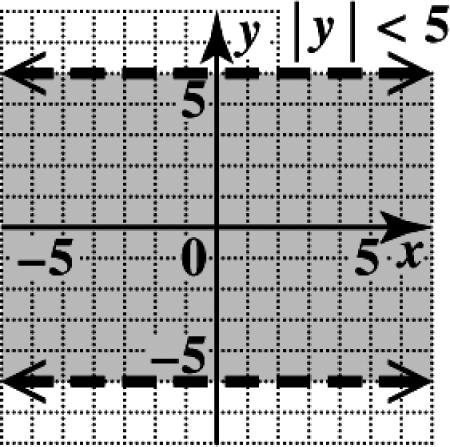
47. |1|2 x +< can be rewritten as the following.
212 31 x x −<+< −<<
The boundaries are the dashed vertical lines 3 x =− and 1. x = Since x is between 3 and 1, the graph includes all points between the lines.
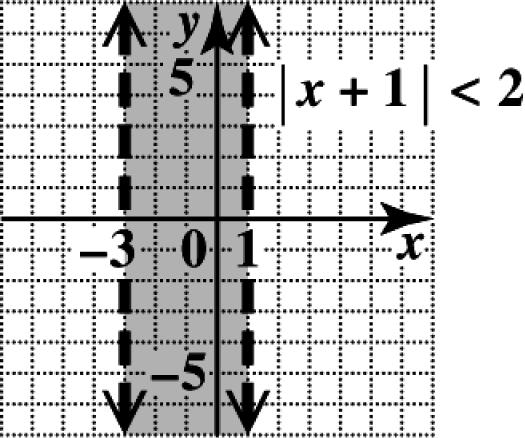
48. |3|2 y −< can be rewritten as the following.
232 15 y y −<−< <<
The boundaries are the dashed horizontal lines 1 y = and 5. y = Since y is between 1 and 5, the graph includes all points between the lines.
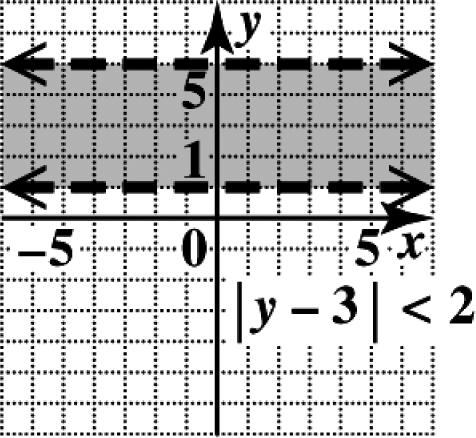
49. Graph the solid line 1, xy−= which crosses the y-axis at 1 and the x -axis at 1. Use (0, 0) as a test point, which yields 01, ≥ a false statement. Shade the region that does not include (0, 0).
Now graph the solid line 2. y = Since the inequality is 2, y ≥ shade above this line. The required graph of the union includes all the shaded regions—that is, all the points that satisfy either inequality.
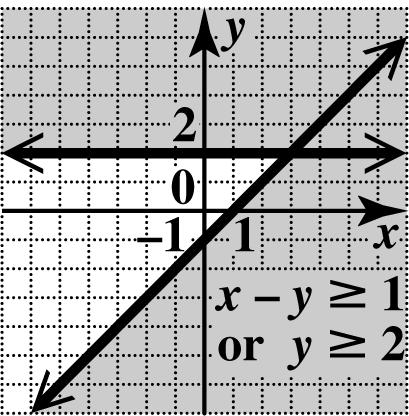
50. Graph the solid line 2 xy+= through (2, 0) and (0, 2). Use (0, 0) as a test point, which yields 02, ≤ a true statement. Shade the region that includes (0, 0).
Graph the solid horizontal line 3 y = through (0, 3). Shade the region above the line. The required graph of the union includes all the shaded regions—that is, all the points that satisfy either inequality.
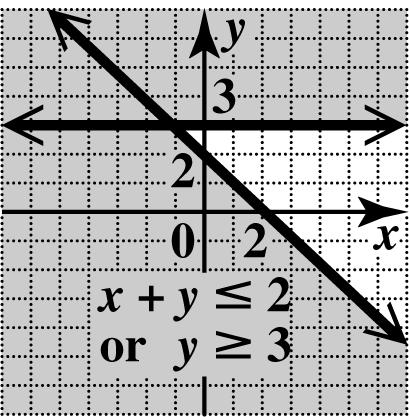
51. Graph 2,xy −= which has intercepts (2, 0) and (0, 2 ), as a dashed line. Test (0, 0), which yields 20,−> a false statement. Shade the region that does not include (0, 0).
Graph 1 x = as a dashed vertical line. Shade the region to the left of 1. x =
The required graph of the union includes all the shaded regions—that is, all the points that satisfy either inequality.
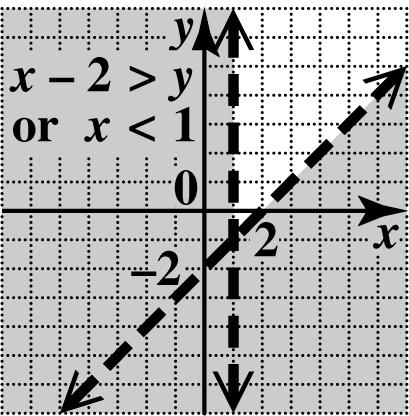
52. Graph the dashed line 3 xy += through () 3,0 and (0, 3). Use (0, 0) as a test point, which yields 30, < a false statement. Shade the region that does not include (0, 0).
Graph the dashed vertical line 3 x = through (3, 0). Shade the region to the right of the line. The required graph of the union includes all the shaded regions—that is, all the points that satisfy either inequality.
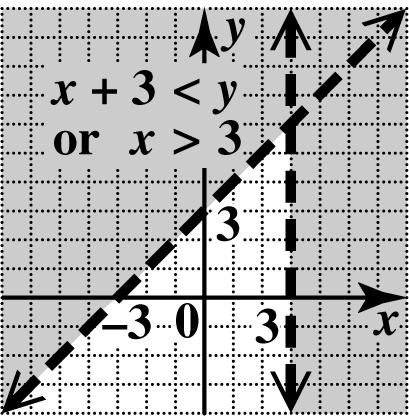
53. Graph 326, xy+= which has intercepts (2, 0) and (0, 3), as a dashed line. Test (0, 0), which yields 06, < a true statement. Shade the region that includes (0, 0).
Graph 22,xy−= which has intercepts (2, 0) and ()0,1, as a dashed line. Test (0, 0), which yields 02, > a false statement. Shade the region that does not include (0, 0). The required graph of the union includes all the shaded regions—that is, all the points that satisfy either inequality.
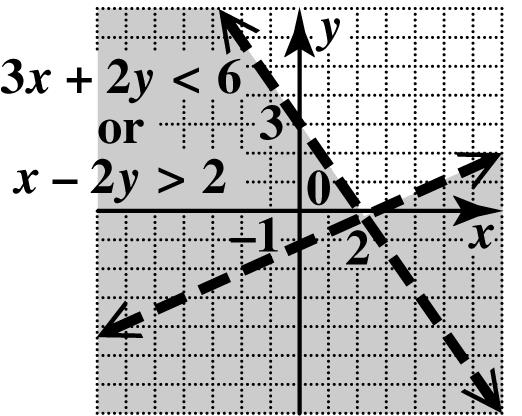
54. Graph the solid line 1 xy−= through (1, 0) and ()0,1. Test (0, 0), which yields 01, ≥ a false statement. Shade the region that does not include (0, 0).
Graph the solid line 4 xy+= through (4, 0) and (0, 4). Test (0, 0), which yields 04, ≤ a true statement. Shade the region that includes (0, 0). The required graph of the union includes all the shaded regions—that is, all the points that satisfy either inequality.
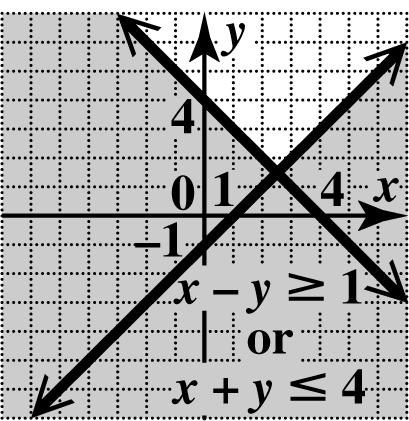
55. “A factory can have nomorethan 200 workers on a shift but must have atleast 100” can be translated as 200 x ≤ and 100. x ≥ “Must manufacture atleast 3000 units” can be translated as 3000. y ≥
56.
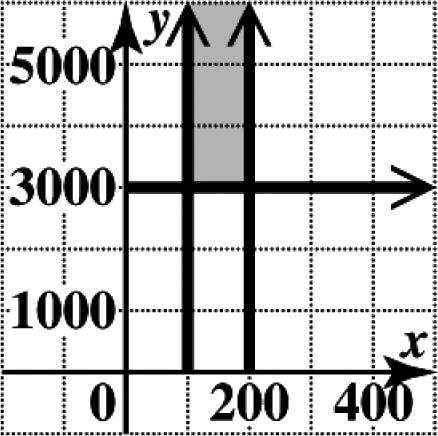
57. The total daily cost C consists of $50 per worker and $100 to manufacture one unit, so 50100. Cxy =+
58. Some examples of points in the shaded region are (150, 4000), (150, 5000), (120, 3500), and (180, 6000). Some examples of points on the boundary are (100, 5000), (150, 3000), and (200, 4000). The corner points are (100, 3000) and (200, 3000).
59. (x,y) 50100xyC += (150, 4000) 50(150)100(4000)407,500 += (120, 3500) 50(120)100(3500)356,000 += (180, 6000) 50(180)100(6000)609,000 += (100, 5000) 50(100)100(5000)505,000 += (150, 3000) 50(150)100(3000)307,500 += (200, 4000) 50(200)100(4000)410,000 += (100, 3000) (least value) 50(100)100(3000)305,000 += (150, 5000) 50(150)100(5000)507,500 += (200, 3000) 50(200)100(3000)310,000 +=
60. The company should use 100 workers and manufacture 3000 units to achieve the least possible cost.
2.5 Introduction to Relations and Functions
Classroom Examples, Now Try Exercises
1. The numbers in the table define a relation between x and y. They can be written as {()()()()} 4,0,0,2,3,1,5,1.
N1. The data in the table defines a relation between the average gas price per gallon and the year. It can be written as {() () ()()} 2000,1.56, 2005,2.34, 2010,2.84, 2015,3.39.
2. (a) {(0,3),(1,2),(1,3)}
The last two ordered pairs have the same x-value paired with twodifferenty-values (1 is paired with both 2 and 3), so this relation isnotafunction.
(b) {(5, 4), (6, 4), (7, 4)}
The relation isafunction because for each different x-value there is exactly one y-value. It is acceptable to have different x-values paired with the same y-value.
N2. (a) {(1, 5), (3, 5), (5, 5)}
The relation isafunction because for each different x-value there is exactly one y-value. It is acceptable to have different x-values paired with the same y-value.
(b) {(1,3),(0,2),(1,6)}
The first and last ordered pairs have the samex-value paired with twodifferent y-values (1 is paired with both 3 and 6), so this relation isnotafunction
3. The domain of this relation is the set of all first components—that is, {0, 1, 2, 3, 4}. The range of this relation is the set of all second components—that is, {0, 3.50, 7.00, 10.50, 14.00}. This relation isafunction because for each different first component, there is exactly one second component.
N3. (a) {(2, 2), (2, 5), (4, 8)}
The first two ordered pairs have the same x-value paired with twodifferenty-values (2 is paired with both 2 and 5), so this relation isnotafunction. The domain is {2, 4}, and the range is {2, 5, 8}.
(b) The domain of this relation is the set of all first components—that is, {5, 10, 20, 40}. The range of this relation is the set of all second components—that is, {40, 80, 160, 320}. This relation isafunction because for each different first component, there is exactly one second component.
4. The arrowheads indicate that the graph extends indefinitely left and right, as well as downward. The domain includes all real numbers, written (,).
−∞∞ Because there is a greatest y -value, 4, the range includes all numbers less than or equal to 4, ( ] ,4.−∞
N4. The arrowheads indicate that the graph extends indefinitely left and right, as well as upward. The domain includes all real numbers, written (,). −∞∞ Because there is a least y-value, 2, the range includes all numbers greater than or equal to2,[2,). −−∞
5. Any vertical line would intersect the graph at most once, so the relation is a function.
N5. A vertical line intersects the graph more than once, so the relation is not a function.
6. (a) 27yx=−+ is a function because each value of x corresponds to exactly one value of y. Its domain is the set of all real numbers, (,). −∞∞
(b) 56yx=− is a function because each value of x corresponds to exactly one value of y. Since the quantity under the radical must be nonnegative, the domain is the set of real numbers that satisfy the condition 560 56 6 . 5 x x x
Therefore, the domain is 6 ,. 5
(c) 4 yx = is not a function. If 1, x = for example, 4 1 y = and 1or1.yy==− Since 4 y must be nonnegative, the domain is the set of nonnegative real numbers, [0,). ∞
(d) 42yx≥+ is not a function because if 0, x = then 2. y ≥ Thus, the x -value 0 corresponds to many y -values. Its domain is the set of all real numbers, (,). −∞∞
(e) 6 53 y x = +
Given any value of x in the domain, we find y by multiplying by 3, adding 5, and then dividing the result into 6. This process produces exactly one value of y for each value in the domain, so the given equation defines a function. The domain includes all real numbers except those that make the denominator 0. We find those numbers by setting the denominator equal to 0 and solving for x. 530 35 5 3 x x x += =− =−
The domain includes all real numbers except 5 , 3 written as 55 ,,. 33
Copyright © 2016 Pearson Education, Inc.
N6. (a)
43yx=− is a function because each value of x corresponds to exactly one value of y Its domain is the set of all real numbers, (,). −∞∞
(b) 24yx=− is a function because each value of x corresponds to exactly one value of y. Since the quantity under the radical must be nonnegative, the domain is the set of real numbers that satisfy the condition 240
24 2. x x x −≥ ≥ ≥
Therefore, the domain is [ ) 2,. ∞
(c) 1 2 y x =
Given any value of x in the domain, we find y by subtracting 2 and then dividing the result into 1. This process produces exactly one value of y for each value in the domain, so the given equation defines a function. The domain includes all real numbers except those that make the denominator 0. We find those numbers by setting the denominator equal to 0 and solving for x.
20 2 x x −= =
The domain includes all real numbers except 2, written as (,2)(2,). −∞∪∞
(d) 31yx<+ is not a function because if 0, x = then 1. y < Thus, the x -value 0 corresponds to many y -values. Its domain is the set of all real numbers, (,). −∞∞
Exercises
1. A relation is any set of ordered pairs {()} , . xy
2. A function is a relation in which for each distinct value of the first component of the ordered pairs, there is exactly one value of the second component.
3. In a relation {()} , , xy the domain is the set of x-values, and the range is the set of y-values.
4. The relation {()()()()} 0, 2, 2, 1, 2,4, 5, 3 doesnot define a function. The set { } 0, 2, 5 is its
domain, and the set { } 2, 1, 4, 3 is its range
5. Consider the function 50,dt = where d represents distance and t represents time. The value of d depends on the value of t, so the variable t is the independent variable, and the variable d is the dependent variable.
6. The vertical line test is used to determine whether a graph is that of a function. It says that any vertical line can intersect the graph of a function in no more than one point.
7. The numbers in the table define a relation between x and y. They can be written as {()()()} 2,2,2,0,2,1.
8. The numbers in the table define a relation between x and y. They can be written as {()()()} 1,1,0,1,1,1.
9. The data in the table defines a relation between the average movie ticket price and year. {() () ()()} 1960, 0.76, 1980, 2.69, 2000, 5.39, 2013, 8.38
10. The data in the table defines a relation between the average ACT composite score and the year. {() () ()()} 2010, 21.0, 2011, 21.1, 2012, 21.1, 2013, 20.9
11. The mapping defines a relation. It can be written as {()()()()()} A,4, B,3, C,2, D, 1, F, 0.
12. The mapping defines a relation. It can be written as {()()()()()} A,1, E,5, I,9, O, 15, U, 21.
13. We can represent this set of ordered pairs by plotting them on a graph.
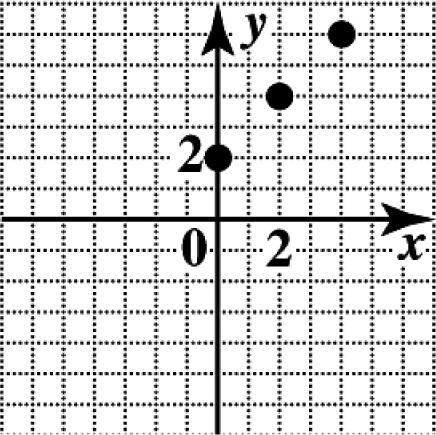
14. We can represent this table as a set of ordered pairs: {(1,3), (0,1), (1, 1), (3, 3)}.
Copyright © 2016 Pearson Education,
15. We can represent the diagram in table form.
16. No, the same x -value, 3, is paired with two different y-values, 4 and 1.
17. The relation is a function since for each x-value, there is only one y -value.
The domain is the set of x -values: {5, 3, 4, 7}.
The range is the set of y -values: {1, 2, 9, 6}.
18. The relation is a function since for each x-value, there is only one y -value.
The domain is the set of x -values: {8, 5, 9, 3}.
The range is the set of y -values: {0, 4, 3, 8}.
19. The relation is not a function since the x -value 2 has two different y -values associated with it, 4 and 5.
The domain is the set of x -values: {2, 0}.
The range is the set of y -values: {4, 2, 5}.
20. The relation is not a function since the x -value 9 has two different y -values associated with it, 2 and 2.
The domain is the set of x -values: { } 9, 3.
The range is the set of y -values: { } 2, 5, 2.
21. The relation is a function since for each x-value, there is only one y -value.
The domain is the set of x -values: { } 3, 4, 2.
The range is the set of y -values: {1, 7}.
22. The relation is a function since for each x-value, there is only one y -value.
The domain is the set of x -values: { } 12, 10, 8.
The range is the set of y -values: {5, 3}.
23. The relation is not a function since the x -value 1 has two different y -values associated with it, 1 and 1. (A similar statement can be made for 2. x = )
The domain is the set of x -values: {1, 0, 2}.
The range is the set of y -values: { } 1, 1, 0, 4, 4.
24. The relation is a function since for each x-value, there is only one y -value.
The domain is the set of x -values: {2, 3, 4, 5}.
The range is the set of y -values: {5, 7, 9, 11}.
25. The relation can be described by the set of ordered pairs {(2, 1), (5, 1), (11, 7), (17, 20), (3, 20)}. The relation is a function since for each x-value, there is only one y-value.
The domain is the set of x -values: {2, 5, 11, 17, 3}.
The range is the set of y -values: {1, 7, 20}.
26. The relation can be described by the set of ordered pairs {(1,10),(2,15),(2,19),(3,19),(5,27)}.
The relation is not a function since the x -value 2 has two different y -values associated with it, 15 and 19.
The domain is the set of x -values: {1, 2, 3, 5}.
The range is the set of y -values: {10, 15, 19, 27}.
27. The relation can be described by the set of ordered pairs {(1,5),(1,2),(1,1),(1,4)}.
The relation is not a function since the x -value 1 has four different y -values associated with it, 5, 2, 1, and 4.
The domain is the set of x -values: {1}.
The range is the set of y -values: { } 5, 2, 1, 4.
28. The relation can be described by the set of ordered pairs {(4,4),(4,0),(4,4),(4,8)}.
The relation is not a function since the x -value 4 has four different y -values associated with it, 4, 0, 4, and 8.
The domain is the set of x -values: { } 4.
The range is the set of y -values: { } 4, 0, 4, 8.
29. The relation can be described by the set of ordered pairs
{(4,3),(2,3),(0,3),(2,3)}.
The relation is a function since for each x-value, there is only one y -value.
The domain is the set of x -values: {4, 2, 0, { } 4, 2, 02,.
The range is the set of y -values: { } 3.
30. The relation can be described by the set of ordered pairs {(3,6),(1,6),(1,6),(3,6)}.
The relation is a function since for each x-value, there is only one y -value. The domain is the set of x -values: { } 3, 1, 1, 3.
The range is the set of y -values: {6}.
31. The relation can be described by the set of ordered pairs {(2,2),(0,3),(3,2)}. The relation is a function since for each x-value, there is only one y -value.
The domain is the set of x -values: { } 2, 0, 3. The range is the set of y -values: {2, 3}.
32. The relation can be described by the set of ordered pairs {(1,3),(1,3),(4,0)}. The relation is a function since for each x-value, there is only one y -value.
The domain is the set of x -values: { } 1, 1, 4.
The range is the set of y -values: { } 3, 0.
33. Using the vertical line test, we find that any vertical line will intersect the graph at most once. This indicates that the graph represents a function. This graph extends indefinitely to the left () −∞ and indefinitely to the right (). ∞ Therefore, the domain is (,). −∞∞
This graph extends indefinitely downward () −∞ and indefinitely upward (). ∞ Thus, the range is (,). −∞∞
34. Using the vertical line test, we find that any vertical line will intersect the graph at most once. This indicates that the graph represents a function. This graph extends indefinitely to the left () −∞ and indefinitely to the right (). ∞
Therefore, the domain is (,). −∞∞
This graph extends indefinitely downward () −∞ and indefinitely upward (). ∞ Thus, the range is (,). −∞∞
35. Using the vertical line test shows that one vertical line intersects the graph and it is at every point. This indicates that the graph does not represent a function. The domain is { }2 because the x-value does not change, and the range is () , . −∞∞
36. Using the vertical line test, we find that any vertical line will intersect the graph at most once. This indicates that the graph represents a function. This graph extends indefinitely to the left () −∞ and indefinitely to the right (). ∞ Therefore, the domain is (,). −∞∞ The y-value of the graph is constant, so the range is { } 2.
37. Since a vertical line, such as 4, x =− intersects the graph in two points, the relation is not a function.
The domain is ( ] , 0, −∞ and the range is (,). −∞∞
38. The relation is not a function since a vertical line may intersect the graph in more than one point.
The domain is the set of x -values, [] 2, 2. The range is the set of y -values, [] 2, 2.
39. Using the vertical line test, we find that any vertical line will intersect the graph at most once. This indicates that the graph represents a function. This graph extends indefinitely to the left () −∞ and indefinitely to the right (). ∞ Therefore, the domain is (,). −∞∞
This graph extends indefinitely downward () −∞ and reaches a high point at 4. y = Therefore, the range is (,4]. −∞
40. Since any vertical line that intersects the graph intersects it in no more than one point, the relation represented by the graph is a function. The domain is [] 2, 2, and the range is [0, 4].
41. Since a vertical line can intersect the graph of the relation in more than one point, the relation is not a function.
The domain, the x-values of the points on the graph, is [4,4].
The range, the y -values of the points on the graph, is [] 3, 3.
42. Since a vertical line, such as 4, x = intersects the graph in two points, the relation is not a function.
The domain is [3, ∞), and the range is (,). −∞∞
43. For each x-value, there are multiple y-values associated with it, all of which are 2 or greater. Thus, this relation does not define a function. The domain is (,), −∞∞ and the range is [ ) 2, . ∞
44. For each y-value, there are multiple x-values associated with it, all of which are 3 or less. Thus, this relation does not define a function. The domain is ( ] , 3, −∞ and the range is () , . −∞∞
45. Each value of x corresponds to one y-value. For example, if 3, x = then 6(3)18. y =−=−
Therefore, 6 yx =− defines y as a function of x
Since any x- value, positive, negative, or zero, can be multiplied by 6, the domain is (,). −∞∞
46. Each value of x corresponds to one y-value. For example, if 3 x = then 9(3)27. y =−=−
Therefore, 9 yx =− defines y as a function of x.
Since any x- value, positive, negative, or zero, can be multiplied by 9, the domain is (,). −∞∞
47. For any value of x, there is exactly one value of y, so this equation defines a function. The domain is the set of all real numbers, (,). −∞∞
48. For any value of x, there is exactly one value of y, so this equation defines a function. The domain is the set of all real numbers, (,). −∞∞
49. Each value of x corresponds to one y-value. For example, if 3, x = then 2 39. y == Therefore,
2 yx = defines y as a function of x.
Since any x- value, positive, negative, or zero, can be squared, the domain is (,). −∞∞
50. Each value of x corresponds to one y-value. For example, if 3, x = then 3 327. y == Therefore, 3 yx = defines y as a function of x. Since any x-value, positive, negative, or zero, can be cubed, the domain is (,). −∞∞
51. The ordered pairs (64, 2) and (64,2) both satisfy the equation. Since one value of x, 64, corresponds to two values of y , 2 and 2, the relation does not define a function. Because x is equal to the sixth power of y, the values of x must always be nonnegative. The domain is [0, ∞).
52. The ordered pairs (16, 2) and (16,2) both satisfy the equation. Since one value of x, 16, corresponds to two values of y , 2 and 2, the relation does not define a function. Because x is equal to the fourth power of y, the values of x must always be nonnegative. The domain is [0, ∞).
53. For a particular x-value, more than one y-value can be selected to satisfy 4. xy+< Look at the given example. 2, 0
204True xy== +<
Now, if 2 x = and 1, y = then 214 +< is a true statement. Therefore, 4 xy+< does not define y as a function of x. The graph of 4 xy+< is equivalent to the graph of 4, yx<−+ which consists of the shaded region below the dashed line 4, yx=−+ which extends indefinitely from left to right. Therefore, the domain is (,). −∞∞
54. Let 1. x = 13 2 2 y y y −< −< >−
So for 1, x = y may be any number greater than 2. 3 xy−< does not define y as a function of x. The x-values may be any number. The domain is (,). −∞∞
55. For any value of x, there is exactly one corresponding value for y, so this relation defines a function. Since the radicand must be a nonnegative number, x must always be nonnegative. The domain is [0, ∞).
56. For any value of x, there is exactly one corresponding value for y, so this relation defines a function. Since the radicand must be a nonnegative number, x must always be nonnegative. The domain is [0, ∞).
57. 3 yx=− is a function because each value of x in the domain corresponds to exactly one value of y. Since the quantity under the radical must be nonnegative, the domain is the set of real numbers that satisfy the following condition.
30 3 x x −≥ ≥
Therefore, the domain is [3, ∞).
Copyright © 2016 Pearson Education,
58. 7 yx=− is a function because each value of x in the domain corresponds to exactly one value of y. Since the quantity under the radical must be nonnegative, the domain is the set of real numbers that satisfy the following condition.
70 7 x x −≥ ≥
Therefore, the domain is [7, ∞).
59. 42yx=+ is a function because each value of x in the domain corresponds to exactly one value of y. Since the quantity under the radical must be nonnegative, the domain is the set of real numbers that satisfy the following condition. 420 42 1 2 x x x +≥ ≥− ≥−
Therefore, the domain is 1 ,. 2
60. 29yx=+ is a function because each value of x in the domain corresponds to exactly one value of y. Since the quantity under the radical must be nonnegative, the domain is the set of real numbers that satisfy the following condition.
61. Given any value of x, y is found by adding 4 and then dividing the result by 5. This process produces exactly one value of y for each x-value in the domain, so the relation represents a function. The denominator is never 0, so the domain is (,). −∞∞
62. Given any value of x, y is found by subtracting 3 and then dividing the result by 2. This process produces exactly one value of y for each x-value in the domain, so the relation represents a function. The denominator is never 0, so the domain is (,).
63. Given any value of x, y is found by dividing that value into 2 and negating that result. This
process produces exactly one value of y for each x-value in the domain, so the relation represents a function. The domain includes all real numbers except those that make the denominator 0, namely 0. The domain is (,0)(0,). −∞∪∞
64. Given any value of x, y is found by dividing that value into 6 and negating that result. This process produces exactly one value of y for each x-value in the domain, so the relation represents a function. The domain includes all real numbers except those that make the denominator 0, namely 0. The domain is (,0)(0,). −∞∪∞
65. Given any value of x, y is found by subtracting 4 and then dividing the result into 2. This process produces exactly one value of y for each x-value in the domain, so the relation represents a function. The domain includes all real numbers except those that make the denominator 0, namely 4. The domain is (,4)(4,). −∞∪∞
66. Given any value of x, y is found by subtracting 2 and then dividing the result into 7. This process produces exactly one value of y for each x-value in the domain, so the relation represents a function. The domain includes all real numbers except those that make the denominator 0, namely 2. The domain is (,2)(2,). −∞∪∞
67. Rewrite 1 xy = as 1 y x = Note that x can never equal 0; otherwise the denominator would equal 0. The domain is (,0)(0,). −∞∪∞
Each nonzero x-value gives exactly one y-value. Therefore, 1 xy = defines y as a function of x
68. Rewrite 3 xy = as 3 y x = Note that x can never equal 0; otherwise the denominator would equal 0. The domain is (,0)(0,). −∞∪∞
Each nonzero x-value gives exactly one y-value. Therefore, 3 xy = defines y as a function of x
69. (a) Each year corresponds to exactly one percentage, so the table defines a function. (b) The domain is {2009, 2010, 2011, 2012, 2013}.
The range is {44.0, 43.4, 43.1, 42.9}.
(c) The range element that corresponds to 2012 is 42.9. The domain element that corresponds to 43.4 is 2010.
(d) Answers will vary. Two possible answers are (2010, 43.4) and (2013, 43.1).
70. (a) Each year corresponds to exactly one percentage, so the table defines a function.
(b) The domain is {2008, 2009, 2010, 2011, 2012}.
The range is {4.4, 4.2, 3.7, 2.8, 2.6}.
(c) The range element that corresponds to 2012 is 2.6. The domain element that corresponds to 2.8 is 2011.
(d) Answers will vary. Two possible answers are (2008, 4.4) and (2012, 2.6).
2.6 Function Notation and Linear Functions
Classroom Examples, Now Try Exercises
1. (a) ()62
(3)6(3)2Replace with 3 182Multiply. 20Subtract. fxx fx. =− −=−−−
(b) ()62
(0)6(0)2Replace with 0. 02Multiply. 2Subtract. fxx fx =− =− =− =−
N1. (a) ()43
(2)4(2)3Replace with 2 83Multiply. 5Add. fxx fx. =+ −=−+− =−+ =−
(b) ()43
(0)4(0)3Replace with 0 03Multiply. 3Add. fxx fx. =+ =+ =+ =
2. (a) ()() () () 2 2 ()33 (3)3333 3993 315 fxxx f f f =−++ −=−−+−+ −=−−+ −=−
(b) ()() () 2 2 2 ()33 ()33 33 fxxx fttt fttt =−++ =−++ =−++
N2. (a) () 2 2 241 (2)2(2)4(2)1 88117 fxxx f =−+ −=−−−+ =++=
(b) () 2 2 241 ()241 fxxx faaa =−+ =−+
3. ()51 (2)5(2)1 5101 59 gxx gtt t t =− +=+− =+− =+
N3. ()85 (2)8(2)5 8165 821 gxx gaa a a =− −=−− =−− =−
4. (a) When 2, x = 6, y = so (2)6. f =
(b) 2 2 () (2)(2)(4)4 fxx f =− =−=−=−
N4. (a) When 1, x =− 4, y = so (1)4. f −=
(b) 2 2 ()12 (1)(1)1211211 fxx f =− −=−−=−=−
5. (a) When 2, x = 1, y = so (2)1. f =
(b) When 2, x =− 3, y = so (2)3. f −=
(c) ()0fx = is equivalent to 0, y = and 0 y = when 4. x =
N5. (a) When 1, x =− 0, y = so (1)0. f −=
(b) ()2fx = is equivalent to 2, y = and 2 y = when 1. x =
6. 2 43xy−= Solve for y. 2 2 2 43 133 or 444 yx x yxy −=−+ =−=
Copyright © 2016 Pearson Education, Inc.
Replace y with f(x).
2 2 2 3 () 4 (1)31321 (1) 4442 3 () 4 x fx f faa = ====− =
N6. 2 45 xy −+=
Solving for y gives us 2 45.yx=+
Replace y with f(x).
2 2 2 ()45 (3)4(3)536541 ()45 fxx f fhh =+ −=−+=+= =+
7. The graph of ()1.5fx =− is a horizontal line.
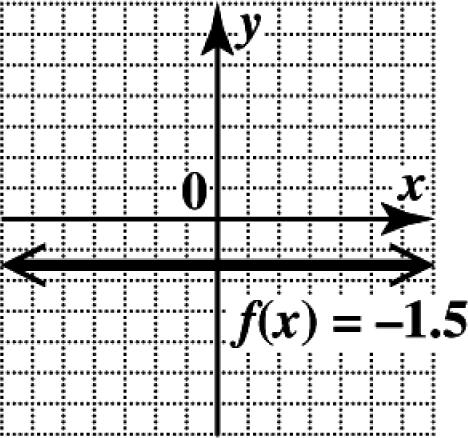
The domain is (,) −∞∞ and the range is {1.5}.
N7. The graph of 1 ()2 3 gxx=− is a line with slope 1 3 and y-intercept () 0, 2.
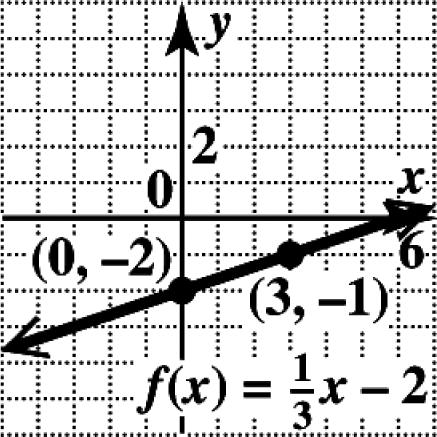
The domain and range are () , . −∞∞
Exercises
1. To emphasize that “y is a function of x” for a given function f, we use function notation and write ()yfx = Here, f is the name of the function, x is a value from the domain, and ()fx is a function value (or y-value) that corresponds to x. We read ()fx as “f of x” (or “f at x”).
2. For a function f, the notation () 3 f means the value of the dependent variable when the independent variable is 3. This is choice B.
3. The equation 24 xy+= has a straight line as its graph. One point that lies on the graph is () 3, 2. If we solve the equation for y and use function notation, we have a linear function, () 24.fxx=−+ For this function, ()32, f =− meaning that the point () 3, 2 lies on the graph of the function.
4. Choice A, 15 (), 44fxx=− is the only choice that defines y as a linear function of x. 5. ()34 (0)3(0)4 04 4 fxx f =−+ =−+ =+ =
6. 2 2 ()41 (0)(0)4(0)1 001 1 gxxx g =−++ =−++ =++ =
7. ()34 (3)3(3)4 94 13 fxx f =−+ −=−−+ =+ = 8. ()34 (5)3(5)4 154 19 fxx f =−+ −=−−+ =+ =
9. 2 2 ()41 (2)(2)4(2)1 (4)81 11 gxxx g =−++ −=−−+−+ =−−+ =− 10. 2 2 ()41 (1)(1)4(1)1 (1)41 4 gxxx g =−++ −=−−+−+ =−−+ =−
Copyright © 2016 Pearson Education, Inc.
11. 2 2 ()41 (3)(3)4(3)1 9121 4 gxxx g =−++ =−++ =−++ =
12. 2 2 ()41 (10)(10)4(10)1 100401 59 gxxx g =−++ =−++ =−++ =−
13. ()34 (100)3(100)4 3004 296 fxx f =−+ =−+ =−+ =−
14. ()34 (100)3(100)4 3004 304 fxx f =−+ −=−−+ =+ =
15. ()34 11 34 33 14 3 fxx f =−+ ⎛⎞⎛⎞=−+⎜⎟⎜⎟ ⎝⎠⎝⎠ =−+ =
16. ()34 77 34 33 74 3 fxx f =−+ ⎛⎞⎛⎞=−+⎜⎟⎜⎟ ⎝⎠⎝⎠ =−+ =−
17. 2 2 ()41 (0.5)(0.5)4(0.5)1 0.2521 2.75 gxxx g =−++ =−++ =−++ =
18. 2 2 ()41 (1.5)(1.5)4(1.5)1 2.2561 4.75 gxxx g =−++ =−++ =−++ =
19. ()34 ()3()4 34 fxx fpp p =−+ =−+ =−+
20. 2 2 ()41 ()41 gxxx gkkk =−++ =−++
21. ()34 ()3()4 34 fxx fxx x =−+ −=−−+ =+
22. 2 2 2 ()41 ()()4()1 41 gxxx gxxx xx =−++ −=−−+−+ =−−+
23. ()34 (2)3(2)4 364 32 fxx fxx x x =−+ +=−++ =−−+ =−−
24. ()34 (2)3(2)4 364 310 fxx fxx x x =−+ −=−−+ =−++ =−+
25. ()34 (21)3(21)4 634 61 fxx ftt t t =−+ +=−++ =−−+ =−+
26. ()34 (32)3(32)4 964 910 fxx ftt t t =−+ −=−−+ =−++ =−+
27. 2 2 ()41 ()41 gxxx g πππ =−++ =−++
28. 2 2 ()41 ()41 gxxx gttt =−++ =−++
29. ()34 ()3()4 334 fxx fxhxh xh =−+ +=−++ =−−+
30. ()34 ()3()4 334 fxx fabab ab =−+ +=−++ =−−+
Copyright © 2016 Pearson Education, Inc.
=−++
31. 2 2 2 ()41 41 333 4 1 393 gxxx ppp g ppp g =−++
=−++
32. 2 2 2 ()41 111 41 114 1 gxxx g xxx g xx x =−++ ⎛⎞⎛⎞⎛⎞ =−++ ⎜⎟⎜⎟⎜⎟
=−++
33. (a) When 2, x = 1, y =− so (2)1. f =−
(b) When 1, x =− 1, y =− so (1)1. f −=−
34. (a) When 2, x = 5, y =− so (2)5. f =−
(b) When 1, x =− 5, y =− so (1)5. f −=−
35. (a) When 2, x = 2, y = so (2)2. f =
(b) When 1, x =− 3, y = so (1)3. f −=
36. (a) When 2, x = 5, y = so (2)5. f =
(b) When 1, x =− 11, y = so (1)11. f −=
37. (a) When 2, x = 15, y = so (2)15. f =
(b) When 1, x =− 10, y = so (1)10. f −=
38. (a) When 2, x = 1, y = so (2)1. f =
(b) When 1, x =− 7, y = so (1)7. f −=
39. (a) When 2, x = 4, y = so (2)4. f =
(b) When 1, x =− 1, y = so (1)1. f −=
40. (a) When 2, x = 0, y = so (2)0. f =
(b) When 1, x =− 3, y =− so (1)3. f −=−
41. (a) The point (2, 3) is on the graph of f, so (2)3. f =
(b) The point (1,3) is on the graph of f, so (1)3. f −=−
42. (a) The point (2, 2) is on the graph of f, so (2)2. f =
(b) The point (1,4) is on the graph of f, so (1)4. f −=−
43. (a) The point (2,3) is on the graph of f, so (2)3. f =−
(b) The point (1,2) is on the graph of f, so (1)2. f −=
44. (a) The point (2,2) is on the graph of f, so (2)2. f =−
(b) The point (1,4) is on the graph of f, so (1)4. f −=
45. (a) ()3:fx = when 3, y = 2 x =
(b) ()1:fx =− when 1, y =− 0 x =
(c) ()3:fx =− when 3, y =− 1 x =−
46. (a) ()4:fx = when 4, y = 3 x =
(b) ()2:fx =− when 2, y =− 0 x =
(c) ()0:fx = when 0, y = 1 x =
47. (a) Solve the equation for y. 312 312 12 3 xy yx x y += =− =
Since (),yfx = 121 ()4. 33 x fxx==−+
(b) 1239 (3)3 33 f ===
48. (a) Solve the equation for y 48 48 8 4 81 ()2 44 xy yx x y x fxx −= −=− = ==−
(b) 8355 (3) 444 f ===−
49. (a) Solve the equation for y. 2 2 23 32 yx yx += =−
Since (),yfx = 2 ()32.fxx =−
Copyright © 2016 Pearson Education,
(b) 2 (3)32(3) 32(9) 15 f =− =− =−
50. (a) Solve the equation for y. 2 2 2 32 23 ()23 yx yx fxx −= =+ =+
(b) 2 (3)23(3) 23(9) 29 f =+ =+ =
51. (a) Solve the equation for y 438 384 84 3 xy yx x y −= −=− = Since (),yfx = 8448 (). 333 x fxx==−
(b) 84(3)812 (3) 33 44 33 f == ==
52. (a) Solve the equation for y. 259 592 92 5 9229 () 555 xy yx x y x fxx −+= =+ + = + ==+
(b) 92(3) (3) 5 9615 3 55 f + = + ===
53. The graph will be a line. The intercepts are (0, 5) and 5 , 0. 2 ⎛⎞ ⎜⎟ ⎝⎠ The domain is (,). −∞∞ The range is (,). −∞∞
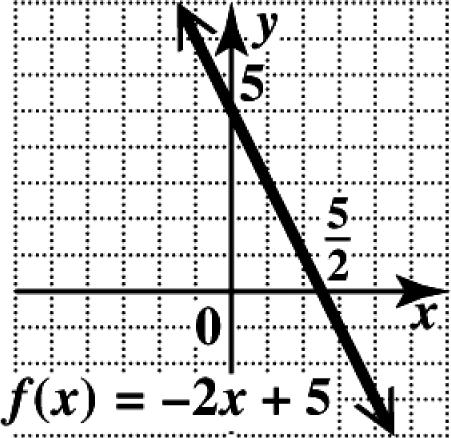
54. Using a y -intercept of (0, 1) and a slope of 4 4, 1 m == graph the line. From the graph we see that the domain is (,). −∞∞ The range is (,). −∞∞
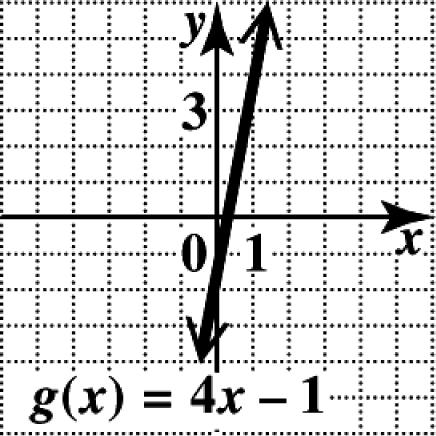
55. The graph will be a line. The intercepts are (0, 2) and (4,0). The domain is (,). −∞∞ The range is (,). −∞∞
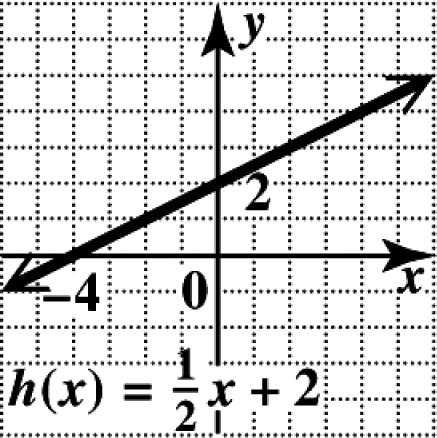
56. Using a y -intercept of (0, 1) and a slope of 1 , 4 m =− we graph the line. From the graph, we see that the domain is (,). −∞∞ The range is (,). −∞∞
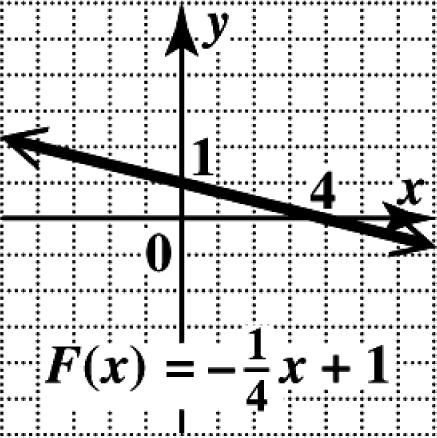
Copyright © 2016 Pearson Education, Inc.
57. This line includes the points (0, 0), (1, 2), and (2, 4). The domain is (,). −∞∞ The range is (,). −∞∞
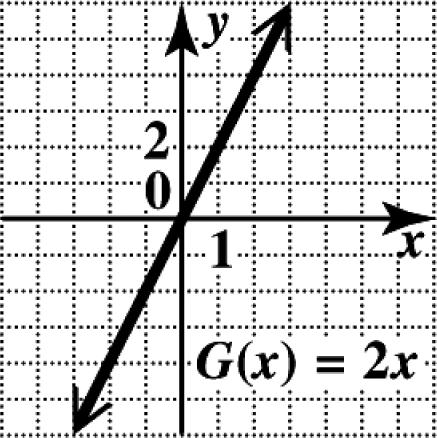
58. Using a y -intercept of (0, 0) and a slope of 3 3, 1 m =−= we graph the line. From the graph we see that the domain is (,). −∞∞ The range is (,). −∞∞
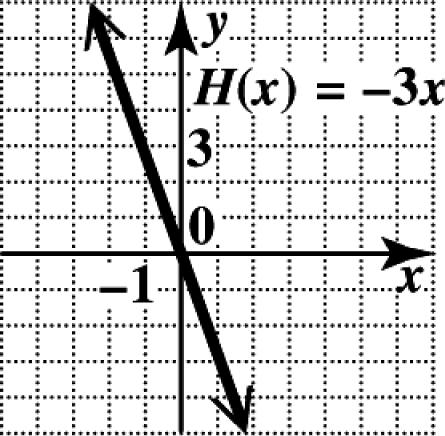
59. Using a y -intercept of (0, 4 ) and a slope of 0, m = we graph the horizontal line. From the graph we see that the domain is (,). −∞∞ The range is {4}.
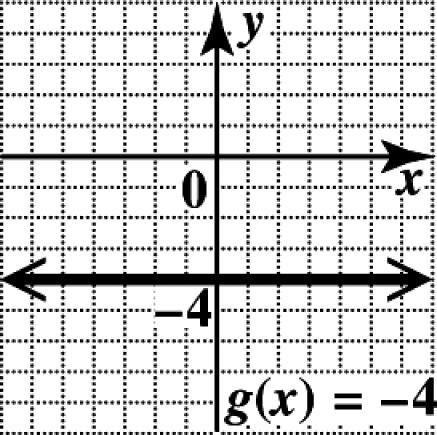
60. Draw the horizontal line through the point (0, 5). On the horizontal line the value of x can be any real number, so the domain is (,). −∞∞ The range is {5}.
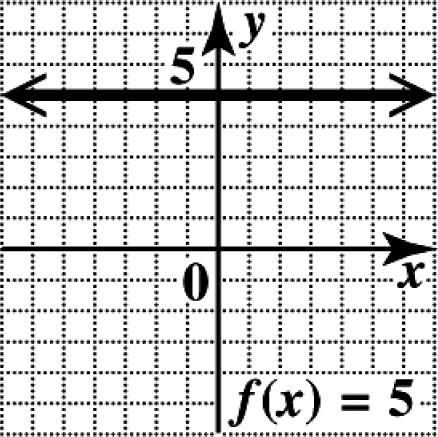
61. Draw the horizontal line through the point (0, 0). On the horizontal line the value of x can be any real number, so the domain is (,). −∞∞
The range is {0}.
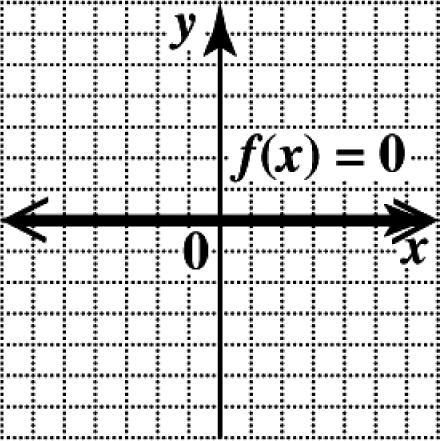
62. Draw the horizontal line through the point (0,2.5). On the horizontal line the value of x can be any real number, so the domain is (,). −∞∞ The range is {2.5}.
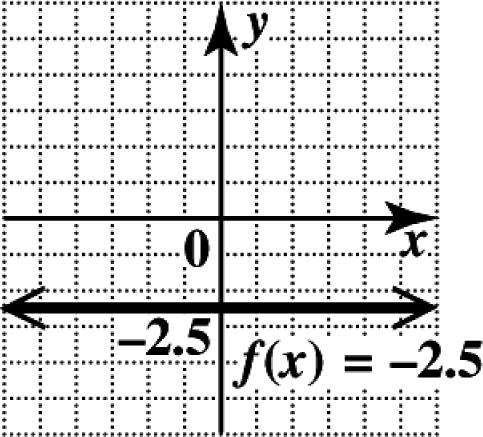
63. ()0,fx = or 0, y = is the x -axis.
64. No, because the equation of a line with an undefined slope is .xa = The ordered pairs have the form (a, y), where a is a constant and y is a variable. Thus, the number a corresponds to an infinite number of values of y.
65. (a) ()3.75 (3)3.75(3) 11.25(dollars) fxx f = = =
(b) 3 is the value of the independent variable, which represents a package weight of 3 pounds. f(3) is the value of the dependent variable representing the cost to mail a 3-lb package.
(c) The cost to mail a 5-lb package is 3.75(5)$18.75. = Using function notation, we have (5)18.75. f =
66. (a)
xf(x) 0 0 1 $2.50 2 $5.00 3 $7.50
(b) Since the charge equals the cost per mile, $2.50, times the number of miles, the linear function that gives a rule for the amount charged is ()$2.50. fxx =
Copyright © 2016 Pearson
(c) To graph ()yfx = for {0,1,2,3}, x ∈ plot the points (0, 0), (1, 2.50), (2, 5.00), and (3, 7.50) from the chart.
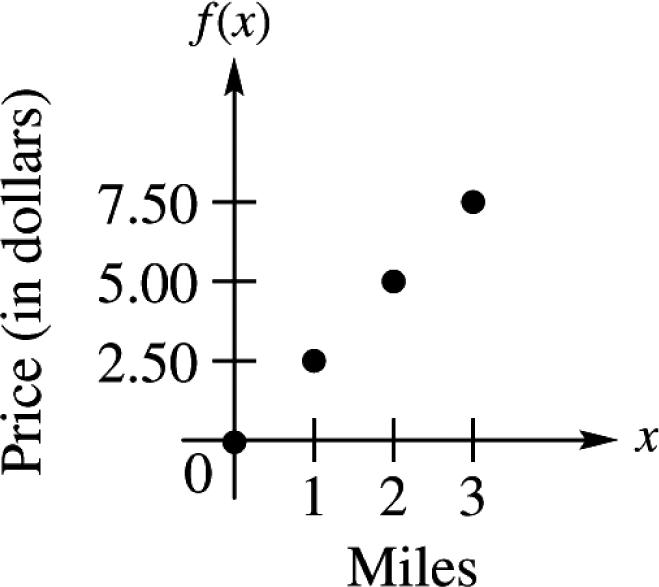
67. (a) ()12100fxx=+
(b) (125)12(125)100 15001001600 f =+ =+= The cost to print 125 t-shirts is $1600.
(c) ()1000 121001000 12900Subtract 100. 75Divide by 12. fx x x x = += = = In function notation, (75)1000. f = The cost to print 75 t-shirts is $1000.
68. (a) ()0.50150fxx=+
(b) (250)0.50(250)150 125150275 f =+ =+=
In function notation, (250)275. f =
(c) ()400 0.50150400
0.50250Subtract 150. 500Multiply by 2. fx x x x = += = = It costs $400 to drive a rental car 500 miles.
69. (a) (2)1.1 f =
(b) y is 2.5 when x is 5. So, if ()2.5,fx =− then 5. x =
(c) Let 11 (,)(0,3.5) xy = and 22 (,)(1,2.3). xy = Then
2.33.51.2 1.2. 101 m ===−
The slope is 1.2.
(d) When 0, x = y is 3.5, so the y-intercept is (0, 3.5).
(e) Use the slope-intercept form of the equation of a line and the information found in parts (c) and (d).
()
()1.23.5 fxmxb fxx =+ =−+
70. (a) (2)0.6 f =
(b) y is 2.1 when x is 3. So, if ()2.1,fx = then 3. x =
(c) Let 11 (,)(0,2.4) xy =− and 22 (,)(1,0.9). xy =− Then
0.9(2.4)1.5 1.5. 101 m ===
The slope is 1.5.
(d) When 0, x = y is 2.4, so the y-intercept is (0,2.4).
(e) Use the slope-intercept form of the equation of a line and the information found in parts (c) and (d).
()
()1.52.4 fxmxb fxx =+ =−
71. (a) The independent variable is t, the number of hours, and the possible values are in the set [0, 100]. The dependent variable is g, the number of gallons, and the possible values are in the set [0, 3000].
(b) The graph rises for the first 25 hours, so the water level increases for 25 hours. The graph falls for 50 t = to 75, t = so the water level decreases for 25 hours.
(c) There are 2000 gallons in the pool when 90. t =
(d) f(0) is the number of gallons in the pool at time 0. t = Here, (0)0, f = which means the pool is empty at time 0.
(e) (25)3000; f = After 25 hours, there are 3000 gallons of water in the pool.
72. (a) For every hour, there is one and only one megawatt reading. Thus, the graph passes the vertical line test, so it is the graph of a function.
(b) We start the day at midnight and end the day at midnight. The domain is [0, 24].
Copyright © 2016 Pearson Education, Inc.
(c) At 8 A M., it appears that the number of megawatts used is halfway between 1100 and 1300. So 1200 is a good estimate.
(d) The most electricity was used at 18 hours (6 P.M.) and the least electricity was used at 4 hours (4 A M.).
(e) (12)1800; f = At 12 noon, electricity use is 1800 megawatts.
73. (a) Since the length of a man’s femur is given, use the formula ()69.092.24. hrr =+ (56)69.092.24(56)Let 56. 194.53 hr =+= = The man is 194.53 cm tall.
(b) Use the formula ()81.692.39. htt =+ (40)81.692.39(40)Let 40. 177.29 ht =+= = The man is 177.29 cm tall.
(c) Since the length of a woman’s femur is given, use the formula ()61.412.32. hrr =+ (50)61.412.32(50)Let 50. 177.41 hr =+= = The woman is 177.41 cm tall.
(d) Use the formula ()72.572.53. htt =+ (36)72.572.53(36)Let 36.
163.65 ht =+= =
The woman is 163.65 cm tall.
74. (a) 2 2 ()0.91(3.14) (0.8)0.91(3.14)(0.8)
1.828736 fxx f = = =
To the nearest hundredth, the volume of the pool is 3 1.83m.
(b) 2 2 ()0.91(3.14)
2.8574 fxx f = = =
(1.0)0.91(3.14)(1.0)
To the nearest hundredth, the volume of the pool is 3 2.86m.
(c) 2 2 ()0.91(3.14) (1.2)0.91(3.14)(1.2)
fxx f = = =
4.114656
To the nearest hundredth, the volume of the pool is 3 4.11m.
(d) 2 2 ()0.91(3.14) (1.5)0.91(3.14)(1.5)
6.42915 fxx f = = =
To the nearest hundredth, the volume of the pool is 3 6.43m.
75. Because it falls from left to right, the slope is negative.
76. () 1563 3142 m ===−
The slope is 3 2
77. Parallel lines have the same slope, so their slope will be 3 2 Any perpendicular line will have a slope that is the negative reciprocal of 3 2 12 3 3 2
The slope of a perpendicular line will be 2 . 3
78. () 237 2037 037
3 7 3 yx x x x x x =−+ =−+ =−+ −=− = = The x-intercept is 7 ,0. 3 ⎛⎞ ⎜⎟ ⎝⎠
79. () 237 2307 207 27 7 2 yx y y y y =−+ =−+ =+ = =
The x-intercept is 7 0,. 2 ⎛⎞ ⎜⎟ ⎝⎠
80. () 37 22fxx=−+
Copyright © 2016 Pearson Education,
81. () () () () () 37 22 37 88 22 247 8 22 17 8 2 fxx f f f =−+ =−+ =−+ =−
82. () 37 22 37 8 22 233 22 233 23 3 fxx x x x x =−+ −=−+ −=− = =
Chapter 2 Review Exercises
1. For 0: x = 3(0)210 210 5(0,5) y y y += = =
For 0: y = 32(0)10 310 1010 , 0 33 x x x += = ⎛⎞ = ⎜⎟ ⎝⎠
For 2: x = 3(2)210 6210 24 2(2,2) y y y y += += = = For 2: y =− 32(2)10 3410 314 1414 , 2 33 x x x x +−= −= =
Plot the ordered pairs, and draw the line through them.
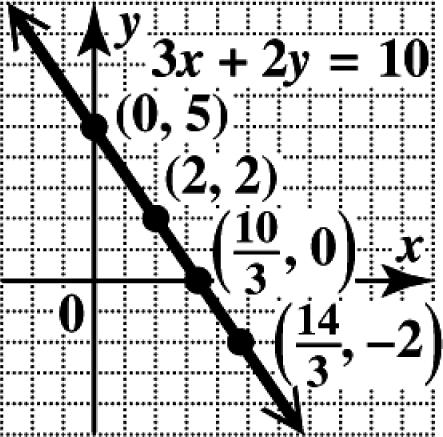
2. For2: x = 28 6 6(2,6) y y y −= −= =−−
For 3: y =− (3)8 38 5(5,3) x x x −−= += =−
For 3: x = 38 5 5(3,5) y y y −= −= =−−
For 2: y =− (2)8 28 6(6,2) x x x −−= +=
Copyright © 2016 Pearson Education, Inc.
Plot the ordered pairs, and draw the line through them.
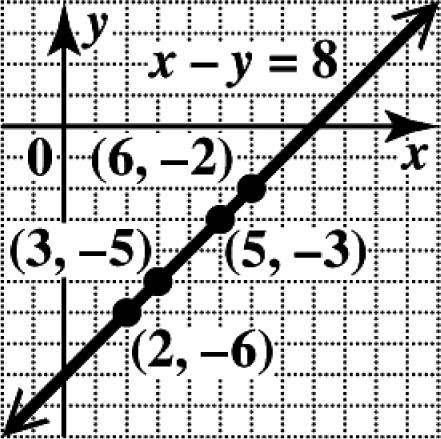
3. To find the x -intercept, let 0. y = 4312
43(0)12 412 3 xy x x x −= −= = =
The x-intercept is (3, 0).
To find the y -intercept, let 0. x = 4312
Plot the intercepts and draw the line through them.
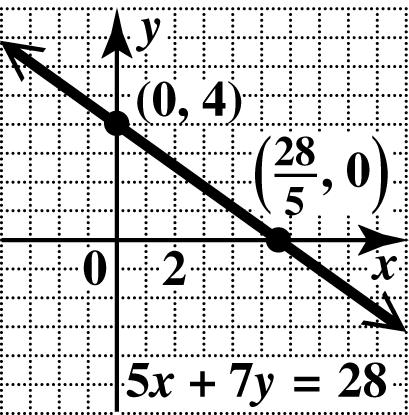
5. To find the x -intercept, let 0. y = 2520
25(0)20 220 10 xy x x x += += = =
The x-intercept is (10, 0).
To find the y -intercept, let 0. x = 2520
4(0)312
312 4 xy y y y −= −= −= =−
The y-intercept is (0, 4 ).
Plot the intercepts and draw the line through them.
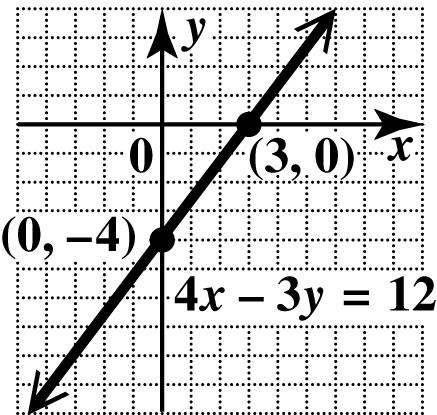
4. To find the x -intercept, let 0. y = 5728
57(0)28 528 28 5 xy x x x += += = =
The x-intercept is 28 ,0. 5 ⎛⎞
To find the y -intercept, let 0. x = 5728
5(0)728 728 4 xy y y y += += = =
The y-intercept is (0, 4).
2(0)520 520 4 xy y y y += += = =
The y-intercept is (0, 4).
Plot the intercepts and draw the line through them.
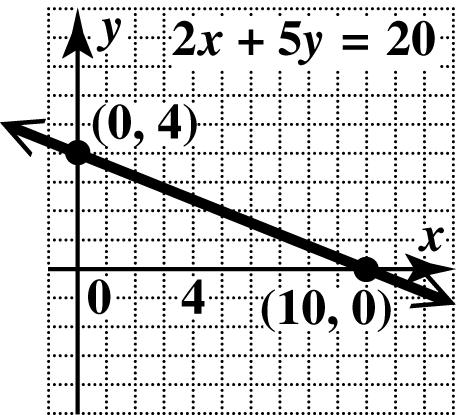
6. To find the x -intercept, let 0. y = 48 4(0)8 8 xy x x −= −= =
The x-intercept is (8, 0).
To find the y -intercept, let 0. x = 048 48 2 y y y −= −= =−
The y-intercept is () 0, 2.
Plot the intercepts and draw the line through them.
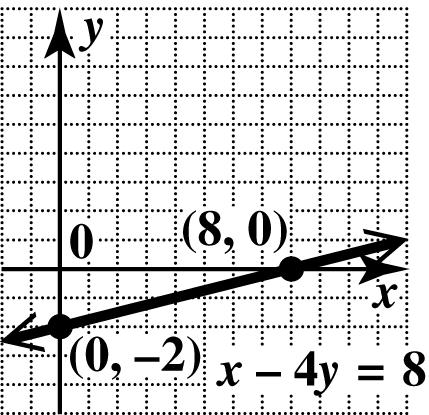
7. By the midpoint formula, the midpoint of the segment with endpoints (8,12) and (8, 16) is 88121604 ,,(0,2). 2222 −+−+ ⎛⎞⎛⎞ ==⎜⎟⎜⎟ ⎝⎠⎝⎠
8. By the midpoint formula, the midpoint of the segment with endpoints (0, 5 ) and (9, 8) is 0(9)589393 ,,,. 222222 +−−+− ⎛⎞⎛⎞⎛⎞ ==− ⎜⎟⎜⎟⎜⎟
9. changein5277 changein4(1)55 y m x ====−
10. 11 (,)(0,3) xy = and 22 (,)(2,4). xy =− 21 21 4311 2022 yy m xx ====−
11. The slope of 23yx=+ is 2, the coefficient of x
12. Write the equation in slope-intercept form. 345 435 35 44 xy yx yx −= −=−+ =−
The slope is 3 . 4
13. 5 x = is a vertical line and has undefined slope.
14. Write the equation in slope-intercept form. 325 25 33 yx yx =+ =+
The slope of 325 yx=+ is 2 ; 3 all lines parallel to it will also have a slope of 2 . 3
15. Solve for y 34 34 xy yx −= =−
The slope is 3; the slope of a line perpendicular to it is 1 3 since 1 31. 3 ⎛⎞ −=−⎜⎟ ⎝⎠
16. 459 Undefined 1(1)0 y m x ∆−−− === ∆−−−
This is a vertical line; it has undefined slope.
17. 1(1)21 3363 y m x ∆−− ====− ∆−−−
18. The x-intercept is (2, 0) and the y-intercept is (0, 2). The slope is changein202 1. changein022 y m x ====−
19. The line goes up from left to right, so it has positive slope.
20. The line goes down from left to right, so it has negative slope.
21. The line is vertical, so it has undefined slope.
22. The line is horizontal, so it has 0 slope.
23. To rise 1 foot, we must move 4 feet in the horizontal direction. To rise 3 feet, we must move 3(4)12 = feet in the horizontal direction.
24. Let 11 (,)(1980,21,000) xy = and 22 (,)(2012,51,017). xy = 51,01721,00030,017 average rate of change 2012198032 938 == ≈
The average rate of change is $938 per year (to the nearest dollar).
25. (a) Use the slope-intercept form with 1 3 m =− and 1. b =− 1 1 3 ymxb yx =+ =−− (b) 1 1 3 33 33 yx yx xy =−− =−− +=−
26. (a) Use the slope-intercept form with 0 m = and 2. b =− (0)2 2 ymxb yx y =+ =− =− (b) 2 y =− is already in standard form.
Copyright © 2016 Pearson Education, Inc.
27. (a) Use the point-slope form with 4 3 m =− and 11 (,)(2,7). xy = 11() 4 7(2) 3 48 7 33 429 33 yymxx yx yx yx −=− −=−− −=−+ =−+
(b) 429 33 3429 4329 yx yx xy =−+ =−+ +=
28. (a) Use the point-slope form with 3 m = and 11 (,)(1,4). xy =− 11() 43[(1)] 43(1) 433 37 yymxx yx yx yx yx −=− −=−− −=+ −=+ =+
(b) 37 37 37 yx xy xy =+ −+= −=−
29. (a) The equation of any vertical line is in the form . xk = Since the line goes through (2, 5), the equation is 2. x = (Slopeintercept form is not possible.)
(b) 2 x = is already in standard form.
30. (a) Find the slope. 4(5)9 9 121 y m x ∆−− ====− ∆−−
Use the point-slope form with 9 m =− and 11 (,)(2,5). xy =− 11() (5)9(2) 5918 913 yymxx yx yx yx −=− −−=−− +=−+ =−+
(b) 913 913 yx xy =−+ +=
31. (a) Find the slope. 6(1)7 2(3)5 y m x ∆−− === ∆−−
Use the point-slope form with 7 5 m = and 11 (,)(2,6). xy = 11() 7 6(2) 5 714 6 55 716 55 yymxx yx yx yx −=− −=− −=− =+
(b) 716 55 5716 7516 7516 yx yx xy xy =+ =+ −+= −=−
32. (a) From Exercise 18, we have 1 m =− and a y-intercept of (0, 2). The slope-intercept form is 12,or2.yxyx =−+=−+
(b) 2 2 yx xy =−+ +=
33. (a) Parallel to 43 xy−= and through (7, 1 ) Writing 43 xy−= in slope-intercept form gives us 43,yx=− which has slope 4. Lines parallel to it will also have slope 4. The line with slope 4 through (7, 1 ) is 11() (1)4(7) 1428 429. yymxx yx yx yx −=− −−=− +=− =−
(b) 429 429 429 yx xy xy =− −+=− −=
34. (a) Write the equation in slope-intercept form. 257 527 27 55 xy yx yx −= −=−+ =−
Copyright © 2016 Pearson Education, Inc.
27 55yx=− has slope 2 5 and is perpendicular to lines with slope 5 2 The line with slope 5 2 through (4, 3) is 11() 5 3(4) 2 5 310 2 5 13. 2 yymxx yx yx yx −=− −=−− −=−+ =−+
(b) 5 13 2 2526 5226 yx yx xy =−+ =−+ +=
35. The fixed cost is $159, so that is the value of b.
The variable cost is $47, so 47159.ymxbx=+=+
The cost of a one-year membership can be found by substituting 12 for x 47159.
47(12)159
564159723 yx y =+ =+ =+=
The cost is $723.
36. (a) Use (8, 2476) and (12, 2628).
26282476152 38 1284 y m x ∆− ==== ∆−
Use the point-slope form of a line. 11()
247638(8) 247638304 382172 yymxx yx yx yx −=− −=− −=− =+
The slope, 38, indicates that the revenue from skiing facilities increased by an average of $38 million each year from 2008 to 2012.
(b) The year 2010 corresponds to 10. x = 38(10)2172
38021722552 y =+ =+=
According to the equation from part (a), we estimate the revenue from skiing facilities to be $2552 million (to the nearest million).
37. Graph 3212 xy−= as a solid line through (0,6) and (4, 0). Use (0, 0) as a test point.
Since (0, 0) satisfies the inequality, shade the region on the side of the line containing (0, 0).
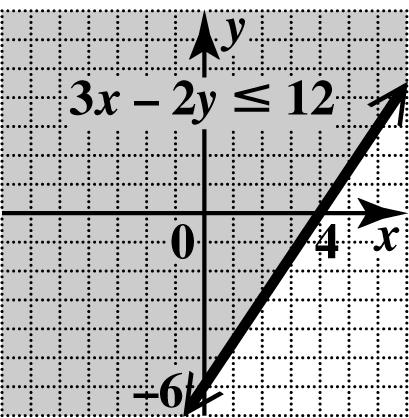
38. Graph 56 xy−= as a dashed line through (0,6) and 6 ,0. 5 ⎛⎞ ⎜⎟ ⎝⎠ Use (0, 0) as a test point.
Since (0, 0) does not satisfy the inequality, shade the region on the side of the line that does not contain (0, 0).
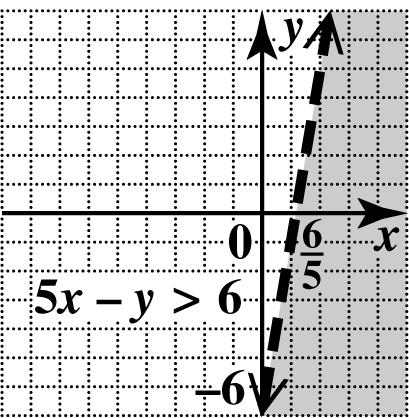
39. Graph 21 xy+= as a solid line through 1 ,0 2 ⎛⎞
and (0, 1), and shade the region on the side containing (0, 0) since it satisfies the inequality. Next, graph 2 xy = as a solid line through (0, 0) and (2, 1), and shade the region on the side containing (2, 0) since 22(0), > or 20, > is true. The intersection is the region where the graphs overlap.
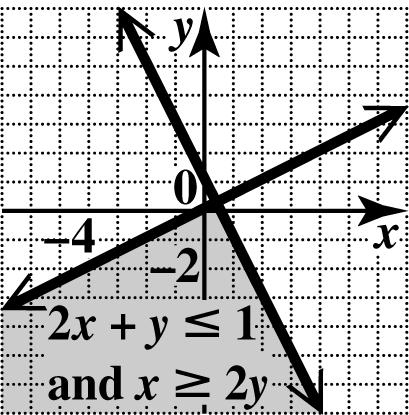
40. Graph 2 x = as a solid vertical line through (2, 0). Shade the region to the right of 2. x = Graph 2 y = as a solid horizontal line through (0, 2). Shade the region above 2. y = The graph of 2 or 2 xy≥≥ includes all the shaded regions.
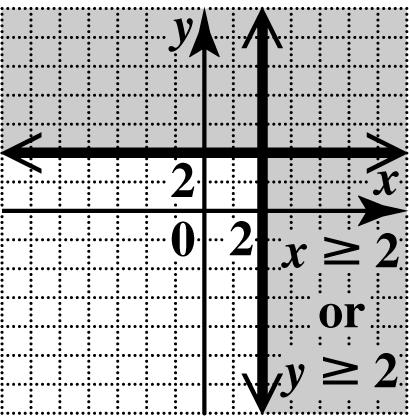
Copyright © 2016 Pearson Education, Inc.
41. The domain, the set of x-values, is {4,1}. The range, the set of y -values, is {2,2,5,5}. Since each x-value has more than one y-value, the relation is not a function.
42. The relation can be described by the set of ordered pairs {(9,32),(11,47),(4,47),(17,69),(25,14)}.
The relation is a function since for each x-value, there is only one y -value. The domain is the set of x -values: {9, 11, 4, 17, 25}.
The range is the set of y -values: {32, 47, 69, 14}.
43. The domain, the x-values of the points on the graph, is [4,4]. The range, the y-values of the points on the graph, is [0, 2]. Since a vertical line intersects the graph of the relation in at most one point, the relation is a function.
44. The x-values are negative or zero, so the domain is (,0]. −∞ The y-values can be any real number, so the range is (,). −∞∞ A vertical line, such as 3, x =− will intersect the graph twice, so by the vertical line test, the relation is not a function.
45. For any value of x, there is exactly one value of y, so the equation defines a function. The function is a linear function. The domain is the set of all real numbers, (,). −∞∞
46. For any value of x, there are many values of y For example, (1, 0) and (1, 1) are both solutions of the inequality that have the same x -value but different y-values. The inequality does not define a function. The domain is the set of all real numbers,(,). −∞∞
47. For any value of x, there is exactly one value of y, so the equation defines a function. The domain is the set of all real numbers, (,). −∞∞
48. Given any value of x, y is found by multiplying x by 4, adding 7, and taking the square root of the result. This process produces exactly one value of y for each x -value in the domain, so the equation defines a function. Since the radicand must be nonnegative,
49. The ordered pairs (4, 2) and (4,2) both satisfy the equation. Since one value of x, 4, corresponds to two values of y , 2 and 2, the equation does not define a function. Because x is equal to the square of y, the values of x must always be nonnegative. The domain is [0,). ∞
50. Given any value of x, y is found by subtracting 6 and then dividing the result into 7. This process produces exactly one value of y for each x-value in the domain, so the equation defines a function. The domain includes all real numbers except those that make the denominator 0, namely 6. The domain is (,6)(6,). −∞∪∞
51. 2 (0)2(0)3(0)66 f =−+−=−
52. 2 (2.1)2(2.1)3(2.1)6 8.826.368.52 f =−+− =−+−=−
53. 2 111 236 222 13 68 22 f ⎛⎞⎛⎞⎛⎞ −=−−+−−
=−−−=− 54. 2 ()236 fkkk=−+− 55. 2 2 2 20 2 2 xy yx yx −= −=− = Since 2 2,yx = 2 ()2.fxx = 2 2 ()2 (3)2(3) 2(9) 18 fxx f = = = =
56. Solve for y in terms of x 257 275 27 55 xy xy xy −= −= −= Thus, choice C is correct.
57. The graph of a constant function is a horizontal line.
58. (a) For each year, there is exactly one life expectancy associated with the year, so the table defines a function.
Copyright © 2016 Pearson
(b) The domain is the set of years—that is, {1960, 1970, 1980, 1990, 2000, 2010}. The range is the set of life expectancies— that is, {69.7, 70.8, 73.7, 75.4, 76.8, 78.7}.
(c) Answers will vary. Two possible answers are (1960, 69.7) and (2010, 78.7).
(d) (1980)73.7. f = In 1980, life expectancy at birth was 73.7 yr.
(e) Since (2000)76.8,2000. fx==
Chapter 2 Mixed Review Exercises
1. Determine the slope of both lines.
The lines are perpendicular because their slopes are negative reciprocals of each other.
2. Determine the slope of both lines.
The lines are parallel because their slopes are the same.
3. Use (2003, 46.8) and (2011, 32.7).
rate of change
The average rate of change is 1.8 lb per year. From 2003 to 2011 the per capita consumption of potatoes decreased by an average of 1.8 lb per year.
4. The point (0, 46.8) is the y-intercept, so the equation is 1.846.8.yx=−+
5.
6. Use the two points to determine the slope.
The point (0, 3) is the y-intercept, so the equation is 1 3. 2 yx=−+ Change the equation from slope-intercept form to standard form.
7. 2 x = is a vertical line, so a perpendicular line to 2 x = would be a horizontal line. The general form of a horizontal line is .ya = Use the y-value from an ordered pair to find the equation. Using the the point () 2, 3 gives the equation 3. y =−
8. Choice A gives an equation whose graph has one intercept since it is a vertical line and crosses only the x -axis. Choice B gives an equation whose graph has one intercept since the graph crosses the x-axis and y-axis at the same point. Choice D gives an equation whose graph has one intercept since it is a horizontal line and crosses only the y -axis.
9. In 43,yx<+ the < symbol indicates that the graph is a dashed boundary line and that the shading is below the line, so the correct choice is D.
10. (a) The graph has a value of negative one when x has a value of negative two.
()21 f −=−
(b) The graph has a value of negative two when x has a value of zero.
()02 f =−
(c) When the graph has a y -value of negative three, the corresponding x-value is two.
()23 f =−
(d) The graph catches all x - and y -values. Therefore, the domain is () , , −∞∞ and the range is () , . −∞∞
Copyright © 2016 Pearson Education, Inc.
Chapter 2 Test
1. For 1: x = 2(1)312 2312
310 1010 1, 33 y y y y −= −= −= ⎛⎞ =−−⎜⎟ ⎝⎠
For 3: x = () 2(3)312 6312 36 23,2 y y y y −=
For 4: y =−
23(4)12
2. To find the x -intercept, let 0. y = 32(0)20 320 20 3 x x x −= = =
The x-intercept is 20 ,0. 3 ⎛⎞ ⎜⎟ ⎝⎠
To find the y -intercept, let 0. x = 3(0)220 220 10 y y y −= −= =−
The y-intercept is (0,10). Draw the line through these two points.
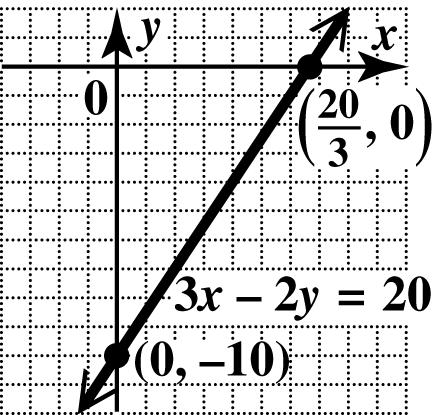
3. The graph of 5 y = is the horizontal line with slope 0 and y-intercept (0, 5). There is no x-intercept.
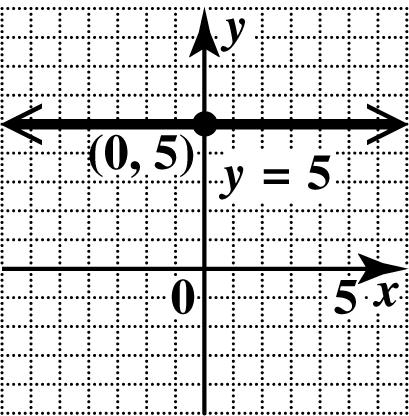
4. The graph of 2 x = is the vertical line with x-intercept at (2, 0). There is no y-intercept.
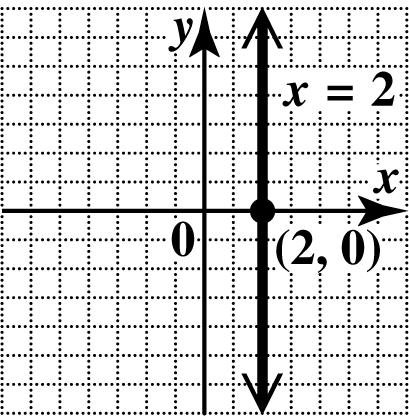
5. 1451 46102 y m x ∆−−− ==== ∆−−−
The slope of the line is 1 . 2
6. The graph of a line with undefined slope is the graph of a vertical line.
7. Find the slope of each line. 58 58 58 xy yx yx −= −=−+ =−
The slope is 5. 53 13 55 yx yx =−+ =−+
The slope is 1 5 Since 1 51, 5 ⎛⎞ −=−⎜⎟ ⎝⎠ the two slopes are negative reciprocals and the lines are perpendicular.
8. Find the slope of each line. 2312 3 6 2 yx yx =+ =+
The slope is 3 . 2 325 25 33 yx yx =− =−
The slope is 2 3
The lines are neither parallel nor perpendicular.
9. Use the points (1980, 119,000) and (2012, 92,200). average rate of change changein92,200119,000 changein20121980 26,800 838 32 y x == =≈−
The average rate of change is about 838 farms per year, that is, the number of farms decreased by about 838 each year from 1980 to 2012.
10. (a) Let 5 m =− and 11 (,)(4,1) xy =− in the point-slope form. 11() (1)5(4) 1520 519 yymxx yx yx yx −=− −−=−− +=−+ =−+
(b) 519From part (a) 519Standard form yx xy =−+ +=
11. (a) A horizontal line has equation . yk = Here 14, k = so the line has equation 14. y = (b) 14 y = is already in standard form.
12. (a) First find the slope. 1341 6(2)82 y m x ∆−−− ====− ∆−−
Use 1 2 m =− and 11 (,)(2,3) xy =− in the point-slope form. 11() 1 3[(2)] 2 1 3(2) 2 1 31 2 1 2 2 yymxx yx yx yx yx −=− −=−−− −=−+ −=−− =−+
(b) 1 2 2 1 2 2 1 22(2) 2 24 yx xy xy xy =−+ += ⎛⎞+=⎜⎟ ⎝⎠ +=
13. (a) The equation of any vertical line is in the form . xk = Since the line goes through (5,6), the equation is 5. x = Writing 5 x = in slope-intercept form is not possible since there is no y-term.
(b) From part (a), the standard form is 5. x =
14. (a) To find the slope of 356, xy+= write the equation in slope-intercept form by solving for y. 356 536 36 55 xy yx yx += =−+ =−+
The slope is 3 , 5 so a line parallel to it also has slope 3 5 Let 3 5 m =− and 11 (,)(7,2) xy =− in the point-slope form. 11() 3 2[(7)] 5 3 2(7) 5 321 2 55 311 55 yymxx yx yx yx yx −=− −=−−− −=−+ −=−− =−− (b) 311 55 311 55 311 55 55 3511 yx xy xy xy =−− +=− ⎛⎞⎛⎞ +=− ⎜⎟⎜⎟ ⎝⎠⎝⎠ +=−
Copyright © 2016 Pearson Education,
15. (a) Since 2 yx = is in slope-intercept form (0), b = the slope, m, of 2 yx = is 2. A line perpendicular to it has a slope that is the negative reciprocal of 2—that is, 1 . 2 Let 1 2 m =− and 11 (,)(7,2) xy =− in the point-slope form. 11()
19. First graph 21yx=− as a dashed line through (2, 3) and (0,1). Test (0, 0), which yields 01, <− a false statement. Shade the side of the line not containing (0, 0).
Next, graph 3 xy−= as a dashed line through (3, 0) and (0,3). Test (0, 0), which yields 03, < a true statement. Shade the side of the line containing (0, 0). The intersection is the region where the graphs overlap.
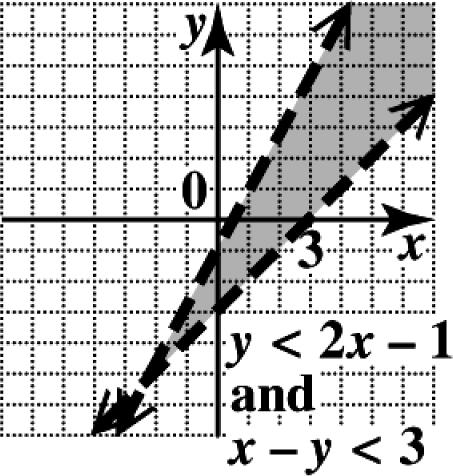
20. Choice D is the only graph that passes the vertical line test.
21. Choice D does not define a function, since its domain (input) element 0 is paired with two different range (output) elements, 1 and 2.
16. Positive slope means that the line goes up from left to right. The only line that has positive slope and a negative y -coordinate for its y-intercept is choice B.
17. (a) The fixed cost is $45, so that is the value of b. The variable cost is $142.75, so 142.7545.ymxbx =+=+ (b) 142.75(6)45Let 6. 901.5 yx =+= = The cost for 6 tickets and a parking pass is $901.50.
18. Graph the line 326, xy−= which has intercepts (2, 0) and (0,3), as a dashed line since the inequality involves >. Test (0, 0), which yields 06, > a false statement. Shade the region that does not include (0, 0).
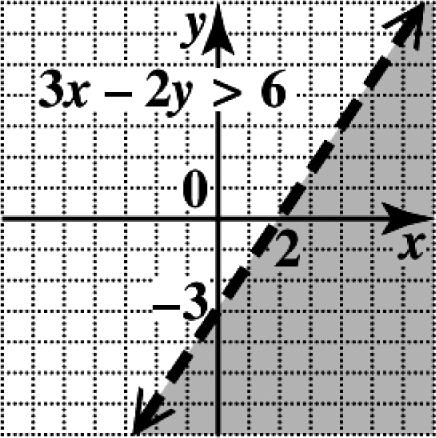
22. The x-values are greater than or equal to zero, so the domain is [0,). ∞ Since y can be any value, the range is (,). −∞∞
23. The domain is the set of x -values: {0,2,4}. The range is the set of y -values: {1, 3, 8}.
24. (a) 2 (1)(1)2(1)1 121 0 f =−+− =−+− = (b) 2 ()21 faaa=−+−
25. This function represents a line with y -intercept (0,1) and x-intercept 3 ,0. 2 ⎛⎞ ⎜⎟ ⎝⎠
Draw the line through these two points. The domain is (,), −∞∞ and the range is (,). −∞∞
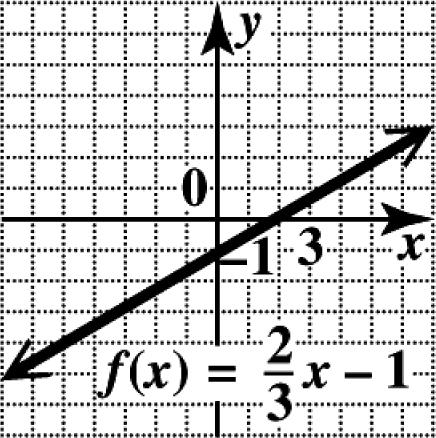
Chapters R–2 Cumulative Review Exercises
1. The absolute value of a negative number is a positive number, and the additive inverse of the same negative number is the same positive number. For example, suppose the negative number is 5:
5(5)5−=−−= and (5)5−−= The statement is alwaystrue
2. The sum of two negative numbers is another negative number, so the statement is nevertrue
3. The statement is sometimestrue. For example, 3(3)0, but 3(1)20.+−=+−=≠
4. 24372437 637 37 4 −−−+−+=−−++ =−++ =−+ =
5. 2 (0.8)(0.8)(0.8)0.64 −=−−=
6. 64 is not a real number.
7. (43)(4)3 43 xx x −−+=−−− =−
8. 22 22 2 3449 3494 254 xxxx xxxx xx −++− =−−++ =++
9. 2 (44)(1)7(164)(7) 4(6)2 12719 22 = +−− + ==−
10. () () 2 2551 551 55 0 =− =− =
11. 1 3(23)323(4) 2 3(112) 3(13) 39 qp ⎡⎤ ⎛⎞ −−=−−− ⎜⎟ ⎢⎥ ⎝⎠
=−+ =− =−
12. 16 828(4)2(16) 4 3232 4 ,whichisundefined. 0 r pr = +−+ = −+ =
13. ()25342 552 67 7 6 zzz zz z z −+=−+ −=− = =
The solution set is 7 6 ⎧ ⎫ ⎨ ⎬
14. Multiply both sides by the LCD, 10. 3123 5210 3123 1010 5210
2(31)5(2)3 625103 1183 1111 1 xx xx xx xx x x x −+ +=− −+ ⎛⎞⎛⎞ +=−
−++=− −++=− +=− =− =−
The solution set is {1}.
15. Let x denote the side of the original square and 4x the perimeter. Now 4 x + is the side of the new square and 4(4) x + is its perimeter. “The perimeter would be 8 inches less than twice the perimeter of the original square” translates to the following.
4(4)2(4)8 41688 244 6 xx xx x x +=− +=− = =
The length of a side of the original square is 6 inches.
Copyright © 2016 Pearson Education, Inc.
16. Let x = the time it takes for the planes to be 2100 miles apart. Make a table. Use the formula . drt =
Eastbound Plane 550 x 550x
Westbound Plane 500 x 500x
The total distance is 2100 miles. 5505002100 10502100 2 xx x x += = =
It will take 2 hr for the planes to be 2100 mi apart.
17. 4329 726 k k −<−< −<−<
Divide by 2 , and reverse the inequalities. 7 3 2 7 3Equivalent inequality 2 k k >>− −<<
The solution set is 7 3,. 2 ⎛⎞ ⎜⎟
18. 0.32.1(4)6.6
321(4)66Multiply by 10. 3218466 188466 1818 1 xx xx x+x x x x −+−≤− −+−≤− −−≤− −≤− ≤ ≤
The solution set is (,1]. −∞
19. 118 3and 233 68 xx xx >< ><
This is the intersection. The solution set is (6,8).
20. 5111or3526 510321 2or7 xx xx xx −+≥+> −≥> ≤−>
This is the union. The solution set is (,2](7,). −∞−∪∞
Copyright © 2016 Pearson
21. 27411 277 k k −+= −= 277or277 21420 7or0 kk kk kk −=−=− == ==
The solution set is {0, 7}.
22. 360 x +≥
The absolute value of an expression is always nonnegative, so the inequality is true for any real number x
The solution set is (,). −∞∞
23. To find the x -intercept, let 0. y = 35(0)12 312 4 x x x += = =
The x-intercept is (4, 0).
To find the y -intercept, let 0. x = 3(0)512 512 12 5 y y y += = =
The y-intercept is 12 0,. 5 ⎛⎞ ⎜⎟ ⎝⎠
Plot the intercepts and draw the line through them.
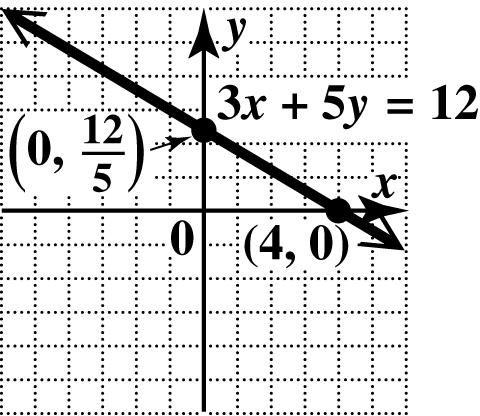
24. (a) The slope of line AB is 5166 3(2)55 y m x ∆−−− ====− ∆−−
(b) The slope of a line perpendicular to line AB is the negative reciprocal of 6 , 5 which is 5 . 6
25. Graph the line 26, xy −+=− which has intercepts (3, 0) and (0,6), as a dashed line since the inequality involves <. Test (0, 0), which yields 06, <− a false statement. Shade the region that does not include (0, 0).
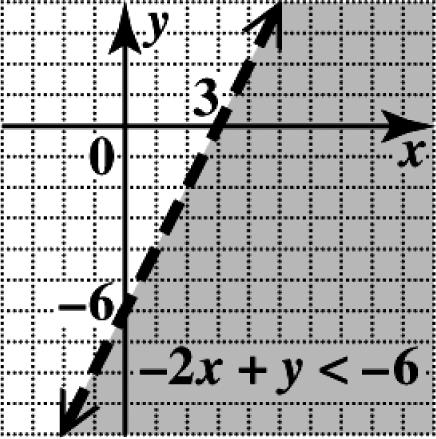
26. (a) To write an equation of this line, let 3 4 m =− and 1 b =− in the slope-intercept form. 3 1 4 ymxb yx =+ =−− (b) 3 1 4 434 344 yx yx xy =−− =−− +=−
27. (a) First find the slope of the line. 1(3)44 1433 y m x ∆−− ====− ∆−− Now substitute 11 (,)(4,3) xy =− and 4 3 m =− in the point-slope form. Then solve for y 11() 4 (3)(4) 3 416 3 33 47 33 yymxx yx yx yx −=− −−=−− +=−+ =−+ (b) 47 33 347 437 yx yx xy =−+ =−+ +=
28. The domain of the relation consists of the elements in the leftmost figure—that is, {14, 91, 75, 23}.
The range of the relation consists of the elements in the rightmost figure—that is, {9, 70, 56, 5}.
Since the element 75 in the domain is paired with two different values, 70 and 56, in the range, the relation is not a function.
Copyright © 2016 Pearson Education, Inc.