SHORT ANSWER Write the word or phrase that best completes each statement or answers the question
Provide an appropriate response. Round relative frequencies to thousandths.
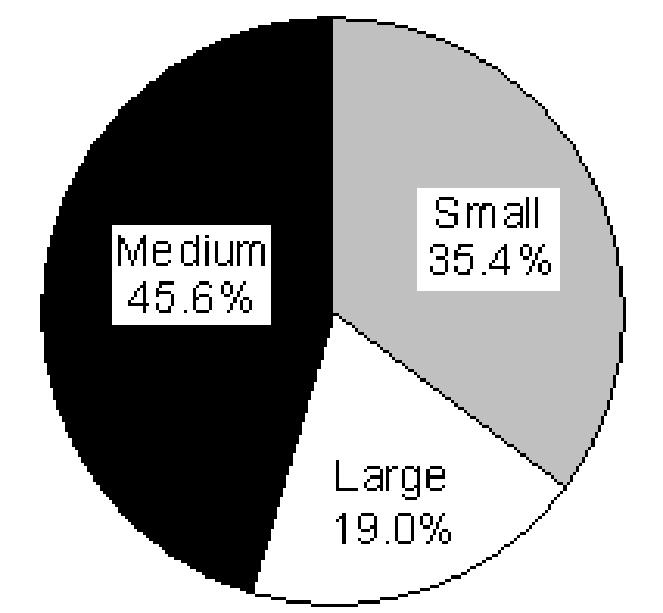
1) Scott Tarnowski owns a pet grooming shop. His prices for grooming dogs are based on the size of the dog His records from last year are summarized below Construct a frequency distribution and a relative frequency distribution Show the percentage represented by each relative frequency
Class Frequency
Large 345 Medium 830
Small 645
2) The results of a survey about a recent judicial appointment are given in the table below Construct a relative frequency distribution.
Response Frequency
Strongly Favor 35
Favor 13
Neutral 7
Oppose 25
Strongly Oppose 120
3) The preschool children at Elmwood Elementary School were asked to name their favorite color The results are listed below Construct a frequency distribution and a relative frequency distribution
purple purple blue yellow red red red purple red blue red blue yellow yellow yellow blue red yellow red green
MULTIPLE CHOICE. Choose the one alternative that best completes the statement or answers the question. 4) True or False: The sum of all the relative frequencies of a distribution will always add up to 1 A) True B) False
5) True or False: Relative frequency is the proportion (or percent) of observations within a category and is found using the formula: relative frequency = sum of all frequencies frequency A) False B) True
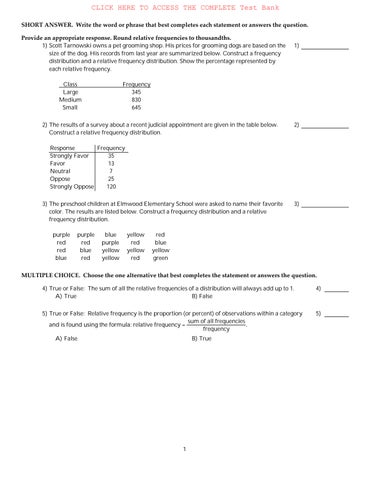
The bar graph shows the number of tickets sold each week by the garden club for their annual flower show

6) During which week was the most number of tickets sold? A) week 2 B) week 4 C) week 5 D) week 1
7) During which week was the fewest number of tickets sold? A) week 6 B) week 5
week 2
8) Approximately how many tickets were sold during week 5?
40 tickets
Provide an appropriate response.
46 tickets
11 tickets
week 4
19 tickets
9) The payroll amounts for 26 major-league baseball teams are shown below. Aprroximately what percentage of the payrolls were in the $30-$40 million range? Round to the nearest whole percent.

10) Retailers are always interested in determining why a customer selected their store to make a purchase A sporting goods retailer conducted a customer survey to determine why its customers shopped at the store The results are shown below What percentage of the customers responded that the merchandise was the reason they shopped at the store? Round to the nearest whole percent

11) The bar graph below shows the political party affiliation of 1000 registered U.S. voters. What percentage of the 1000 registered U.S. voters belonged to one of the traditional two parties (Democratic and Republican)?

12) The Excel frequency bar graph below describes the employment status of a random sample of U S adults What is the percentage of those having no job?

40%
15% C) cannot determine
20%
The following double-bar graph illustrates the revenue for a company for the four quarters of the year for two different years. Use the graph to answer the question.

In what quarter was the revenue the greatest for Year 1?
SHORT ANSWER Write the word or phrase that best completes each statement or answers the question
Provide an appropriate response.
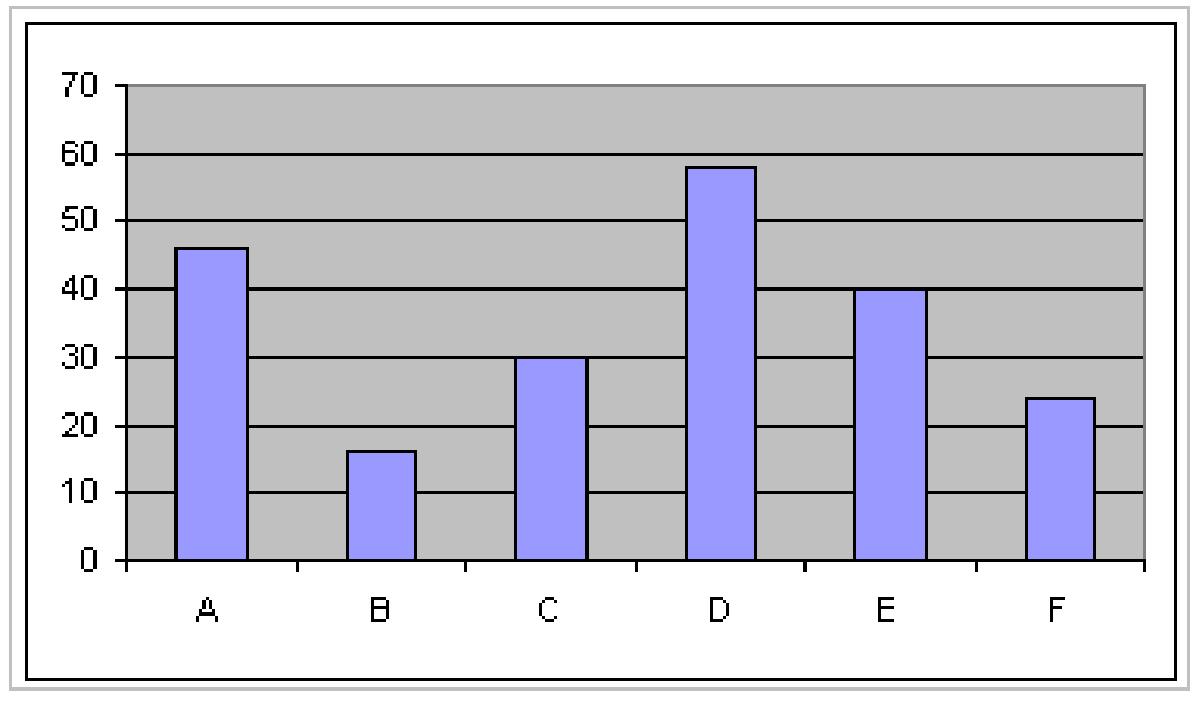
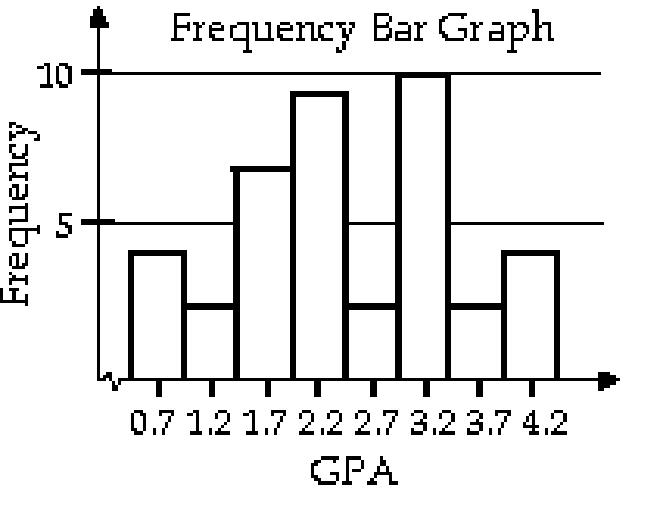
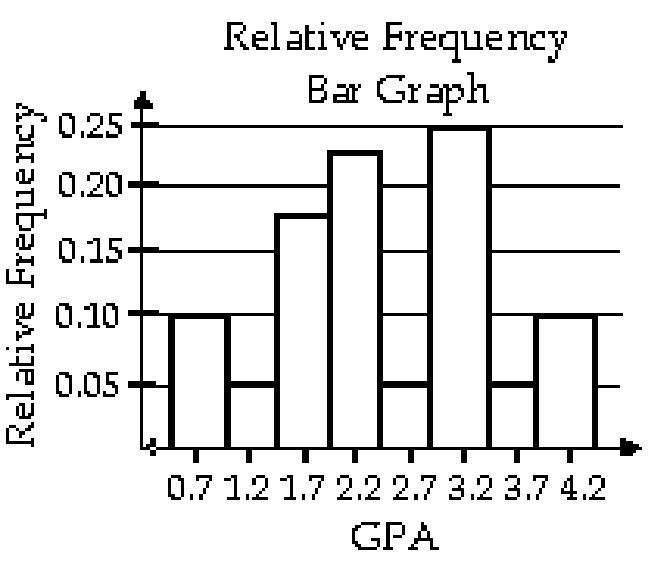
16) The grade point averages for 40 evening students are listed below Construct a frequency bar graph and a relative frequency bar graph
Grade Point Average Frequency
-
9
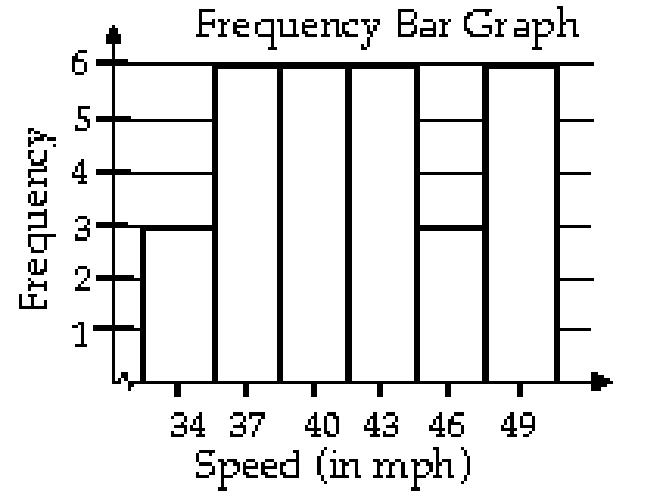
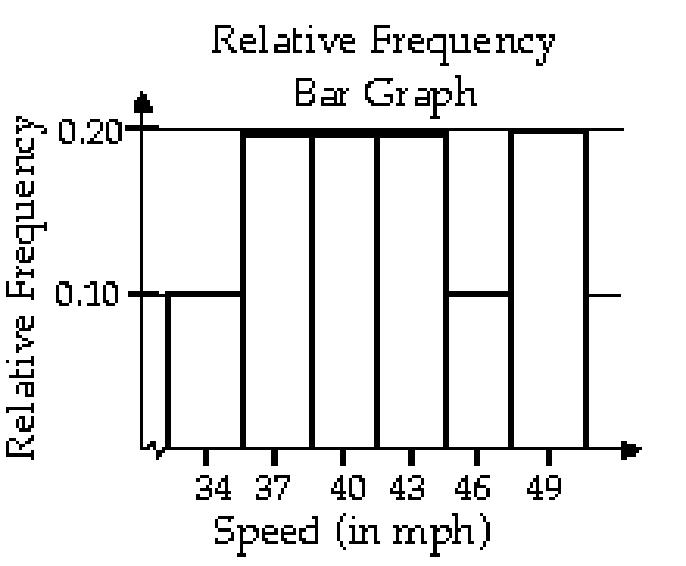
17) The local police, using radar, checked the speeds (in mph) of 30 motorists in a construction area The results are listed below Construct a frequency bar graph and a relative frequency bar graph
Speed Frequency
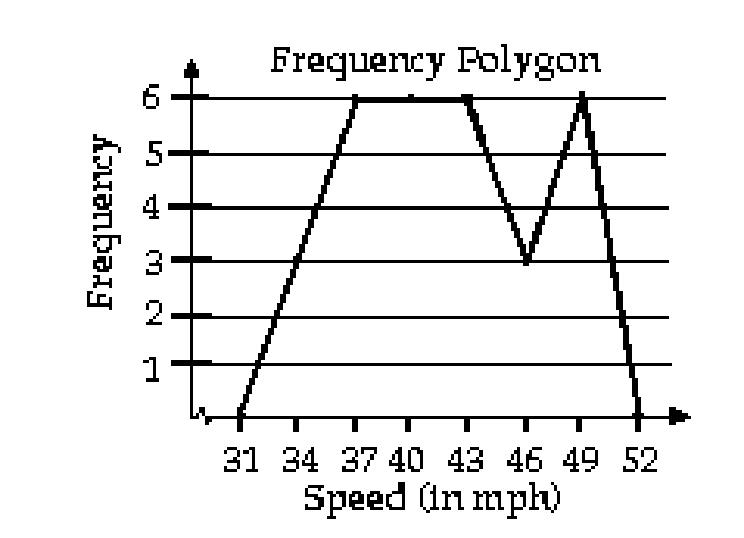
33-35 3
36-38 6
39-41 6
42-44 6
45-47 3
48-50 6
18) Listed below are the ACT scores of 40 randomly selected students at a major university
a) Construct a relative frequency bar graph of the data, using eight classes.
b) If the university wants to accept the top 90% of the applicants, what should the minimum score be?
c) If the university sets the minimum score at 17, what percent of the applicants will be accepted?
MULTIPLE CHOICE Choose the one alternative that best completes the statement or answers the question
19) Given the bar graph shown below, the Pareto chart that would best represent the data should have the bars in the following order
The pie chart shows the percentage of votes received by each candidate in the student council presidential election. Use the pie chart to answer the question.


SHORT ANSWER Write the word or phrase that best completes each statement or answers the question
Construct a pie chart for the data. Label each category with its percentage. 23) A study was conducted to determine how people get jobs Four hundred subjects were randomly selected and the results are listed below Round percents to whole numbers
24) Scott Tarnowski owns a pet grooming shop His prices for grooming dogs are based on the size of the dog His records from last year are summarized below Round percents to whole numbers
MULTIPLE CHOICE. Choose the one alternative that best completes the statement or answers the question.
Provide an appropriate response.
25) A two-pound bag of assorted candy contained 100 caramels, 83 mint patties, 93 chocolate squares, 80 nut clusters, and 79 peanut butter taffy pieces. To create a pie chart of this data, the angle for the slice representing each candy type must be computed What is the degree measure of the slice representing the mint patties rounded to the nearest degree? A) 5° B) 52° C) 19° D) 69°
SHORT ANSWER. Write the word or phrase that best completes each statement or answers the question.
Construct a frequency distribution for the data.
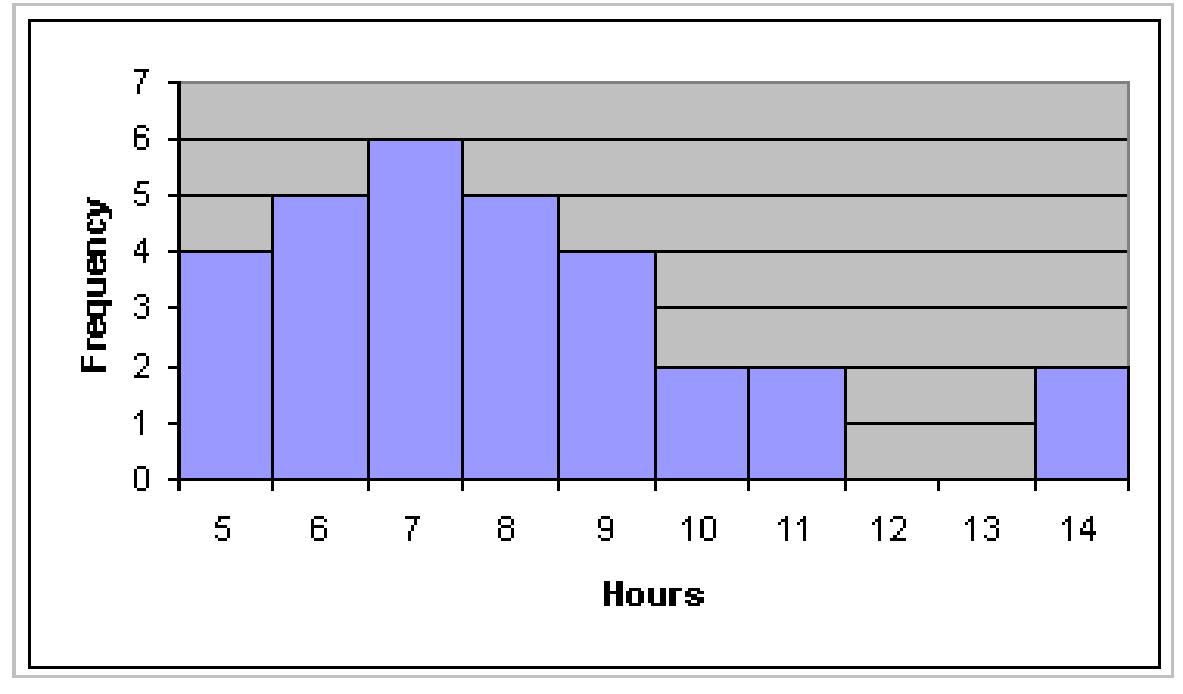
26) A random sample of 30 high school students is selected Each student is asked how much time he or she spent on the Internet during the previous week. The following times (in hours) are obtained:
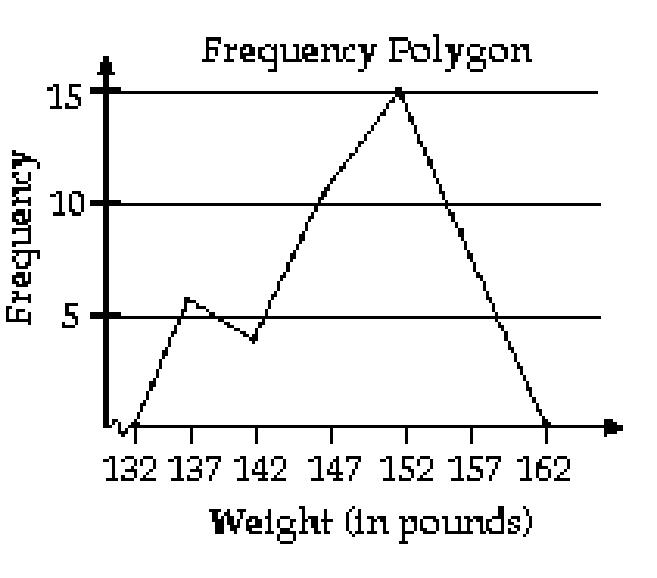
6 14 8 11 8 6 8 7 5 11
9 7 7 6 9 8 5 5 10 7
5 7 14 9 6 10 6 9 8 7
Construct a frequency distribution for the data
27) A sample of 25 service project scores is taken and is recorded below Construct a frequency distribution for this data
97 96 96 95 96
99 97 97 100 99
95 98 95 96 100
95 98 96 96 100
95 97 99 97 98
Construct the specified histogram.
28) A random sample of 30 high school students is selected. Each student is asked how much time he or she spent on the Internet during the previous week The following times (in hours) are recorded:
6 14 8 11 8 6 8 7 5 11
9 7 7 6 9 8 5 5 10 7
5 7 14 9 6 10 6 9 8 7
Construct a frequency histogram for this data
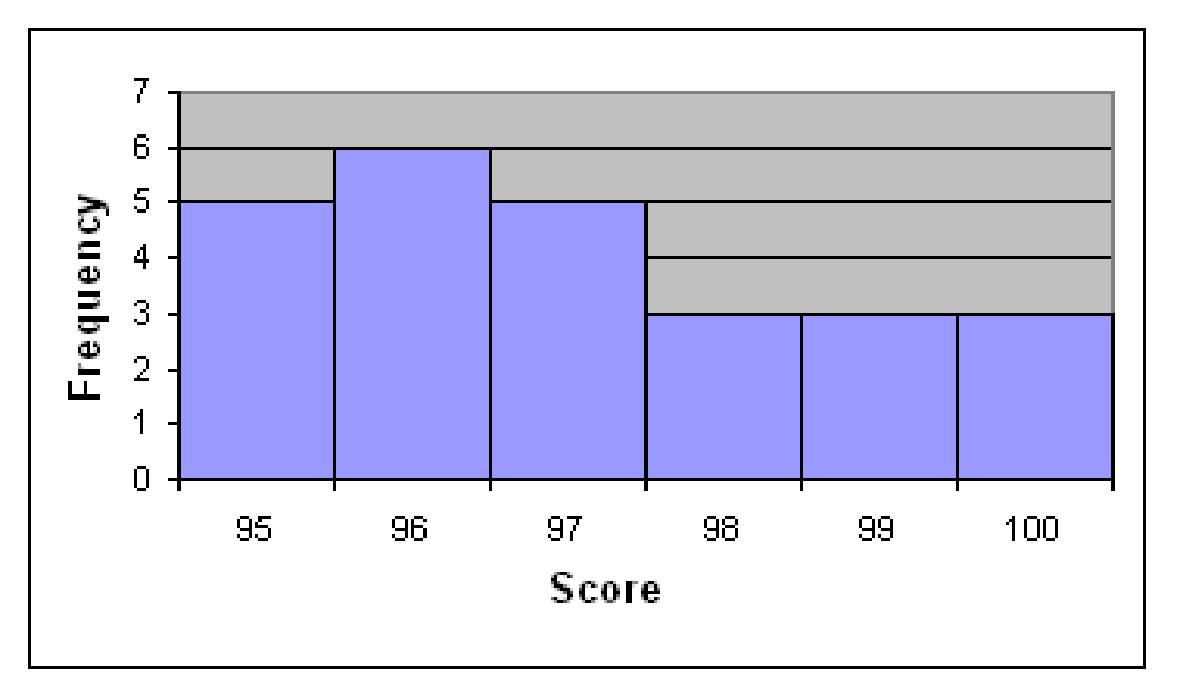
29) A sample of 25 community service projects is obtained and the scores are recorded The results are shown below Construct a frequency histogram for this data
97 96 96 95 96
99 97 97 100 99
95 98 95 96 100
95 98 96 96 100
95 97 99 97 98
MULTIPLE CHOICE. Choose the one alternative that best completes the statement or answers the question.
Provide an appropriate response
30) The class width is the difference between
A) Two successive lower class limits
B) The largest frequency and the smallest frequency
C) The upper class limit and the lower class limit of a class
D) The high and the low data values
31) Determine the number of classes in the frequency table below.
Class Frequency
17-18 7
19-20 2
21-22 6
23-24 4
25-26 1
6
5
32) Find the class width for the frequency table below.
Class Frequency
8-9 3
10-11 1
12-13 3
14-15 6
16-17 2
1.5
2.5
20
2
1
2
33) Use the following frequency distribution to determine the class limits of the third class.
Class Frequency
5-11 7
12-18 11
19-25 8
26-32 5
33-39 9
40-46 6
A) lower limit: 18 5; upper limit: 25 5
C) lower limit: 18; upper limit: 26
B) lower limit: 19; upper limit: 25
D) lower limit: 19; upper limit: 26
34) A researcher records the number of employees of each of the IT companies in the town of Westmoore The results are summarized in the table
- 1249
Find the class width
249 5
35) A researcher records the number of employees of each of the IT companies in the town of Westmoore The results are summarized in the table
Find the class limits of the third class
A) lower limit: 1599 5; upper limit: 2399 5 B) lower limit: 1600; upper limit: 2400
C) lower limit: 1599; upper limit: 2400 D) lower limit: 1600; upper limit: 2399
36) The weights (in pounds) of babies born at St Mary's hospital last month are summarized in the table.
Weight (lb) Number of Babies
5 0 - 6 7
6 1 - 7 1 20
7 2 - 8 2 19
8 3 - 9 3 9
9 4 - 10 4 5 Find the class width
37) The weights (in pounds) of babies born at St Mary's hospital last month are summarized in the table
Weight (lb) Number of Babies
5.0 - 6 5
6 1 - 7 1 19
7 2 - 8 2 19
8 3 - 9 3 9
9 4 - 10 4 5
Find the class limits for the second class
A) lower limit: 6 1; upper limit: 7 1
B) lower limit: 6 1 ; upper limit: 7 2
C) lower limit: 6; upper limit: 7 2 D) lower limit: 6 05; upper limit:7 15
38) The table below summarizes the weights of the almonds (in grams) in a one-pound bag What is the class width?
Weight (g) Frequency
0.7585 -0.8184 1
0.8185 -0.8784 1
0.8785 -0.9384 1
0.9385 -0.9984 3
0 9985 -1 0584 157
1.0585 -1.1184 171 1.1185 -1.1784 8
SHORT ANSWER. Write the word or phrase that best completes each statement or answers the question.
Construct the requested frequency distribution.
39) The June precipitation amounts (in inches) for 40 cites are listed below. Construct a frequency distribution and a relative frequency distribution using eight classes. 2.0 3.2
40) The commute times (in minutes) of 30 executives are listed below Construct a frequency distribution and a relative frequency distribution using five classes Round relative frequency values to three decimal places
41) The March utility bills (in dollars) of 30 homeowners are listed below. Construct a frequency distribution and a relative frequency distribution using six classes.
Provide an appropriate response.
42) A sample of 15 Boy Scouts was selected and their weights (in pounds) were recorded as follows:
97 120 137 124 117
108 134 126 123 106
130 110 100 120 140
a. Using a class width of 10, give the upper and lower limits for five classes, starting with a lower limit of 95 for the first class.
b. Construct a frequency distribution for the data
Construct the specified histogram
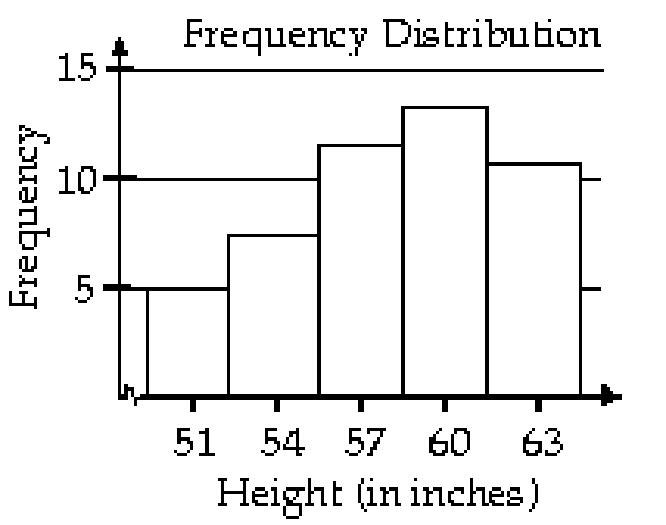
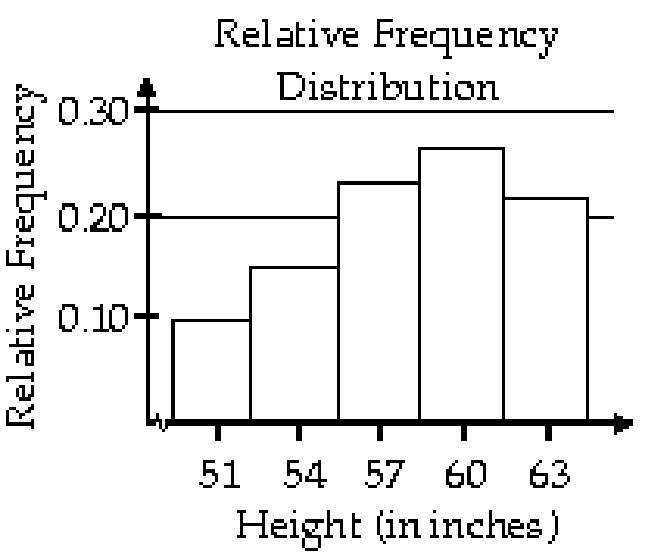
43) For the data below, construct a frequency distribution and a relative frequency distribution
Height (in inches) Frequency
50 - 52 5
53 - 55 8
56 - 58 12
59 - 61 13
62 - 64 11
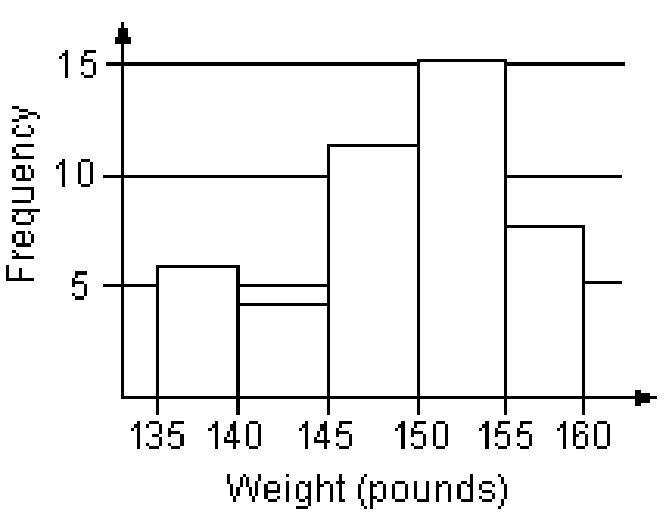
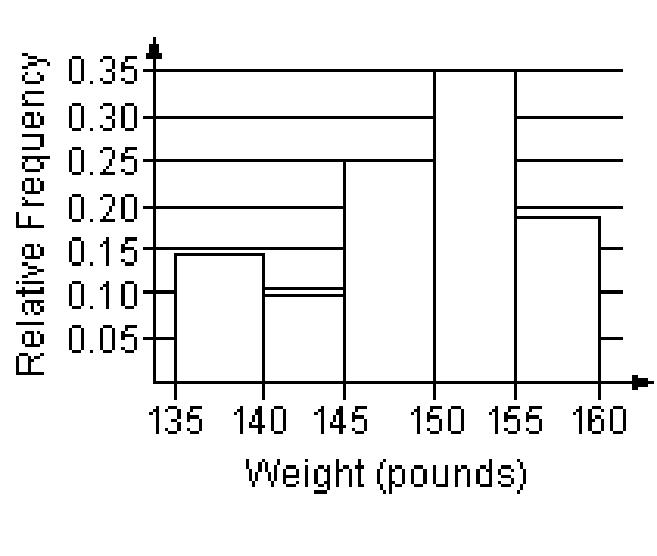
44) For the data below, construct a frequency histogram and a relative frequency histogram
Weight (in pounds) Frequency
135 - 139 6
140 - 144 4
145 - 149 11
150 - 154 15
155 - 159 8 44)
45) The 30 students in Mrs Harrison's literature class were asked how many cousins they had. The results are shown below. Create a frequency histogram for the data using a class width of 2
10 1 3 5 4 7
5 1 0 9 11 1
5 4 1 7 7 11
0 6 6 1 5 7
10 1 1 5 6 0 45)
46) The 30 students in Mrs Harrison's literature class were asked how many cousins they had. The results are shown below. Construct a relative-frequency histogram using a class width of 2.
10 1 3 5 4 7
5 1 0 9 11 1
5 4 1 7 7 11
0 6 6 1 5 7
10 1 1 5 6 0
47) A sample of 15 Girl Scouts was selected and their weights (in pounds) were recorded The results are listed below Construct a frequency histogram for the data using a class width of 10 and using 95 as the lower limit of the first class
97 120 137 124 117
108 134 126 123 106
130 110 100 120 140
46)
47)
MULTIPLE CHOICE Choose the one alternative that best completes the statement or answers the question
Provide an appropriate response.
48) What is the difference between a bar chart and a histogram?
A) The bars on a bar chart do not touch while the bars of a histogram do touch
B) The bars in a bar chart may be of various widths while the bars of a histogram are all the same width
C) There is no difference between these two graphical displays
D) The bars in a bar chart are all the same width while the bars of a histogram may be of various widths
49) For the stem-and-leaf plot below, what are the maximum and minimum entries?
1 3 7
1 6 6 6 7 8 9
2 0 1 1 2 3 4 4 5 6 6
2 7 7 7 8 8 9 9 9
3 0 1 1 2 3 4 4 5 5
3 6 6 6 7 8 8 9 9
4 0 5
A) max: 47; min: 17
B) max: 45; min: 1 3
C) max: 38; min: 7 D) max: 40; min: 1 3
SHORT ANSWER. Write the word or phrase that best completes each statement or answers the question.
Determine the original set of data.
50) Stem Leaves
7 6 8 8
9 0 9
10 4 11 1 8
12 6 9
13 6 7 9
14 2 3 8 9
15 7 9
Legend: 5 6 represents 56
5 1
6 9
7 0 1
8 3
9 1 9
10 6 9
11 6 7 9
12 2 3 8 9
13 6 9
Legend: 5 1 represents 5 1
Construct a stem-and-leaf plot for the data.
52) The number of home runs that Mark McGwire hit in the first 13 years of his major league baseball career are listed below. (Source: Major League Handbook) Construct a stem-and-leaf plot for this data.
3 49 32 33 39 22 42 9 9 39 52 58 70
53) The numbers of runs batted in by Mark McLemore in the first 13 years of his major league baseball career are listed below (Source: Major League Handbook) Construct a stem-and-leaf plot for this data
0 102 56 25 9 9 56 165 88 122 150 91 114
54) The heights (in inches) of 30 mechanics are listed below Construct a stem-and-leaf plot for the data
70 72 71 70 69 73 69 68 70 71 67 71 70 74 69 68 71 71 71 72 69 71 68 67 73 74 70 71 69 68
55) The March utility bills (in dollars) of 30 homeowners are listed below Construct a stem-and-leaf plot for the data
44 38 41 50 36 36 43 42 49 48
35 40 37 41 43 50 45 45 39 38
50 41 47 36 35 40 42 43 48 33
56) The scores for an economics test are listed below. Create a stem -and-leaf plot for the data
87 76 92 77 90 94 88 85 66 89 79 98 52 95 83 88 82 54 14 69
Construct a dot plot for the data.
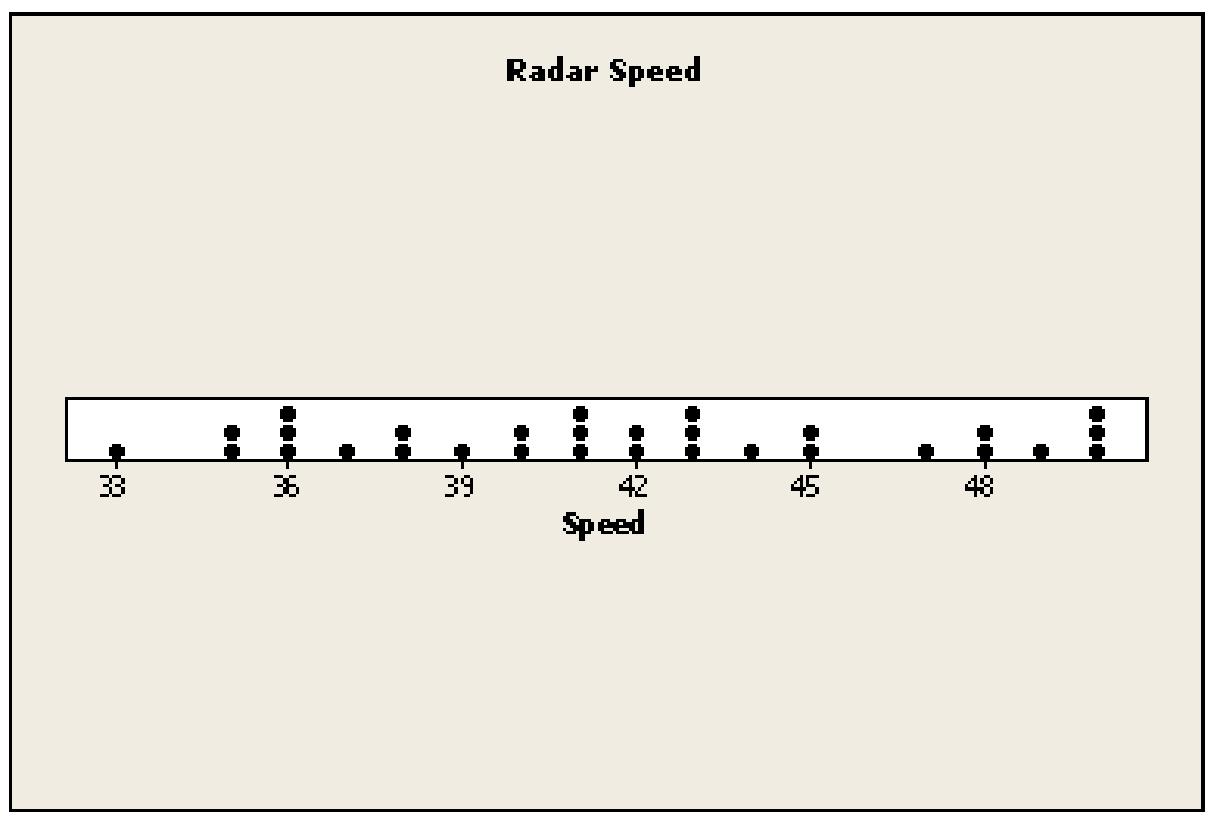
57) The local police, using radar, checked the speeds (in mph) of 30 motorists at a busy intersection The results are listed below Construct a dot plot for the data
44 38 41 50 36 36 43 42 49 48
35 40 37 41 43 50 45 45 39 38
50 41 47 36 35 40 42 43 48 33 57)
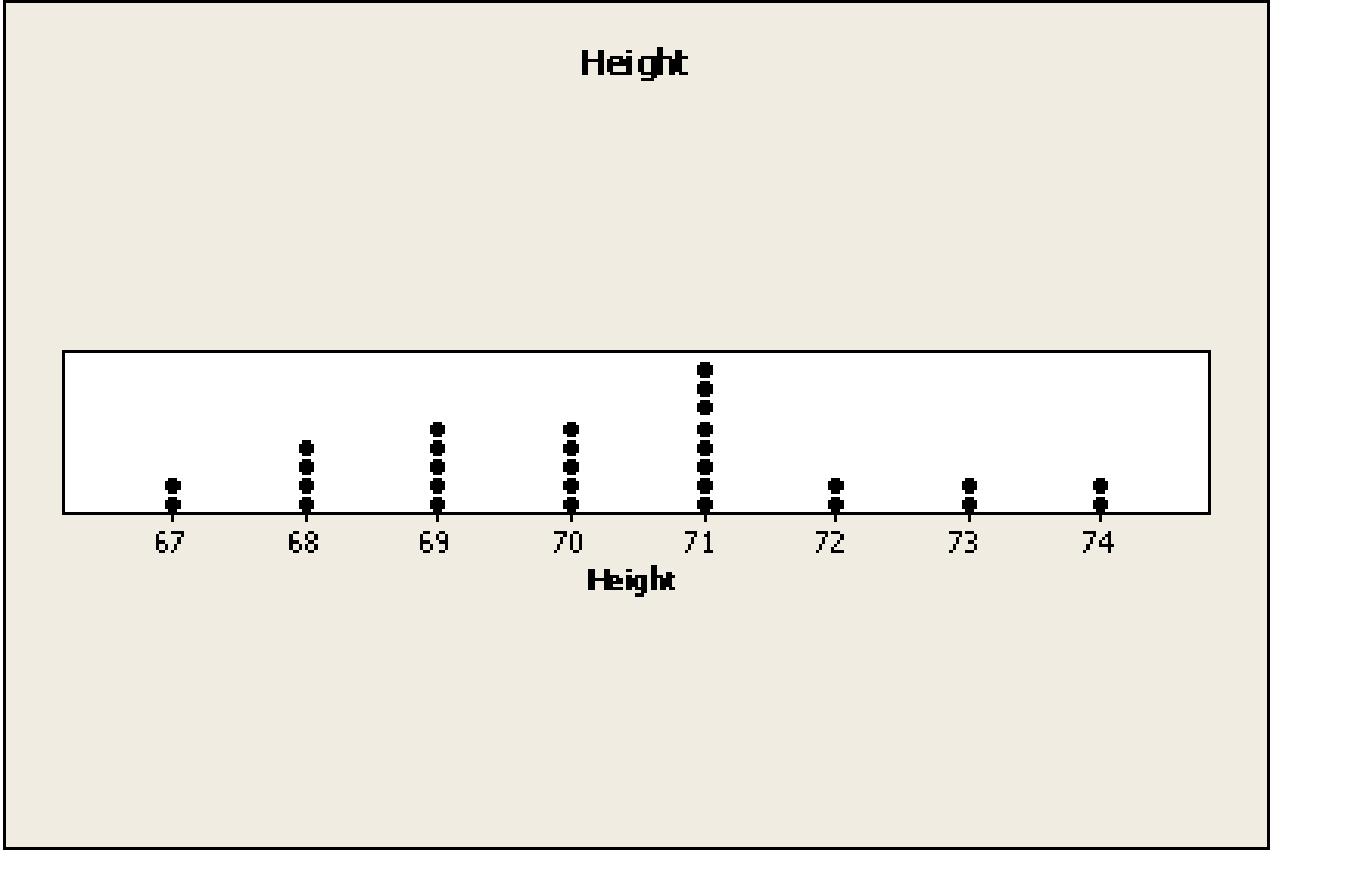
58) The heights (in inches) of 30 mechanics are listed below Construct a dot plot for the data
70 72 71 70 69 73 69 68 70 71 67 71 70 74 69 68 71 71 71 72
69 71 68 67 73 74 70 71 69 68
MULTIPLE CHOICE. Choose the one alternative that best completes the statement or answers the question. Construct a frequency distribution for the data using five classes. Describe the shape of the distribution.
59) The data set: Pick Three Lottery Outcomes for 10 Consecutive Weeks 3 6 7 6 0 6 1 7 8 4 1 5 7 5 9 1 5 3 9 9 2 2 3 0 8 8 4 0 2 4
A) uniform
B) skewed to the left C) bell shaped D) skewed to the right
60) The data set: ages of dishwashers (in years) in 20 randomly selected households 12 6 4 9 11 1 7 8 9 8 9 13 5 15 7 6 8 8 2 1
A) skewed to the left B) bell shaped C) skewed to the right D) uniform
61) The data set: weekly grocery bills (in dollars) for 20 randomly selected households
A) skewed to the right B) skewed to the left C) bell shaped D) uniform
Describe the shape of the distribution. 62)

A) skewed to the left
B) bell shaped C) uniform D) skewed to the right
63)

A) bell shaped
B) skewed to the right C) uniform D) skewed to the left 63)
Use the histograms shown to answer the question 64)

Is either histogram symmetric?
A) Both are symmetric.
B) Neither is symmetric.
C) The second is symmetric, but the first is not symmetric.
D) The first is symmetric, but the second is not symmetric
SHORT ANSWER. Write the word or phrase that best completes each statement or answers the question.
Describe the shape of the distribution.
65) A sample of 15 Little League players was selected and their weights (in pounds) were recorded as follows: 97 120 137 124 117
134 126 123 106
110 100 120 140
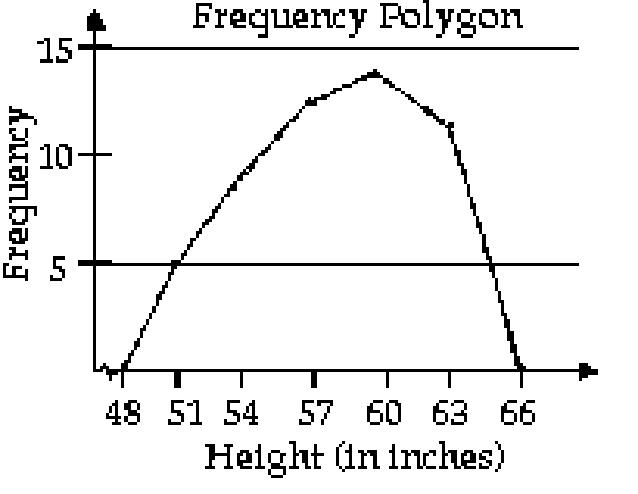
Construct a frequency polygon for the data.
66)
Height (in inches) Frequency
50 - 52 5
53 - 55 8
56 - 58 12
59 - 61 13
62 - 64 11 66)
67)
Weight (in pounds) Frequency
135 - 139 6
140 - 144 4
145 - 149 11
150 - 154 15
155 - 159 8
68) The grade point averages for 40 evening students are listed below Construct a frequency polygon using eight classes
69) The local police, using radar, checked the speeds (in mph) of 30 motorists in a construction area The results are listed below Construct a frequency polygon using six classes and a class width of 3
MULTIPLE CHOICE. Choose the one alternative that best completes the statement or answers the question.
Determine whether the statement is true or false.
70) A frequency polygon always begins and ends with a frequency of zero A) True B) False
71) The class midpoint can be determined by adding to the lower class limit one-half of the class width A) True B) False
SHORT ANSWER. Write the word or phrase that best completes each statement or answers the question.
Construct the requested frequency distribution.
72) The April precipitation amounts (in inches) for 40 cities are listed below Construct a frequency distribution, a relative frequency distribution, a cumulative frequency distribution, and a relative cumulative frequency distribution using eight classes
73) The commute time (in minutes) of 30 executives are listed below. Construct a frequency distribution, a relative frequency distribution, a cumulative frequency distribution, and a relative cumulative frequency distribution using five classes.
72 71 70 69 73 69 68 70 71
74) The local police, using radar, checked the speeds (in mph) of 30 motorists in a construction area The results are listed below Construct a frequency distribution, a relative frequency distribution, a cumulative frequency distribution, and a relative cumulative frequency distribution using six classes
44 38 41 50 36 36 43 42 49 48
35 40 37 41 43 50 45 45 39 38
50 41 47 36 35 40 42 43 48 33
Construct the requested ogive.
75) The grade point averages for 40 evening students are listed below. Construct a frequency ogive using eight classes
76) The heights (in inches) of 30 lawyers are listed below. Construct a frequency ogive using five classes. 70
77) The local police, using radar, checked the speeds (in mph) of 30 motorists on a rural road. The results are listed below Construct a frequency ogive using six classes
78) The grade point averages for 40 evening students are listed below Construct a relative frequency ogive using eight classes. 2.0
79) The heights (in inches) of 30 lawyers are listed below. Construct a relative frequency ogive using five classes
80) The local police, using radar, checked the speeds (in mph) of 30 motorists on a rural road The results are listed below Construct a relative frequency ogive using six classes
44 38 41 50 36 36 43 42 49 48
35 40 37 41 43 50 45 45 39 38
50 41 47 36 35 40 42 43 48 33
MULTIPLE CHOICE Choose the one alternative that best completes the statement or answers the question
Provide an appropriate response.
81) An ogive is a graph that represents cumulative frequencies or cumulative relative frequencies The points labeled on the horizontal axis are the
A) Upper class limits
B) Lower class limits
C) Frequencies D) Midpoints
SHORT ANSWER. Write the word or phrase that best completes each statement or answers the question.
Use a time series plot to display the data. Comment on the trend,
82) The data below represent the consumption of high-energy drinks (in gallons) by adult Americans over a nine-year period
83) A transportation engineer wishes to use the following data to illustrate the number of deaths from the collision of passenger cars with motorcycles on a particular highway
84) Women were allowed to enter the Boston Marathon for the first time in 1972 Listed below are the winning women's times (in minutes) for the first 10 years
MULTIPLE CHOICE. Choose the one alternative that best completes the statement or answers the question. Explain what is misleading about the graphic. 85)

The volume of our sales has doubled!!!
A) The length of a side has doubled, but the area has been multiplied by 4
B) The graphic is not misleading
C) The length of a side has doubled, but the area has been multiplied by 8
D) The length of a side has doubled, but the area has been unchanged

2004 2006 2008 2010 2012
A) The graphic is not misleading.
B) The horizontal label is incomplete.
C) The trend is depicted in the wrong direction
D) The vertical scale does not begin at zero
87) 2012 DUI Figures for State County

A) The horizontal scale does not begin at zero
B) The graphic is not misleading
C) The graphic may give the impression that drivers over age 65 had no DUI's in 2012.
D) The graphic only includes information for one year.
SHORT ANSWER Write the word or phrase that best completes each statement or answers the question
Provide an appropriate response.
88) The following graph shows the number of car accidents occurring in one city in each of the years 2006 through 2011 (Year 1 = 2006, Year 2 = 2007 etc) The number of accidents dropped in 2008 after a new speed limit was imposed How is the bar graph misleading? How would you redesign the graph to be less misleading?

89) A parcel delivery store finds that their delivery rates increased over the past year. Last year it delivered 3402 parcels. This year it delivered 8942 parcels.

How many times larger should the graphic for this year be than the graphic for last year?
88)
89)
4) B 5) A 6) B 7) C 8) A 9) D 10) C 11) D
12) B 13) A 14) D 15) C 16)
18) a) See graph below
b) The minimum score = 14
c) The university will accept 76 57% of the applicants


Answer
29)
30) A
31) B
32) D
33) B
34) C
35) D
36) A
37) A
38) B
39)
1 5-1 9
2 0-2 4
2 5-2 9
42) a 95-104, 105-114, 115-124, 125-134, 135-144 b Weight (lb) Tally Frequency
95-104 ll 2
105-114 lll 3
115-124 lllll 5
125-134 lll 3
135-144 ll 2
43)
44) Frequency Histogram: Relative Frequency Histogram:


Answer Key
Testname: UNTITLED2
49) B
50) 76, 88, 90, 99, 104, 111, 118, 126, 129, 136, 137, 139, 142, 143, 148, 149, 157, 159
51) 5 1, 6 9, 7 0, 7 1, 8 3, 9 1, 9 9, 10 6, 10 9, 11 6, 11 7, 11 9, 12 2, 12 3, 12 8, 12 9, 13 6, 13 9
52)
6 7 7 8 8 8 8 9 9 9 9 9
7 0 0 0 0 0 1 1 1 1 1 1 1 1 2 2 3 3 4 4 55)
3 3 5 5 6 6 6 7 8 8 9
4 0 0 1 1 1 2 2 3 3 3 4 5 5 7 8 8 9
5 0 0 0
56) The stem will consist of the tens digit and range from 1 to 9 The leaves will be drawn in the appropriate stems based on the data values
6 9
6 7 9 8 7 8 5 9 3 8 2 9 2 0 4 8 5
59) A
60) B
61) C
62) D
63) D
64) B
65) symmetric
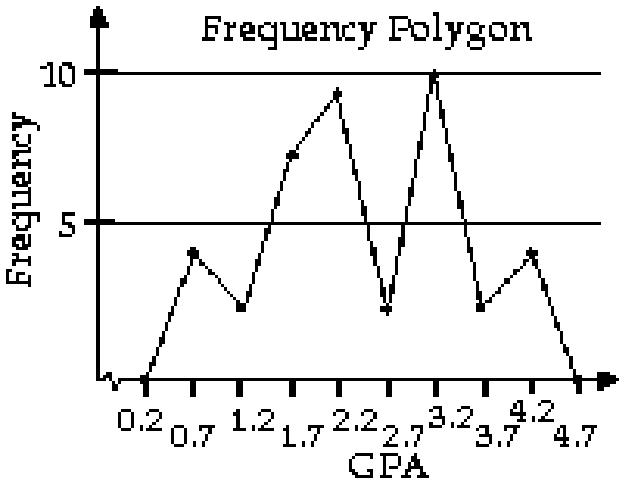
0 5-0 9
1 0-1 4
1 5-1 9
2 0-2 4
2.5-2.9
3.0-3.4
3 5-3 9
4 0-4 4 4 2 7 9


81) A
82) In general, there is an increasing trend in high-energy drinks consumption of adult Americans However, beginning in Year 9, there is sign of a decreasing trend


From Year 1 to Year 3, there was an increasing trend in the number of collision deaths Subsequently, there was a decreasing trend 84)

In general, there was a decreasing trend in women's Boston marathon times 85) A
86) D
87) C
88) The bar graph is misleading because the vertical axis starts at 60 instead of 0 This tends to indicate that the number of accidents decreased at a faster rate than they actually did. The graph would be less misleading if the vertical scale began at 0 or if a symbol were used to clearly indicate that the vertical scale is truncated and has a gap. 89) roughly 3 times larger