2 Designs for Description
Chapter Outline
I. Research Methodology
II. Types of Studies
III. Designs to Find Relationships and Show Trends
A. Cross-Sectional Designs
1. Using Surveys With Cross-Sectional Studies
2. Assembling Data in Cross-Sectional Studies
3. Limitations of Surveys
4. Analyzing Data in Cross-Sectional Studies
5. Limits of Cross-Sectional Designs
B. Time-Series Studies
1. Looking at a Time-Series Study
a. Long-Term Trends in the Data
b. Cyclical Variations in the Data
c. Seasonal Variations in the Data
d. Irregular Fluctuations in the Data
2. Forecasting With Time-Series Data
C. Longitudinal Designs
1. Framingham, Massachusetts, Heart Study
2. Cohorts
IV. Meta-Analysis
A. Conducting a Meta-Analysis
B. Limitations of Meta-Analysis
Designs for Description 11
V. Qualitative Research and Designs to Fill in the Details
A. Qualitative Research
B. Case studies
1. Information From Multiple Data Sources
2. Focusing on the Components of a Case
3. What Makes a Quality Case Study?
C. Focus groups
1. Focus-Group Discussions
2. Focus Groups in Public Administration
VI. Summary
Answers to Questions for Review
1. The research design will guide decisions about when and how often to collect data, what data to gather, from whom and how to collect data, and how to analyze data. In addition to assisting in the implementation of the study, having a design aids in bringing more people into the effort to perform the study.
2. a. Answers will vary. Appropriate answers will demonstrate an understanding of the material beyond a memorization of the definitions. Points that can be made include:
Cross-sectional
Advantages: Collect data on many variables, collect data from a large group of subjects, collect data from geographically dispersed subjects; gather information on attitudes and behavior; answer questions of how much, how many, who, what happened; researchers with different interests can often use the same data.
Disadvantages: Cannot measure change over time, cannot determine causal relationships.
Time series
Advantages: Establish a baseline measure, describe change over time, keep track of trends, forecasting, identifying regular changes. Disadvantages: Forecasting inaccuracies due to change in trends, assumption that trends will continue unchanged—researchers must be wary of irregular fluctuations that occur randomly.
Case studies
Advantages: Depth of information, inclusion of multiple sources of information Disadvantages: Data collection consistencies, hard to replicate, and generalizability limited.1
b. Students should identify that a panel design studies the same cases over time. Panel designs allow the researcher to establish time order of events and to track changes among specific groups.
c. Focus groups are recommended when one wants to save time and money by getting people together to collect data. Focus groups are beneficial when the researcher needs to elaborate on survey data, conduct needs assessments, design and plan programs, evaluate existing programs, or conduct exploratory research.
3. Answers will vary. These questions can be used very effectively as class group exercises where students can compare their answers. Appropriate answers will demonstrate an understanding of the material beyond a memorization of the definitions. Variations on these exercises include having the instructor assign the topics to different groups or having the instructor assign one topic to the whole class and letting groups compare answers at the end.
4. Since the data span 15 years, variation in air quality can be assessed over time. The trends to look for in this series design are long-term trends, cyclical variations, and irregular fluctuations. Since this is annual data, seasonal trends would not be apparent (although the instructor might wish to note that seasonal trends would be something to investigate if it could be determined that data have not always been collected in the same month each year). The researcher also needs to carefully examine the qualitative record to determine if there are explanations for the fluctuations such as plant closings, legislation changes, or increased enforcement activities that would suggest that these fluctuations are nonrandom movements as opposed to random irregular fluctuations.
5. The major limitation with this study is the fact that the researcher must be aware that the time interval of data collection changed.
6. Responses should address time and resources limitations toward data collection as likely reasons why agencies would choose not to conduct case studies.
7. A unit is the case as a whole; for instance, a school, whereas a component is a subunit, such as a specific classroom within the school.
8. Look for answers that demonstrate an understanding of the focus-group technique. This exercise should help students understand the richness of the data that may be obtained from focus groups beyond what can be obtained from other techniques, especially cross-sectional designs. For the “outsourcing” topic, questions might include: To what extent should government engage in outsourcing as a cost-saving strategy? Can you think of or have you experienced any drawbacks from government’s use of outsourcing?
9. Look for an understanding of both advantages of the technique itself and the possible cost savings to be realized by combining focus groups with other techniques. Focus groups allow agencies to gain in-depth information about and reactions to a small number of topics. Managers might be concerned that participants do not adequately represent the broader population; they might object to the challenge of having to identify themes and points of agreement drawn from group discussions.
10. Make sure that the students understand the differences between the meta-analysis and the literature review beyond just the definition. Metaanalysis integrates quantitative analysis of existing studies. The example in the text is very helpful in explaining the technique.
Answers to Problems for Homework and Discussion
1. a. Variables: existence of error, dollar amount, type, source, and cause of error. Implied Hypothesis(es): Amount of error varies by source, type, or causes. Research design: cross-sectional. Appropriateness: Appropriate for descriptive purposes.
b. Variables: Participation in Head Start, grade level, scores on cognitive tests. Implied hypothesis(es): Children participating in Head Start will have higher cognitive ability. Research design: Crosssectional or longitudinal time series. Appropriateness: Very limited. There is no mention of a control group or of sufficient variables to assess causality (students have not been introduced to these concepts at this point in the textbook).
c. Variables: Satisfaction with performance, satisfaction with servicing, time period (before/after Magnuson-Moss Warranty Act). Implied hypothesis(es): The Magnuson-Moss Warranty Act increased consumer satisfaction with performance and servicing. Research design: Cohort study. Appropriateness: Adequate.
d. Variables: Foundation resources, foundation expenses. Implied hypothesis(es): Foundation resources and expenses fluctuated over time. Research design: Time series. Appropriateness: Adequate but limited. Note the irregular period of data collection.
e. Variables: Training needs, client characteristics, ways government can meet training needs. Implied hypothesis(es): Training needs will vary with client characteristics (an example of how sometimes in focus-group research the hypothesis is not explicit). Research design: Focus group. Appropriateness: adequate.
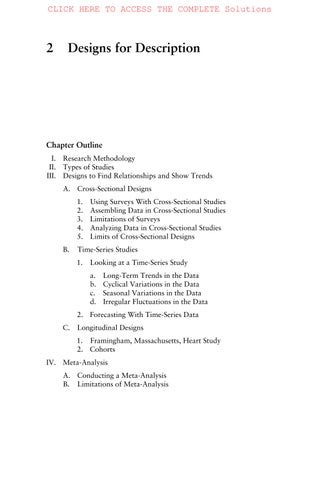
2. Despite occasional dips, there has been a general trend over the past 40 years of high school seniors increasingly identifying smoking as risky. (Instructors may wish to use this as an example of how the Y-axis scale can alter the perception of the difference and encourage a discussion of accurately reporting findings using graphs.) Policy recommendations will vary but should be based on highlighting that efforts to educate teens on the health risks of smoking have had an effect in raising awareness.
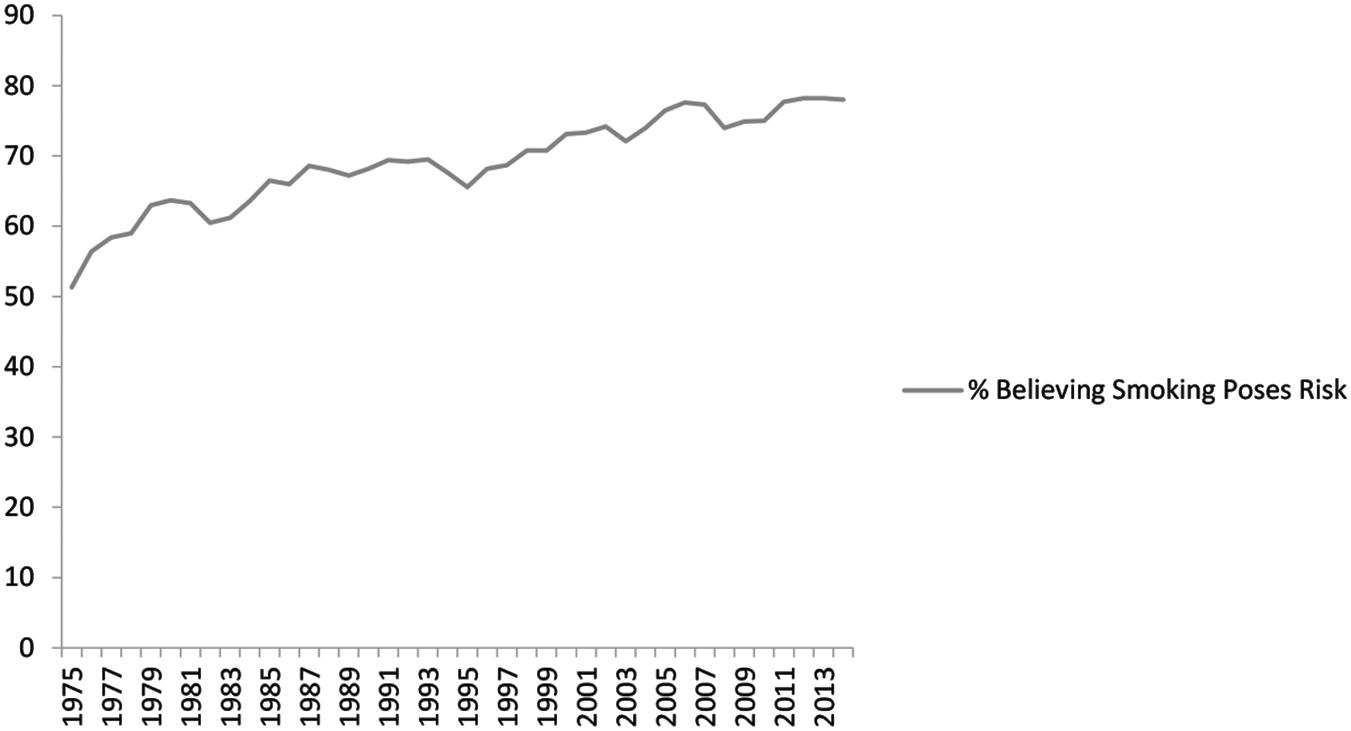
3. a. See graph below.
b. Note the gradual downward trend. The cyclical variation reflects approximately a four-year cycle. The time series for this question can turn out to be very flat if students are not careful. March or April appears to be on the decline almost every year. January seems to be the consistent high point.
c. March or April
4. a. Time series because data has been collected over time; b. Time series because the term “change” implies that events have taken place over time; c. Cross-sectional because data can be collected at a single point in time; d. Time series because fluctuations in
Designs for Description 15 cost necessitate observations at different time periods; e. Time series or cross-sectional because the researcher can choose one time point to study or follow up with repeated measures; f. Crosssectional or time series because the researcher can choose one time point to study or follow up with repeated measures. Justification should focus on the strength of each design in addressing each question.
5. Answers may vary.
a. Unit = clinic, component or subunit = people treated in the clinic. Some desirable information to have on the clinics include location (on-site or one block away), number of staff, the types of services, hours of operation, demographics of the high school served, and the number of people seen. Some desirable information to have on the people treated in the clinics includes demographics of the individuals, diagnoses, treatments, and outcomes of the treatments.
b. School enrollment records for demographics of the unit; clinic for the rest of the unit information; medical records of the clinics for information on individual demographics and treatments.
c. Responses should highlight that, through multiple sources of data, case studies will provide insight into important details relating to clinic performance.
6. The memorandum should highlight that on-the-job training is the most successful training program and that work-skills training is the least successful for all education levels. The memo should also stress the need for more information; hence, additional research is needed.
7. Instructors wishing to give suggestions of sources to consult in searching for meta-analysis articles should look in the references section of the chapter or to articles in Public Opinion Quarterly. Psychology and evaluation research journals are also good places to find meta-analysis examples. Instructors may wish to recommend the utility of Google Scholar searchers by combining search terms such as “job training” and “meta-analysis” at https://scholar.google.com/.
Answers to Working With Data
1. This exercise helps students with the mechanics of analyzing and reporting data. To successfully complete the exercise, students need to generate the average for each of the variables by region and report it in a table. The paragraph should discuss likely relationships between variables and any noticeable differences between the three regions, such as the number of physicians. Discussion can focus on having students generate theories about why there are similarities and differences between the three regions. An example is as follows (note to
instructors: students need a basic understanding of statistical software to conduct this exercise):
Distribution of Income Levels, Population Density, and Number of Physicians by Region of State
RegionMean Family IncomePopulation DensityNumber of Physicians
Coast$53,993202.3185.86
Mountain$50,09361.4822.27
Plain$59,772378.83224.86 County
2 a. Answers will vary depending on how the student recodes the variable income; a description of how the income categories were divided should be included in the paragraph description. Instructors may use this as an opportunity to discuss the effects of differing coding schemes. Findings should compare differences and similarities in mean scores for the three income groups. The table below displays means for the number served in drug and alcohol facilities across the three county income categories. As mean income increases, more individuals are served.
Number served in Alcohol and Drug Facilities:
1
2
3
b. Again answers will vary depending on how the students recoded the income, abuse, drug/alcohol treatment, and crime index variables. Students should be able to describe both the process and reasoning of the recoding procedures. Summary paragraph should again focus on both similarities and differences. For both variables, a substantially higher percentage of the “high” value falls in the category of “high income” counties when compared to the other two income levels. See table below.
Designs for Description 17
c. Comparison here should focus on the value of the information presented, the usefulness of the data, and the implications for policy decisions. Either option provides adequate description; however, data only presenting means is more sensitive to the effect of outliers.
3. Answers will vary based on hypothesis and the analysis. As with the previous questions, the focus should be on presenting useful information for decision making. Findings can serve as a discussion about types of evidence that support a hypothesis. This can also present an opportunity to introduce/discuss the operationalization of variables and the need for clear research questions. Identify and discuss any hypotheses that were not testable.
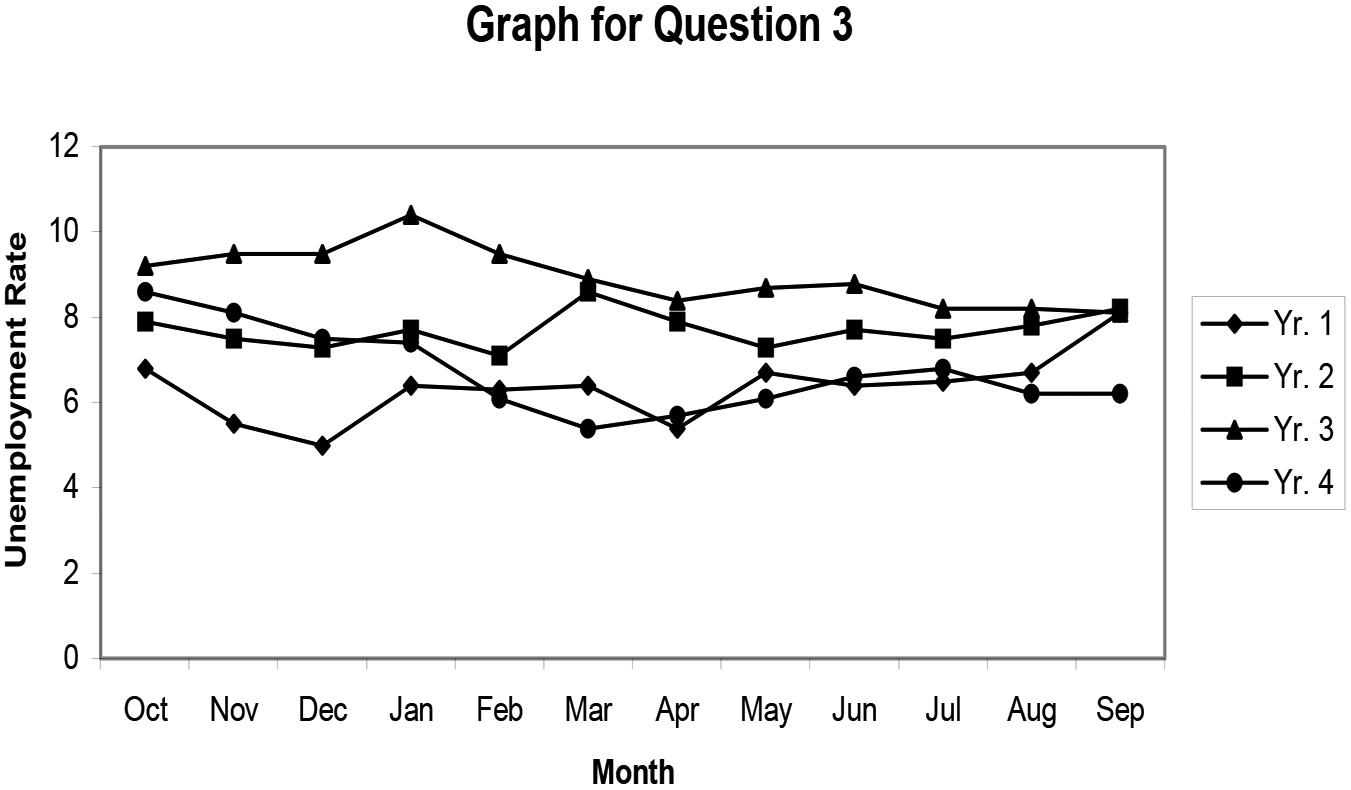
4. From the scatterplot, students should be able to identify a positive relationship between population density and crime index. As population density goes up, so does the crime index.
5. Responses should exhibit understanding that the purpose of the focus group was to determine what factors influence parents’ decision-making processes. Examples include: How extensively did you seek information from the school district regarding different schools? In your opinion, how readily available is school information online?
Suggested Questions
1. Consider the following data on incidences of school vandalism per 1,000 students
Year 1 = 245 Year 5 = 325
Year 2 = 255
Year 3 = 300
Year 4 = 310
Year 6 = 340
Year 7 = 305
Should an analyst conclude that the drop in incidence of vandalism between years 6 and 7 represents a change in the long-term trend or an irregular fluctuation? Justify your answer.
Without data for following year(s), the analyst cannot tell if the shift is an irregular fluctuation or a change in the long-term trend; either is a plausible explanation in year 7.
2. In collecting the school vandalism data, why must investigators a. make sure that each year’s data cover the same time period and b. record other events and changes for each school year?
a. Unless data covers same time period from year to year, one cannot tell if observed change (or lack of change) actually occurred or is simply due to alteration of the time period.
b. Notes on other events are needed to identify possible “causes” for changes noted in a time series (particularly irregular fluctuations).
3. A statewide Committee on School Vandalism formulates hypotheses linking the amount of vandalism to (1) ability tracking, (2) the ratio of custodians to students, (3) the percentage of the school day security officers are on campus, (4) the length of time to make repairs, and (5) student participation in decisions about school. The committee debates whether it should begin by using a cross-sectional design to collect and analyze data from a sample of middle schools and high schools or by running separate experiments to see what changes (e.g., increasing the ratio of custodians to students) will ameliorate the problem. Which would you recommend? Why? Strongest answers will show an awareness of cost/benefits of both strategies. Cross-sectional designs seem best because of cost and time involved. Researchers can then identify relationships strong enough to merit experimental studies. A major problem with experiments may occur in implementation, for example, the ability to achieve random assignment and the ability to control for history, experimental mortality, and design contamination.
4. Plot the following data as a time series and answer the questions following.
YearNumber of Persons Employed in Public Education
YearNumber of Persons Employed in Public Education
1970803,0001979973,000
1971848,0001980960,000
1972865,0001981945,000
1973880,0001982952,000
1974877,0001983975,000
1975875,0001984995,000
1976881,0001985993,000
1977950,0001986985,000
1978966,0001987975,000
Designs for Description 19
Describe the behaviors of this time series. Comment on the following sources of variation: long-term trend, cyclical, seasonal, irregular. Which are evident in this time series? Explain your answer. The overall trend in this time series is upward, but there are three irregular downward sloping periods: 1975–1976, 1981–1982, and 1985–1987. Seasonal variation does not apply to annual data.
5. For each of the following problems, suggest a research design. Justify your choice.
a. To examine whether increasing the state penalties for poaching bears five years ago has had an impact on the bear population. Time series
b. To determine the type and cost of cellular phone services that are used by state agencies and how the state agencies utilize these services. Cross-sectional
c. To determine if consolidating all of the state’s cellular telephone services with one company under a single contract saved money. Time series
d. To ascertain whether employees from the water-testing laboratory used any of the skills taught at a safety seminar. Time series or cross-sectional
6. For each of the following studies: Identify the variables, state the implied hypothesis(es), and identify the research design.
a. Researchers gathered data from 25 years on all of the agencies of one state to examine the percentage difference between agency budget requests and the amount appropriated to each agency by the legislature.
Variables: Budget requests, budget appropriation, percentage difference in request and appropriation, agency. Implied hypothesis(es): The percentage difference between the request and appropriation varied by agency. Research design: Time series.
b. The county manager gathered figures on the local yearly unemployment rate and compared them to the percentage of property taxes owed that were collected for each of those years.
Variables: Yearly unemployment rate, percentage of property taxes collected. Implied hypothesis(es): Percentage of property taxes collected varied with unemployment rate. Research design: Time series.
c. The state commerce department surveyed businesses and asked them to evaluate the effectiveness of the program charged with providing the businesses with information about worker-training programs in their area.
Variables: Effectiveness of the program, location, number of programs available in their area. Implied hypothesis(es): Effectiveness of the program varied by location. Research design: Cross-sectional.
d. Health department officials selected a number of children who were born in the new premature baby facility at a public hospital in the
20 Designs for Description
same month to a group of babies who were also premature but were born in the regular facilities at another public hospital during the same month. Public health officials surveyed their parents every year for 10 years to track the health and fitness of the children.
Variables: Health and fitness of the children. Implied hypothesis(es): Children born in the special facility were healthier. Research design: Cohort study.
e. Interested in the opinion of parents about the quality of the city park facilities, recreation department officials selected four groups of parents who frequently brought their children to parks to participate in moderator-led discussions about the facilities.
Variables: Opinion about the park facilities, frequency of use, reasons for use. Implied hypothesis(es): Opinion about park facilities will vary with client characteristics. Research design: Focus group.
7. Consider the following data on the percentage of funds expended on the labor department’s annual appropriation. Plot the data as a time series on a line graph and describe the variations.
Suggested Projects or Class Exercises
Obtain figures for any of the following for the last 15 years. Graph the data and describe the variations found in the dataset.
1. Enrollment figures for your college or university.
2. Revenue figures for your county or municipality.
3. Expenditures for your county or municipality.
4. Number of employees of the organization where you work.
5. Number of fires fought by your local firefighters.
Note
1 Students interested in budgeting and finance will find the following an interesting example of a multiple-case analysis: Daniel Hummel, “Right-Sizing Cities: A Look at Five Cities,” Public Budgeting and Finance 35, no. 2 (2015): 1–18.