1. You are gathering information about different Master's programs in criminal justice. One thing you want to know is how many students of a cohort drop out each year. The program director of the first school informs you that 45 students dropped out in the previous academic year. The second program you are interested in reports a number of 8 drop-outs in the last academic year.
a. Now consider 879 graduate students are enrolled in program 1, whereas 135 are enrolled in program 2. Does your interpretation change? Report the drop-out rate per 50 students.
b. Calculate the percentage of drop-outs for both programs.
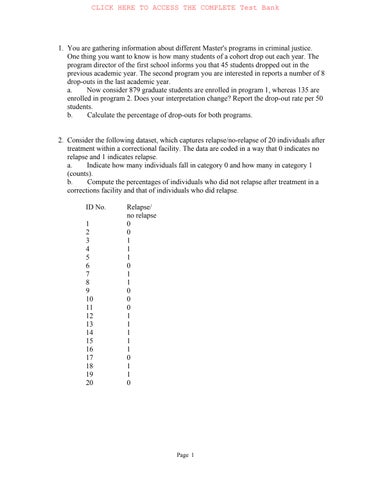
2. Consider the following dataset, which captures relapse/no-relapse of 20 individuals after treatment within a correctional facility. The data are coded in a way that 0 indicates no relapse and 1 indicates relapse.
a. Indicate how many individuals fall in category 0 and how many in category 1 (counts).
b. Compute the percentages of individuals who did not relapse after treatment in a corrections facility and that of individuals who did relapse.
3. The ACME community treatment center is attempting to evaluate the types and amounts of resources and interventions they should provide to their clients. It is known that elderly clients (50+) typically require fewer resources, followed by the middle-aged clients. Finally, younger clients (<30) are more likely to recidivate, which indicates a greater need for more services.
The following are a list of ages from a sample of n = 35 individuals incarcerated in one treatment cohort in the ACME CTC in 2015.
a. Create a grouped frequency distribution of the dataset. Group ages as you feel best suits the dataset. Be sure to include the frequency and the percentage for each grouping.
b. Based on your created frequency distribution, which group should the ACME CTC invest in? Why? Should any other groups be included? Why or why not?
Answer Key
1. a. Program 1: 45/879 × 50 = 2.56
Program 2: 8/135 × 50 = 2.96
By taking program size into consideration, you are standardizing drop-out numbers and you find that both programs nearly have the same drop-out rate per 100 students enrolled in the program.
b. % drop-outs program 1 = 5.12%; % non-drop-outs program 1 = 94.88%
% drop-outs program 2 = 5.93%; % non-drop-outs program 2 = 94.07%
2. a. Eight individuals did not experience a relapse (category 0) after treatment in a corrections facility, whereas 12 individuals did relapse (category 1).
b. % category 0 = 8/20 × 100 = 40%
% category 1 = 12/20 × 100 = 60%
Although 40% of those who have received treatment within a corrections facility did successfully distance themselves from drugs, 60% did relapse and their dependence on drugs continues.
3. a. Group 1: youngest (<30), freq. = 17 (49%); group 2: middle aged (30–49), freq. = 12 (34%); group 3: elderly (³50), freq. = 6 (17%).
b. XACME CTC should invest in the youngest group, because they are the most represented in their population and most prone to recidivism. We could break the under 30 category further so that teenagers are disaggregated, since they often need unique services.