
Getting Started Chapter
ANSWERS TO CHAPTER CHECKPOINTS
Problems and Applications
1. Provide three examples of scarcity that illustrate why even the 1,826 billionaires in the formworld face scarcity.
The 1,826 billionaires might want to be able to eat unlimited meals without gaining weight; live to be at least 140 years old and enjoy perfect health everyday; be able to wake up in San Francisco and go to sleep in Paris after spending no more than 3 hours on a plane. None of these wants can be fulfilled given the present state of technology and resources available.
2. Label each entry in the list as dealing with a microeconomic topic or a macroeconomic topic. Explain your answer.
• Motor vehicles production in China is growing by 10 percent a year.
This entry is a microeconomic topic because individuals and businesses make decisions whether to buy or sell cars.
• Coffee prices rocket.
This entry is a microeconomic topic because individuals and businesses make decisions whether to buy or sell coffee.
• Globalization has reduced African poverty.
This entry is a macroeconomic topic because globalization is the result of choices made by billions of people rather than an individual or business.
• The government must cut its budget deficit.
This entry is a macroeconomic topic because neither an individual nor a business makes decision to cut expenditures.
• Apple sells 20 million iPhone 6 smartphones a month.
This entry is a microeconomic topic because individuals and Apple make decision whether to buy or sell iPhones.
Use the following information to work Problems 3 to 6.
Jurassic World had world-wide box office receipts of $1.66 billion. The movie’s production budget was $150 million with additional marketing costs. A successful movie brings pleasure to millions, creates work for thousands, and makes a few people rich.
3. What contribution does a movie like Jurassic World make to coping with scarcity? When you buy a movie ticket, are you buying a good or a service?
Scarcity still exists but the amount of entertainment available in the economy increases. Buying a ticket to watch a movie is buying a service.
4. Who decides whether a movie is going to be a blockbuster? How do you think the creation of a blockbuster movie influences what, how, and for whom goods and services are produced?
The audience decides whether a movie will be a blockbuster because the audience decides whether to attend the movie.
The “what” question is affected in three ways: First, one good or service that is produced is the blockbuster movie. Second, the people whose incomes are higher as a result of the blockbuster then buy an assortment of goods and services and so this assortment of goods and services is produced. Finally, the “what” question is influenced if the movie leads to spinoff goods (such as toys) or creates a series of sequels or similar films. The “how” question is affected to the extent that movies use different production methods. Some movies, for instance, have a lot of special effects while other movies have few or none. The “for whom” question is influenced because those people who receive the profits of a blockbuster movie have higher incomes and so more goods and services are produced for them.
5. What are some of the components of marginal cost and marginal benefit that the producer of a movie faces?
Some of the marginal costs the producer faces are the cost of an actor or actress, the costs of the crew for a day, the costs of a location, and the costs of advertising in a newspaper. The marginal benefits the producer enjoys are his or her salary and/or profit participation from the movie, royalties from the movie, the prestige resulting from a successful movie, and any awards given to the producer of the movie.
6. Suppose that Chris Pratt had been offered a part in another movie and that to hire him for Jurassic World, the producer had to double Chris Pratt’s pay. What incentives would have changed? How might the changed incentives have changed the choices that people made?
The higher pay would have increased Mr. Pratt’s incentive to make Jurassic World rather than the other movie and perhaps affected his choice to
© 2021 Pearson Education, Inc.
make Jurassic World rather than the other movie. The higher pay would have increased the incentive of the producer to decrease the expense of other aspects of the movie so the producer might have chosen to reduce the pay of the other stars in the movie.
7. What is the social interest? Distinguish it from self-interest. In your answer give an example of self-interest and an example of social interest. The social interest looks at what is best for society as a whole; choices that are best for society as a whole are said to be in the social interest. The selfinterest looks at what is best for the individual; choices that are best for the individual making the choice are said to be in the self-interest. An example of a choice made in the self-interest is a student’s decision to take an economics class. An example of a choice made in the social interest is a firm’s decision to reduce its air pollution.
8. Pam, Pru, and Pat are deciding how they will celebrate the New Year. Pam prefers to take a cruise, is happy to go to Hawaii, but does not want to go skiing. Pru prefers to go skiing, is happy to go to Hawaii, but does not want to take a cruise. Pat prefers to go to Hawaii or to take a cruise but does not want to go skiing. Their decision is to go to Hawaii. Is this decision rational? What is the opportunity cost of the trip to Hawaii for each of them? What is the benefit that each gets?
Pam, Pru and Pat’s decision to go to Hawaii is rational. All three of them considered the cost and benefit of various New Year’s plans. All three were at least willing to go to Hawaii while Pam and Pat were unwilling to go skiing and Pru was unwilling to go on a cruise. The opportunity cost of the trip for Pam is a cruise; for Pru, it is skiing; and for Pat, it is a cruise. The benefit each receives is the pleasure, the relaxation, excitement, and/or knowledge gained from the trip.
9. Label each of the entries in the list as a positive or a normative statement.
• Low-income people pay too much for housing.
The entry that low-income people pay too much for housing is a normative statement.
• The number of U.S. farms has decreased over the past 50 years. The entry about the number of farms is a positive statement.
• Toyota expands parts production in the United States.
The entry about Toyota expanding parts production is a positive statement.
• Imports from China are swamping U.S. department stores. The entry about imports is a normative statement.
• The rural population in the United States is declining. The entry about the population in rural areas is a positive statement.
© 2021 Pearson Education, Inc.
Use the following information to work Problems 10 to 12.
REI is paying its employees to take Black Friday, Thanksgiving off REI, the outdoor gear and apparel retailer, is paying employees to celebrate Thanksgiving 2015 by spending Black Friday outdoors with their families.
Source: Sustainable Brands, October 28, 2015
10. With Black Friday off with full pay, explain what is free and what is scarce. The workers’ time remains scarce because Black Friday remains only one day. REI’s gear and apparel remain scarce because there is a still a limited amount of these products. The publicity that REI received is not free because the company paid for it with less production and, accordingly, less revenue and profit.
11. What is REI’s incentive to give its workers Black Friday off? Was REI’s decision made in self-interest or in the social interest? Explain your answer.
REI’s managers have the incentive to give their employees the day off if they believe that the positive publicity that resulted could lead to increased future sales. The managers might also believe that the employees would feel grateful and would worker harder in the future. Of course, the managers also had the incentive to give their workers the day off because many other employers do so.
REI’s decision to give its workers a paid day off had elements of both selfinterest and social interest. To the extent that his decision was motivated by the free publicity and a resulting rise in sales, or the expectation that its employees would work more diligently in the future, the decision was motivated by self-interest. However to the extent that a desire to allow the workers a chance to spend time with their families, the decision also had elements of social interest.
12. Do you think that REI workers will shop or spend the day with family? Explain your answer.
REI workers will make a rational choice. People make a rational choice when they undertake an activity in which the marginal benefit of the activity exceeds the marginal cost of the activity. Some REI workers will shop and others will spend the day with their family, depending on which alternative’s marginal benefit exceeds its marginal cost.
13. Read Eye on the Benefit and Cost of School on p. 12 and explain why both you and Clayton Kershaw made the right decision.
Clayton Kershaw made the right decision to skip college because his opportunity cost of attending college (which includes his forgone salary playing baseball) exceeded his benefits from attending college. For most students, the opportunity cost of attending college is not so large, so for most students the benefits from attending college exceed the opportunity cost of attendance. For these students, attending college is the right decision.
© 2021 Pearson Education, Inc.
Additional Problems and Applications
1. Read Eye on the Benefit and Cost of School on p. 12 and explain which of the following items are components of the opportunity cost of being a full-time college student who lives at home. The things that the student would have bought with
• A higher income
The items the student would have purchased with the higher income he or she would have earned if he or she was not a full-time student are an opportunity cost of being a full-time student.
• Expenditure on tuition
The cost of tuition is part of the opportunity cost of being a full-time student because this expense is paid only because the person is a student.
• A subscription to the Rolling Stone magazine
If the subscription was required by a class and the individual subscribed only because of the class requirement, then the cost of the subscription is an opportunity cost of being a student. However if the person would have subscribed to Rolling Stone even if he or she was not a student, then the cost of the subscription is not an opportunity cost of being a student.
• The income a student will earn after graduating
The income earned after graduation is not an opportunity cost of being a student.
2. Think about the following news items and label each as involving a what, how, or for whom question:
• Today, most stores use computers to keep their inventory records, whereas 20 years ago most stores used paper records.
Stores using computers for inventory records today versus paper 20 years ago answers the how question.
• Healthcare professionals and drug companies recommend that Medicaid drug rebates be made available to everyone in need. Deciding whether to offer lower Medicaid drug rebates, which would lower the prices for drugs, is a for whom question.
• An increase in the gas tax pays for low-cost public transit. Building a low-cost public transit system answers a what question. Because not everyone will use the public transportation equally nor will everyone pay the same amount of taxes, there also is a for whom aspect of the headline.
3. The headlines in the list appeared in The Wall Street Journal. Classify each
© 2021 Pearson Education, Inc.
headline as a signal that the news article is about a microeconomic topic or a macroeconomic topic. Explain your answers.
• U.S. hiring bounces back
This entry is a macroeconomic topic because the hiring bounce concerns the hiring in the overall economy and neither an individual nor a business makes the decision to increase aggregate hiring.
• Sears to open three small-format stores
This entry is a microeconomic topic because it concerns the decision made by one business, Sears.
• Samsung expects 60% profit drop
This entry is a microeconomic topic. It describes the change in profit of one business.
• U.S. sees trade deal with China
This entry is a macroeconomic topic because the trade deal affects a large number of imported and exported goods and services and thereby affects the national and global economies.
4. Your school decides to increase the intake of new students next year. To make its decision, what economic concepts would it have considered? Would the school have used the “economic way of thinking” in reaching its decision? Would the school have made its decision on the margin? The school would consider the extra revenue that each additional student would bring and compare that to the extra cost of providing each student with instruction and service. By comparing the extra revenue and the extra cost, the school is making its decision on the margin and is using the economic way of thinking. If the school compares the additional revenue to the additional cost, it makes its decision on the margin.
5. Provide examples of (a) a monetary incentive and (b) a non-monetary incentive, a carrot and a stick of each, that government policies use to influence behavior.
(a) A monetary carrot that the students might answer because it is close to their lives is student aid, such as Pell grants. A monetary stick might be taxes on liquor.
(b) A non-monetary carrot is government support for youth sports, such as allowing little league teams to use a county park, and a nonmonetary stick is jail terms for illegal drug or alcohol use.
6. Think about each of the items in the list and explain how they affect incentives and might change the choices that people make:
• A hurricane hits Central Florida.
The hurricane affects the people in Central Florida and the consumers who purchase the products produced in Central Florida, such as orang-
© 2021 Pearson Education, Inc.
es or vacation services. Residents’ incentives change if they suffered damage from the hurricane because they have the incentive to repair the damage. If the price of home repair rises, residents who specialize in home repair have an incentive to work longer hours to earn the higher price. If the hurricane raises the price of the goods and services produced in Central Florida, consumers have the incentive to buy less of these particular goods and services because they are more expensive.
• The World Series begins tonight but a storm warning is in effect for the area around the stadium.
The report of the possible storm decreases fans’ incentive to attend the game. Some fans decide to stay at home and watch the game on television.
• The price of gasoline falls as the supply of oil increases.
The fall in the price of gasoline affects drivers’ incentives to buy gasoline and large gas-guzzling cars. Drivers decide to buy more gasoline and more large gas-guzzling cars. They also might decide to ride public transportation less often.
• Economists expect hiring to increase.
The report that economists expect that hiring will increase raises unemployed people’s incentives to look for a job. It also might lead some employed workers to look for a new, better job.
7. Does the decision to make a blockbuster movie mean that some other more desirable activities get fewer resources than they deserve? Is your answer positive or normative? Explain your answer.
Making a blockbuster movie means that some other activities get fewer resources. But whether “more desirable” activities get fewer resources than they “deserve” is a normative answer for two reasons. First the question of whether an activity is more desirable or less desirable depends on the person’s judgment and values. Second the determination of whether an activity gets fewer resources than it deserves also involves the normative decision about the quantity of resources an activity deserves. So the answer to the question of whether making a blockbuster movie means that other more desirable activities get fewer resources than they deserve is a normative answer that depends on the student’s values.
8. Provide two examples of economics being used as a tool by (a) a student, (b) a business, and (c) a government. Classify your examples as dealing with microeconomic topics and macroeconomic topics.
(a) Students might answer that they use economics as a tool when they budget their student aid and when they decided which college to attend based on the costs of their options. Both instances deal with microeconomics.
(b) A business uses economics as a tool when it decides the price it
© 2021 Pearson Education, Inc.
charges for its product and the salaries it pays its managers. Both instances are microeconomic examples.
(c) The government use economics as a tool when it decides whether to increase taxes on cigarettes or lower the interest rate. The first example is microeconomic in nature and the second involves macroeconomics.
Use the following news clip to work Problems 9 to 11. Are carbon prices working?
Economists say that raising the cost of burning coal, oil, and gas is a costeffective way to lower carbon emissions, but most countries that have tried this solution have not set prices high enough to bring large enough cuts.
Source: New York Times, April 2, 2019
9. What are the benefits of burning less coal, oil, and gas to produce electricity? Who receives these benefits: the users of electricity or the owners of power plants, or both the users and the owners?
Benefits include: (1) a reduction in carbon emissions, which brings a decrease in the contribution of human activity to global warming and climate change, and (2) cleaner air, which contributes to improved health. Both the users of electricity and the owners of power plants receive the benefits.
10. What are the costs of using less coal, oil, and gas to produce electricity? Who bears these costs: the users of electricity or the owners of power plants, or both the users and the owners?
The cost of higher prices for using less coal, oil, and gas will be the directly higher price for these resources as well as the costs of any equipment that enables the power plant to use less coal, oil, or gas. Another cost could be the lost jobs in the coal, oil, and gas sectors. Users of electricity, who pay higher prices for electricity, will pay some of these costs and owners of power plants, who receive lower profits from producing electricity, also will pay some of the costs.
11. Explain whether lowering carbon emissions has an opportunity cost. Lowering carbon emissions has an opportunity cost because the resources devoted to this reduction could be used instead to producing other goods and services.
© 2021 Pearson Education, Inc.
Multiple Choice Quiz
1. Which of the following describes the reason why scarcity exists?
A. Governments make bad economic decisions.
B. The gap between the rich and the poor is too wide.
C. Wants exceed the resources available to satisfy them.
D. There is too much unemployment.
Answer: C Answer C uses the definition of scarcity on page 2.
2. Which of the following defines economics?
Economics is the social science that studies ___________.
A. the best way of eliminating scarcity
B. the choices made to cope with scarcity, how incentives influence those choices, and how the choices are coordinated
C. how money is created and used
D. the inevitable conflict between self-interest and the social interest
Answer: B Answer B uses the definition of economics on page 2.
3. Of the three big questions, what, how, and for whom, which of the following is an example of a how question?
A. Why do doctors and lawyers earn high incomes?
B. Why don’t we produce more small cars and fewer gas guzzlers?
C. Why do we use machines rather than migrant workers to pick grapes?
D. Why do college football coaches earn more than professors?
Answer: C Answer C describes how grapes are picked.
4 Which of the following is not a key idea in the economic way of thinking?
A. People make rational choices by comparing costs and benefits.
B. Poor people are discriminated against and should be treated more fairly.
C. A rational choice is made at the margin.
D. Choices respond to incentives.
Answer: B Answer B is not part of description of the economic way of thinking on page 8.
5. A rational choice is ___________.
A. the best thing you must forgo to get something
B. what you are willing to forgo to get something
C. made by comparing marginal benefit and marginal cost
D. the best for society
Answer: C Answer C is part of description of a rational choice on pages 8 and 9.
6. Which of the following best illustrates your marginal benefit of studying?
A. The knowledge you gain from studying 2 hours a night for a month
B. The best things forgone by studying 2 hours a night for a month
C. What you are willing to give up to study for one additional hour
D. What you must give up to be able to study for one additional hour
Answer: C Page 10 shows that answer C is the marginal benefit of studying.
7. The scientific method uses models to ___________.
A. clarify normative disagreements
B. avoid the need to study real questions
C. replicate all the features of the real world
D. focus on those features of reality assumed relevant for understanding a cause and effect relationship
Answer: D Answer D uses the definition of an economic model from Checkpoint 1.3.
8. Which of the following is a positive statement?
A. We should stop using corn to make ethanol because it is raising the cost of food.
B. You will get the most out of college life if you play a sport once a week.
C. Competition among wireless service providers across the borders of Canada, Mexico, and the United States has driven roaming rates down.
D. Bill Gates ought to spend more helping to eradicate malaria in Africa.
Answer: C Answer C is a positive statement because it can, in theory, be tested.
Appendix: Making and Using Graphs
ANSWERS TO APPENDIX CHECKPOINT
Problems and Applications
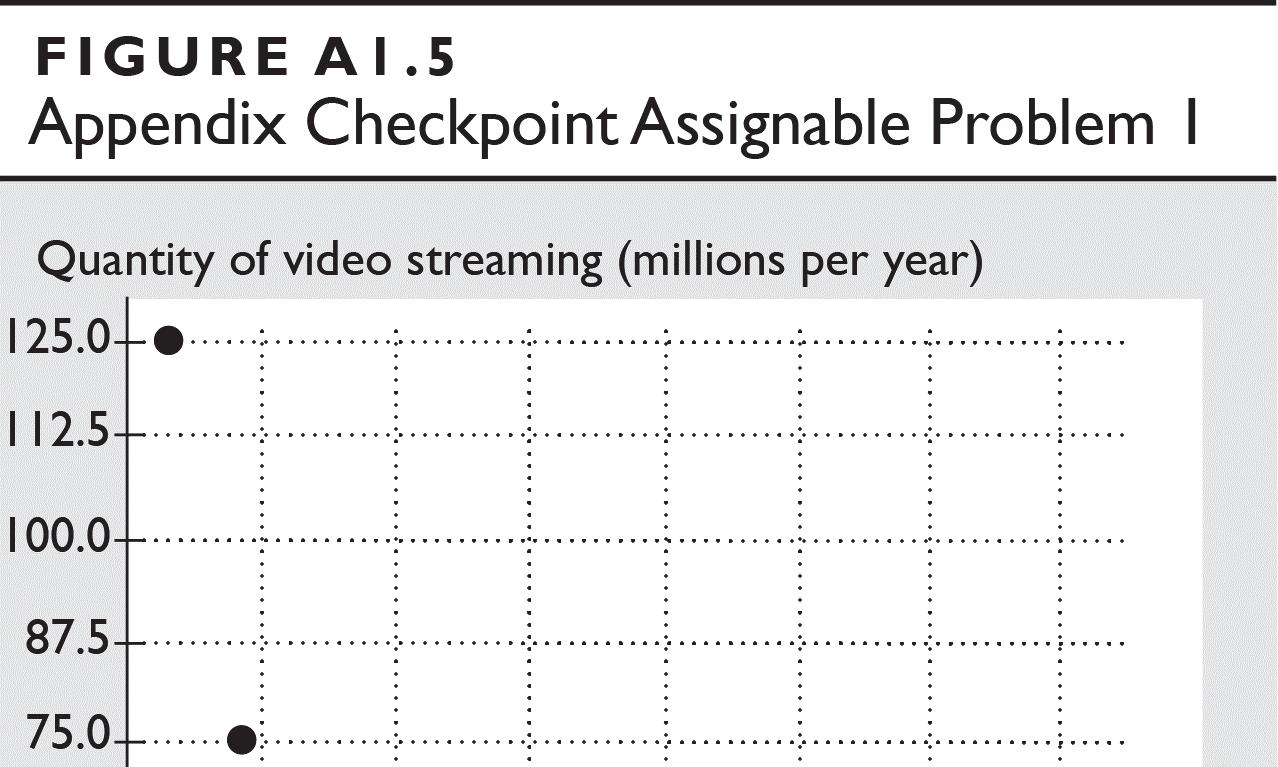
The spreadsheet in the table provides data on the U.S. economy: Column A is the year; the other columns are quantities sold in millions per year of compact discs (column B), music videos (column C), and video streaming (column D). Use this spreadsheet to work Problems 1 and 2.
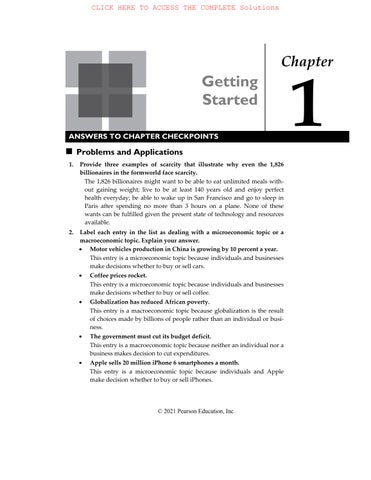
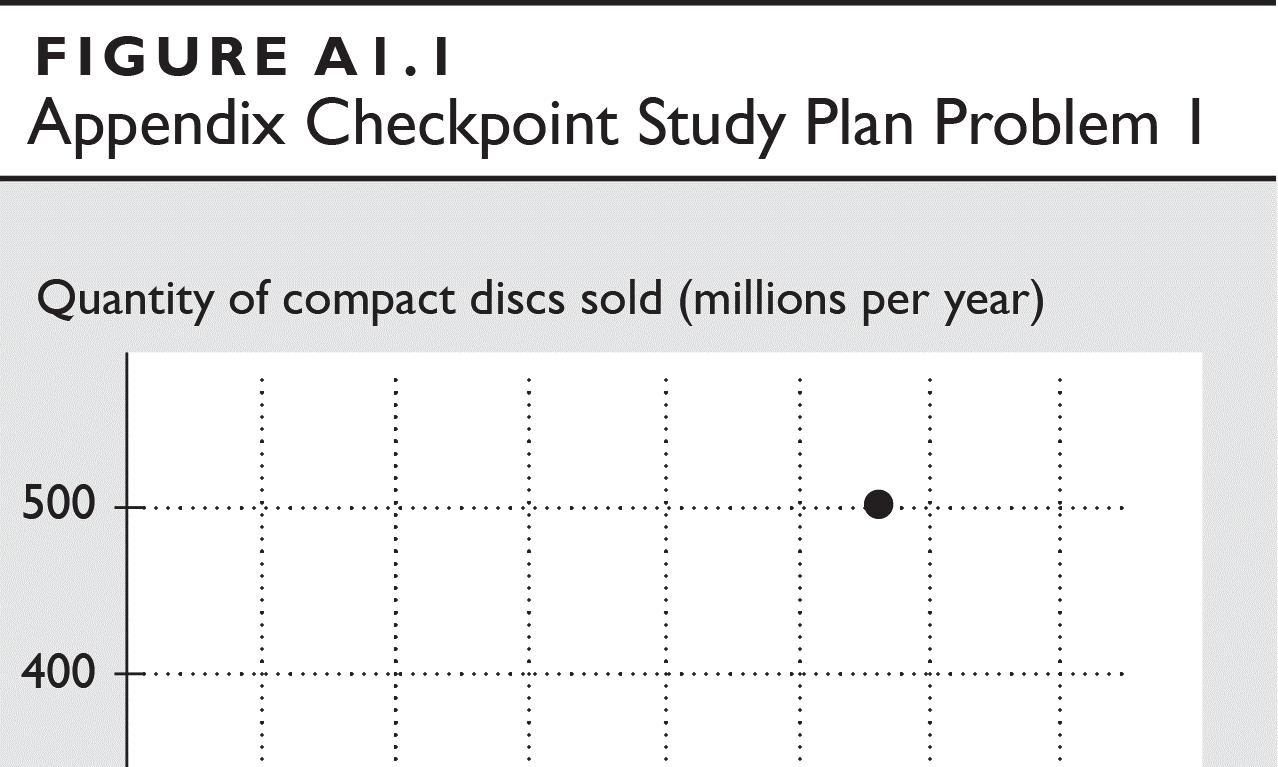
1. Draw a scatter diagram to show the relationship between the quantities sold of compact discs and music videos. Describe the relationship. Figure A1.1 illustrates the relationship of the data from the spreadsheet between the quantities sold of compact discs and the quantities sold of music videos. Over all the period, there appears to be a positive or direct relationship; that is, when more compact discs are sold, more music videos are sold.
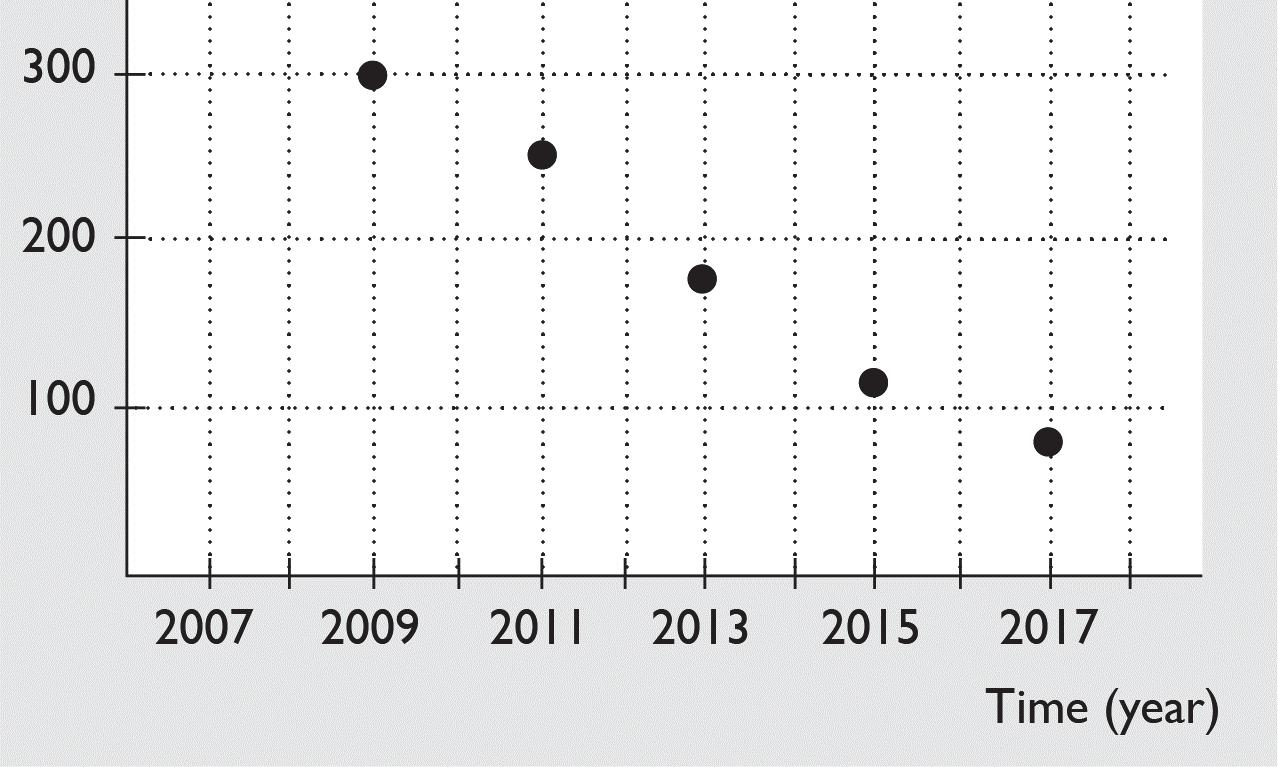
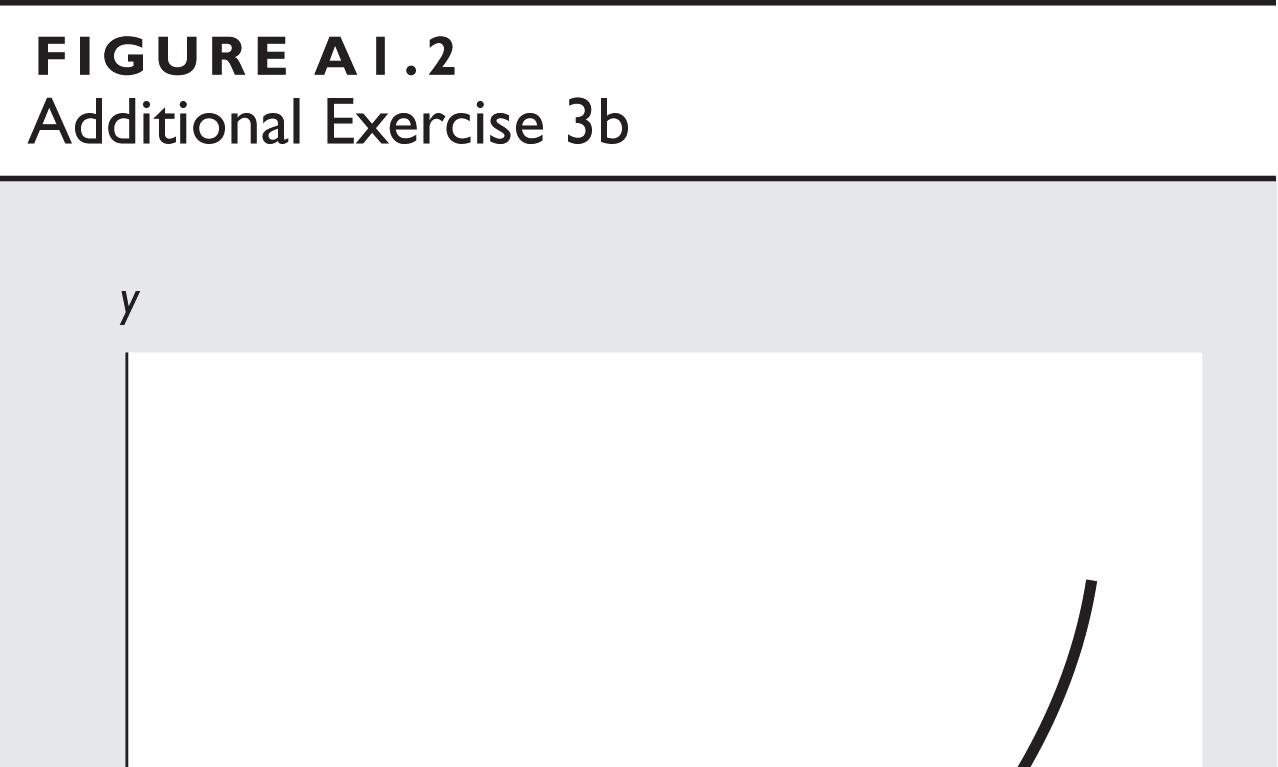
2. Draw a time-series graph of quantity of compact discs sold. Say in which year or years the quantity sold (a) was highest, (b) was lowest, (c) increased the most, and (d) decreased the most. If the data show a trend, describe it.
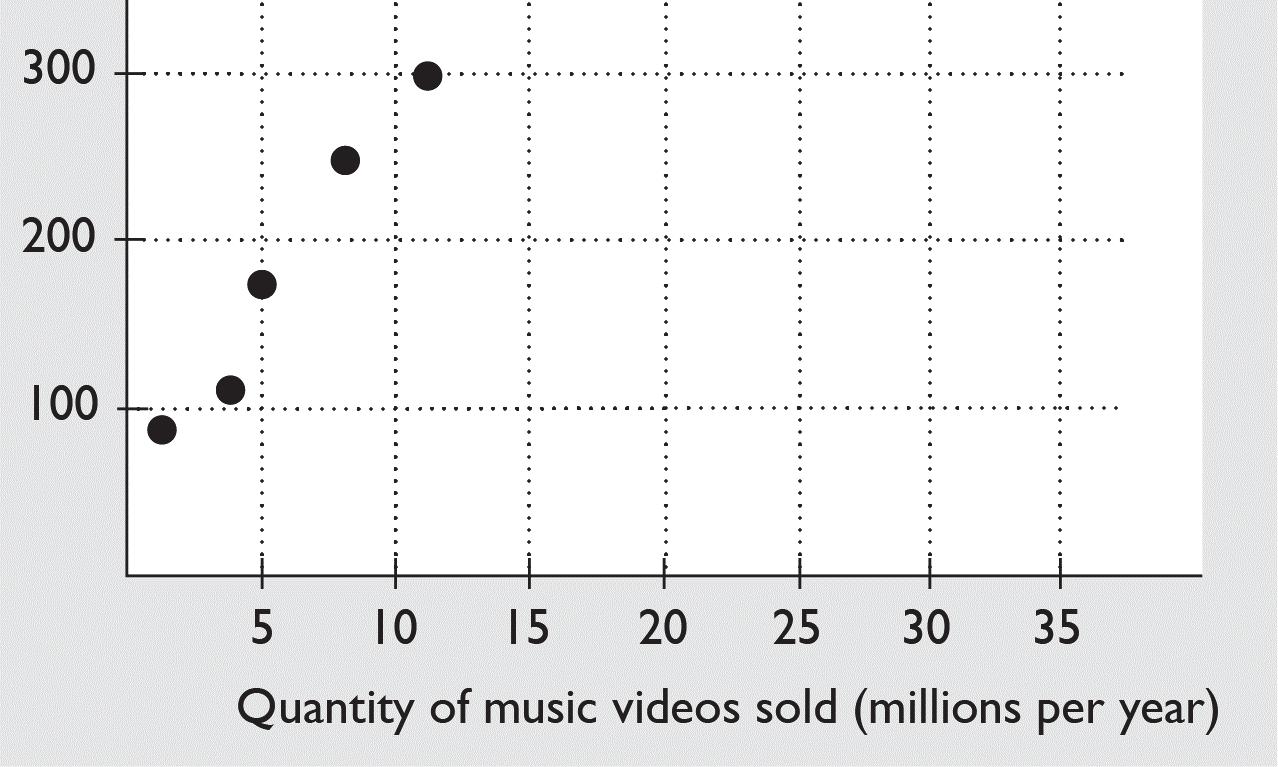
Figure A1.2 illustrates the time series of the quantity of compact discs sold using the data from the spreadsheet.
a. The quantity sold was the highest in 2007.
b. The quantity sold was the lowest in 2017.
c. The quantity sold never increased.
d. The quantity sold decreased the most between 2007 and 2009 when it decreased by 203 million.
Over the entire time period covered in the figure, there is a downward trend in the quantity of compact discs sold.
3. The following data shows the relationship between two variables x and y. x 0 1 2 3 4 5 y 32 31 28 23 16 7
Is the relationship between x and y positive or negative? Calculate the slope of the relationship when x equals 2 and when x equals 4. How does the slope change as the value of x increases?
The relationship is negative: When x increases, y decreases. The slope of the relationship equals the change in y divided by the change in x along the tangent line; that is, the slope of the relationship at a point equals the slope of the tangent line at that point. When x equals 2, the slope of the tangent line equals –4, so the slope of the relationship equals –4. When x equals 4, the slope of the tangent line equals –8, so the slope of the relationship equals –8. The slope of the relationship increases in magnitude (the line becomes steeper) as x increases.
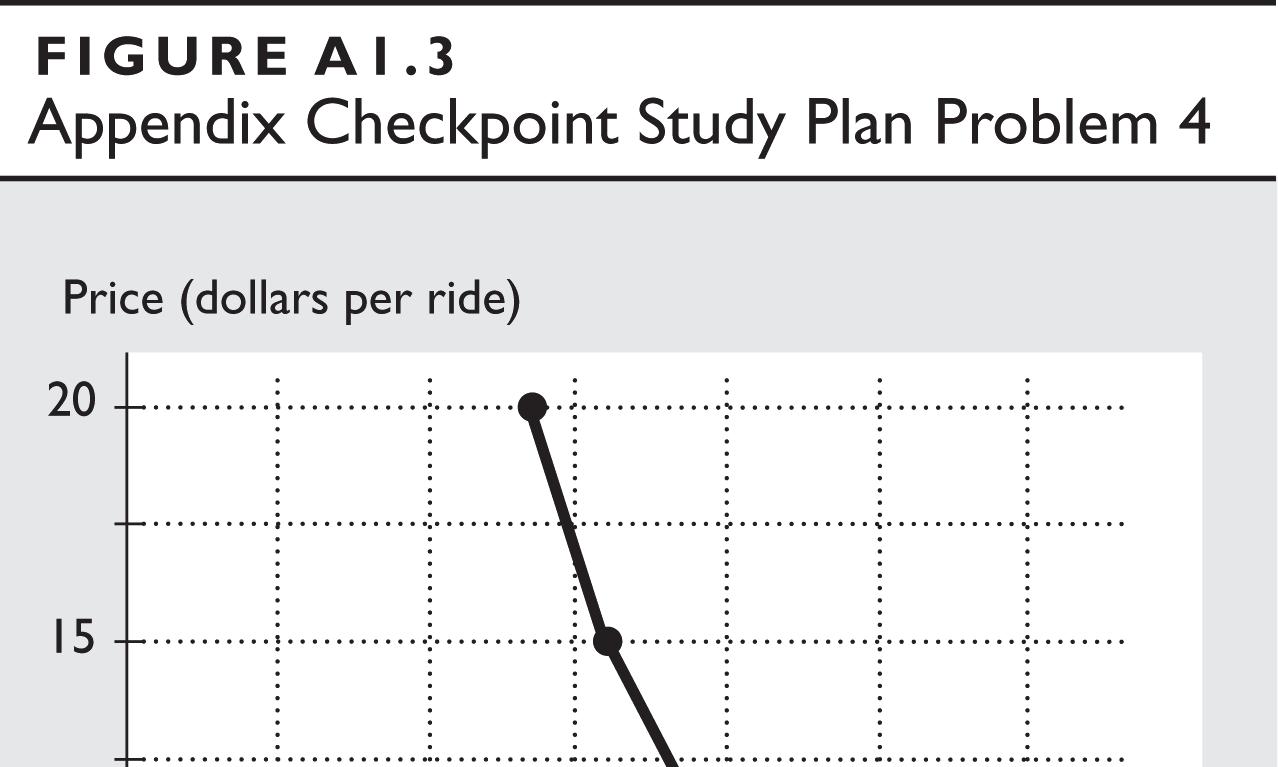
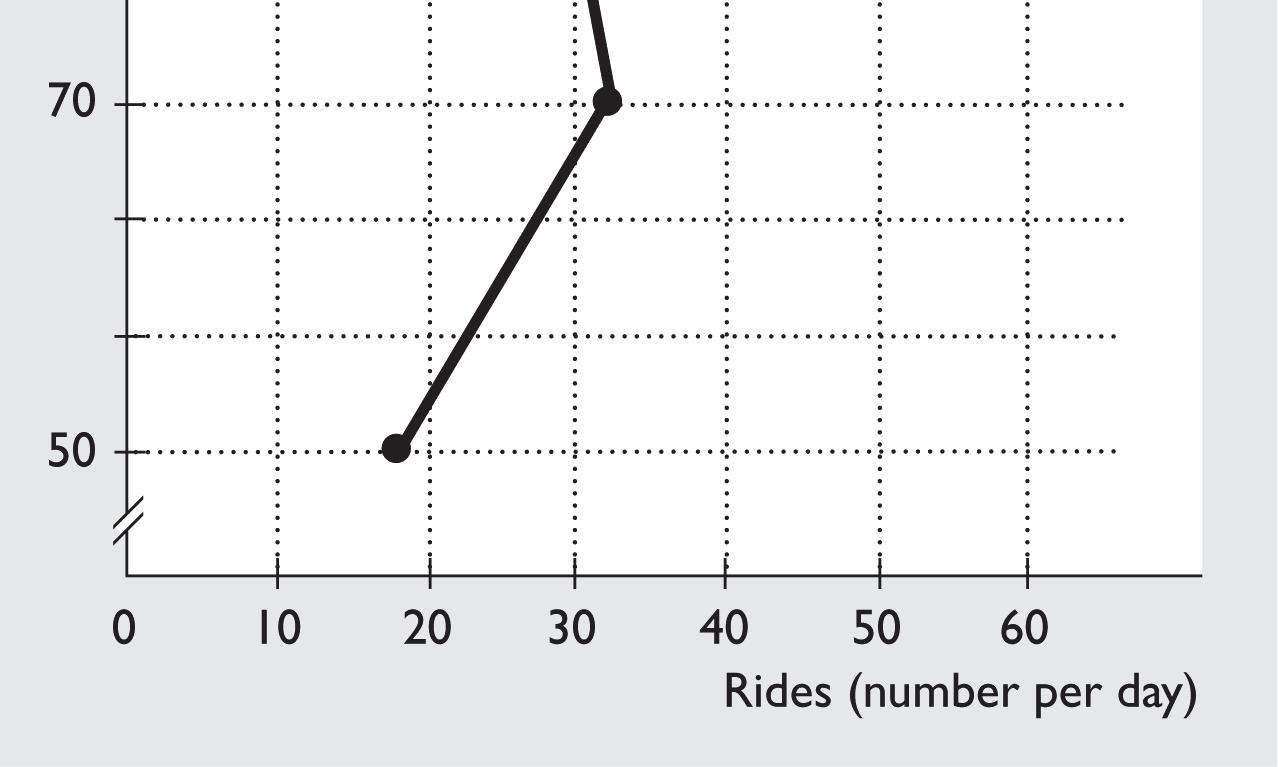
4. The table provides data on the price of a balloon ride, the temperature, and the number of rides a day. Draw graphs to show the relationship between
• The price and the number of rides, when the temperature is 70°F.
Figure A1.3 illustrates the relationship between the price and the number of rides when the temperature is 70°F.
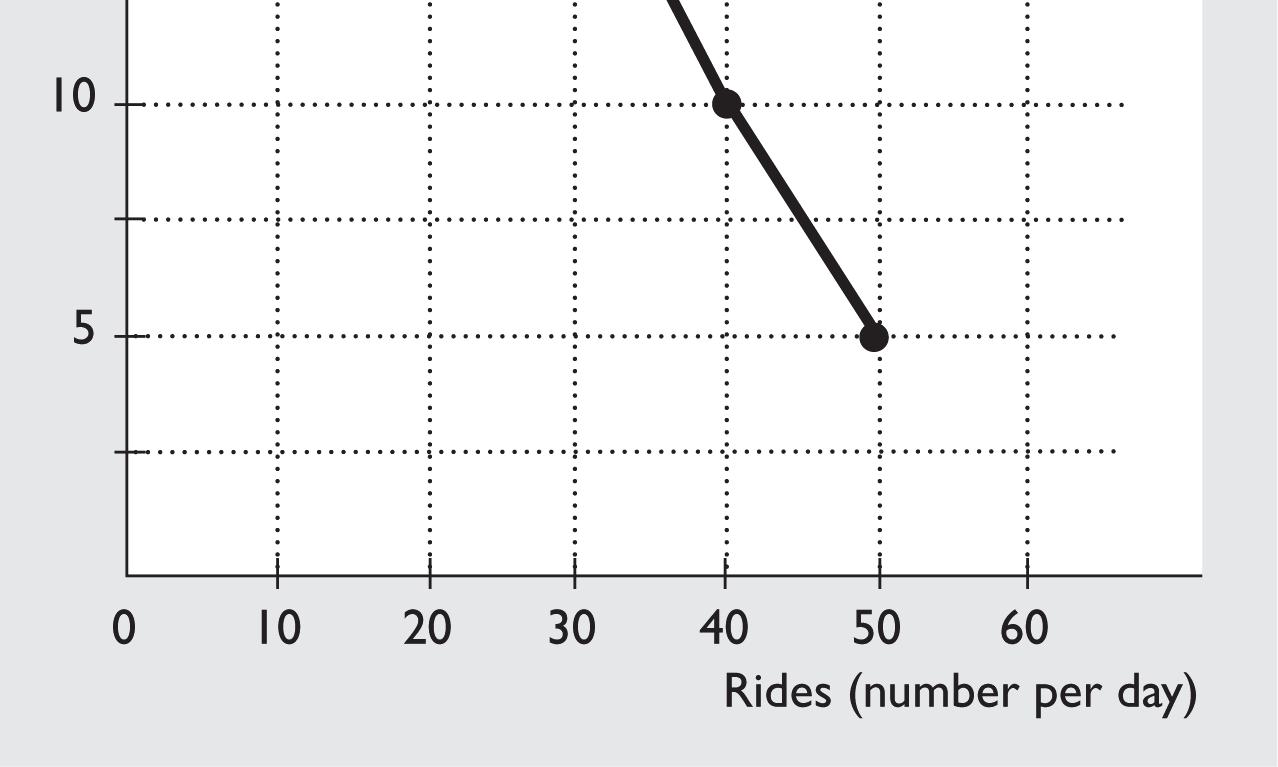
• The number of rides and the temperature, when the price is $15 a ride.
Figure A1.4 illustrates the relationship between the number of rides and the temperature, when the price is $15 a ride.
Additional Problems and Applications
Use the information in the table to work Problems 1 and 2. Column A is the year; the other columns are quantities sold in millions per year of compact discs (column B), music videos (column C), and video streaming (column D).
1. Draw a scatter diagram to show the relationship between quantities sold of music videos and video streaming. Describe the relationship.
Figure A1.5 illustrates the relationship of the data from the spreadsheet between the quantities sold of music videos and singles downloads. Over all the period, is negative or indirect relationship; that is, when fewer music videos are sold, more video is streamed.
© 2021 Pearson Education, Inc.
2. Draw a time-series graph of the quantity of music videos sold. Say in which year or years the quantity sold (a) was highest, (b) was lowest, (c) decreased the most, and (d) decreased the least. If the data show a trend, describe it.
Figure A1.6 illustrates the time series of music videos sold using the data from the spreadsheet.
a. The quantity sold was the highest in 2007.
b. The quantity sold was the lowest in 2017.
c. The quantity sold decreased the most between 2007 and 2009, when it decreased by 16 million.
d. The quantity sold decreased the least between 2013 and 2015, when it decreased by 1 million.
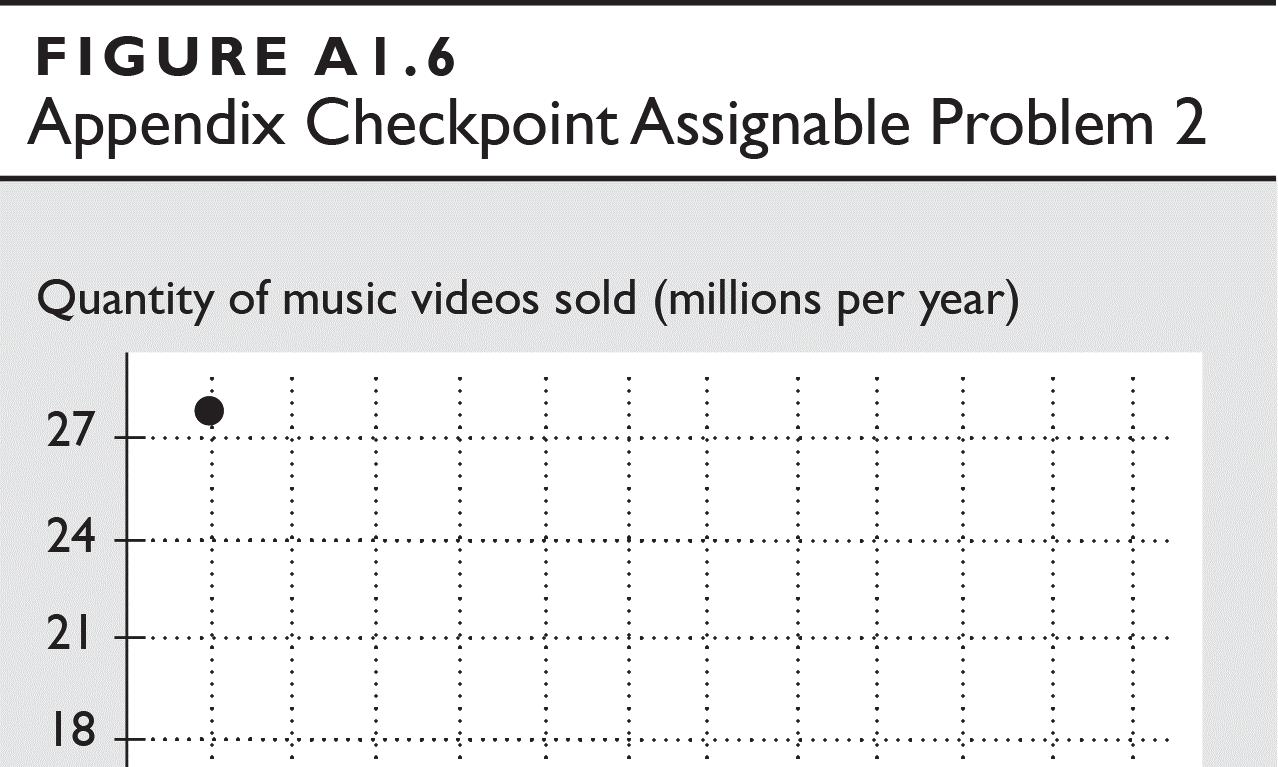

There is a downward trend in the quantity of music videos sold. Use the following data on the relationship between two variables x and y to work Problems 3 and 4.
3. Is the relationship between x and y positive or negative? Explain. The relationship is positive: When x increases, y also increases.
4. Calculate the slope of the relationship when x equals 2 and x equals 4. How does the slope change as the value of x increases?
The slope of the relationship equals the change in y divided by the change in x along the tangent line; that is, the slope of the relationship at a point equals the slope of the tangent line at that point. When x equals 2, the slope of the tangent line equals 4, so the slope of the relationship equals 4. When x equals 4, the slope of the tangent line equals 8, so the slope of the relationship equals 8. The slope of the relationship increases as x increases.
© 2021 Pearson Education, Inc.
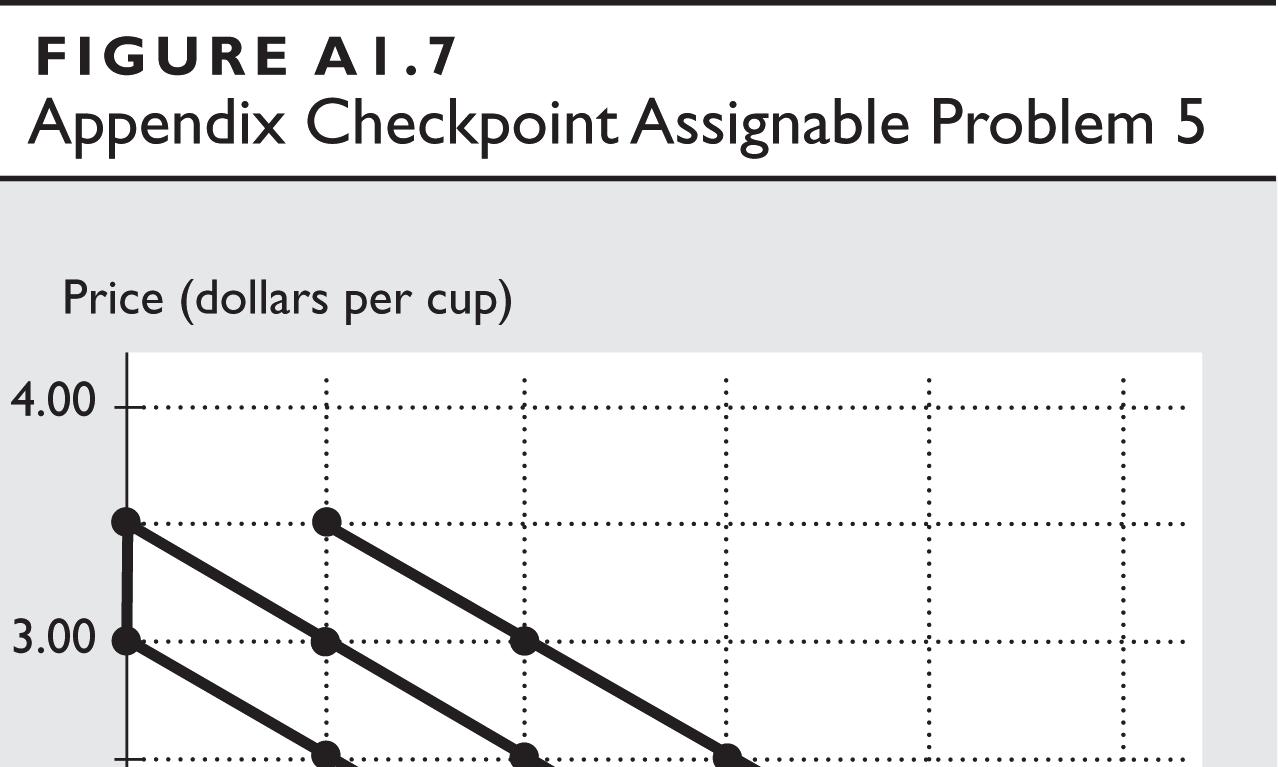
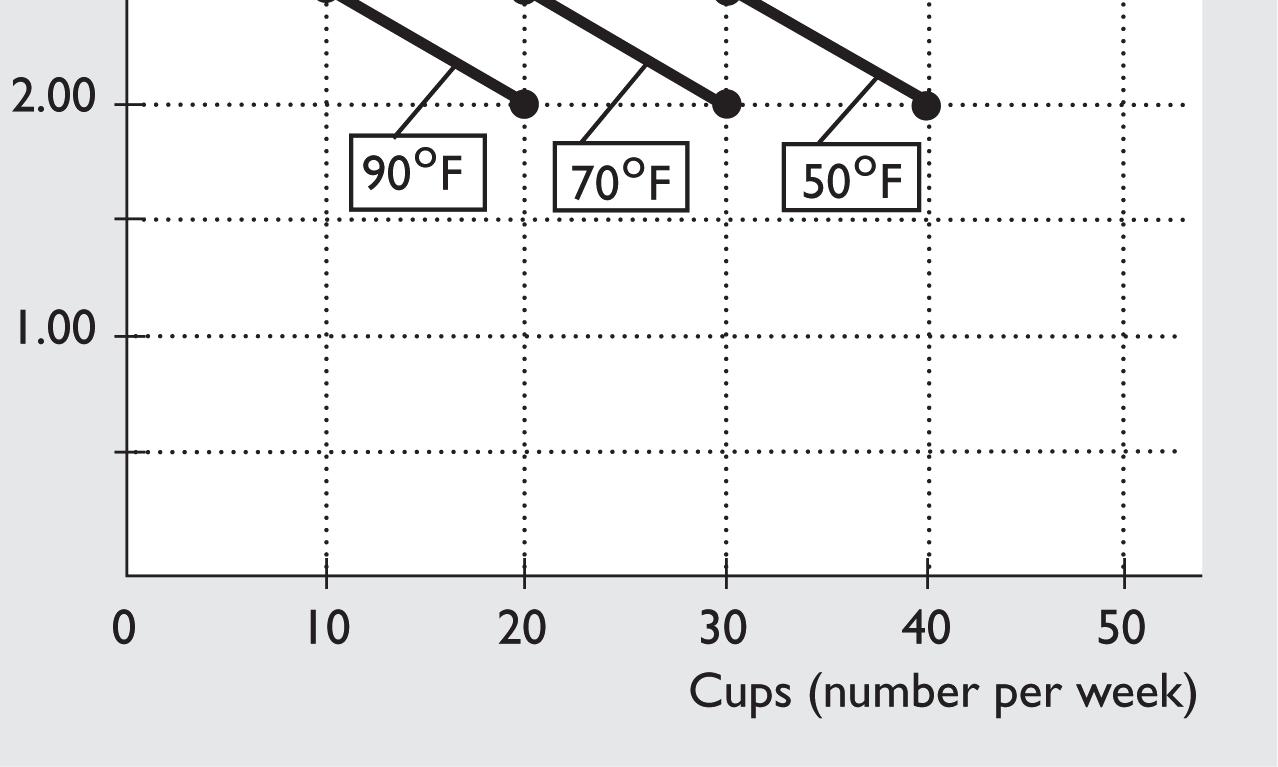
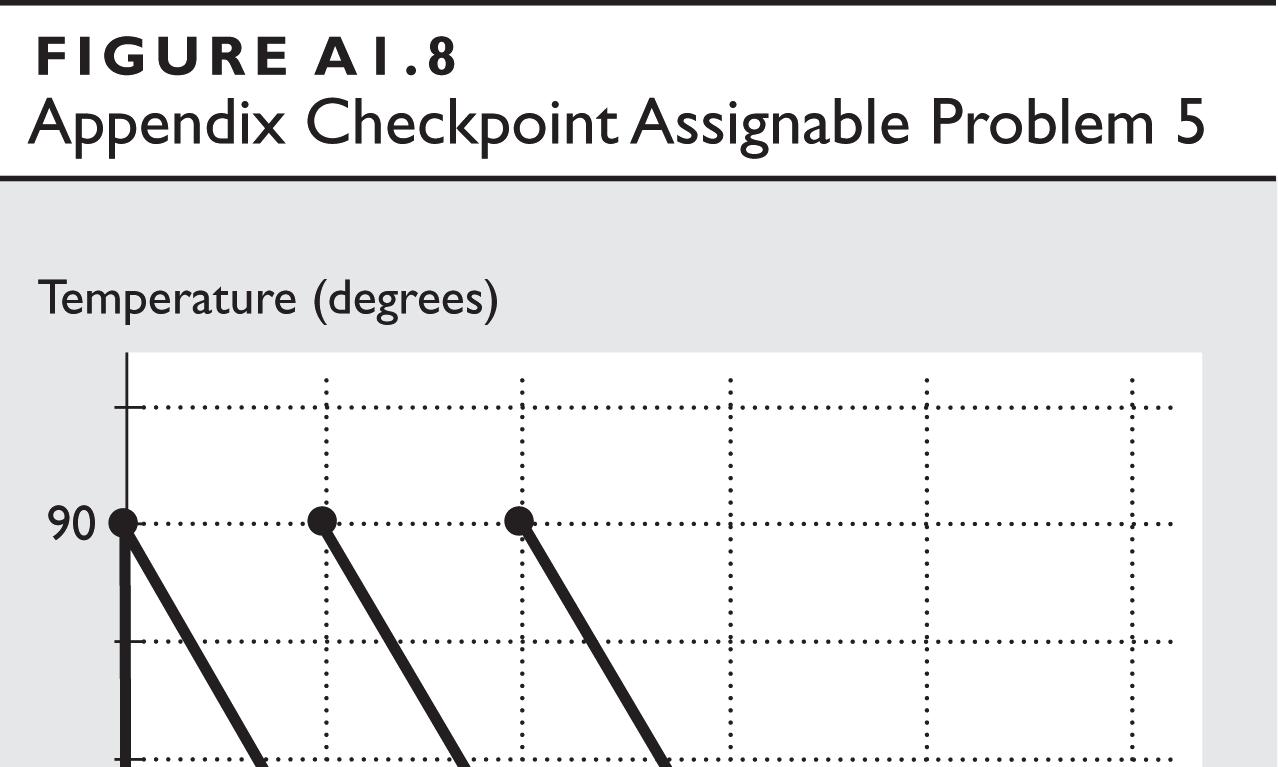
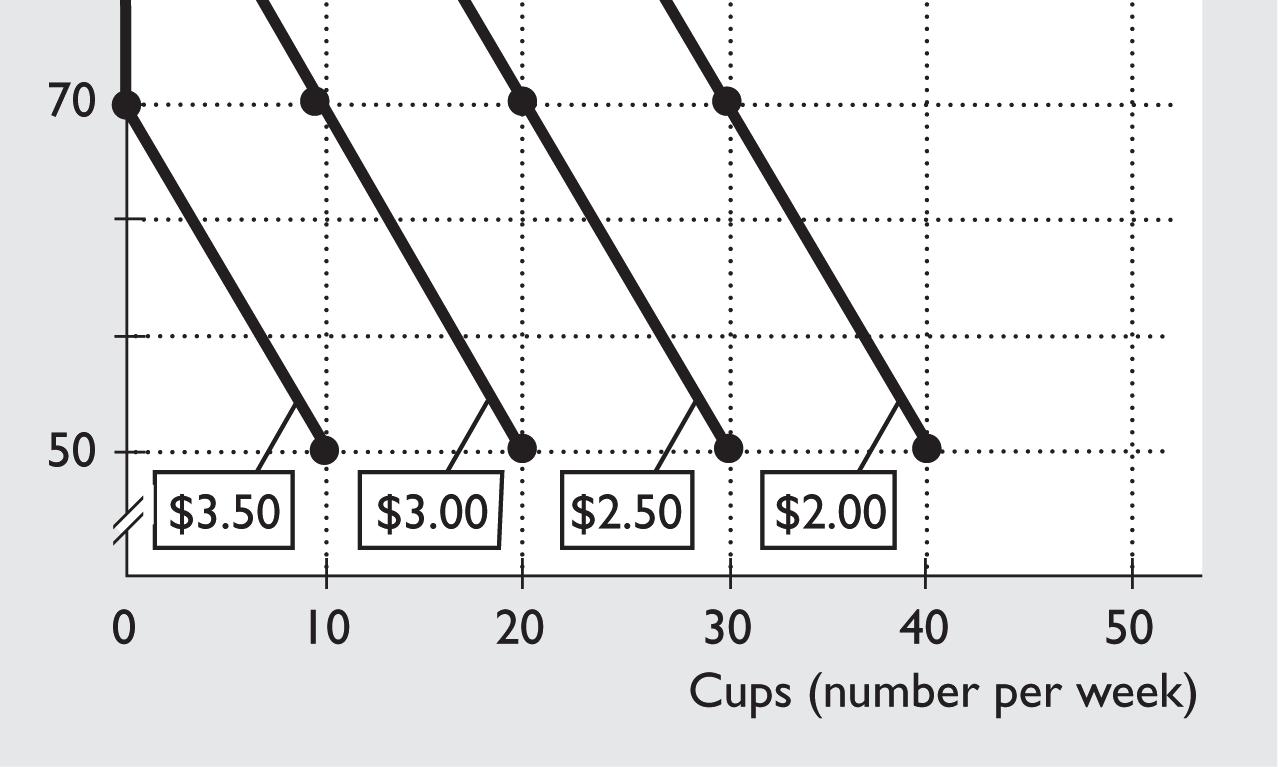
5. The table provides data on the price of hot chocolate, the temperature, and the cups of hot chocolate bought. Draw graphs to show the relationship between
• The price and cups of hot chocolate bought, when the temperature is constant.
Figure A1.7 illustrates the relationship between the price and the number of cups bought holding constant the temperature. Note that there are three relationships, one for each temperature.
• The temperature and cups of hot chocolate bought, when the price is constant.
Figure A1.8 illustrates the relationship between the number of cups bought and the temperature, holding constant the price. Note that there are four relationships, one for each price.
CHAPTER OUTLINE
Getting Started Chapter
I. Define economics and explain the kinds of questions that economists try to answer.
A. Scarcity
B. Economics Defined
1. Microeconomics
2. Macroeconomics
C. What, How, and For Whom?
1. What?
2. How?
3. For Whom?
D. Can the Pursuit of Self-Interest Be in the Social Interest?
1. Self-Interest and the Social Interest
2. Globalization
3. The Information Revolution
4. Climate Change
5. Government Budget Deficit and Debt
2. Explain the ideas that define the economic way of thinking.
A. A Choice Is a Tradeoff
B. Cost: What You Must Give Up
C. Benefit: What You Gain
D. Rational Choice
E. How Much? Choosing at the Margin
1. Marginal Cost
2. Marginal Benefit
3. Making a Rational Choice
F. Choices Respond to Incentives
3. Explain how economists work as social scientists and policy advisers.
A. Economics as a Social Science
1. Economic Models
2. Check Predictions of Models Against Facts
3. Disagreement: Normative versus Positive
B. Economics as a Policy Tool
4. Describe the jobs available to an economics major and explain how economics is useful as a life skill and job skill.
A. Jobs for an Economics Major
B. Will the Number of Economics Jobs Grow?
C. How Much Do Economics Majors Earn?
D. Skills needed for Economics Jobs
1. Critical-thinking skills
2. Analytical skills
3. Math skills
4. Writing skills
5. Oral communication skills
E. Economics for Life
1. Personal Decisions
2. Business Decisions
3. Government Decisions
4. Community Decisions
What’s New in this Edition?
The material dealing with economics as a social science has been increased and made into a new Chapter Checkpoint. The last Checkpoint, dealing with the use of Economics in a student’s life, now covers the types of jobs economic majors accept and the salaries these jobs offer. The data describing the state of the economy, such as the sixty year decline in the percentage of total production created by manufacturing, has been updated. The “In the News” questions in the Chapter Checkpoints have been changed and updated.
Where We Are
In Chapter 1, we review definitions and address questions that economics helps answer. We also discuss how people make rational choices and preview the fact that these are the choices that individuals and firms make everyday.
Where We’re Going
After laying out the basic ideas of economics in this chapter, and some basic facts about the economy in the next, in Chapter 3 we’ll start building tools and models that help us understand how the economy works. These tools and models, such as the production possibilities frontier and the demand and supply framework, provide valuable insight into how the economy that we operate in each day works.
CHAPTER ROADMAP
IN THE CLASSROOM
Class Time Needed
You can complete this chapter in one session. As simple as the ideas might seem to you, covering the definitions and questions are important to your students, especially in the context of current events and topics. Thus do not shortchange this chapter.
An estimate of the time per checkpoint is:
• 1.1 Definitions and Questions—15 to 20 minutes
• 1.2 The Economic Way of Thinking—15 to 20 minutes
• 1.3 Economics as a Life Skill and Job Skill—15 to 20 minutes
Classroom Activity: For the first week, have the students bring to class newspaper headlines that deal with stories about what goods and services are produced, how goods and services are produced, and for whom the goods and services are produced. When they bring their headlines to class, use the headlines to grab the students’ attention and raise a sense of excitement about learning this subject. Point out to them they will gain real insights into topics such as those in the headlines when they’ve completed their course.
Classroom Activity: Help the students to appreciate the power of models as tools for understanding reality. The analogy of a model as a map is easy and convincing. Jim Peach, a fine economics teacher at the University of New Mexico, gets his students to make paper airplanes on the first day of class. After flying their paper planes around the classroom (and picking up the debris!) he gets them to talk about what they can learn about real airplanes from experimenting with paper (and other model) planes.
Classroom Activity: You also can help your students appreciate that no matter how appealing or “realistic looking” a model appears to be, it is useless if it fails to predict. And the converse, no matter how abstract or far removed from reality a model appears to be, if it predicts well, it is valuable. Milton Friedman’s pool hall example illustrates the point nicely: Imagine a physicist’s model that predicts where a carefully placed shot of a pool shark would go as he tries to sink the eight ball into the corner pocket. The model would be a complex, trigonometric equation involving tangents, cosines and a plethora of Greek symbols that no ordinary person would even recognize as representing a pool shot. It wouldn’t depict what we see—a pool stick striking a pool cue on a rectangular patch of green felt. It wouldn’t even reflect the thought processes of the pool shark, who relies on years of experience and the right “touch.” But constructed correctly, this mathematical model would predict exactly where the cue ball would strike the eight ball, hit opposite the bank, and fall into the corner pocket. (You can invent analogous examples from any sport.)
CHAPTER LECTURE
1.1 Definition and Questions
Scarcity
• Economic questions arise because we always want more than we can get, so we face scarcity, the inability to satisfy all our wants. Everyone faces scarcity because no one can satisfy all of his or her wants.
Forbes lists Bill Gates and Warren Buffet as the two wealthiest Americans. Do these two men face scarcity? According to The Wall Street Journal, both men are ardent bridge players, yet they have never won one of the many national bridge tournaments they have entered as a team. These two men can easily afford the best bridge coaches in the world, but other duties keep them from practicing as much as they would need to in order to win. So even the wealthiest two Americans face scarcity (of time) and must choose how to spend their time.
Economics Defined
• Economics is the social science that studies the choices that individuals, businesses, governments and entire societies make when they cope with scarcity, the incentives that influence those choices, and the arrangements that coordinate them.
• Microeconomics is the study of the choices that individuals and businesses make and the way these choices interact and are influenced by governments.
• Macroeconomics is the study of the aggregate (total) effects on the national economy and the global economy of the choices that individuals, businesses, and governments make.
Lecture Launcher: Students might not fully appreciate that economics is truly a science. They believe that economists are often incorrect in their predictions and assessments of the economy. Here is an opportunity for you to demonstrate humility and also show them (albeit charitably) the error in their conclusion. First, it is important to state honestly that many economists who have made forecasts have not only been wrong but sometimes spectacularly wrong. However, point out that being wrong doesn’t make their work unscientific. Remind the students that all science is constantly evolving. For instance, it was only five centuries ago that scientists believed the earth to be flat! No one claimed that these scientists were engaged in unscientific methods. Instead, when theories no longer fit the facts, they must either be reformulated or discarded in favor of new ones.
Lecture Launcher: Maggy Shannon, who teaches at Gordon College in Georgia, tells her class a story from when she was an undergraduate: She telephoned her mother and in the course of her conversation, mentioned that “Dr. Thomas” had said she might have mono. Her mother was horrified, and didn’t calm down until she had managed to explain that Dr. Thomas was an anthropologist. The point is that some opinions carry more weight than others. And, what the students are preparing to learn is the “opinions” of economists—positive models—about how the economy works.
Lecture Launcher: To help students identify that economists often don’t make one definitive prediction about the future, but instead offer likely possible scenarios based upon the best available data, I always find it useful to quote President Harry S. Truman. Truman was actually quite fond of using economic advisors to help formulate policy, though he quickly recognized how economists liked to hedge their bets by offering a prediction and then the disclaimer, “but, on the other hand…” to account for other possible outcomes. An exasperated Truman famously proclaimed “Give me a one-armed economist!”. It is important to point out that economic forecasting is remarkably similar to weather forecasting – it is a scientific process based upon the best available data and models, but will always be subject to a margin of error.
What, How, and For Whom?
• Goods and services are the objects (goods) and actions (services) that people value and produce to satisfy human wants.
• Societies must answer three very basic questions:
• What?: What determines the quantities of the goods and services produced?
• How?: How are goods and services produced?
• For Whom?: For whom are goods and services produced?
Can the Pursuit of Self-Interest Be in the Social Interest?
• People make choices they are think are best for them, that is, choices in their self-interest.
• Choices that are the best for society as a whole are said to be in the social interest
• A major question economists explore is “Could it be possible that when each of us makes choices in our self-interest, these choices are in the social interest?”
Students (and others!) often take the answers to the what, how, and for whom questions for granted. For instance, most of the time we do not bother to wonder “How does our economy determine how many light bulbs, automobiles, and pizzas to produce?” (what), or “Why does harvesting wheat from a plot of land in India occur with hundreds of laborers toiling with oxen pulling threshing machines, while in the United States, a single farmer streaming George Strait on an iPhone and sitting in an air-conditioned cab of a $500,000 machine harvests the same quantity of wheat from the same sized plot of land?” (how), or “Why is the annual income of an inspiring and effective grade school teacher much less than that of a below-average major-league baseball player?” (for whom). Explaining the answers to these types of questions and determining whether the answers are in the social interest is a major part of microeconomics.
• We can examine whether the self-interested choices serve the social interest for a variety topics:
• Globalization: The acceleration of economic growth in the last two decades has made economic decision-making more complex as multinational concerns must be taken into account. Rational business decisions which bring a wider variety of lower-price choice to consumers may have negative side-effects on some producers.
• The ”information age”: The Information Revolution, an economic restructuring comparable to the Agricultural Revolution and the Industrial Revolution, has brought about
new questions of social interest. Was the development of computers and of the Windows operating system by Microsoft in the social interest?
• Climate change: Climate scientists agree that global warming is at least in part the result of economic activity. The warming may lead to large economic costs. How can individuals and nations satisfy their self-interested desire for goods and services while also protecting the social-interest of the environment?
• Government Budget Deficit and Debt: The U.S. government has been running a budget deficit every year since 2000. In approximately 2020 the deficit will come under increasing pressure because in that year payments for retirement and health-care entitlements will exceed tax revenue for those programs. Do our self-interested choices as voters conflict with the social interest? Do choices made by politicians and bureaucrats promote the social interest or only their self-interests?
1.2 The Economic Way of Thinking
Six core ideas describe the economic way of thinking:
• A choice is a tradeoff.
• Cost is what must be given up to get something.
• Benefit is what you gain from something.
• People make rational choices by comparing costs and benefits.
• Most choices are “how much” choices made at the margin.
• Choices respond to incentives.
A Choice Is a Tradeoff
• Because we face scarcity, we must make choices and select from the available alternatives. A tradeoff is an exchange – giving up one thing to get something else.
Cost: What You Must Give Up
• The opportunity cost of something is the best thing you must give up to get it.
• Choices have an opportunity costs; for example, the opportunity cost of attending college include goods and services forgone from paying for tuition and textbooks, and the goods and services forgone because the student does not have the income from a full-time job.
Benefit: What You Gain
• The benefit of something is the gain or pleasure it brings and is determined by personal preferences – by what a person likes and dislikes and the intensity of those feelings. Economists measure the benefit of something by what a person is willing to give up to get it.
Rational Choice
• A rational choice is one that uses the available resources to most effectively satisfy the wants of the person making the choice. Rational choices compare costs and benefits in order to maximize net benefit. Choices are made on the margin and respond to incentives. Some choices are all-or-nothing choices between two things, while most choices involve how much of an activity to do.
© 2021 Pearson Education, Inc.
To ensure that people do not die of any serious side effects, the Food and Drug Administration (FDA) requires all drug companies to thoroughly test newly developed medicines before allowing them to be sold in the United States. However, it takes many years to perform these tests, and many people suffering from the terminal diseases these new medicines are designed to cure will die before good new medicines are eventually approved for use. Yet, if the FDA were to abandon this testing process, many others would die from the serious side effects of bad medicines that made it to market. People’s lives will be at risk under either policy alternative. This stark example of a tradeoff reveals the idea that choices have opportunity costs.
How Much? Choosing at the Margin
• Making choices at the margin means comparing all the relevant alternatives systematically and incrementally.
• People make choices at the margin by comparing the benefit of a one-unit change in an activity (which is the marginal benefit) to the cost of making a one-unit change in an activity (which is the marginal cost).
• If the marginal benefit of an action exceeds the marginal cost of the action, then the rational choice is to take the action.
Should Jim give up watching the Super Bowl game to take out his girlfriend Amy on her birthday? Jim will make his choice at the margin. Jim’s marginal benefit is that his relationship with Amy strengthens as they share a romantic birthday celebration together. His marginal cost is that he will miss watching the NFL championship game. If the marginal benefit of the dinner exceeds the marginal cost, then Jim will choose to take his girlfriend out on her birthday. If the marginal benefit is less than the marginal cost, then Jim will watch the Super Bowl (and might quickly find himself single!).
Choices Respond to Incentives
• An incentive is a reward that encourages an action or a penalty that discourages an action.
• Changes in marginal benefits and marginal costs alter the incentives that we face when making choices. When incentives change, people’s decisions change. For example, if homework assignments are weighed more heavily in a class’s final grade, the marginal benefit of completing homework assignments has increased and more students will do the homework.
1.3 Economics as a Life Skill and Job Skill
Economics as Social Science
• Economists try to understand and predict the effects of economic forces by using the scientific method – a commonsense way of systematically checking what works and what doesn’t work.
• An economist begins with a question or a puzzle about cause and effect arising from some observed facts.
• An economist’s second step is to build an economic model, a description of some feature of the economy that includes only those features assumed necessary to explain the observed facts.
• The third step is to check the economic model against the facts by using:
• A natural experiment: a situation that arises in the ordinary course of economic life in which the one factor of interest is different and other things are equal (or similar).
• A statistical investigation: looking for a correlation – a tendency for the values of two variables to move together in a predictable and related way.
• An economic experiment: puts people in a decision-making situation and varies the influence of one factor at a time to discover how they respond.
Disagreement: Normative versus Positive
• Economists sometimes disagree about assumptions, models, and policies. Disagreements that can’t be settled by facts are normative statements, statements about “what ought to be,” which are opinions and so are inherently not testable. Disagreements that can be settled by facts are positive statements, statements about “what is” and are testable. A positive statement is “Raising the tax on a gallon of gasoline will raise the price of gasoline and lead more people to buy smaller cars” while a normative statement is “The tax on gasoline should be raised.”
Land Mine: Students sometimes have difficulty sorting out economic facts from economic opinions. One way to cure this problem is to have them cut out articles from a newspaper (possibly U.S.A. Today, The Wall Street Journal, or the New York Times) or copy sections of articles from reliable sources from the Internet. Ask the students to label the headlines as either positive or normative economic statements. Make sure to tell them that one way of distinguishing the headlines is by asking themselves whether the statements represent testable propositions. If the headlines do not, then they are normative statements (that is, value judgments). Explain that some of the common buzzwords that are tip-offs to a normative statement are: should, must, or ought.
Economics as a Policy Tool
All the policy questions on which economists provide advice involve both positive and normative issues.
• Economics can’t help with the normative part, the policy goal, though it may help clarify the goal.
• For a given goal, economics provides the tools for evaluating alternative solutions and finding the solution that makes the best use of the available resources.
© 2021 Pearson Education, Inc.
1.4 Economics as a Life Skill and Job Skill
Economics majors often take jobs as analysts, such as market research analyst, financial analyst, and budget analyst.
Will the Number of Economics Jobs Grow?
The Bureau of Labor Statistics forecasts that between 2014 and 2024, jobs for:
• Budget analysts will grow by 2 percent.
• Financial analysts will grow by 12 percent.
How Much Do Economics Majors Earn?
• According to the Web resource payscale.com, the pay range for economists ranges from $41,226 to $124,177, with a median of $72,279.
• At mid-career, economics majors earn about $100,000 a year, and only chemical engineering and applied math majors have a higher have average pay.
Skills Needed for Economics Jobs
Five skill requirements are key:
• Critical-thinking skills
• Analytical skills
• Math skills
• Writing skills
• Oral communication skills
Economics for Life
Economics is a tool which helps make an endless array of decisions.
• Personal Decisions involve decisions about an individual’s employment, time management, and borrowing and spending.
• Business Decisions involve decisions made at the margin to accomplish a business’s goals such as increasing sales, launching a new product, opening a new branch, or gaining market share.
• Government Decisions is perhaps the most controversial of the types of economic decisions. How should goals such as better education, military preparedness, and safe food be balanced against limited tax revenue and the desire of individual members of government to be reelected?
• Community Decisions involve decisions such as deciding who to vote for and whether to volunteer for a road-cleaning project.
USING EYE ON THE PAST
Adam Smith and the Birth of Economics as a Social Science
Adam Smith used the example of pin making in his opus, The Wealth of Nations, to explain an elementary but profound point. It was an example to which people of his time could easily relate. Before introducing Smith’s work, you might want to consider asking students how productive one worker could be if he or she were the only one on duty at a local McDonald’s restaurant at noon time. The likely response is not very productive. The person would have to cook the burgers, fry the French fries, prepare the drinks, ring up the orders, and clean the dining area. Students will not find it difficult to accept that few customers will be served at this restaurant under these conditions! Next, ask how productivity would change if a second worker were asked to help out at this same restaurant and at the same time. Students will answer that the restaurant will be able to serve more customers. You can point out the gains from division of labor and specialization that are likely to be enjoyed by hiring the second worker. Explain that we owe this simple logic to the founding father of modern day economics, Adam Smith.
USING EYE ON THE BENEFIT AND COST OF SCHOOL
Did You Make the Right Decision?
In order to help students get settled into the classroom, learn a few names, get engaged in the material, and reevaluate the purpose of taking the course, it can be useful to get into a small group activity that goes through this “Eye On” on the first day. While the explicit opportunity costs (tuition, fees, books, materials, etc) might be easier for students to quantify, you can help students quantify the implicit opportunity costs as well (foregone earnings or the value of their leisure time). If the students wouldn’t be working, then assigning a dollar value for the implicit cost is a bit more challenging, but not impossible…after all, leisure time is not “priceless” as many people will initially assume. Ask them what hourly wage they would require to get them to give up an hour of their leisure time –that is the value of an hour’s worth of leisure to them. Depending on the institution at which you teach, the implicit cost associated with your students’ higher education may far exceed the explicit cost. As for the benefits outlined in the “Eye On,” you may also want to suggest they estimate the value to them of a possible job with more desirable non-wage characteristics, having more knowledge, and being a more informed decision maker and voter. Hopefully your students end up with a cost-benefit comparison that tells them they are making a rational choice, or you may not see them again!
USING EYE ON YOUR LIFE
Your Time Allocation
Asking students to fill out the time usage table by keeping track of their actual time allocation is useful in order to help students not only understand the ideas of scarcity and tradeoffs, but also to critically evaluate themselves as students. Students often overestimate how much time they actually dedicate to their academics (and perhaps underestimate how much time their instructors expect them to dedicate). Based on the data provided by the BLS, an average full-time student dedicates 3.3 hours a weekday to their education. According to the description, that includes class time, which means an average student is only spending around 20 minutes a day studying and working on assignments. However, for years the rule of thumb was that students should be spending roughly twice as many hours outside of the classroom working on a course as they spend inside the classroom. For a full-time student, this “rule” would mean 3 hours in the class and 6 hours outside of the class – a total of 9 hours a day, which is similar to a full-time job. Obviously, the average student is falling FAR short of what is being expected of them. Historically, being a college student was thought of as a full-time job, but now students are often being a full-time student while also working. While this situation may be unavoidable due to their personal financial situation, that also means students need to figure out how to reduce their time allocations to other activities in the day if they expect to be successful in college. Calling students’ attention to this discrepancy early in the semester can potentially help students better reallocate their scarce time in order to improve their educational performance (or at least make them less surprised when they don’t earn as high of grades as they were hoping for!).
ADDITIONAL EXERCISES FOR ASSIGNMENT
Questions
Checkpoint 1.1 Definitions and Questions
1. Imagine a situation in which there is a device that can help improve productivity in any enterprise by as much as one thousand times. Assume that this device could be operated by anyone. Would this device eliminate scarcity?
Checkpoint 1.2 The Economic Way of Thinking
2. Assume your neighbor is a doctor. He complains bitterly about the overtime that he is putting in at the hospital each weekend. While the overtime is not required, he argues that by not taking it he would be sacrificing $4,000 each weekend. If he were to ask for your opinion about what to do, what would you advise him?
Checkpoint 1.3 Economics as a Life Skill and Job Skill
3. Survey your classmates (or, a selected group of your classmates) regarding the amount of time they spend on their educational activities and the opportunity cost of these activities. If you get different answers (which you will!), explain how these differences affect choices.
Answers
Checkpoint 1.1 Definitions and Questions
1. Scarcity is not eliminated by this device. Scarcity is the inability of the available resources to satisfy all of everyone’s wants. The ability of each of us to satisfy our wants is limited by time and by the incomes we earn and the prices we pay for the things we buy. The device would expand the amount of goods and services available but it would not constrain our wants.
Checkpoint 1.2 The Economic Way of Thinking
2. You can advise your neighbor that the $4,000 each weekend that he would give up by not working is not his only opportunity cost. When he works he also incurs opportunity costs. For instance, by working he is giving up time he could be spending with his family.
Checkpoint 1.3 Economics as a Life Skill and Job Skill
3. You will get a variety of answers about the time they spend on educational activities and the opportunity cost of spending time at these endeavors. This fact shows that everyone faces different opportunity costs and, people make different choices. Students for whom the opportunity cost is too high simply were not present to participate in your survey! And, even though people have different opportunity costs, their choices remain rational.
APPENDIX OUTLINE
1. Making and Using Graphs
A. Basic Idea
B. Interpreting Data Graphs
1. Scatter Diagram
2. Time-Series Graph
3. Cross-Section Graph
Appendix: Making and Using Graphs Chapter
C. Interpreting Graphs Used in Economic Models
1. Positive (or Direct) Relationship
2. Negative (or Inverse) Relationship
D. The Slope of a Relationship
E. Relationships Among More Than Two Variables
1. Ceteris Paribus
What’s New in this Edition?
The appendix is an updated version of the appendix in the sixth edition.
Where We Are
The appendix to Chapter 1 is a thorough review of the mathematics and geometry used in the text. There are no economic concepts introduced in it, only mathematical concepts.
Where We’ve Been
Chapter 1 introduced economics and presented information about important topics in the course.
Where We’re Going
Chapter 2 continues presenting background economic material. Chapter 2 uses none of the mathematical concepts cov-
© 2021 Pearson Education, Inc.
ered in this appendix. However, starting in Chapter 3, which presents the production possibilities frontier, most of the remaining chapters use various parts of the review in this appendix.
IN THE CLASSROOM
Class Time Needed
Depending on your class’s mathematical sophistication, you might decide to make this appendix optional. If you cover it in class, you should spend no more than one class session on it. The topics most likely to need review are the different types of relationships (positive and negative), covered in the third section, and slope, covered in the fourth section. Ideally, you will present these sections together and spend no more than 30 minutes on them.
Classroom Activity: An unfortunate number of students are “afraid” of mathematics. Do your best to convince them that math is a tool for them to use and, as such, it is their friend. Start by telling the students that many of them might have a fear of math, a math phobia. Then tell them that you do not understand why they would have this fear because math is just a tool and no one should have a phobia about a tool. Point out that a pen is a tool and that no one you know has a pen phobia. Take a pen and ask your students what it would be like to have a pen phobia. Start your hand shaking as you hold a pen and point out all the ways that pens can scare people: Some of them must be clicked to work, while others must have a cap removed. And then, the decision must be made as to which end of the pen to use! All in all, a pen is a lot more complicated than a pencil (?!) and so it is reasonable to think that some students will be deathly afraid of pens, just like some of them fear math! Then conclude by explaining to your students that math is just like a pen: It’s a tool to use and there is no more reason to fear it than to fear a pen!
Classroom Activity: Almost all students know how to read graphs. Give them a graph from the newspaper, and they can tell you, yes, voter registrations are rising over time. But put the same chart on the board in an economics class, and whatever they knew flies out of their heads. What if you began by reminding them of the xy space and ordered pairs they worked with in junior high, then started in with price and quantity relationships, etc.? The idea is to link the skill Miss Chalkdust taught them so long ago to what we’re using now. My experience is that students learned math in a vacuum. They did it because they had to, without understanding that math is a tool for understanding far more important or interesting things. We want to point out to students that what they learned long ago has an additional payoff because it will help them learn an entirely different subject, economics.
CHAPTER LECTURE
A1.1 Making and Using Graphs
Basic Idea
• A graph presents a quantity as a distance. The vertical axis is the y-axis and horizontal axis is the x-axis. The vertical line is the y-axis and the horizontal line is the x-axis. Where they meet is the origin.
Land Mine: Some students have persistent problems reading graphs, despite their exposure to graphs in middle and high school. They seem to fail to connect this basic tool of economics with what they’ve already learned. It helps to ask them to create their own graphs in xy space using graph paper. You also might use overheads that have light lines on them, and walk through counting across and down, especially in the early weeks of the course. It also seems to help if, at least at first, to label points on the graph as Miss Chalkdust did, that is, “A (5, $10); B (10, $3).”
Interpreting Data Graphs
• A scatter diagram graphs the value of one variable against the value of another variable.
• A time-series graph measures time on the x-axis and the variable or variables of interest on the y-axis.
• A time-series graph shows whether a variable has a trend, the general tendency for the value of the variable to rise or fall.
• A cross-section graph shows the values of an economic variable for different groups in a population at a point in time.
Interpreting Graphs Used in Economic Models
• When two variables move in the same direction, they have a positive, or direct relationship, as illustrated in the figure.
• A linear relationship is a special case of a positive relationship in which the function is graphed as a straight line.
• When two variables move in opposite directions, they have a negative, or inverse relationship, as illustrated in the figure.
• Some variables have a relationship in which there is a maximum or a minimum point.
• When two variables are unrelated, their graph is either a vertical or a horizontal line.
The Slope of a Relationship
The slope of a relationship equals the change in the value of the variable measured on the y-axis divided by the change in the value of the variable measured on the x-axis or, in terms of a formula, the slope equals Δy ÷ Δx
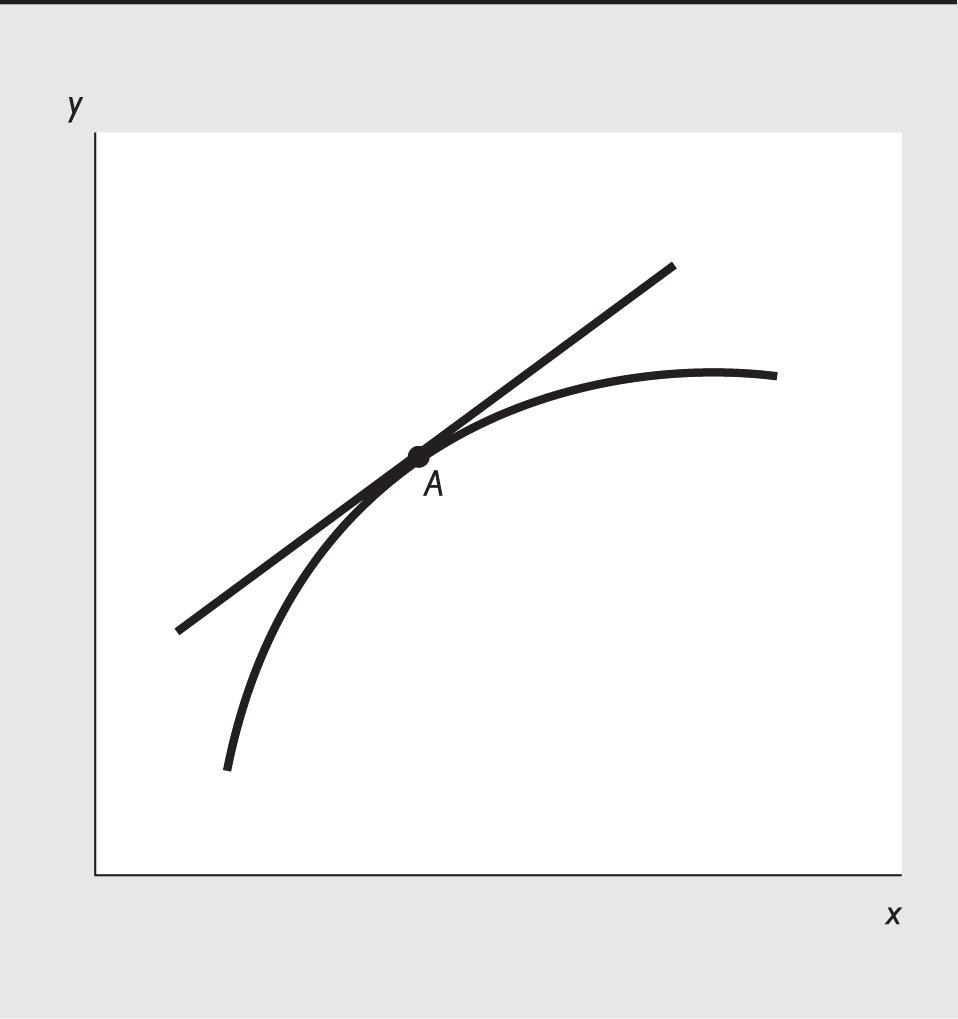
• The slope of a straight line is the same at any point on the line.
• The slope of a curved line at a point equals the slope of a straight line drawn so that it touches the curved line at only that point. In the figure, the slope of the curve at point A equals the slope of the straight line that is touching the curve at only point A
Land Mine: Slope is a concept that sometimes confuses students. In particular, students can think that slope equals the value of the variable on the yaxis divided by the value of the variable on the x-axis, that is, y ÷ x, rather
© 2021 Pearson Education, Inc.
than the change in the value of the variable on the y-axis divided by the change in the value of the variable on the x-axis, that is, Δy ÷ Δx. Be sure to clearly explain to your students that slope involves changes. One way to stress that slopes are computed using changes is to present the slope as equal to “rise over run.” By expressing the slope as rise over the run, the students are reminded that they must calculate the “rise,” that is, the change in the value of the variable measured on the y-axis, as well as the “run,” the change in the value of the variable measured on the x-axis.
Relationships Among More Than Two Variables
To graph a relationship among more than two variables, we must use the ceteris paribus assumption.
• Ceteris paribus is the Latin phrase meaning “other things being equal.”
• To graph a relationship among more than two variables, select the two of interest and then draw the relationship between the two, assuming that none of the other variables change (that is, use the ceteris paribus assumption). When one of the other variables changes, the entire graphed relationship shifts.
This might be a good opportunity to explain that unrelated variables and exogenous forces are not depicted in these xy graphs. Such a seed planted now may help when students wrestle with the difference between changes in demand (supply) and changes in quantity demanded (supplied) in Chapter 4.
© 2021 Pearson Education, Inc.
ADDITIONAL EXERCISES FOR ASSIGNMENT
Questions
1. What is the difference between a time-series graph and a scatter diagram? Suppose you have data on the unemployment rate and the inflation rate between 1970 and 2019. To determine if there is a relationship between the two variables, which is the better diagram to use, a time-series graph or a scatter diagram?
2. How is the slope of a straight line calculated? The slope of a curved line?
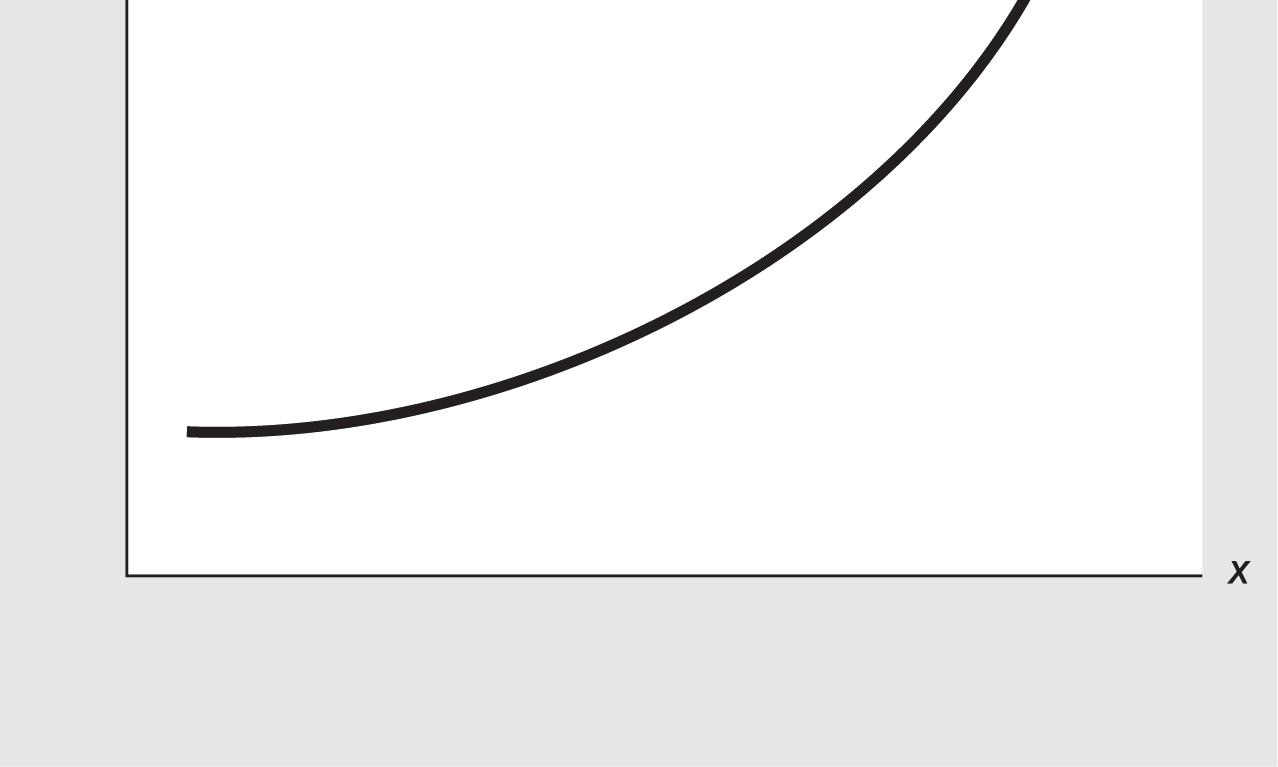
3a. Draw a curve with a positive and decreasing slope.
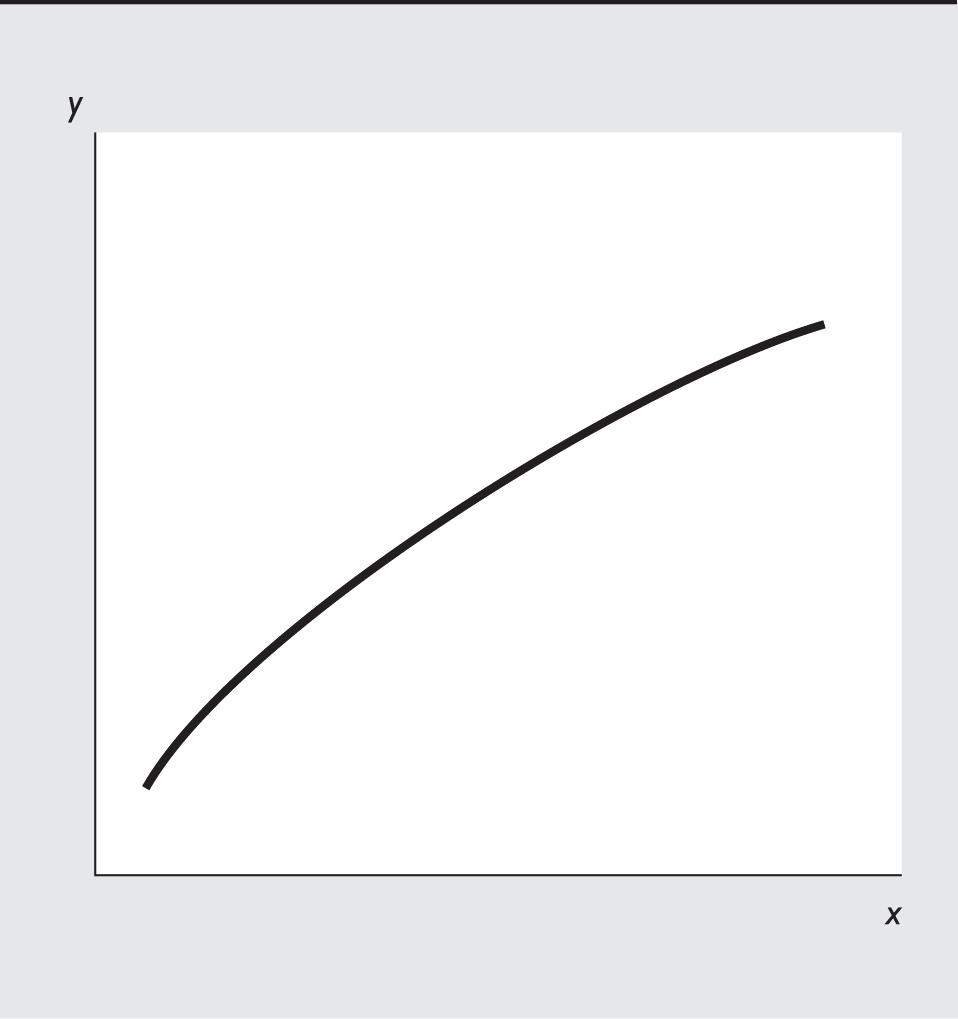
3b. Draw a curve with a positive and increasing slope.
Answers
1. A time-series graph plots time on the horizontal axis and the values of the variable or variables under examination on the vertical axis. A scatter diagram plots the value of one variable on the horizontal axis and the value of the other variable on the vertical axis. To determine if there is a relationship between any two variables, it is better to use a scatter diagram because a scatter diagram reveals a relationship, or lack of relationship, between two variables.
2. Slope is the change in the value of the variable measured on the vertical axis divided by the change in the value of the variable measured on the horizontal axis. The slope of a straight line is constant; that is, between any two points on the straight line, the slope is the same. To calculate the slope of a straight line, select two points on it. Then, measure the amount by which the variable on the vertical axis changes and the amount by which the variable on the horizontal axis changes. Divide the change in the value of the variable on the vertical axis by the change in the value of the variable on the horizontal axis, and the resulting quotient is the slope.
The slope along a curved line is not constant. To compute the slope of a curved line, you must select the point at which the slope will be calculated. Then draw a straight line that touches the curved line at only that point. Calculate the slope of the straight line. The slope of the curved line at that point equals the slope of the straight line.
3a. A curve with a positive and decreasing slope is illustrated in the figure to the right.


3b. A curve with a positive and increasing slope is illustrated in the figure to the right.
2021 Pearson Education, Inc.
©