Web Chapter 1
Financial Decision Making
Questions
1. Explain the following terms:
i. Compound returns
ii. Principal
iii. Rate of return on an investment
iv. Holding period
Answer:
i. Compound returns are generated when short-term returns are repeatedly reinvested, thereby causing an investment to earn returns on both the initial investment and on past investment returns
ii. An investor’s principal is the value of her initial investment.
iii. The rate of return on investment is calculated by (i) dividing the final value of an investment by the initial investment (one year earlier), and (ii) subtracting one from the ratio.
iv. The time delay between the initial investment and the final withdrawal is referred to as the holding period.
A-head: INVESTMENT RETURNS
Concept: Compound returns, principal, interest, holding period
2. Suppose you choose an investment that has historically generated an average nominal return of 5 percent per year. Explain how inflation and risk may affect your future real rate of return on this investment.
Answer:
Inflation reduces the buying power of money. Any appreciation in the value of the final balance will need to be adjusted to account for rising prices. In other words, if the prices of goods and services increase during the holding period, the real rate of return on the initial investment is lower than the nominal rate of return. The real rate of return is the nominal rate of return minus the inflation rate.
Risk implies that the return on the investment is not guaranteed. So the rate of return that you experience may be greater or lower than the historical average rate of return.
A-head: INVESTMENT RETURNS
Concept: Inflation, risk
3. Explain the following terms:
i. Securities
ii. Bonds
iii. Stocks
iv. Stock market index
Answer:
i. Bonds, stocks, and other financial claims that can be traded among investors are called securities.
ii. Bonds are long-term loans made to a borrower (debtor) by a lender (creditor).
iii. Stocks, also known as shares or equity, are ownership rights in a corporation.
iv. A stock market index is an average of the prices of many stocks.
A-head: INVESTMENT RETURNS
Concept: Securities, stock market index
4. Given that shares are riskier than bonds, why do investors invest in equity?
Answer: Equity investors are rewarded for taking on higher risk with an average rate of return that is greater than the average rate of return on bonds. Although equity returns fluctuate from year to year, investors who are willing to bear the additional risk of investing in shares also benefit from a higher average return.
A-head: INVESTMENT RETURNS
Concept: Risk
5. What is a patent race?
Answer: A patent race refers to a winner-take-all race. Suppose two investors are racing to develop an invention or to patent a discovery. The investor who develops the invention first or files the patent first will reap all the benefits. Although the other investors may have invested the same amount of money in research and development as the investor who filed the patent, they will not get any return on their investment.
A-head: DIVERSIFICATION
Concept: Patent race
6. What is meant by diversifying an investment portfolio? What are the advantages of diversification?
Answer: Diversification means that investors spread their investment across more than one asset. Diversification allows investors to reduce risk as individual assets are hit by different economic shocks. Putting a little bit of money in all of these different investment baskets reduces exposure to any single shock.
A-head: DIVERSIFICATION
Concept: Diversification
7. Which types of investment accounts are investors likely to choose if they are trying to minimize risk? Why?
Answer: Bank accounts insured by the Federal Deposit Insurance Corporation are the safest way of storing and investing money. Investors trying to minimize risk will invest in FDICinsured certificates of deposit or money market deposit accounts
A-head: INVESTMENT ACCOUNTS
Concept: Bank accounts
8. What is the difference between directly holding stock in a company like Apple and investing in a mutual fund that holds Apple stock?
Answer:
• Some investors purchase Apple shares directly and hold them in a brokerage account
• Most investors buy pre-mixed pools of assets, called mutual funds. A mutual fund is a pool of money that is collected from many investors. Mutual funds typically invest in hundreds of stocks, bonds, and/or short-term money market instruments.
A-head: INVESTMENT ACCOUNTS
Concept: Brokerage accounts
9 The following questions are about mutual funds:
i. What are index funds?
ii. What is an expense ratio? How do expense ratios affect the value of an investor’s portfolio?
Answer:
i. An index fund is a mutual fund that is passively managed, which means that the mutual fund manager simply tries to track the return of an index, like the Standard & Poor’s 500 stock index.
A-head: INVESTMENT ACCOUNTS
Concept: Mutual funds
ii. Expense ratios are annual fees charged by mutual funds in order to pay mutual fund managers and to pay other record-keeping and marketing costs of the fund. Expense ratios make a very big difference in the long-run performance of investments. Paying an annual fee of even 1 percent will reduce the annual rate of return on the investment from say, 10 percent to 10 – 1 = 9 percent.
A-head: INVESTMENT ACCOUNTS; CHOICE AND CONSEQUENCE: OVERLOOKING FEES
Concept: Expense ratios
10. What are the four core ways that households save for retirement?
Answer: There are four core types of retirement savings plans:
• Social Security: Social Security is a mandatory retirement savings program. Each worker pays a Social Security payroll tax into a general government account called the Social Security trust fund. Using these funds, the Social Security trust fund pays out benefits to those workers who are currently retired.
• Defined benefit pension plans: Defined benefit pensions are contractually specified employment benefits, in which the employer promises to pay the employee a fixed annuity after retirement. The magnitude of the annuity is adjusted to reflect years of service at the employer and the level of the employee’s salary.
• Defined contribution pension plans: Defined contribution pensions are individual accounts that are owned and controlled by the employee. In most cases, the employee
decides how much to contribute to these accounts, and most employers match these contributions. These accounts are commonly referred to as 401(k) accounts.
• Individual Retirement Accounts (IRA): IRAs are retirement savings accounts that anyone can set up; they are usually not sponsored by a person’s employer. If an individual does not contribute to her employer’s defined contribution savings plan, then she can use an IRA to save for retirement.
A-head: INVESTMENT ACCOUNTS
Concept: Retirement savings plans
11. How easy is it for fund managers and investment management companies to outperform or “beat” the stock market once their fees are taken into account?
Answer: When a single stock is picked at random, there is a 50 percent chance that the stock will outperform the total stock market in the next year. Consequently, it is possible to outperform the stock market in a single year even if the investment manager has no skill. It has been discovered that successful historical asset managers tend to perform no better in the next period than pure chance would predict.
A-head: INVESTMENT ACCOUNTS
Concept: Outperforming the stock market
12. How could return-chasing explain why many of Enron’s employees lost most of their retirement savings when Enron went bankrupt?
Answer: Return-chasing occurs when people invest in assets that have realized a high rate of return in the past. Return-chasing explains why many of Enron’s employees chose to forgo the benefits of diversification and invested the overwhelming majority of their retirement savings in Enron stock. Enron stock had gone up by a factor of 10 in the decade before Enron went bankrupt that’s a 1,000 percent return. This led Enron employees to mistakenly believe that Enron stock was a great investment for the future. Consequently, employees allocated more and more of their contributions to employer stock, under the assumption that Enron stock prices would continue to increase in the future.
A-head: EVIDENCE-BASED
ECONOMICS: DO INVESTORS CHASE HISTORICAL RETURNS?
Concept: Return chasing
Problems
1. Congratulations! You have just won a $1,000,000 (delayed) prize in the lottery. Your state offers you the following alternatives: you can take $750,000 now, or 10 years from now you can receive the full $1,000,000. The delay isn’t a problem, because you weren’t planning to use any of the prize money for at least 10 years.
If you take the lump sum now, you figure you can invest it at an annually compounded rate of 3 percent.
Should you take the $750,000 now, or wait to get the full $1,000,000 in 10 years? Why or why not? Show any calculations.
Answer: You should take the $750,000 now.
Here are the relevant calculations:
$750,000 × (1 + 0.03)10 = $1,007,937.
So you would be $7,937 better off by taking the smaller amount now than receiving the full prize in 10 years. This assumes that you will, in fact, achieve an annually compounded return of 3 percent for the next 10 years.
A-head: INVESTMENT RETURNS
Concept: Comparing future values
Difficulty: Easy/Moderate
Problem-type: Calculation
2. Ten years ago, you set aside $1,000. For the first 6 years, you earned a return of 6 percent per year, but for the following 4 years, that rate of return dropped to 3 percent. How much money do you now have at the end of the 10 years?
Answer: At the end of the first 6 years, you would have $1,000 × (1 + 0.06)6 .
After investing that money for an additional 4 years, you will have a total of [$1,000 × (1.06)6] × (1.03)4 = [$1,000 × 1.4185] × 1.1255 = $1,596.56.
A-head: INVESTMENT RETURNS
Concept: Finding the future value at differing interest rates
Difficulty: Easy/Moderate
Problem-type: Calculation
3. You get your first job when you are 23. Prudently, you set aside $5,000 of your earnings to open an IRA.
a. You know that stocks have returned a nominal 10 percent per year on average historically. If you keep your money invested in a portfolio of stocks that returns 10 percent per year until you retire 40 years later at age 63, how many dollars will that $5,000 have turned into?
b. Assuming an inflation rate of 3 percent, how much will that $5,000 have turned into in real terms? In other words, redo the previous calculation, taking inflation into account.
c. Given this investment plan, should you depend on having that much money available in the IRA account when you retire? Why or why not?
Answer:
a. ( )40 $5,0001 0.10$226,296.28 FinalValue =+= b. 10%3%7% ri =−=−= ( )40 $5,0001 0.07$74,872.29+=
This means that your purchasing power grew by a factor of 15 (15 × $5,000 = $75,000), and you didn’t have to do anything but postpone consumption. Of course, even if interest rates were 0 percent, and there were no interest at all, it’s still worth putting money away because the only way to have money in retirement is to save
c. As discussed in the section entitled Risky Returns, investing in stocks is inherently risky. Whether you end up with a great deal of money or very little depends on whether your particular holding period happens to be period with high or low returns.
A-head: INVESTMENT RETURNS; RISKY RETURNS
Concept: Compound returns; Risky returns
Difficulty: Easy
Problem-type: Hypothetical real-world scenario
4 Ernest calculates that he will need $220,000 to provide for his 8-year-old daughter’s college tuition and expenses. Due to a recent inheritance, he will have some money to put aside now but will not be able to add to it over time. He is confident that he can realize a return of 5 percent, compounded annually, on the money he puts aside. Assume his daughter will start college at the age of 18.
Calculate how much money Ernest needs to invest now in order to fund his daughter’s college education.
Answer: We can start with the formula given in the chapter: (Initial Investment) × (1 + r)T = $220,000. where r = 0.05 is the rate of return, and T = 18 – 8 =10 is the number of years the money is invested (in other words, T is the holding period).
So, all we really need to do is to solve the above equation for the Initial Investment:
Initial Investment = $220,000 (1 + r)T = $220,000 (1+ 0.05)10 = $135,060 92
So Ernest needs to invest $135,060.92 of his inheritance at 5 percent in order to realize a final value of $220,000 after a 10-year holding period.
A-head: INVESTMENT RETURNS
Concept: Finding the present value given the future value
Difficulty: Hard
Problem-type: Hypothetical real-world scenario; calculation
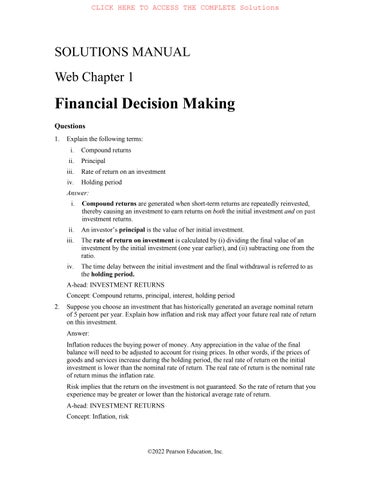
5. The following table shows the nominal return on the 10-year Treasury bond as well as the 3month Treasury bill from 2000 to 2019
Source: NYU Stern Historical Return data compiled by Aswath Damodaran 10-Year Treasury total return includes coupon payments and price appreciation
a. Use the data points to plot a graph for both the data series.
b. Which security has given a higher rate of return over this period? Why do you think this is the case?
Answer:
a. The following graph plots the returns on Treasury bonds and bills listed in the table.
b. The return on the 10-year Treasury bond is usually higher than the return on the 3-month Treasury bill. This is because long-term loans are riskier than short-term loans. Bond investors are rewarded for bearing this risk with a rate of return that usually exceeds the rate of return on money market accounts, or short-term loans.
A-head: RISKY RETURNS
Concept: Treasury bills, bonds
Difficulty: Moderate/Hard
Problem-type: Data-based problem
6. The following table shows data on the nominal return in the Standard & Poor’s 500 stock market index (including dividends and price appreciation) and the return on the 3-month Treasury bill. The table reports returns from year-end 1999 to year-end 2016.
Source: NYU Stern Historical Return data, compiled by Aswath Damodaran Returns on S&P 500 are equal-weighted and include dividends
a. Use the data points to plot a graph for both the data series.
b. What does Standard & Poor’s 500 represent? Would it have been riskier to invest in the S&P 500 or the 3-month Treasury bill during this period? Why?
Answer:
a. The following graph shows the annual return in the S&P 500 and the 3-month Treasury bill.
3-Month T-Bill Rate (Annualized)
Return on S&P Index (Including Dividends)
b. The Standard and Poor’s 500 is a stock market index that summarizes the value of 500 of the largest U.S. companies, representing about 75 percent of the value of all companies traded on U.S. stock exchanges. The variability of the returns of the S&P 500 stock index is higher than the variability of the annual returns of holding 3-month Treasury bills. Stocks are, in general, riskier than corporate bonds as companies make payments to shareholders only after making payments to bondholders. This means that shareholders are the ones who primarily suffer when a company earns less income. Moreover, lending to the government is less risky than lending to a corporation. Putting these observations together, 3-month Treasury bill returns are less risky than short-term corporate bonds, which are less risky than corporate shares. Because shares are therefore riskier than 3month Treasury bills, shares offer higher returns in order to compensate for the higher level of risk. Although equity investors receive a higher return on average, the return on equity also fluctuates a lot, even going negative from time to time.
Link to graph: http://www.research.stlouisfed.org/fred2/graph/?g=t1w
A-head: RISKY RETURNS
Concept: Stock market index, Treasury bonds, risk
Difficulty: Moderate/Hard
Problem-type: Data-based problem
7. The following table shows the income distribution for U.S. households in 2019 terms of selected percentiles.
$28,084
$53,503
$86,488 80
$142,501
a. Using the data in this table, identify a lower bound and an upper bound for the median level of household income.
b. Suppose you are told that, in 2019, the fifth of households with the highest income had average income of $142,501. Use the data in this table and explain why that cannot be true.
Answer:
a. The lower bound for the median level of household income is $53,503 (the 40th percentile), and the upper bound is $86,488 (the 60th percentile).
b. This statement is unlikely to be true because the 80th percentile, a cutoff that divides the data so the fifth of households with the highest income is above the cutoff, is $142,501. This means that in order for the average income of this group of households to be $142,501, every single household must earn exactly $142,501 (as no households can earn lower than this amount), which is extremely unlikely.
Data credit: United States Census Bureau
A-head: RISKY RETURNS
Concept: Percentiles
Difficulty: Moderate/Hard
Problem-type: Calculation problem
8. Alexander Graham Bell was credited with inventing the telephone in 1876. What many do not know is that Bell filed for the telephone patent hours before Elisha Gray, who also had a prototype for the telephone.
a. Since Bell filed the patent first, his company went on to earn millions of dollars in profits from the sales of the telephone. Because Elisha Gray’s patent came second, he did not earn profits from his invention. What is this situation called?
b. Suppose you are an investor who was willing to invest in either Bell’s or Gray’s telephone companies. You expect that the value of the company that files the patent first will double in value. Assume that each inventor had an equal chance of filing the telephone patent. If you did not know who would file the patent first, what investment strategy would minimize your risk?
Answer:
a. This is an example of a patent race, where the winner takes all. Only the inventor who files the patent first reaps all the profits from the invention. Other companies or inventors do not gain, although they may have spent the same or more time and money on a similar invention.
b. Given that either company has an equal chance of filing the patent and doubling its value, you should invest an equal amount of money in both companies. By diversifying your investment across both companies, you reduce the risk that you face if you invest in only one company and happen to pick the company that loses.
A-head: DIVERSIFICATION
Concept: Patent race; diversification
Difficulty: Easy/Moderate
Problem-type: Real world scenario
9 You have $100 to invest, and you are considering two stocks. In the next year, each stock will either have a return of +30 percent or –10 percent. Assume as well that the performance of one stock is unrelated to the performance of the other (in other words, the stock returns are uncorrelated). The table shows the resulting four possibilities, depending on whether each of the two stocks gains or loses value. (To read the table, note that the first outcome listed in each cell is for Stock 1, and the second outcome in each cell is for Stock 2.)
Assume that the probability of Stock 1 gaining is 50 percent. Assume that the probability of Stock 2 gaining is 50 percent. Assume that each of the four possibilities listed in the table above is 25 percent.
a. If you put all of your money into Stock 1 or Stock 2, what is the average return that you will receive? (Hint: average the returns of +30 percent and –10 percent.)
b. If you split your money equally between the two stocks ($50 in Stock 1 and $50 in Stock 2), what would be your total return at the end of the year in each of the boxes above? Fill out the following table to indicate the total return you would have in each of the four possible situations. (Hint: average the returns of the two investments in each box.)
c. If you split your money between the two stocks, what is the average return that you will receive? (Hint: take the total return for each box in part (b) and calculate the average across the four boxes giving each box equal weight.)
d. Is there any benefit in splitting your money between the two stocks? How does this relate to the concept of diversification?
Answer:
a. There is a one-half chance that you will gain 30 percent, and a one-half chance that you will lose 10 percent, so the average return is
) 0.530%0.510%10%. +−=
b. Because half of your portfolio is in each stock, we multiply the returns for that stock by their portfolio weight (0.5) in each situation.
c. There is a 25 percent chance you will end up in each of the four possibilities, so the expected value is
d. We saw in parts a and c that the expected value of your investment is the same whether you invest in a single stock or split your money between the two stocks. However, there is less volatility in your payout if you diversify by investing half your money in both stocks rather than investing all of your money in a single stock. In other words, if you invest all of your money in a single stock, you will either win big or lose big. However, if you split your money between the two stocks, there is a third possibility that one stock will gain and the other one will lose, and the two effects will cancel each other out. This leads to a less volatile return. When you are planning for retirement, it is very important, when budgeting, to know approximately how much money you will have. Finding out that all of your stocks have lost value at the same time can be quite a blow. Therefore, people are advised to diversify so that they do not have “all of their eggs in one basket.”
A-head: RISKY RETURNS; DIVERSIFICATION
Concept: Risky returns; Diversification
Difficulty: Moderate/Hard
Problem-type: Calculation
10. Suppose that a mutual fund, Washington Peak Strategic Bond Fund, believes it has hit upon a winning investment strategy. The fund uses an active management strategy to try to outperform the bond market. According to Washington Peak’s prospectus, investors need to pay fees of 2 percent annually. Based on the historical success of their active investment strategy, the strategy is projected to generate annual returns (once fees are paid) of 8 percent. A friend of yours is considering investing in Washington Peak and asks you for investment advice. What would you suggest?
Answer: One of the problems with Washington Peak’s investment strategy is the lack of diversification. By investing most of the fund’s money in one investment strategy, Peak will
not be able to diversify its returns. It should therefore not be a large fraction of your friend’s total investment portfolio. Second, Peak’s traders base their strategy on historical data. It is not necessarily the case that historical trends will continue to play out in the future. This fact introduces some additional risk. The third factor that your friend will need to consider is the expense ratio that Washington Peak is charging. An expense ratio of 2 percent is generally considered to be very high for a mutual fund. High expense ratios lower the net annual return that your friend receives on his investment.
A-head:
RISKY RETURNS; DIVERSIFICATION; INVESTMENT ACCOUNTS
Concept: Diversification, expense ratios
Difficulty: Easy/Moderate
Problem-type: Fictional ‘real-world’ scenario
11 Tom, a government employee, has a defined benefit pension. He has worked for his employer for 35 years before retiring at age 65. His final salary was $85,000. Calculate how much of his final preretirement income a standard defined benefit pension plan would replace.
Answer: Using the formula given in the chapter, Tom’s pension would equal: 0.02 × 35 × $85,000 = $59,500. This would replace $59,500/$85,000 = 0.70 or 70 percent of his preretirement income.
A-head:
INVESTMENT ACCOUNTS
Concept: Retirement savings plans
Difficulty: Easy
Problem-type: Hypothetical real-world scenario
12. Recency bias refers to a psychological bias whereby people believe that recent past trends and patterns will continue in the future. How would recency bias explain why investors chase returns? Does return-chasing lead investors to realize a higher rate of return on investments? Does chasing returns cause investors to insufficiently diversify their investment portfolios?
Answer: Return-chasing involves investing in assets that have realized a high rate of return in the past. Recency bias could explain return-chasing. Recency bias leads people to mistakenly believe that recent past trends and patterns will continue into the future, leading people to chase recent historical returns. As discussed in the Evidence-Based Economics feature in the chapter, research has shown that return-chasing does not usually benefit investors. At 154 of the largest U.S. corporations, employees did not benefit from return chasing. Chasing returns may cause investors to insufficiently diversify their investment portfolios because investors may over-invest in assets that have recently realized high returns. For example, the returnchasing workers in the Evidence-Based Economics feature invested a large amount in their employer’s stock, which is not a diversified investment and is riskier than the overall stock market.
A-head: EVIDENCE-BASED ECONOMICS: DO INVESTORS CHASE HISTORICAL RETURNS?
Concept: Return chasing
Difficulty: Easy/Moderate
Problem-type: Fictional ‘real-world’ scenario
Chapter 1
The Principles and Practice of Economics
Questions
1. Why do we have to pay a price for most of the goods we consume?
Answer: The inputs we use to produce most goods and services (for example, capital and labor) are scarce. Therefore almost all goods and services are scarce compared to the quantity that consumers want to consume. In other words, at a price of zero the demand for most goods is higher than the available supply; our wants are unlimited but our resources are not. Prices act as a rationing mechanism to prevent the over-consumption of such scarce goods, making them available in the quantity such that the supply of these goods matches the demand.
2. Many people believe that the study of economics is focused on money and financial markets. Based on your reading of the chapter, how would you define economics?
Answer: Economics is the study of how agents (for example, households and firms) choose to allocate scarce resources and how these choices affect society. Although it is true that economics studies money and the financial markets, the study of economics is really focused on human behavior and choices. Given that we have limited resources, we need to choose between various options. Economic analysis is used to understand people’s choices in order to describe what people do and recommend what people ought to do.
3. Examine the following statements and determine if they are normative or positive in nature. Explain your answer.
a. Car sales in Europe rose 9.3 percent from 2014 to 2015.
b. The U.S. government should increase carbon taxes to control emissions that cause global warming.
Answer:
a. This is an objective statement about the rate of growth in the European automotive industry. Positive economics is analysis that generates objective descriptions or predictions about the world that can be verified with data. Since data can be used here to verify the rate of growth, this is a positive statement.
b. The statement that the government should increase carbon taxes to control emissions is normative since it states what the government ought to do. Normative economics advises individuals and society on their decisions and is almost always dependent on subjective judgments.
4. How does microeconomics differ from macroeconomics? Would the supply of iPhones in the United States be studied under microeconomics or macroeconomics? What about the growth rate of total economic output in the national economy?
Answer: Microeconomics is the study of how individuals, households, firms, and governments make choices, and how those choices affect prices, the allocation of resources, and the well-being of other agents. Macroeconomics is the study of the economy as a whole. Macroeconomists study factors that affect overall – in other words, aggregate – economic performance.
The supply of iPhones refers to the supply of a good by an individual firm, Apple. The iPhone market will be studied under microeconomics. Microeconomics studies how individuals, households, firms and governments make choices, and how those choices affect prices and the allocation of resources. The growth rate of total economic output, on the other hand, refers to the aggregate American economy, and is therefore studied under macroeconomics.
5. What does a budget constraint represent? How do budget constraints explain the trade-offs that consumers face?
Answer: A budget constraint is an equation representing the goods or activities that a consumer can choose given her limited budget. Tradeoffs arise when some benefits must be given up in order to gain others. In other words, a trade-off occurs when you give one thing up to get something else. Since a budget constraint shows the set of things that you can choose to do or buy with a fixed amount of money, it also shows that if you choose to buy more of one good, you will have to buy less of another. Therefore, a budget constraint equation implies that a consumer faces a tradeoff.
6. This chapter introduces the idea of opportunity cost.
a. What is meant by opportunity cost?
b. What is the opportunity cost of taking a year after graduating from high school and backpacking across Europe? Are people who do so being irrational?
Answer:
a. Opportunity cost is the best alternative use of a resource. The opportunity cost of a particular choice is measured in terms of the benefit foregone from the next best alternative. To facilitate comparison, the benefits and costs of various choices are translated into monetary units like dollars.
b. The opportunity cost of backpacking across Europe, for a particular person, is the cost of anything else that could have been done in that year. The backpacker could have attended college or started working. These costs are the opportunity costs of the gap year. This, however, does not mean that backpackers are irrational, because the benefits may exceed the cost. Every action has an opportunity cost. The choices that people make are optimal based on their perceived costs and benefits.
7. The costs of many environmental regulations can be calculated in dollars for instance, the cost of “scrubbers” that reduce the amount of air pollution emitted by a coal factory. The benefits of environmental regulations often are most directly expressed in terms of lives saved (reduced mortality) or decreases in the incidence of a particular disease (reduced morbidity). What does this imply about the cost-benefit analysis of environmental regulations? There is an old saying “You can’t put a price on a human life.” Do you agree or disagree? Explain.
Answer: Cost-benefit analysis can be used when there is a common unit, such as dollars. This method is less straightforward if there are two different units of measurement, such as dollars and lives. However, if a direct link can be drawn between dollars spent and lives saved then costbenefit analysis becomes feasible. When an environmental regulator places a value of 3 million dollars on a human life (for example), they are claiming that if 3 million dollars is not spent in one area, then it can instead be spent in another area where 3 million dollars is expected to save one life, on average. While some people may find this practice controversial, it does provide the most practical way to maximize the number of lives saved, given limited financial resources.
8. Suppose the market price of corn is $5.50 per bushel. What are the three conditions that will need to be satisfied for the corn market to be in equilibrium at this price?
Answer: For the market to be in equilibrium, three conditions will need to be satisfied.
• At the price of $5.50 per bushel, the amount of corn produced by sellers should be equal to the amount of corn purchased by buyers in the market.
• Farmers have chosen the optimal quantity of corn to produce given the price of $5.50 per bushel.
• Consumers have chosen the optimal quantity of corn to buy given the price of $5.50 per bushel.
9. Economists are often concerned with the free-rider problem.
a. What is meant by free riding? Explain with an example.
b. Are public parks subject to the free-rider problem? What about keeping city streets clean? Explain your answer.
Answer:
a. A free rider is a person who receives the benefit of a good but avoids paying for it. People tend to pursue their own private interests and usually don’t contribute voluntarily to the public interest. For example, watching a pirated copy of a movie is cheaper than buying one. Those who watch the pirated version are free riders because there are others who buy the movie or pay for movie tickets. If everyone watched pirated copies, making movies would not be profitable and the industry would not function.
b. Cleaning of city streets may be subject to free riding. Suppose the streets are cleaned every day at a fixed cost. This cost is borne by those who pay taxes to the city government. However, they cannot prevent others who do not pay taxes from using the clean streets. This leads to the free rider problem. However, not all free riding is necessarily problematic. For a park that already exists, it is good when many people enjoy its benefits, especially when there are no real costs associated with usage. The park example demonstrates that free riding is not a problem per se. Rather, it may lead to the underproduction of public goods but once a particular public good exists people should use it as much as possible, so long as they do not get in other people’s way.
10. Explain the concept of causation with the help of a simple real-life example.
Answer: Causation is a relationship between two events or states, such that one brings about a change in the other. In short, it explains the cause and effect relationship between two variables or events. For example, people who go to college learn skills that are valuable to prospective employers. So a college degree causes someone’s wages to rise.
11. Identify the cause and the effect in the following examples:
a. A rise in the worldwide price of peaches and a drought in California.
b. A surge in cocoa prices and a pest attack on the cocoa crop that year.
Answer:
a. A drought in California causes a decrease in supply of peaches, and thus a rise in price.
b. The pest attack is likely to have reduced the cocoa crop, leading to a rise in prices.
Problems
1. You have already purchased (non-refundable and unsellable) tickets to a concert on Friday night. A friend also invites you to her birthday party on Friday. While you like your friend, you politely decline because you really want to go to the concert.
a. You learn that your friend is serving flank steak at her party, all-you-can eat and at no charge. Flank steak is your favorite food. Should this affect your decision to go to the concert? Explain by using the term “opportunity cost.”
b. Suppose instead that you notice that the non-refundable concert ticket (that you already purchased) cost you $10; previously you had mistakenly believed the price was $100. Should learning this information affect your decision to go to the concert?
Answer:
a. This should affect your decision, or at least make you reconsider. The explicit cost of the concert has not changed, nor the benefit of the concert itself. However, the opportunity cost of missing the party is now higher than you previously thought.
b. This should not affect your decision. Whether you paid ($10 or $100) in the past is irrelevant to the costs and benefits that you can affect by going (or not going) to the concert.
2. You are thinking about buying a house. You find one you like that costs $200,000. You learn that your bank will give you a mortgage for $160,000 and that you would have to use all of your savings to make the down payment of $40,000. You calculate that the mortgage payments, property taxes, insurance, maintenance, and utilities would total $950 per month. Is $950 the cost of owning the house? What important factor(s) have you left out of your calculation of the cost of ownership?
Answer: You have ignored the opportunity cost of the funds you are using for the down payment. By using your $40,000 to buy the house, you give up the opportunity to earn interest on that money. If you could earn 5% interest, then the opportunity cost is 0.05 x $40,000 = $2,000 per year, or $167 per month. This does not imply that you should not buy this house. It does imply, however, that you need to think carefully about opportunity cost as you weigh this decision. An economist would tell you that the monthly cost of owning this home is $950 + $167 = $1,017.
3. One of the largest costs of going to college is the opportunity cost of not having the income from a full-time job. Also, during an economic recession people often find it difficult to find a full-time job. Given these two facts, should the number of people who want to go to college increase or decrease during a recession?
Answer: The number of people who want to go to college should increase since the opportunity cost of going to college is now lower on average. (And in fact, colleges often see an increase in demand during economics recessions.)
4. You have decided that you are going to consume 600 calories of beer and snacks at a party Saturday night. A beer has 150 calories and a snack has 75 calories.
a. Create a table that shows the various combinations of beer and snacks you can consume. To keep things simple, use only round numbers (e.g., you could choose 1 or 2 beers but not 1.5 beers).
b. What is the opportunity cost of a beer?
Answer:
a. Suppose you choose to consume 0 beers. Then you could use all 600 calories on snacks. Since snacks have 75 calories you could consume 600 / 75 = 8 snacks. Now suppose you choose 1 beer. A beer has 150 calories and so you would be left with 600 – 150 = 450 calories for snacks. You could therefore consume 450 / 75 = 6 snacks if you choose 1 beer. You can use the same logic to complete the table below.
b. If you consume 1 more beer you will have 150 fewer calories for snacks. Since a snack has 75 calories, consuming one more beer means that you will have to give up 150 / 75 = 2 snacks. The opportunity cost of a beer is therefore 2 snacks.
5. Suppose you are ready to check out and see two lines: Line A has 3 people, while line B has 5 people.
a. Assume people just chose lines at random and have not yet had a chance to switch lines. Would you consider this situation to be in equilibrium? Why or why not?
b. Assume that all 8 shoppers are optimizing (i.e., they have had a chance to switch), and that the situation is in equilibrium. What conclusions would you draw?
c. Of all 8 shoppers, whose behavior is the most informative?
Answer:
a. This situation is not in equilibrium. Assuming both lines move at the same speed, it would make sense for the last person in the longer line to switch to the shorter line.
b. If the 8 shoppers know what they are doing, then it must be the case that the shorter line moves more slowly.
c. The behavior of the last person in each line is the most informative. The assumption that these shoppers are optimizing allows an outside observer to draw conclusions about the speed of the two lines.
6. Suppose your friend makes each of the following statements. She might simply have a dour disposition, or she might be an economist! Explain briefly how she has come to each conclusion, and try to use the concepts of optimization and equilibrium.
a. “There is no use moving to that shorter line.”
b. “Do not bother trying to switch lanes during a traffic jam.”
c. “Do not actively trade stocks since it is impossible to predict whether the price will go up or down tomorrow.”
Which of these statements is related to optimization and which is related to equilibrium? Explain.
Answer:
a. The checker must be slower, which is why other people at the end of the longer line have not optimized by already moving to this shorter line.
b. On average each lane moves the same speed in equilibrium. If one lane does in fact move faster, people will optimize by moving into this lane, which will slow it down.
c. This concept is sometime labeled “the efficient market hypothesis” and is due to the same factors related to lines at the store and traffic congestion: Any clear and obvious gains will be quickly realized by other optimizing agents, thus the current price represents the best guess as to what the future price might be. Thus there is no easy money to be made in the stock market, at least in equilibrium, and assuming you do not have access to any privileged information.
7. In 2014, California was in its third year of a major drought. With water supplies dwindling, Governor Brown issued a plea for a voluntary 20 percent reduction in water use. This target was not reached. In early 2015 Governor Brown issued an executive order requiring local water agencies to reduce water use by 25 percent, but no enforcement mechanism was specified. No taxes or fines were in the executive order. State officials hoped that they could achieve compliance without resorting to fines.
a. From an individual homeowner’s perspective, what are the costs and benefits of using water during a drought? Why do you think that the voluntary reduction order in 2014 didn’t work?
b. Using concepts from this chapter, explain how you might get individual homeowners to reduce water use during a drought.
c. Eventually, many communities began levying fines on water use. However, while many middle income families dramatically cut water use, wealthy households cut back their water use relatively little. How can you explain this phenomenon from an economic perspective?
Answers:
a. With no specific enforcement mechanism, there is low cost to using water. Water bills are not zero, but these prices were low enough in the past to create a water shortage, so clearly the financial cost is not high enough to prevent a shortage. There may be some social stigma attached to watering a lawn, though this cost varies for each person and depends on their sense of civic responsibility. On the flip side, the benefits of using water are quite clear: Green lawns, pleasant showers, and odorless toilets. The fact that the 2014 plea did not work is because the cost of violating a call for civic responsibility is not very high for most people.
b. Charging a higher price for water than in 2014 would likely result in a reduction in water usage. When the price goes up, people would discover that some of their usage is actually not that important.
c. Fines are equivalent to a higher price for water. In this case, lower income individuals were more price elastic; they responded more sharply to a price change. This implies that the willingness to pay for the last gallon of water in a low-income household is less than the willingness to pay in a high-income household.
8. An economist observes that many students spend $100,000 to go to college. This researcher could ask whether such spending is worth it, or she could assume that it is worth it. In other words, she could assume that students are optimizing and that the education system is in equilibrium. What can the economist conclude about the value of a college education?
Answer: An economist will conclude that college increases earnings (over a lifetime) by at least $100,000 the increase may be higher, but it cannot be lower. If this were not the case then students would choose to skip college. This analysis assumes there are no other benefits to college besides higher income; as well as no other costs besides monetary costs. In reality there are many other costs and benefits of college. However, the main point stands: The observation that people are willing to pay a certain amount for college provides information about the economic value of college.
9. It is the night before your economics final exam and you must decide how many hours to study. The total benefits column shows how many more points you expect to earn because of increased knowledge. The cost column shows how many points you will lose because of careless errors due to lack of sleep. (The “marginal” columns show the effect of each additional hour spent studying. These marginal numbers are calculated by taking the difference within a column from one row to the next row.)
a. If you study in an optimal way, how many more points will you earn on the test?
b. Explain how you can find the optimal number of hours by using the marginal benefits and marginal costs columns.
Answer:
a. Total benefit minus total cost is maximized at 16 – 3 = 13 when you study for two hours. This difference is lower in all other rows.
b. You can arrive at the answer of 2 hours by noticing that the first hour is well worth it since the marginal benefit of 10 is greater than the marginal cost of 0. The second hour is also worth it since 6 > 3. However, the third hour is not worth it since 4 < 5, thus you will gain fewer points than you will lose. (This sort of “marginal analysis” is a recurrent theme in economics.)
CHAPTER W1
Financial Decision Making
I. Key Ideas
The process that determines how an investment grows over time is referred to as compound returns.
If returns are risky, as they are for stock investments, it is important to consider the probability of good returns and bad returns.
Diversification spreading one’s investments across many assets reduces the risks associated with investments.
Investors save in many different types of investment accounts: bank accounts, brokerage accounts, mutual funds, and retirement savings plans.
II. Getting Started
A. The Big Picture
Students who will start working and receiving income after they graduate should be especially interested in this chapter. As they start collecting a salary and making choices related to consumption and saving, they should understand concepts related to the power of compounding, risk associated with investments, the different types of assets, diversification, and other topics related to saving for their retirement. The goal is to educate students who are not majoring in economics and/or finance on money matters, in order to help them make better financial decisions in the future.
Where We’ve Been
The previous chapters of this textbook covered standard topics in microeconomics and macroeconomics. This chapter introduces a “special topic”: how to better make financial decisions.
Where We’re Going
The last two chapters will introduce two additional special topics one on the economics of life, health, and the environment, and one on political economy.
B. Number of Lectures
Instructors are advised to spend one 50-minute lecture on this chapter. Here’s a suggested breakdown of the lecture:
Provide a general overview of the chapter the big picture [5 mins.]
Using numerical examples, explain how asset values grow through compounding [10 mins.]
Spend the next few minutes on securities and the difference between stocks (or equity) and bonds [5 mins.]
Explain how to use percentiles to identify the risk associated with investment [5 mins.]
Explain the benefits from diversification in investment. [5 mins.]
Describe the different investment accounts [15 mins.]
Finally, discuss the EBE and link it to the opening question [5 mins.]
C. Opening Question and Evidence-Based Economics
“Do investors chase historical returns?” Using the example of Enron is a good choice because it captures the potential perils of lack of diversification and the risk associated with return chasing.
III. Chapter Outline
W1.1 Investment Returns
Let’s remind our students that when people save, they postpone consumption. They do so to enjoy more consumption in the future, because the money they save today grows at a rate that depends on the interest rate they receive.
How Money Grows The process by which the value of an investment grows over time is referred to as compounding. Compound returns are generated when short-term returns are reinvested, producing returns on both the initial investment and on later investment returns. To see how, we first choose a principal amount, which is the value of the initial investment). Then, we identify the rate of return on the investment, r, and we use the following formula: Final value = principal amount (1 + r)T ,
where T is known as the holding period the time interval, usually measured in years, between the initial investment and the final withdrawal.
Alternative Teaching Example: Let’s find the final value of a principal amount of $500 growing at an annual rate of return of 8%. Let’s find the final value after each year.
Final value after 1st year = $500 × (1 + 0.08) = $540
Final value after 2nd year = $500 × (1 + 0.08)2 = $583.2
Final value after 3rd year = $500 × (1 + 0.08)3 = $629.86
Final value after 4th year = $500 × (1 + 0.08)4 = $680.24
Final value after 5th year = $500 × (1 + 0.08)5 = $734.66
Final value after 30th year = $500 × (1 + 0.08)30 = $5,031.33
Notice that in the calculations above, two complications are ignored. First, rising prices, or inflation, may erode the purchasing power of the final value. We held inflation constant in the example. To adjust for inflation, we could subtract the rate of inflation from the rate of return r to arrive at the real rate of return. For example, if the inflation rate is 3%, then the real rate of return is approximately 8% – 3% = 5%. In this case, the final value after the 30th year is $500 × (1 + 0.5)30 = $2,160.97 (as compared to $5,031.33 without adjusting for inflation). That is, the final value $5,031.33 has the same purchasing power that $2160.97 had at the time of the initial investment. The second factor that we ignored was risk, which exists when an outcome is not known with certainty in advance. In our example, we assumed that an investor receives a constant rate of return of 8% throughout the life of the investment that’s to say, without any risk that the return in some years might be lower (or higher). In real life, the return on most investments varies considerably in some years there are high real returns and in other years there are low real returns. There is more discussion of risk later on in this chapter.
Securities There are different types of financial investments. They are generally called securities, and they can take the form of bonds, stocks, or other financial claims. Some of these securities are short-term in nature and others are long-term. Short-term loans that individuals extend to the government (buying Treasury bills, for example) or to a highly secured corporation (like GE or GM) are practically risk-free and have low rates of return (knows as commercial papers). Bonds, on the other hand, are long-term loans made to a borrower (debtor) by a lender (creditor). Borrowers are obligated to pay bondholders a certain value at the end of a predetermined period, and to make periodic interest payments to bondholders. Finally, investing in stock is fundamentally different from investing in bonds. While the latter are loans that investors make to the government or to corporations, investing in a corporation’s stock (also known as investing in its equity) gives the investors ownership rights in the corporation.
Stocks are riskier than bonds. To see this, suppose a company sells bonds and shares of stock to investors. If the company’s business weakens and its earnings plummet, it is contractually obligated to first pay returns to its bondholders; then if there is remaining income the stockholders receive a return on their investment. In other words, if a company declares bankruptcy, first it must pay its bondholders in full, and then it pays its stockholders if there is additional income is available for distribution. But with risk come higher average returns. If a company’s business is doing well, its shareholders earn higher rates of return than its bondholders.
W1.2RiskyReturns
The simulations in this part of the chapter illustrate the concept of risks associated with investments. The simulations are done on stock market returns, showing how it is often the case that returns on stocks go through runs of good returns and runs of bad returns. Just as with tossing a coin many times (say, 50), there will be times when heads come up several times in a row, times
when tails come up several times in a row, and times when heads and tails alternate. Exhibit W1.2 illustrates the results of such a simulation.
Exhibit W1.4 shows the results of 1,000 simulations of a $1 initial stock investment held for 50 years. Each simulation represents different year-by-year stock returns, under assumptions based on actual historical data from the U.S. stock market. The worst result shows a final balance of $1.10 after 50 years, and the best result shows a final balance of $2,151. The average of the 1,000 final balances is $117. As Exhibit W1.4 shows, however, there is a very wide range of possibilities, in terms of returns over 50 years. Is there an easier way to look at these possible returns?
Percentiles One way to look at the different possibilities is to calculate the Nth percentile, which is a cutoff that divides the data so that the N% of the data is below the cutoff and (100– N)% of the data is above the cutoff.
Exhibit W1.5 illustrates percentiles of a final balance from a 50-year holding period of a $1 initial investment. For example, according to the simulation, what are the chances of turning a $1 investment into $169 after 50 years? Based on the exhibit, there is a 75% chance that a person will turn a $1 investment into less than $169, and 25% chance to turn the $1 into more than $169 after a 50-year holding period.
Alternative Teaching Example: Since this is a principles class, students should remember what they scored on their SATs. For example, a student who scored 700 in math is in the 93rd percentile, meaning that 93% of students who took the exam earned a lower score than her. Instructors can use more SAT percentile ranks here: http://media.collegeboard.com/digitalServices/pdf/research/SAT-Percentile-Ranks-2012.pdf
Risk Associated with Individual Stocks Why do financial consultants advise their clients not to “put all of their eggs in one basket”? Diversification is discussed in more detail next, but the short answer to the question is because it’s a lot more risky to invest in an individual stock than it is to invest in, say, a composite index like the S&P 500 index, which consists of packages of shares of the stocks of the 500 largest U.S. companies. If one company goes bankrupt, the equity owned by its stockholders will most likely be completely wiped out. How often do companies declare bankruptcy? The answer is: more often than the average person thinks they do. Big companies like Enron, Lehman Brothers, GM, Delta Airlines, and United Airlines have declared bankruptcy in recent years. Some of them were able to reorganize the company and survive (e.g., Delta Airlines, GM, and United Airlines), but others couldn’t (e.g., Enron and Lehman Brothers).
Exhibit W1.6(a) illustrates how volatile the stock market in general can be. Looking at the S&P 500 index over the last 80 years, we see that annual nominal returns in the U.S. stock market have been highly variable and largely unpredictable. If the index comprised of stocks of the largest 500 companies shows such volatility, can you imagine the volatility of a single stock?!
W1.3 Diversification
Alternative Teaching Example: Brokerage firms, like Merrill Lynch (ML), manage the assets of their clients. When an ML financial advisor selects an appropriate investment strategy for a client, he/she first determines the risk level that the client can tolerate. For example, a younger client may tolerate more risk than an older client who is about toretire. Based on age (and other considerations, of course), the financial advisor may suggest a more aggressive
investment strategy to the younger client and a more conservative one to the older client. An aggressive investment strategy typically includes investing in a mutual fund that has 80% stocks, 15% bonds, and a 5% cash account. A conservative mutual fund typically includes 55% bonds, 20% stocks, and a 25% cash account. Regardless of how aggressive or conservative an investment strategy is, a financial advisor will never suggest that a client invests in stocks only. Why? Because the financial advisor understands very well the benefit of diversifying, and the risk associated with investing only in stocks.
The textbook uses a wonderful example on how diversification reduces risk by spreading an investment across more than one asset. The idea here is that individual assets are hit by different economic shocks. For example, a significant decrease in the world oil price may have a positive impact on the automobile industry and a negative impact on the oil industry in the United States. Such a shock may therefore have different impacts on the values of stocks of companies in both industries. Moreover, the positive impact on the stocks of automobile companies may vary across the companies (GM’s stock may increase by 10%, whereas Ford’s stock may only increase by 2%). Likewise, the negative impact on companies in the oil industry may vary as well. In such cases, diversification reduces an investor’s exposure to shocks and reduces (but does not eliminate) the risk associated with investment.
Exhibit W1.8 is a great example of why we should diversify. It shows the results of simulating two investment strategies investing $1 in a single stock (right column), or investing $1 in a stock index consisting of thousands of stocks (left column). Clearly, it’s a lot more risky to invest in a single stock. For example, if you invest in a single stock, there is a 25% chance that you will end up with less than your $1 investment after holding the stock for 50 years. If you invest in a stock index, there is almost no chance that you will end up with less than your initial investment after 50 years. In fact, the simulation shows that there is a 99% chance of receiving at least $5.52 if you choose a diversified investment strategy.
W1.4 Investment Accounts
There are several different types of investment accounts in which households can hold their securities (stocks and bonds). The following is a list of these accounts and a brief description of each.
Bank Accounts These are very safe accounts; they include checking accounts, savings accounts, money market deposit accounts, and certificates of deposit (CDs). The advantage of these accounts is that they are fully insured by the FDIC that is, in case your bank fails, you can recover 100% of the money that you deposited, up to $250,000 (or $500,000 for a married couple). The disadvantage is that they pay a very low interest rate because they are almost riskfree.
Brokerage Accounts These accounts are offered by investment management firms, not banks. Examples of these firms include Fidelity and Vanguard. The disadvantage of brokerage accounts is that they are not insured by the FDIC (except for those that are affiliated with or owned by a bank, like Merrill Lynch). In principle, an investors can lose all of his or her investments in a brokerage account.
Mutual Funds A mutual fund starts with a pool of money that is collected from many investors, which is then invested in hundreds of stocks, bonds, and/or short-term money market instruments. Mutual funds are managed by investment professionals who charge fees for managing them. Some mutual funds are passively managed, meaning the fund manager tracks the returns of a specific index, like the S&P 500 stock index. Other mutual funds are actively managed, meaning the fund manager buys and sells assets frequently in an attempt to outperform the competition. Investors pay fees to the managers of mutual funds, with managers who actively manage investors’ portfolios charging more than those who passively manage. As Choice and Consequence: Overlooking Fees demonstrates, the lowest fees in the industry (also known as expense ratios) are 0.05%. Fees above 1% are considered to be too high. Although the difference between 1% and 2% fees may not seem large, the impact on the returns of a mutual fund is substantial, particularly if the holding period is relatively long.
Retirement Savings Plans
These plans can be organized in four categories.
Social Security: Each worker pays a payroll tax of 6.2% of his/her income (up to a cap of $117,000/year), and the employer matches that with another 6.2%. A total of 12.4% of each worker’s salary, up to the cap, goes into the Social Security Trust Fund every year. This fund is controlled by the U.S. government, andthe money paid into it is used to pay benefits to people who are currently retired. A household consisting of two earners with a combined income of $20,000 receives 87% of that income when they retire. On the other hand, a twoearner household with a combined income of $150,000 receives only 35% of their income when they both retire. These percentages are called replacement ratios. Exhibit W1.10 gives a more detailed list of replacement ratios. A household continues to receive retirement income until both members die. When the first member of a household dies, the surviving member receives reduced social security benefits.
Defined Benefit Pensions: These are contractual obligations under which employers promise to pay retirement benefits for employees in the form of a fixed annuity. The amount of the annuity depends on the number of years of service and the final salary that a worker earned. For example, a typical fixed annuity is calculated by the following formula: 2% x (number of years of service) x (final salary). These types of benefits are relatively safe. Even if a company goes bankrupt, the pension plans are insured by the government. State and local government employees are even more secure because it’s very rare for a government (whether state or local) to go bankrupt.
Defined Contribution Pensions: These are individual investment accounts that are owned and controlled by employees. An example of these pension accounts is 401(k) accounts. Under defined contribution pensions, an employee contributes a certain percentage of her income (5% to 10%), and the employer matches these contributions. Typically, an employer contributes $0.5 for every dollar an employee contributes, up to 6% of the employee’s income. Unlike social security, these contributions are done on a voluntary basis. Also, employees contributing to these accounts own and control their accounts they decide how much to invest, and they are free to choose from a list of approved mutual funds approved by their employers. The amount of the benefits in these accounts depends on the performance of the selected mutual funds.
Individual Retirement Accounts (IRAs): These are straightforward savings accounts that are used predominantly for retirement. They are voluntarily established by individuals, who have full control over them. These accounts are particularly attractive to workers who don’t contribute to defined contribution pensions, or those who work in firms that don’t offer savings plans to their employees.
How Easy Is It to Beat the Market? There are around 10,000 mutual funds in the United States alone. These funds are managed by managers who claim they can outperform the market every year. The truth of the matter is that only very few active managers are able to reliably outperform the stock market. Sure, some managers may beat the market in a given year, or maybe for two or three years in a row, but it is often the case that their odds of beating the market are the same as your odds of getting a “head” when you toss a coin a 50% chance. But over a long period of time, say 10 years, several thousand mutual funds will beat the stock market more than half the time, even though they don’t beat it every year. Thus, when we look at a 10-year performance, we see impressive winnings of many mutual funds that didn’t necessarily win in every single year. The key question here is whether the 10-year historical performance of a certain mutual fund is a strong predictor of its performance over the next 10 years. Economists find that successful historical asset managers tend to perform no better in the next 10-year period than pure chance would predict.
Evidence-Based Economics: Do investors chase historical returns? The answer to the opening question is yes, investors do tend to chase historical returns. Why did Enron employees invest 62% of their retirement savings in Enron stock rather than diversifying? It’s because Enron’s stock rose 1,000% during the 10-year period prior to the company’s total collapse, as Exhibit W1.11 shows. The fact that investors chase historical returns was demonstrated in a study that was done by economist Shlomo Benartzi. Studying employees’ retirement fund contribution decisions in 154 of the largest companies in the United States, Benartzi found that there was a positive correlation between a company’s historical returns and the percentage of retirement savings that its employees chose to contribute to employer stocks. From the sample of companies selected, the study also found that return chasing didn’t benefit employees.
IV. Active Learning Exercises
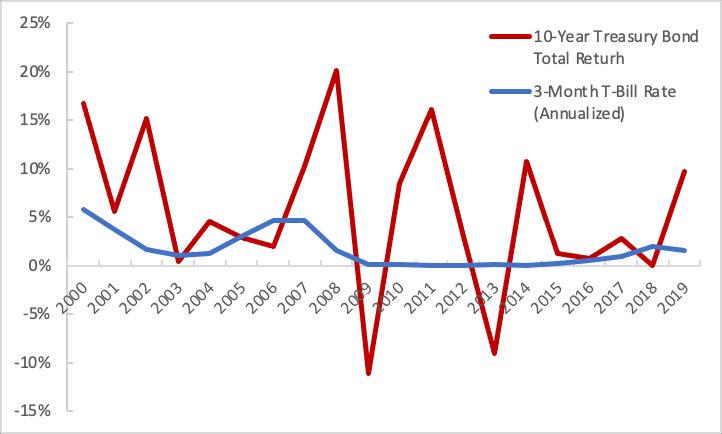
1. Excel-based Activity This activity asks students to use the Excel function “FV” to discover the time value of money and how compounding works. The input values that are necessary are 1) the initial investment, 2) the yearly payments, 3) the rate of return or interest rate, and 4) the number of periods. Due to the way Excel accepts inputs, the initial investment and the monthly additions must be entered as negative numbers.
Activity: Using the FV function in Excel, determine the final value of
A. an initial investment of $1,000 and 20 monthly payments of $100 when you expect to earn a rate of return of 8%. Also, show how much total money is being invested.
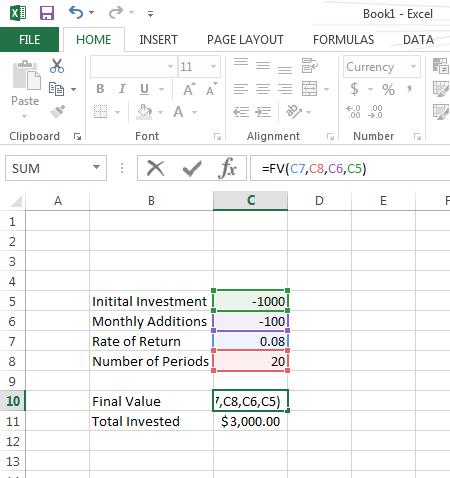
B. an initial investment of $1,000 and 10 monthly payments of $200 when you expect to earn a rate of return of 8%. Also, show how much total money is being invested.
C. Compare the total investment returns and the total invested for parts (a) and (b). What causes this difference?
Solution: Correct input of cells

A.
C. The difference in returns is nearly $4,000, even though exactly the same amount is invested in each scenario. The difference shows the power of compounding. Even though the monthly payments are greater in Part B than in Part A ($200 compared to $100), Part A results in nearly $4,000 more because the number of periods is twice that of Part B.
2. Exploration Activity Ask students to find and research three investment companies that offer access to index funds and mutual funds. Have students describe the differences in the fees and expense ratios associated with each company/type of fund.
Sample Solution: Students could discuss Vanguard, iShares, etc. Students will find that index funds often have much lower fees because they do not need to be actively managed.