The Principles and Practice of Economics
Questions
1. Why do we have to pay a price for most of the goods we consume?
Answer: The inputs we use to produce most goods and services (for example, capital and labor) are scarce. Therefore, almost all goods and services are scarce compared to the quantity that consumers want to consume. In other words, at a price of zero the demand for most goods is higher than the available supply; our wants are unlimited, but our resources are not. Prices act as a rationing mechanism to prevent the over-consumption of such scarce goods, making them available in the quantity such that the supply of these goods matches the demand.
2. Many people believe that the study of economics is focused on money and financial markets. Based on your reading of the chapter, how would you define economics?
Answer: Economics is the study of how agents (for example, households and firms) choose to allocate scarce resources and how these choices affect society. Although it is true that economics studies money and the financial markets, the study of economics is really focused on human behavior and choices. Given that we have limited resources, we need to choose between various options. Economic analysis is used to understand people’s choices in order to describe what people do and recommend what people ought to do.
3. Examine the following statements and determine if they are normative or positive in nature. Explain your answer.
a. Car sales in Europe rose 9.3 percent from 2014 to 2015.
b. The U.S. government should increase carbon taxes to control emissions that cause global warming.
Answer:
a. This is an objective statement about the rate of growth in the European automotive industry. Positive economics is analysis that generates objective descriptions or predictions about the world that can be verified with data. Since data can be used here to verify the rate of growth, this is a positive statement.
b. The statement that the government should increase carbon taxes to control emissions is normative since it states what the government ought to do. Normative economics advises individuals and society on their decisions and is almost always dependent on subjective judgments.
4. How does microeconomics differ from macroeconomics? Would the supply of iPhones in the United States be studied under microeconomics or macroeconomics? What about the growth rate of total economic output in the national economy?
Answer: Microeconomics is the study of how individuals, households, firms, and governments make choices, and how those choices affect prices, the allocation of resources, and the well-being of other agents. Macroeconomics is the study of the economy as a whole. Macroeconomists study factors that affect overall – in other words, aggregate – economic performance.
The supply of iPhones refers to the supply of a good by an individual firm, Apple. The iPhone market will be studied under microeconomics. Microeconomics studies how individuals, households, firms and governments make choices, and how those choices affect prices and the allocation of resources. The growth rate of total economic output, on the other hand, refers to the aggregate American economy, and is therefore studied under macroeconomics.
5. What does a budget constraint represent? How do budget constraints explain the trade-offs that consumers face?
Answer: A budget constraint is an equation representing the goods or activities that a consumer can choose given her limited budget. Tradeoffs arise when some benefits must be given up in order to gain others. In other words, a trade-off occurs when you give one thing up to get something else. Since a budget constraint shows the set of things that you can choose to do or buy with a fixed amount of money, it also shows that if you choose to buy more of one good, you will have to buy less of another. Therefore, a budget constraint equation implies that a consumer faces a tradeoff.
6. This chapter introduces the idea of opportunity cost.
a. What is meant by opportunity cost?
b. What is the opportunity cost of taking a year after graduating from high school and backpacking across Europe? Are people who do so being irrational?
Answer:
a. Opportunity cost is the best alternative use of a resource. The opportunity cost of a particular choice is measured in terms of the benefit foregone from the next best alternative. To facilitate comparison, the benefits and costs of various choices are translated into monetary units like dollars.
b. The opportunity cost of backpacking across Europe, for a particular person, is the cost of anything else that could have been done in that year. The backpacker could have attended college or started working. These costs are the opportunity costs of the gap year. This, however, does not mean that backpackers are irrational, because the benefits may exceed the cost. Every action has an opportunity cost. The choices that people make are optimal based on their perceived costs and benefits.
7. The costs of many environmental regulations can be calculated in dollars for instance, the cost of “scrubbers” that reduce the amount of air pollution emitted by a coal factory. The benefits of environmental regulations often are most directly expressed in terms of lives saved (reduced mortality) or decreases in the incidence of a particular disease (reduced morbidity). What does this imply about the cost-benefit analysis of environmental regulations? There is an old saying “You can’t put a price on a human life.” Do you agree or disagree? Explain.
Answer: Cost-benefit analysis can be used when there is a common unit, such as dollars. This method is less straightforward if there are two different units of measurement, such as dollars and lives. However, if a direct link can be drawn between dollars spent and lives saved then costbenefit analysis becomes feasible. When an environmental regulator places a value of 3 million dollars on a human life (for example), they are claiming that if 3 million dollars is not spent in one area, then it can instead be spent in another area where 3 million dollars is expected to save one life, on average. While some people may find this practice controversial, it does provide the most practical way to maximize the number of lives saved, given limited financial resources.
8. Suppose the market price of corn is $5.50 per bushel. What are the three conditions that will need to be satisfied for the corn market to be in equilibrium at this price?
Answer: For the market to be in equilibrium, three conditions will need to be satisfied.
• At the price of $5.50 per bushel, the amount of corn produced by sellers should be equal to the amount of corn purchased by buyers in the market.
• Farmers have chosen the optimal quantity of corn to produce given the price of $5.50 per bushel.
• Consumers have chosen the optimal quantity of corn to buy given the price of $5.50 per bushel.
9. Economists are often concerned with the free-rider problem.
a. What is meant by free riding? Explain with an example.
b. Are public parks subject to the free-rider problem? What about keeping city streets clean? Explain your answer.
Answer:
a. A free rider is a person who receives the benefit of a good but avoids paying for it. People tend to pursue their own private interests and usually don’t contribute voluntarily to the public interest. For example, watching a pirated copy of a movie is cheaper than buying one. Those who watch the pirated version are free riders because there are others who buy the movie or pay for movie tickets. If everyone watched pirated copies, making movies would not be profitable and the industry would not function.
b. Cleaning of city streets may be subject to free riding. Suppose the streets are cleaned every day at a fixed cost. This cost is borne by those who pay taxes to the city government. However, they cannot prevent others who do not pay taxes from using the clean streets. This leads to the free rider problem. However, not all free riding is necessarily problematic. For a park that already exists, it is good when many people enjoy its benefits, especially when there are no real costs associated with usage. The park example demonstrates that free riding is not a problem per se. Rather, it may lead to the underproduction of public goods but once a particular public good exists people should use it as much as possible, so long as they do not get in other people’s way.
10. Explain the concept of causation with the help of a simple real-life example.
Answer: Causation is a relationship between two events or states, such that one brings about a change in the other. In short, it explains the cause and effect relationship between two variables or events. For example, people who go to college learn skills that are valuable to prospective employers. So a college degree causes someone’s wages to rise.
11. Identify the cause and the effect in the following examples:
a. A rise in the worldwide price of peaches and a drought in California.
b. A surge in cocoa prices and a pest attack on the cocoa crop that year.
Answer:
a. A drought in California causes a decrease in supply of peaches, and thus a rise in price.
b. The pest attack is likely to have reduced the cocoa crop, leading to a rise in prices.
Problems
1. You have already purchased (non-refundable and unsellable) tickets to a concert on Friday night. A friend also invites you to her birthday party on Friday. While you like your friend, you politely decline because you really want to go to the concert.
a. You learn that your friend is serving flank steak at her party, all-you-can eat and at no charge. Flank steak is your favorite food. Should this affect your decision to go to the concert? Explain by using the term “opportunity cost.”
b. Suppose instead that you notice that the non-refundable concert ticket (that you already purchased) cost you $10; previously you had mistakenly believed the price was $100. Should learning this information affect your decision to go to the concert?
Answer:
a. This should affect your decision, or at least make you reconsider. The explicit cost of the concert has not changed, nor the benefit of the concert itself. However, the opportunity cost of missing the party is now higher than you previously thought.
b. This should not affect your decision. Whether you paid ($10 or $100) in the past is irrelevant to the costs and benefits that you can affect by going (or not going) to the concert.
2. You are thinking about buying a house. You find one you like that costs $200,000. You learn that your bank will give you a mortgage for $160,000 and that you would have to use all of your savings to make the down payment of $40,000. You calculate that the mortgage payments, property taxes, insurance, maintenance, and utilities would total $950 per month. Is $950 the cost of owning the house? What important factor(s) have you left out of your calculation of the cost of ownership?
Answer: You have ignored the opportunity cost of the funds you are using for the down payment. By using your $40,000 to buy the house, you give up the opportunity to earn interest on that money. If you could earn 5% interest, then the opportunity cost is 0.05 x $40,000 = $2,000 per year, or $167 per month. This does not imply that you should not buy this house. It does imply, however, that you need to think carefully about opportunity cost as you weigh this decision. An economist would tell you that the monthly cost of owning this home is $950 + $167 = $1,017.
3. One of the largest costs of going to college is the opportunity cost of not having the income from a full-time job. Also, during an economic recession people often find it difficult to find a full-time job. Given these two facts, should the number of people who want to go to college increase or decrease during a recession?
Answer: The number of people who want to go to college should increase since the opportunity cost of going to college is now lower on average. (And in fact, colleges often see an increase in demand during economics recessions.)
4. You have decided that you are going to consume 600 calories of beer and snacks at a party Saturday night. A beer has 150 calories and a snack has 75 calories.
a. Create a table that shows the various combinations of beer and snacks you can consume. To keep things simple, use only round numbers (e.g., you could choose 1 or 2 beers but not 1.5 beers).
b. What is the opportunity cost of a beer?
Answer:
a. Suppose you choose to consume 0 beers. Then you could use all 600 calories on snacks. Since snacks have 75 calories you could consume 600 / 75 = 8 snacks. Now suppose you choose 1 beer. A beer has 150 calories and so you would be left with 600 – 150 = 450 calories for snacks. You could therefore consume 450 / 75 = 6 snacks if you choose 1 beer. You can use the same logic to complete the table below.
b. If you consume 1 more beer you will have 150 fewer calories for snacks. Since a snack has 75 calories, consuming one more beer means that you will have to give up 150 / 75 = 2 snacks. The opportunity cost of a beer is therefore 2 snacks.
5. Suppose you are ready to check out and see two lines: Line A has 3 people, while line B has 5 people.
a. Assume people just chose lines at random and have not yet had a chance to switch lines. Would you consider this situation to be in equilibrium? Why or why not?
b. Assume that all 8 shoppers are optimizing (i.e., they have had a chance to switch), and that the situation is in equilibrium. What conclusions would you draw?
c. Of all 8 shoppers, whose behavior is the most informative? Answer:
a. This situation is not in equilibrium. Assuming both lines move at the same speed, it would make sense for the last person in the longer line to switch to the shorter line.
b. If the 8 shoppers know what they are doing, then it must be the case that the shorter line moves more slowly.
c. The behavior of the last person in each line is the most informative. The assumption that these shoppers are optimizing allows an outside observer to draw conclusions about the speed of the two lines.
6. Suppose your friend makes each of the following statements. She might simply have a dour disposition, or she might be an economist! Explain briefly how she has come to each conclusion and try to use the concepts of optimization and equilibrium.
a. “There is no use moving to that shorter line.”
b. “Do not bother trying to switch lanes during a traffic jam.”
c. “Do not actively trade stocks since it is impossible to predict whether the price will go up or down tomorrow.”
Which of these statements is related to optimization and which is related to equilibrium? Explain.
Answer:
a. The checker must be slower, which is why other people at the end of the longer line have not optimized by already moving to this shorter line.
b. On average each lane moves the same speed in equilibrium. If one lane does in fact move faster, people will optimize by moving into this lane, which will slow it down.
c. This concept is sometime labeled “the efficient market hypothesis” and is due to the same factors related to lines at the store and traffic congestion: Any clear and obvious gains will be quickly realized by other optimizing agents, thus the current price represents the best guess as to what the future price might be. Thus, there is no easy money to be made in the stock market, at least in equilibrium, and assuming you do not have access to any privileged information.
7. In 2014, California was in its third year of a major drought. With water supplies dwindling, Governor Brown issued a plea for a voluntary 20 percent reduction in water use. This target was not reached. In early 2015 Governor Brown issued an executive order requiring local water agencies to reduce water use by 25 percent, but no enforcement mechanism was specified. No taxes or fines were in the executive order. State officials hoped that they could achieve compliance without resorting to fines.
a. From an individual homeowner’s perspective, what are the costs and benefits of using water during a drought? Why do you think that the voluntary reduction order in 2014 didn’t work?
b. Using concepts from this chapter, explain how you might get individual homeowners to reduce water use during a drought.
c. Eventually, many communities began levying fines on water use. However, while many middle income families dramatically cut water use, wealthy households cut back their water use relatively little. How can you explain this phenomenon from an economic perspective?
Answers:
a. With no specific enforcement mechanism, there is low cost to using water. Water bills are not zero, but these prices were low enough in the past to create a water shortage, so clearly the financial cost is not high enough to prevent a shortage. There may be some social stigma attached to watering a lawn, though this cost varies for each person and depends on their sense of civic responsibility. On the flip side, the benefits of using water are quite clear: Green lawns, pleasant showers, and odorless toilets. The fact that the 2014 plea did not work is because the cost of violating a call for civic responsibility is not very high for most people.
b. Charging a higher price for water than in 2014 would likely result in a reduction in water usage. When the price goes up, people would discover that some of their usage is actually not that important.
c. Fines are equivalent to a higher price for water. In this case, lower income individuals were more price elastic; they responded more sharply to a price change. This implies that the willingness to pay for the last gallon of water in a low-income household is less than the willingness to pay in a high-income household.
8. An economist observes that many students spend $100,000 to go to college. This researcher could ask whether such spending is worth it, or she could assume that it is worth it. In other words, she could assume that students are optimizing and that the education system is in equilibrium. What can the economist conclude about the value of a college education?
Answer: An economist will conclude that college increases earnings (over a lifetime) by at least $100,000 the increase may be higher, but it cannot be lower. If this were not the case, then students would choose to skip college. This analysis assumes there are no other benefits to college besides higher income, as well as no other costs besides monetary costs. In reality there are many other costs and benefits of college. However, the main point stands: The observation that people are willing to pay a certain amount for college provides information about the economic value of college.
9. It is the night before your economics final exam, and you must decide how many hours to study. The total benefits column shows how many more points you expect to earn because of increased knowledge. The cost column shows how many points you will lose because of careless errors due to lack of sleep. (The “marginal” columns show the effect of each additional hour spent studying. These marginal numbers are calculated by taking the difference within a column from one row to the next row.)
a. If you study in an optimal way, how many more points will you earn on the test?
b. Explain how you can find the optimal number of hours by using the marginal benefits and marginal costs columns.
Answer:
a. Total benefit minus total cost is maximized at 16 – 3 = 13 when you study for two hours. This difference is lower in all other rows.
b. You can arrive at the answer of 2 hours by noticing that the first hour is well worth it since the marginal benefit of 10 is greater than the marginal cost of 0. The second hour is also worth it since 6 > 3. However, the third hour is not worth it since 4 < 5, thus you will gain fewer points than you will lose. (This sort of “marginal analysis” is a recurrent theme in economics.)
CHAPTER 1
The
Principles and Practice of Economics
I. Key Ideas
Economics is the study of people’s choices.
The first principle of economics is that people try to optimize: they try to choose the best available option.
The second principle of economics is that economic systems tend to be in equilibrium, a situation in which nobody would benefit by changing his or her own behavior.
The third principle of economics is empiricism analysis that uses data. Economists use data to test theories and to determine what is causing things to happen in the world.
II. Getting Started
A. The Big Picture
The goal of this chapter is to introduce readers to economists’ perspective we tend to envision a world populated by a variety of rational, self-interested people trying their best to make good decisions in the presence of numerous real-world constraints. These decisionmaking economic agents may be individuals, groups, or organizations, and they could be motivated by many different objectives, but they face a common problem: how to allocate scarce resources across competing ends, knowing that their choices will affect society.
The authors identify three principles (optimization, equilibrium, and empiricism) that characterize economic thinking and distinguish it from the approach other social sciences take. These three underlying themes provide a foundation for subsequent chapters and a way for beginning students to draw connections between seemingly different branches of economics. We will use insights from cost-benefit analysis to describe the world (positive economics) and offer advice (normative economics) on everything from simple decisions to complex public policies.
Where We’ve Been
Students probably have not previously read the material found in Chapter 1 in a typical textbook, so this chapter is their first exposure to ALL. However, while we haven’t been anywhere yet in ALL, your students have been other places. One could imagine a variety of possible student audiences who might take an economics course using this book. For instance, students may vary based on their experience with economics, math, or life (e.g., 18 year-olds, working thirty-somethings, retirees), citizenship, gender, religious preferences, or a host of other traits. It is often worthwhile to gather some basic information about your
audience early in the term. A low-cost way to do this is by asking some of the following questions on a Student Information Card:
Name (and how to pronounce it correctly)
Phone number (to be used only in cases of academic emergencies, such as oversleeping for the final exam; this assumes the instructor can identify missing students, perhaps by labeling exams with student names)
Hometown (and what is it known for)
Anticipated major(s)/minor(s)/program(s)
Previous economics or math courses
Three interesting facts about you, the student
Three favorite products, firms or industries
Dream job
Post-graduation plans
Questions, concerns, comments, or topics you hope the class will cover
Most students are happy to volunteer such information (through a Google survey, on Facebook or in class) and collecting it can benefit an instructor in several ways. First, it signals that the instructor cares, regardless of whether there are 20 or 200 students. Second, it provides useful information about the level at which to pitch the material; if most students in the class have already taken a course in macroeconomics, then an instructor could proceed quickly through familiar topics such as supply and demand diagrams and welfare analysis, whereas if this is the first course for many, then one should expect to spend more time on the basics. Third, it helps the instructor tailor the course by using real world examples that will resonate with the class; for instance, one might discover that many students plan to move to New York to work on Wall Street, they like Under Armour or Lululemon clothing, or they frequent a local coffee shop. Fourth, it inspires conversations after class, during office hours, or by e-mail; students appreciate career advice, and some will likely ask for recommendations someday.
Where We’re Going
Chapter 1 sets the stage for the rest of the textbook by introducing the three principles of economics: optimization, equilibrium, and empiricism. Here’s a quick summary of the major topics of the first seven chapters, highlighting the presence and use of these three principles:
Chapter 1 The Principles and Practice of Economics: introduction to the three principles, especially optimization and equilibrium; an empirical look at Facebook and the opportunity cost of your time
Chapter 2 Economic Science: Using Data and Models to Understand the World: overview of empiricism; an empirical look at the returns to education
Chapter 3 Optimization: Trying to Do the Best You Can: the two major types of optimization (by levels and by differences); choosing apartment location based on commuting time and rent; an empirical look at why housing prices vary geographically
Chapter 4 Demand, Supply, and Equilibrium: introduction to the competitive market equilibrium; an empirical look at why oil prices vary geographically
Chapter 5 Consumers and Incentives: optimizing buyers generate demand curves (which are related to price-elasticity of demand and consumer surplus); an empirical look at how financial incentives affect the decision to quit smoking
Chapter 6 Sellers and Incentives: optimizing sellers generate supply curves (which are related to costs, inputs, technology, and producer surplus); an empirical look at how ethanol subsidies affect ethanol producers
Chapter 7 Perfect Competition and the Invisible Hand: in a competitive market, optimizing selfish individuals generate equilibrium with socially desirable characteristics; an empirical look at how markets function using experiments involving double oral auctions or open-air markets
Subsequent chapters also feature optimizing agents, equilibrium models, and the empirically minded sections entitled Evidence-Based Economics.
B. Number of Lectures
Of all of the chapters an instructor ponders whether to cover, this is probably the one that s/he would trust students to read on their own, although it introduces some material, particularly the concept of opportunity cost, that is essential for beginning students to understand. There is little math just the annual opportunity cost of spending an hour each day on Facebook and the essence of the chapter is introducing the three principles of optimization, equilibrium, and empiricism, which are covered in more detail in the next few chapters, and which will appear consistently throughout the ALL text. Depending on the students’ backgrounds, anticipated pace of the term, and instructor’s faith in the ability of students to grasp nuances by reading, one could spend up to one 60-minute lecture presenting Chapter 1.
Many instructors use the first class meeting to distribute the syllabus, describe what material the course will cover, explain how students will be evaluated, and answer general questions, there may not be a lot of extra time. Nevertheless, some find it worthwhile to set the stage on the first day, jump right into the material, and begin interacting with the class. Some students may be on the fence about whether to stick around, so in some sense, the first day of class and the first chapter of the book may push the folks one way or another. It’s a great opportunity to demonstrate the value of viewing the world through the eyes of an economist.
C. Opening Question and Evidence-Based Economics
“What is the cost of using Facebook?” This is a terrific way to open the textbook for many reasons. First, it is a topic to which today’s students can easily relate; many of them may have been on Facebook shortly before reading this chapter! Second, it introduces a clear choice about how students use their time. Third, it immediately forces them to ponder the meaning of the word “free” should it refer only to out-of-pocket costs (direct cash outlays) or should it include the opportunity cost of time spent on Facebook? Finally, it gets them
thinking about how one might compute the true cost of spending hours on Facebook and prepares them to start thinking mathematically about such matters.
The way the authors start the book is often a good way to start class: presenting an interesting, accessible, real-world problem to motivate the lecture and continually reinforce the idea that there is a compelling reason to learn what’s about to be taught.
It is hard to produce a one-size-fits-all book, so if a particular example is not familiar or it is possible to find a similar example that students will find more accessible or interesting, by all means adapt the material to appeal to the audience. For instance, the essence of the Facebook scenario is the student would be spending an hour on an activity with no explicit cost; s/he could just as easily be reading a library book, watching videos on YouTube or Netflix, playing the latest hit video game, taking a long walk, or attending a weekly meeting.
III. Chapter Outline
1.1 The Scope of Economics
When told to wash the family car, the teenage daughter has several options, including “she can move out (a drastic response, sure, but still an option).” One may find that dramatic yet feasible responses can launch fruitful discussions in or after class. For example, if a student needs a truck and two helpers in order to move from campus to an apartment, there are numerous interesting ways to get a truck (buy it, rent it, build it, steal it) or truck-loading labor services (pay cash, barter, use guilt, use physical threat); modern society frowns on the more controversial of these, but one can see how someone may have justified them using cold-hearted cost-benefit analysis. Indeed, plenty of laws are designed to prevent economics from becoming an over-riding concern in issues, such as euthanasia for the terminally ill.
Teaching Idea: Ask your class the following question: What are some of the choices you made today leading up to this minute? A: Breakfast (whether to eat, what to eat, how much to eat), clothing (bring an umbrella?), attend class, transportation (walk, run, bike, bus, drive, hitchhike).
Continuing the list of choices related to the sports car: How often to change the oil and bring the car in for maintenance, whether to use original or third-party replacement parts, whether to park outside or pay more for a covered parking spot.
Economic Agents and Economic Resources
A wide variety of individuals, groups, and organizations make choices regarding scarce resources; the most common economic agents are households, firms, and governments. Because we have unlimited wants but resources are limited, we face interesting choices about how to allocate these scarce resources.
In several pages, the authors will discuss optimization, the idea that each of the economic agents makes choices to pursue a particular objective. To the current list in Exhibit 1.1 one might add government, regulatory agency, or bureaucrat, and ponder what it is that motivates each of these decision makers.
Economic agents are the players in our fanciful world of economic theory, in which economists can pretend to be Zeus, throwing lightning bolts at the mere mortals just to see how they respond and react to the changing environment.
Teaching Idea: Ask your class: Which different types of economic agents does one find at a college or university? A: The institution (usually a non-profit), various schools or divisions, departments, faculty, students, administrators (president, provost, deans), support staff
“…if sports cars were given away at a zero price, there would not be enough of them to go around. So how does society determine who gets the limited supply of sports cars?” A good answer for many communities is prices from markets. Immediately we have arrived at the issue of fairness. For now, one might refer students to the discussion of fairness in Chapter 18 (Social Economics).
One might highlight the statement, “Economists don’t want to impose our tastes … on you,” and introduce the Latin phrase De gustibus non est disputandum, which means there is no accounting for taste: Economists are more interested in the fact that you prefer Lady Gaga’s music to Katy Perry’s music, rather than the reasons behind that preference.
“Sometimes economists simplify their analysis by treating these groups as a single decision maker, without worrying about the details of how the different individuals in the group contributed to the decision. For example, an economist might say that Apple prices the iPhone to maximize its profits, glossing over the fact that many employees participated in the analysis…” We revisit the issue of collective decision making in the context of externalities and public goods (Chapter 9). There are many times in economics when it makes sense to (temporarily) assume away real world complications, such as voting and decision making within complex organizations. It is useful to think of Apple as a decision making entity, rather than focusing on CEO Tim Cook’s role in setting the price of the 10-year anniversary iPhone model and the firm’s internal discussions about competing with the latest model of the Androidbased Samsung Galaxy smartphone.
Definition of Economics Economics is the study of how agents choose to allocate scarce resources and how those choices affect society. Agents may not be aware of all of the ways their choices affect other agents.
The phrase “and how those choices affect society” suggests that we are going to need a way to keep score and compare various outcomes. Future chapters will introduce measures such as consumer surplus and producer surplus to do just that.
Positive Economics and Normative Economics Economists describe the choices agents actually make (positive economics) and prescribe or recommend the choices that agents should make (normative economics).
Economists are well equipped to offer advice on public policy, such as ongoing legislation to tax sugary sodas in order to curb obesity. It is important to remember that economists have no moral authority on such matters. Furthermore, it may be
difficult for an economist to remain fully objective because his/her personal opinions and values are likely to affect such advice.
Public policies create winners and losers, so there may be much to gain by agents who can influence the political process or economists’ advice to their advantage. Hence, policy analysis naturally inspires the appearance of lobbying.
The terms should and ought to typically indicate a normative statement. Similarly, words such as better or worse project a subjective opinion, whereas words like increase and decrease seem more objective.
Students will appreciate the complications involved in giving and receiving advice. E.g., some might really want advice on which courses to take next term, but really not want advice on their choice of a significant other!
The authors’ example about helping a worker choose how to invest her retirement savings highlights the fact that people often have heterogeneous preferences, such as the ability to tolerate risk. Hence, it is very important to carefully listen to clients before dispensing prescriptive advice. This is true for small decisions such as retirement savings portfolios and large decisions, such as national health care policies.
Microeconomics and Macroeconomics Microeconomists study small pieces of the economy, such as the output, pricing, and hiring decisions of a single firm, or of several firms in a particular market, whereas macroeconomists study the economy as a whole, which consists of many firms in many markets.
Different types of problems require different types of models. In general, a macroeconomy can be thought of as an aggregation of many microeconomic parts, but in order to construct working models of national economies, macroeconomists need to make simplifying assumptions (e.g., imagining a representative household or firm instead of millions of heterogeneous individual actors). For example, in the wellknown Keynesian model, total spending in a macroeconomy could be decomposed into nation-wide spending by households, businesses, governments, and those involved in international trade; in contrast, a microeconomist might model a household’s demand for a laptop, the local market for laptops, or the effect of an educational policy that subsidized the purchase of laptops by families with high school students.
Common Mistakes or Misunderstandings: The division between macroeconomics and microeconomics is not always clear. We tend to analyze the minimum wage and hiring decisions in microeconomics but focus on broader labor market issues, such as the labor force participation rate and the unemployment rate, in macroeconomics. For example, the national market for low-skilled workers could be thought of as either a particular labor market (microeconomics) or a national labor market (macroeconomics). Macroeconomic fiscal policy, such as an income tax cut, works by altering the budget constraints of millions of individual households, each of which is solving a microeconomic optimization problem. The division is useful for beginning students, but by the time economics majors are seniors, we hope that they see the two branches of economics are closely linked.
1.2 Three Principles of Economics
Economics is a social science, but economists look at the world differently than do anthropologists, historians, political scientists, psychologists, and sociologists. In particular, economists highlight three key concepts: optimization, equilibrium, and empiricism.
It’s useful to point out that a well-read student can view the world through several perspectives, and no single perspective is right or wrong, though we are confident that the economist’s perspective is particularly useful because of our explicit, up-front assumptions, (mostly) mathematical models, and use of data to continually test whether the models help us make real world predictions.
One might contrast economics and history to get a better sense of the economist’s perspective. An economist might try to model and understand my lunchtime dining optimization problem, and once s/he understands my incentives and behavior, then s/he can better understand how my colleagues behave. That is, economists like to set up generalizable problems that can be used to solve a variety of similar, related problems. In contrast, historians may focus on a particular event and argue that unique circumstances generated a noteworthy outcome. In short, economists seem more likely to try to answer a range of similar questions, whereas historians (stereotypically) are more likely to claim that each unique question has a unique answer.
1.3 The First Principle of Economics: Optimization
It is useful to break down the definition of optimization into its parts. “Optimization means picking the best feasible option, given whatever (limited) information, knowledge, experience, and training the economic agent has.” We see that optimization requires an economic decision maker, a set of feasible options, a way of determine which of these options is best, and some real world constraints on the actor’s decision making abilities, usually in the form of information, or lack thereof. When any of these elements change, the choice may logically change.
A fun exercise is to make a list of all of the things one could be doing right now instead of sitting in class. Optimization means choosing the highest ranked option out of a menu of options.
“…evaluating the rationality of a decision means examining the quality of your initial decision, not the outcome.” Economists tend to be forward-looking: if you made the best decision at the time, given limited information and other constraints, then you did the best that you could.
“…what we optimize varies from person to person and group to group.” If someone makes a very different choice from what you would do, it could be due to different preferences or different constraints. Also, “most governments are trying to optimize a complex mix of policy goals.” If it seems difficult to understand government, remember that it’s likely that there is much more going on than meets the eye.
Armed with insights from solving simple optimization problems, we can turn our attention to more complex problems.
Teaching Idea: Several important concepts are covered in this section, and the order of presentation in the book budget constraints before opportunity costs may not be ideal for everyone. Another approach is to start with resource scarcity, then introduce the necessity of making choices, which requires thinking about trade-offs, and for every choice there is an alternative forgone (an opportunity cost); finally, we use a budget constraint (in an intuitive, algebraic, and/or graphical form) to help with our analysis of how to make these trade-offs.
Common Mistakes or Misunderstandings: Warn students not to go too far in assuming that households try to maximize income and firms try to maximize profit. It is usually easier to convert payoffs into dollars, but economics isn’t preoccupied with making money. In the upcoming discussion of opportunity cost, it is convenient to dollarize options such as working locally at a family restaurant or moving to New York to work in finance, but the fundamental issue is that one person cannot be in two places at one time, so the resource constraint (scarce time) forces the decision.
Trade-offs and Budget Constraints In order to get one thing, we must give up something else; we illustrate this simple trade-off concept with a budget line, which shows all of the combinations of goods that are affordable with one’s current income.
Teaching Idea: Students could revisit the list of choices they have already made today and make a corresponding list of things they didn’t choose. A student who had cereal for breakfast may have chosen not to have pancakes, fresh fruit, or an omelet.
The two easiest budget constraints to think about involve dollars and hours. $100 could be spent on smartphone apps or food, and 24 hours in a day could be allocated to sleeping, studying, exercising, or other activities.
If you can exactly afford something then you have a binding budget constraint, whereas if something is affordable and you still have leftover resources, then that budget constraint is non-binding. For example, Exhibit 1.2 shows six different combinations of hours web-surfing and hours working at a part-time job; in all six cases, the two types of hours sum to five, so they are exactly affordable and the fivehour time constraint is binding.
Teaching Idea: A fun exercise is to make a list of the real world constraints that make choices interesting. For instance, constraints might be financial (just $20 in my wallet), chronological (just 24 hours until the final exam), physical (can’t dunk a basketball), legal (can’t buy ecstasy at CVS), social (may be shunned for nonconformance), spiritual (that food, clothing, language or behavior is against my religion), mental (can’t understand phrenology or quantum physics), philosophical (during the Vietnam War, one was a conscientious objector), ethical, guilt-based, etc. Cultural differences also go a long way in explaining why people from different backgrounds may act differently in a given situation and these different actions may be perfectly rational!
Opportunity Cost For every option chosen, there is at least one option not chosen, and we refer to the best of these forgone options as the opportunity cost. It is often useful to use the value of the best alternative forgone, and if we conservatively value a set of hours spent on one activity, we can imagine those hours spent on a part-time job earning the going wage.
Teaching Idea: A useful exercise is to ask students to identify the costs of attending college for a fifth year. Students are quick to list the explicit costs of tuition and books, but they tend to overlook the implicit cost of a year’s forgone salary. An important insight is that opportunity costs are often hidden and easily overlooked.
The opportunity costs of using a resource are often the income one could obtain by selling or renting out that resource; this is true whether the resource is a building, a vehicle, or a person’s time.
“And postponement is not an escape hatch from this economic logic.” Procrastinators beware!
Teaching Idea: Throughout this textbook and course, students will be exposed to economic reasoning that might come across as common sense. Each culture has a collection of familiar sayings that include nuggets of economic wisdom. One can often ask students to come up with a saying that captures the economic concept du jour. E.g., when talking about tradeoffs, a good relevant saying is “You can’t have your cake and eat it too.”
Cost-Benefit Analysis To compare two or more alternatives we identify all of the relevant costs and benefits, compute net benefit (equal to that alternative’s total benefit total cost) for each option, and then identify the alternative(s) with the highest net benefit. Maximizing net benefit is equivalent to optimizing.
Common Mistakes or Misunderstandings: Again, the fact that economists tend to dollarize various options does not mean that we are obsessed with making money, but instead reveals that we use this convenience to avoid comparing apples to oranges. It is hard to value an 8-hour day at Six Flags, but if we know that the person can earn an hourly wage of $12, then those 8 hours could be used to generate an income of (8)($12) = $96, and we have a sense of what $96 can buy. Analogously, we might focus on dollars in the U.S., but we could use exchange rates to convert dollars to foreign currencies, which may be more natural for foreign students to use.
It can be tricky to assign dollar values to some activities. One could use an hour on Sunday evening to do homework, watch Netflix, read a book, or go to bed early. Here, it makes sense to think of the one hour expended as the cost and then pick the activity that makes one happiest, rather than trying to convert the hour of time and the happiness into dollars.
The authors write, “Economists are not popular for making some of these ‘coldhearted’ calculations.” One could add that people needn’t follow the advice of economists, but our perspective does provide a starting point for discussions on how to proceed.
Cost-benefit analysis (CBA) can be simple, such as making a static decision based on today’s certain costs and benefits. It can also get very complicated, such as when we must base our decision on forecasts of risky cash flows in the distant future. E.g., we might have to design a federal budget and make assumptions about future tax revenues and expected health care costs, without knowing whether the Affordable Care Act is going to be modified, repealed, or left as is. We will revisit these issues in Chapter 15, which addresses the time value of money.
The book’s example of whether to fly or drive to Miami focuses on the cost savings and the value of the time spent driving (the opportunity cost). One could ask a class what other things should be taken into consideration. For example, the analysis omits whether one enjoys hitting the open road in a fast convertible, listening to music, chatting for hours, eating at small town diners, visiting the world’s largest ball of twine and other roadside attractions, etc. The point is that we should identify and count all relevant costs and benefits.
“To an economist, cost-benefit analysis and optimization are the same thing.” It is good to remind students that when we ask them to solve an optimization problem, we are asking them to put themselves in the shoes of an economic actor who will make the best choice in the circumstances by employing the tool of cost-benefit analysis, given the feasible options and real world constraints.
Evidence-Based Economics: What is the cost of using Facebook? A straightforward approximation of the annual opportunity cost of spending one hour per day on Facebook multiplies a reasonable after-tax wage for 16- to 24-year-old students by the number of hours on Facebook per day, and by the number of days in a year:
The authors suggest alternative ways of spending $3,650 and ask whether 365 hours of Facebook is indeed preferable to the alternatives (such as leasing a sports car or taking short trips to Paris and the U S Virgin Islands). To launch an entertaining and useful discussion, one might ask whether students are aware of this cost, what benefits they get from using Facebook, and whether we should use this reasoning to evaluate a daily hour of exercise, reading, or personal hygiene.
“Here’s how we did the calculation.” This is a great example of being upfront with assumptions rather than just waving one’s hands and claiming something is true. A good economist does the math for you! You might not like the answer or the assumptions made, but you can’t argue with the logic.
Straying into the realm of normative economics, ask your students whether they think that they should spend an hour each day on Facebook. Is that a healthier choice than going to the gym? Some research suggests that people are less happy after using Facebook because they are only exposed to the glamorous side of their friends’ lives and they feel pressure to always look and sound good. Then again, there may be social benefits to participating in a social network; one wouldn’t want to feel left out of important ongoing conversations! A useful point to make is that cost-benefit analysis is only as good as the numbers that go into it; if we are systematically underor over-valuing the benefits or costs, then our answer may be misleading. Sure, having an extra $3650 may allow you to lease a sports car, but who will you drive it with if you have no (Facebook) friends?!
1.4 The Second Principle of Economics: Equilibrium
Whereas optimization is about economic agents making self-interested choices in complex environments, equilibrium is the idea that an economy consists of an aggregation of many such agents who are simultaneously optimizing.
The book’s presentation of equilibrium prepares students not only for the equilibrium in a competitive market, but also for the Nash equilibrium covered in Chapter 13. In equilibrium, no single player believes s/he would benefit by changing his or her own behavior, so the economic system reaches a point of stability.
Alternative Teaching Examples: Some modest variations on the example of shoppers picking checkout lines are cars on a tollway queuing up to pay tolls, fans picking turnstiles at a major sporting event, or hungry customers picking lines at all-you-caneat buffet restaurants such as the Golden Corral or Old Country Buffet.
One should go through the three conditions that must be satisfied for there to be equilibrium in the gas market, as this does a great job of establishing price as a rationing mechanism. In particular, one could highlight the fact that as gas prices rise, more and more wells around the world become profitable for producers to operate, whereas higher prices discourage buyers from using gas for low-value activities. In later chapters on supply and demand, the equilibrium price effectively chops off the upper right part of the market supply curve and the lower right part of the market demand curve, thereby eliminating those sellers and buyers who are not willing and able to transact at the going market price.
The Free Rider Problem Given human nature, it would not be a surprise to find situations in which one can enjoy benefits without bearing one’s share of the cost. The authors use lazy roommates (nobody wants to clean up) and turnstile jumpers (who enjoy using the subway without paying) as examples of free riders.
Students are likely familiar with free riders in the context of group projects. The free rider problem is defined and explained further in Chapter 9’s presentation of public goods. One might say that there can be good equilibria and bad equilibria. As the authors point out, if everybody jumped the subway turnstiles (i.e., nobody paid to ride the train), then the subway system would run out of cash. To prevent this from happening, authorities might intervene in a way that alters incentives, such as installing jumper-frustrating turnstiles, patrolling the area, installing security cameras, or otherwise raising the cost of turnstile-jumping.
Teaching Idea: Ask students how they deal with potential free rider problems that could arise when one has roommates, such as doing dishes, taking out the garbage, cleaning the room, etc. Do they have a cleaning schedule? Did they ever sit down with their roommate(s) and discuss these issues? How did their families deal with such issues before college?
1.5 The Third Principle of Economics: Empiricism
Economists gather data and use statistical analysis to evaluate whether economic theories do a good job of explaining and predicting real world human behavior. They also try to understand causality whether one event causes another to occur. This topic is covered well in Chapter 2.
1.6 Is Economics Good for You?
Students who master the principles of economics will be better prepared to make decisions, both large and small.
Teaching Ideas: At the beginning of the term, an instructor could ask a class for specific economic questions they would like to answer. It is surprising how many questions one can address in a term if one classifies them by lecture. For example, gather questions about labor markets, externalities, profit-maximizing firms, etc., and at the beginning or end of the labor market lecture, mention some of these questions and at least sketch out how one would go about answering them.
Here are some situations in which knowing some economics can save (or make) one a lot of money:
o Deciding if/when/where to attend graduate school
o Negotiating a labor contract with a potential employer
o Choosing whether to buy or lease a living space
o Investing for retirement
o Shopping for a loan to buy a vehicle or living space
Students new to economics sometimes cannot see the forest for the trees, so it can be helpful to reassure them that all of these topics in microeconomics are indeed related and can be connected quite nicely with the three themes.
VI. Active Learning Exercises
1. (Trade-offs; Opportunity Cost; Cost-Benefit Analysis) A person in the community calls and asks you to babysit for four hours on Friday night. You know the job will pay $10 per hour. You are currently planning to hang out with your friends on Friday night. If you accept the offer to babysit, what can your friends determine about how much you would have valued the time spent with them?
Solution: If you are willing to accept a job for $10 per hour and we assume you are optimizing, then we can say that you value the time with your friends less than $10 per hour. In other words, the opportunity cost of babysitting is the time you are giving up with your friends, and you must value this at less than $10 per hour or you would turn down the job.
2. (Trade-offs; Opportunity Cost; Cost-Benefit Analysis) Your friend Charles asks you to drive him to the airport. He says that he will reimburse you for the cost of going to the airport. It is a two-hour roundtrip to the airport, and you will use $15 of gas. If Charles pays for the cost of gas, has he paid your full cost of taking him to the airport? What other costs is Charles forgetting?
Solution: The opportunity cost of driving Charles to the airport includes the direct cost of $15 for gas for driving to the airport. However, it also includes the depreciation in the value of the car used to drive to the airport (the car is now worth less with the additional miles) and the value of the best alternative use of the two hours you spent driving. It might have been working a part-time job, studying, or exercising. The opportunity cost of driving Charles to the airport is clearly more than the $15 in gas.
3. (Free rider problem) Professors sometimes assign group work so that students develop their ability to work in teams. In a few sentences, discuss the free-rider problem in the context of group work. Is the problem likely to be more or less significant in a group of students who are close friends when compared to a group of students who do not know each other?
Solution: In group work, students have an incentive to let their peers do the work. The free rider problem is often less of a problem when the students know each other. This would be true if the friends were able to punish each other (if they do not do the work) with social pressure or in future interactions. If the students do not know each other and are not likely to interact in the future, then there may be less social pressure and the students could not punish a free-riding peer if the group will not be seeing the free rider again after the assignment.
4. (Economic Agents; Optimization). Exhibit 1-1 shows some examples of economic agents.
a) Make another list of economic actors representing the future roles you expect to play. For example, you might decide to save for retirement and become an investor.
b) For several of the actors in your list, describe an objective or goal they probably pursue. For example, the investor might try to save enough money in a retirement account that s/he is able to retire comfortably.
c) For some of these actors and objectives, describe a fundamental choice they make. For example, the investor might decide how to allocate these dollars across stocks, bonds, real estate, gold, and other assets.
d) For some of these actors, objectives, and choices, describe some of the most important real-world constraints the actor faces. For example, the investor might face a limited set of investment vehicles (assets), a fixed number of dollars to invest, a certain number of years before retirement, and laws about reporting investment income for taxes.
Solutions:
a) Actors: This exercise encourages students to think of economics as being broadly useful any time choices are made. Lists probably include some of the following: grocery shopper, job-hunter, taxpayer, voter, investor, parent, producer/worker/employee, entrepreneur, debater, house- or car-buyer, bill-payer, manager/employer, neighbor, student, teacher, philanthropist, civil servant, juror, advisor/consultant, adaptor to technological change, significant other/spouse/partner, or athlete/coach.
b) Objectives: These will vary considerably, but one can show that decisions are often complex because preferences may involve trade-offs. E.g., a job-hunter tries to find the best job, thinking about compensation (wage, salary, benefits), working conditions (collegiality, danger, good match for skills, business hours vs. weekends or nights), opportunities for professional advancement (mentors, training, development), location (short commute, work from home, required travel), etc.
c) Choices: A grocery shopper who wants to feed his/her family must choose what items to put into the shopping, knowing that foods vary in terms of price, nutrition (does it contain fat, sugar, carbs, allergens, or controversial ingredients?), ease and speed of preparation, texture, etc. The teaching goal is think about what matters are exogenous (given), and which are endogenous (chosen).
d) Constraints: We face numerous real-world constraints. A basketball coach deciding which players to have on the court must be aware of rules (must have exactly five players on the court and cannot use players who have amassed too many fouls) and the players’ well being (are they healthy, rested, and in a good mindset?).
5. (Real-world optimization) Describe how you make these decisions:
a) What to wear today
b) Whether to go out tonight
c) Which flight to book in anticipation of traveling home during break
d) Choosing whether to drive or fly to spring break (see page 10)
Solutions: These decisions may involve numerous pros and cons.
a) The choice of clothing depends on the weather (it is hot, cold, windy or rainy?), your clothing availability (have you done your laundry recently?), today’s activities (do you have Pilates or a spinning class later?), other clothing you plan to wear today (do the pieces complement each other?), what you wore recently (am I the “blue shirt guy”?!), whether today is a holiday (Leap Day?), etc.
b) Can you afford to go out tonight? Do you have sufficient time, energy, and money? Do you have exams to study for or papers to write? Will an outing be good for morale, relaxation, socializing, or making connections? Are you conducting a market analysis of local restaurants?
c) Your preferences probably include something about airlines, time of the flight, number of stops, total travel time, the window/aisle/middle seat, whether you need to pay for bags, and the quality of service. There will be a number of trade-offs you will consider; how much more are you willing to pay for a first-class ticket on a non-stop flight at an ideal time?
d) The textbook emphasizes the value of the additional time you would spend driving. Other downsides to driving include the cost of gasoline, wear and tear on the vehicle, the dangers of driving, and the fatigue that comes with many hours on the road. You also cause a bit of congestion for other drivers and impact the environment. But there may be some upsides: you might also have a new vehicle that you are excited to drive, you want to take selfies at odd roadside attractions, or want to spend many hours singing along to songs and bonding with your road trip-mates.
6. (Opportunity Costs; Trade-offs) Describe the costs of making the following choices. Be sure to remember not only explicit costs, but also implicit (opportunity) costs!
a) Attending Lollapalooza, a weekend music festival
b) Taking a principles of economics course
c) Studying abroad in Europe for a term
d) Accepting a job as White House Press Secretary
Solutions:
a) Buy tickets and ear plugs, arrange for transportation and accommodations, forgo work or several days of best alternative plans
b) Pay tuition, buy textbook, forgo the best other course you could have taken instead
c) Explicit costs include travel, room, board, tuition and books; opportunity cost is a forgone term at your usual college (and all of the activities back home that you will miss)
d) You will have to incur the costs of moving to Washington, buying some press-friendly attire, taking a crash course in public speaking, and missing out on that best other gig, whether it is farming in Iowa, singing in Nashville, trading on Wall Street, acting in Hollywood, coding in Silicon Valley, fracking in North Dakota, or staying in college.
CHAPTER W1
Financial Decision Making
I. Key Ideas
The process that determines how an investment grows over time is referred to as compound returns.
If returns are risky, as they are for stock investments, it is important to consider the probability of good returns and bad returns.
Diversification spreading one’s investments across many assets reduces the risks associated with investments.
Investors save in many different types of investment accounts: bank accounts, brokerage accounts, mutual funds, and retirement savings plans.
II. Getting Started
A. The Big Picture
Students who will start working and receiving income after they graduate should be especially interested in this chapter. As they start collecting a salary and making choices related to consumption and saving, they should understand concepts related to the power of compounding, risk associated with investments, the different types of assets, diversification, and other topics related to saving for their retirement. The goal is to educate students who are not majoring in economics and/or finance on money matters, in order to help them make better financial decisions in the future.
Where We’ve Been
The previous chapters of this textbook covered standard topics in microeconomics and macroeconomics. This chapter introduces a “special topic”: how to better make financial decisions.
Where We’re Going
The last two chapters will introduce two additional special topics one on the economics of life, health, and the environment, and one on political economy.
B. Number of Lectures
Instructors are advised to spend one 50-minute lecture on this chapter. Here’s a suggested breakdown of the lecture:
Provide a general overview of the chapter the big picture [5 mins.]
Using numerical examples, explain how asset values grow through compounding [10 mins.]
Spend the next few minutes on securities and the difference between stocks (or equity) and bonds [5 mins.]
Explain how to use percentiles to identify the risk associated with investment [5 mins.]
Explain the benefits from diversification in investment. [5 mins.]
Describe the different investment accounts [15 mins.]
Finally, discuss the EBE and link it to the opening question [5 mins.]
C. Opening Question and Evidence-Based Economics
“Do investors chase historical returns?” Using the example of Enron is a good choice because it captures the potential perils of lack of diversification and the risk associated with return chasing.
III. Chapter Outline
W1.1 Investment Returns
Let’s remind our students that when people save, they postpone consumption. They do so to enjoy more consumption in the future, because the money they save today grows at a rate that depends on the interest rate they receive.
How Money Grows The process by which the value of an investment grows over time is referred to as compounding. Compound returns are generated when short-term returns are reinvested, producing returns on both the initial investment and on later investment returns. To see how, we first choose a principal amount, which is the value of the initial investment). Then, we identify the rate of return on the investment, r, and we use the following formula: Final value = principal amount (1 + r)T ,
where T is known as the holding period the time interval, usually measured in years, between the initial investment and the final withdrawal.
Alternative Teaching Example: Let’s find the final value of a principal amount of $500 growing at an annual rate of return of 8%. Let’s find the final value after each year.
Final value after 1st year = $500 × (1 + 0.08) = $540
Final value after 2nd year = $500 × (1 + 0.08)2 = $583.2
Final value after 3rd year = $500 × (1 + 0.08)3 = $629.86
Final value after 4th year = $500 × (1 + 0.08)4 = $680.24
Final value after 5th year = $500 × (1 + 0.08)5 = $734.66
Final value after 30th year = $500 × (1 + 0.08)30 = $5,031.33
Notice that in the calculations above, two complications are ignored. First, rising prices, or inflation, may erode the purchasing power of the final value. We held inflation constant in the example. To adjust for inflation, we could subtract the rate of inflation from the rate of return r to arrive at the real rate of return. For example, if the inflation rate is 3%, then the real rate of return is approximately 8% – 3% = 5%. In this case, the final value after the 30th year is $500 × (1 + 0.5)30 = $2,160.97 (as compared to $5,031.33 without adjusting for inflation). That is, the final value $5,031.33 has the same purchasing power that $2160.97 had at the time of the initial investment. The second factor that we ignored was risk, which exists when an outcome is not known with certainty in advance. In our example, we assumed that an investor receives a constant rate of return of 8% throughout the life of the investment that’s to say, without any risk that the return in some years might be lower (or higher). In real life, the return on most investments varies considerably in some years there are high real returns and in other years there are low real returns. There is more discussion of risk later on in this chapter.
Securities There are different types of financial investments. They are generally called securities, and they can take the form of bonds, stocks, or other financial claims. Some of these securities are short-term in nature and others are long-term. Short-term loans that individuals extend to the government (buying Treasury bills, for example) or to a highly secured corporation (like GE or GM) are practically risk-free and have low rates of return (knows as commercial papers). Bonds, on the other hand, are long-term loans made to a borrower (debtor) by a lender (creditor). Borrowers are obligated to pay bondholders a certain value at the end of a predetermined period, and to make periodic interest payments to bondholders. Finally, investing in stock is fundamentally different from investing in bonds. While the latter are loans that investors make to the government or to corporations, investing in a corporation’s stock (also known as investing in its equity) gives the investors ownership rights in the corporation.
Stocks are riskier than bonds. To see this, suppose a company sells bonds and shares of stock to investors. If the company’s business weakens and its earnings plummet, it is contractually obligated to first pay returns to its bondholders; then if there is remaining income the stockholders receive a return on their investment. In other words, if a company declares bankruptcy, first it must pay its bondholders in full, and then it pays its stockholders if there is additional income is available for distribution. But with risk come higher average returns. If a company’s business is doing well, its shareholders earn higher rates of return than its bondholders.
W1.2RiskyReturns
The simulations in this part of the chapter illustrate the concept of risks associated with investments. The simulations are done on stock market returns, showing how it is often the case that returns on stocks go through runs of good returns and runs of bad returns. Just as with tossing a coin many times (say, 50), there will be times when heads come up several times in a row, times
when tails come up several times in a row, and times when heads and tails alternate. Exhibit W1.2 illustrates the results of such a simulation.
Exhibit W1.4 shows the results of 1,000 simulations of a $1 initial stock investment held for 50 years. Each simulation represents different year-by-year stock returns, under assumptions based on actual historical data from the U.S. stock market. The worst result shows a final balance of $1.10 after 50 years, and the best result shows a final balance of $2,151. The average of the 1,000 final balances is $117. As Exhibit W1.4 shows, however, there is a very wide range of possibilities, in terms of returns over 50 years. Is there an easier way to look at these possible returns?
Percentiles One way to look at the different possibilities is to calculate the Nth percentile, which is a cutoff that divides the data so that the N% of the data is below the cutoff and (100– N)% of the data is above the cutoff.
Exhibit W1.5 illustrates percentiles of a final balance from a 50-year holding period of a $1 initial investment. For example, according to the simulation, what are the chances of turning a $1 investment into $169 after 50 years? Based on the exhibit, there is a 75% chance that a person will turn a $1 investment into less than $169, and 25% chance to turn the $1 into more than $169 after a 50-year holding period.
Alternative Teaching Example: Since this is a principles class, students should remember what they scored on their SATs. For example, a student who scored 700 in math is in the 93rd percentile, meaning that 93% of students who took the exam earned a lower score than her. Instructors can use more SAT percentile ranks here: http://media.collegeboard.com/digitalServices/pdf/research/SAT-Percentile-Ranks-2012.pdf
Risk Associated with Individual Stocks Why do financial consultants advise their clients not to “put all of their eggs in one basket”? Diversification is discussed in more detail next, but the short answer to the question is because it’s a lot more risky to invest in an individual stock than it is to invest in, say, a composite index like the S&P 500 index, which consists of packages of shares of the stocks of the 500 largest U.S. companies. If one company goes bankrupt, the equity owned by its stockholders will most likely be completely wiped out. How often do companies declare bankruptcy? The answer is: more often than the average person thinks they do. Big companies like Enron, Lehman Brothers, GM, Delta Airlines, and United Airlines have declared bankruptcy in recent years. Some of them were able to reorganize the company and survive (e.g., Delta Airlines, GM, and United Airlines), but others couldn’t (e.g., Enron and Lehman Brothers).
Exhibit W1.6(a) illustrates how volatile the stock market in general can be. Looking at the S&P 500 index over the last 80 years, we see that annual nominal returns in the U.S. stock market have been highly variable and largely unpredictable. If the index comprised of stocks of the largest 500 companies shows such volatility, can you imagine the volatility of a single stock?!
W1.3 Diversification
Alternative Teaching Example: Brokerage firms, like Merrill Lynch (ML), manage the assets of their clients. When an ML financial advisor selects an appropriate investment strategy for a client, he/she first determines the risk level that the client can tolerate. For example, a younger client may tolerate more risk than an older client who is about toretire. Based on age (and other considerations, of course), the financial advisor may suggest a more aggressive
investment strategy to the younger client and a more conservative one to the older client. An aggressive investment strategy typically includes investing in a mutual fund that has 80% stocks, 15% bonds, and a 5% cash account. A conservative mutual fund typically includes 55% bonds, 20% stocks, and a 25% cash account. Regardless of how aggressive or conservative an investment strategy is, a financial advisor will never suggest that a client invests in stocks only. Why? Because the financial advisor understands very well the benefit of diversifying, and the risk associated with investing only in stocks.
The textbook uses a wonderful example on how diversification reduces risk by spreading an investment across more than one asset. The idea here is that individual assets are hit by different economic shocks. For example, a significant decrease in the world oil price may have a positive impact on the automobile industry and a negative impact on the oil industry in the United States. Such a shock may therefore have different impacts on the values of stocks of companies in both industries. Moreover, the positive impact on the stocks of automobile companies may vary across the companies (GM’s stock may increase by 10%, whereas Ford’s stock may only increase by 2%). Likewise, the negative impact on companies in the oil industry may vary as well. In such cases, diversification reduces an investor’s exposure to shocks and reduces (but does not eliminate) the risk associated with investment.
Exhibit W1.8 is a great example of why we should diversify. It shows the results of simulating two investment strategies investing $1 in a single stock (right column), or investing $1 in a stock index consisting of thousands of stocks (left column). Clearly, it’s a lot more risky to invest in a single stock. For example, if you invest in a single stock, there is a 25% chance that you will end up with less than your $1 investment after holding the stock for 50 years. If you invest in a stock index, there is almost no chance that you will end up with less than your initial investment after 50 years. In fact, the simulation shows that there is a 99% chance of receiving at least $5.52 if you choose a diversified investment strategy.
W1.4 Investment Accounts
There are several different types of investment accounts in which households can hold their securities (stocks and bonds). The following is a list of these accounts and a brief description of each.
Bank Accounts These are very safe accounts; they include checking accounts, savings accounts, money market deposit accounts, and certificates of deposit (CDs). The advantage of these accounts is that they are fully insured by the FDIC that is, in case your bank fails, you can recover 100% of the money that you deposited, up to $250,000 (or $500,000 for a married couple). The disadvantage is that they pay a very low interest rate because they are almost riskfree.
Brokerage Accounts These accounts are offered by investment management firms, not banks. Examples of these firms include Fidelity and Vanguard. The disadvantage of brokerage accounts is that they are not insured by the FDIC (except for those that are affiliated with or owned by a bank, like Merrill Lynch). In principle, an investors can lose all of his or her investments in a brokerage account.
Mutual Funds A mutual fund starts with a pool of money that is collected from many investors, which is then invested in hundreds of stocks, bonds, and/or short-term money market instruments. Mutual funds are managed by investment professionals who charge fees for managing them. Some mutual funds are passively managed, meaning the fund manager tracks the returns of a specific index, like the S&P 500 stock index. Other mutual funds are actively managed, meaning the fund manager buys and sells assets frequently in an attempt to outperform the competition. Investors pay fees to the managers of mutual funds, with managers who actively manage investors’ portfolios charging more than those who passively manage. As Choice and Consequence: Overlooking Fees demonstrates, the lowest fees in the industry (also known as expense ratios) are 0.05%. Fees above 1% are considered to be too high. Although the difference between 1% and 2% fees may not seem large, the impact on the returns of a mutual fund is substantial, particularly if the holding period is relatively long.
Retirement Savings Plans
These plans can be organized in four categories.
Social Security: Each worker pays a payroll tax of 6.2% of his/her income (up to a cap of $117,000/year), and the employer matches that with another 6.2%. A total of 12.4% of each worker’s salary, up to the cap, goes into the Social Security Trust Fund every year. This fund is controlled by the U.S. government, andthe money paid into it is used to pay benefits to people who are currently retired. A household consisting of two earners with a combined income of $20,000 receives 87% of that income when they retire. On the other hand, a twoearner household with a combined income of $150,000 receives only 35% of their income when they both retire. These percentages are called replacement ratios. Exhibit W1.10 gives a more detailed list of replacement ratios. A household continues to receive retirement income until both members die. When the first member of a household dies, the surviving member receives reduced social security benefits.
Defined Benefit Pensions: These are contractual obligations under which employers promise to pay retirement benefits for employees in the form of a fixed annuity. The amount of the annuity depends on the number of years of service and the final salary that a worker earned. For example, a typical fixed annuity is calculated by the following formula: 2% x (number of years of service) x (final salary). These types of benefits are relatively safe. Even if a company goes bankrupt, the pension plans are insured by the government. State and local government employees are even more secure because it’s very rare for a government (whether state or local) to go bankrupt.
Defined Contribution Pensions: These are individual investment accounts that are owned and controlled by employees. An example of these pension accounts is 401(k) accounts. Under defined contribution pensions, an employee contributes a certain percentage of her income (5% to 10%), and the employer matches these contributions. Typically, an employer contributes $0.5 for every dollar an employee contributes, up to 6% of the employee’s income. Unlike social security, these contributions are done on a voluntary basis. Also, employees contributing to these accounts own and control their accounts they decide how much to invest, and they are free to choose from a list of approved mutual funds approved by their employers. The amount of the benefits in these accounts depends on the performance of the selected mutual funds.
Individual Retirement Accounts (IRAs): These are straightforward savings accounts that are used predominantly for retirement. They are voluntarily established by individuals, who have full control over them. These accounts are particularly attractive to workers who don’t contribute to defined contribution pensions, or those who work in firms that don’t offer savings plans to their employees.
How Easy Is It to Beat the Market? There are around 10,000 mutual funds in the United States alone. These funds are managed by managers who claim they can outperform the market every year. The truth of the matter is that only very few active managers are able to reliably outperform the stock market. Sure, some managers may beat the market in a given year, or maybe for two or three years in a row, but it is often the case that their odds of beating the market are the same as your odds of getting a “head” when you toss a coin a 50% chance. But over a long period of time, say 10 years, several thousand mutual funds will beat the stock market more than half the time, even though they don’t beat it every year. Thus, when we look at a 10-year performance, we see impressive winnings of many mutual funds that didn’t necessarily win in every single year. The key question here is whether the 10-year historical performance of a certain mutual fund is a strong predictor of its performance over the next 10 years. Economists find that successful historical asset managers tend to perform no better in the next 10-year period than pure chance would predict.
Evidence-Based Economics: Do investors chase historical returns? The answer to the opening question is yes, investors do tend to chase historical returns. Why did Enron employees invest 62% of their retirement savings in Enron stock rather than diversifying? It’s because Enron’s stock rose 1,000% during the 10-year period prior to the company’s total collapse, as Exhibit W1.11 shows. The fact that investors chase historical returns was demonstrated in a study that was done by economist Shlomo Benartzi. Studying employees’ retirement fund contribution decisions in 154 of the largest companies in the United States, Benartzi found that there was a positive correlation between a company’s historical returns and the percentage of retirement savings that its employees chose to contribute to employer stocks. From the sample of companies selected, the study also found that return chasing didn’t benefit employees.
IV. Active Learning Exercises
1. Excel-based Activity This activity asks students to use the Excel function “FV” to discover the time value of money and how compounding works. The input values that are necessary are 1) the initial investment, 2) the yearly payments, 3) the rate of return or interest rate, and 4) the number of periods. Due to the way Excel accepts inputs, the initial investment and the monthly additions must be entered as negative numbers.
Activity: Using the FV function in Excel, determine the final value of
A. an initial investment of $1,000 and 20 monthly payments of $100 when you expect to earn a rate of return of 8%. Also, show how much total money is being invested.
B. an initial investment of $1,000 and 10 monthly payments of $200 when you expect to earn a rate of return of 8%. Also, show how much total money is being invested.
C. Compare the total investment returns and the total invested for parts (a) and (b). What causes this difference?
Solution: Correct input of cells
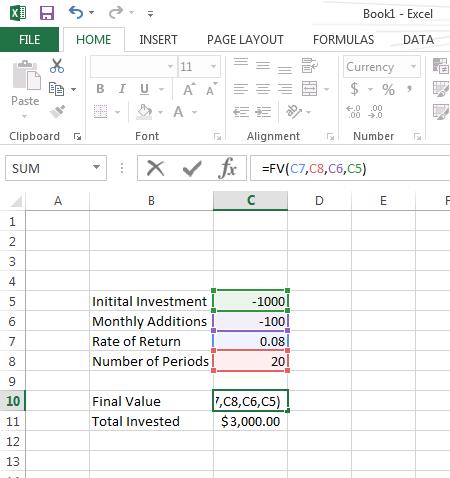
A.
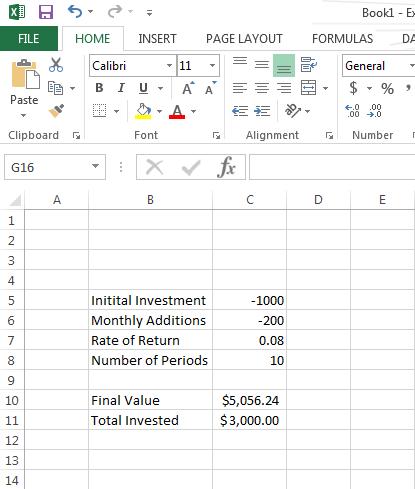
C. The difference in returns is nearly $4,000, even though exactly the same amount is invested in each scenario. The difference shows the power of compounding. Even though the monthly payments are greater in Part B than in Part A ($200 compared to $100), Part A results in nearly $4,000 more because the number of periods is twice that of Part B.
2. Exploration Activity Ask students to find and research three investment companies that offer access to index funds and mutual funds. Have students describe the differences in the fees and expense ratios associated with each company/type of fund.
Sample Solution: Students could discuss Vanguard, iShares, etc. Students will find that index funds often have much lower fees because they do not need to be actively managed.