Chapter 1
Graphs and Functions
Section 1.1
1. 0
2. 5388
3. 22 34255
4. 222 11601213600372161
Since the sum of the squares of two of the sides of the triangle equals the square of the third side, the triangle is a right triangle.
5. 1 2 bh
6. true
7. x-coordinate or abscissa; y-coordinate or ordinate
8. quadrants
9. midpoint
10. False; the distance between two points is never negative.
11. False; points that lie in quadrant IV will have a positive x-coordinate and a negative y-coordinate. The point 1,4 lies in quadrant II.
12. True; 1212 , 22 Mxxyy
13. b
14. a
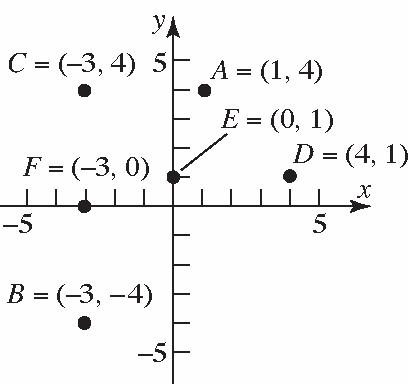
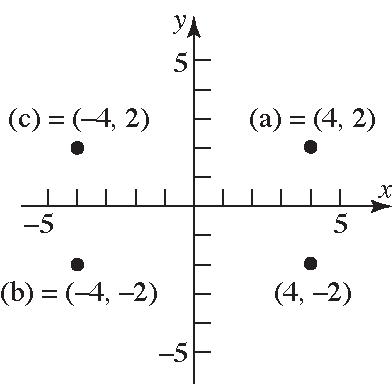
15. (a) Quadrant II
(b) x-axis
(c) Quadrant III
(d) Quadrant I
(e) y-axis
(f) Quadrant IV
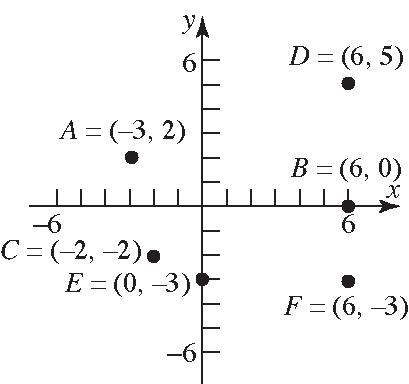
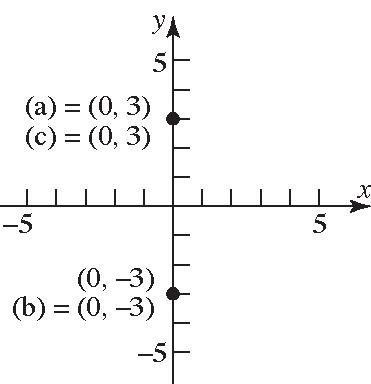
16. (a) Quadrant I
(b) Quadrant III
(c) Quadrant II
(d) Quadrant I
(e) y-axis
(f) x-axis
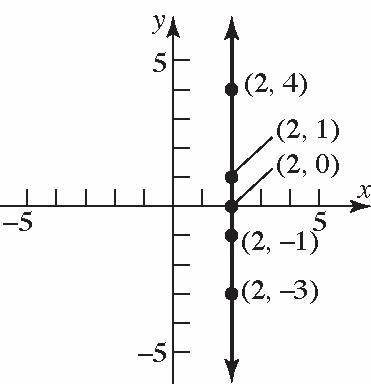
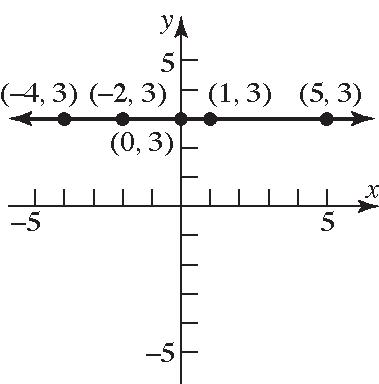
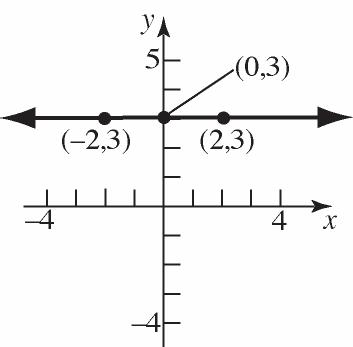
17. The points will be on a vertical line that is two units to the right of the y-axis.
Graphs and Functions
18. The points will be on a horizontal line that is three units above the x-axis.
dPP
19. 22 12 22 (,)(20)(10) 21415
dPP
20. 22 12 22 (,)(20)(10) (2)1415
dPP
21. 22 12 22 (,)(21)(21) (3)19110
dPP
22. 2 2 12 22 (,)2(1)(21) 319110
23.
dPP
2 12 2 2 (,)(53)44 2846468217
dPP
24.
2 2 12 2 2 (,)2140 34916255
dPP
25. 2 2 12 22 (,)4(7)(03) 11(3)1219130
26. 22 12 22 (,)422(3) 2542529 dPP
dPP
27. 2 2 12 22 (,)(65)1(2) 131910
28. 22 12 22 (,)6(4)2(3) 10510025 12555 dPP
dPP
29. 22 12 22 (,)2.3(0.2)1.1(0.3) 2.50.86.250.64 6.892.62
dPP
30. 22 12 22 (,)0.31.21.12.3 (1.5)(1.2)2.251.44 3.691.92
31. 22 12 2222 (,)(0)(0) ()() dPPab abab
32. 22 12 22 222 (,)(0)(0) ()() 22 dPPaa aa aaaa
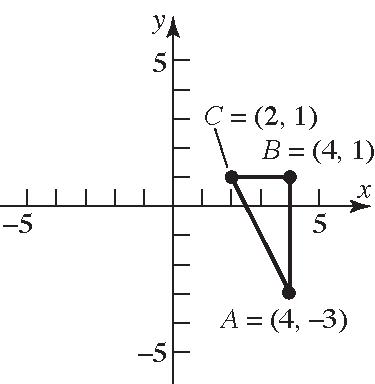
33. (2,5),(1,3),(1,0)ABC
dAB dBC dAC
2 2 22 2 2 22 2 2 22 (,)1(2)(35) 3(2)9413 (,)11(03) (2)(3)4913 (,)1(2)(05) 1(5)12526
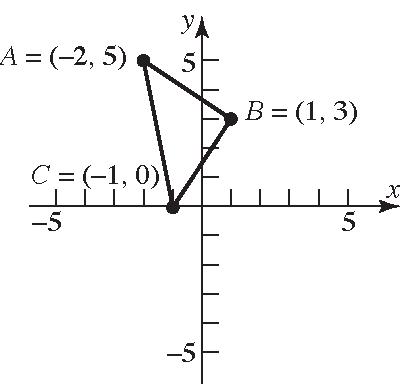
Verifying that ∆ ABC is a right triangle by the Pythagorean Theorem:
The area of a triangle is 1 2 Abh . In this problem,
(,)10(2)(115) 12(16) 144256400 20 dAB dBC dAC
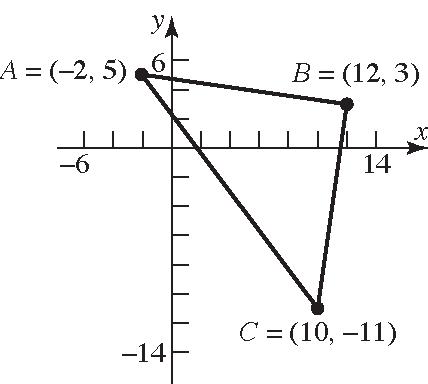
Verifying that ∆ ABC is a right triangle by the Pythagorean Theorem:
Section1.1: The Distance and Midpoint Formulas
222 22 2 (,)(,)(,) 10210220 200200400 400400 dABdBCdAC
The area of a triangle is 1 2 Abh . In this problem,
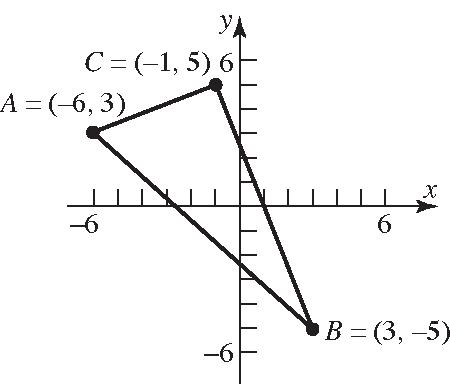
35. (5,3),(6,0),(5,5)ABC
2 2 22 2 2 22 2 2 22 (,)6(5)(03) 11(3)1219 130 (,)56(50) (1)5125 26 (,)5(5)(53) 1021004 104 226 dAB dBC dAC
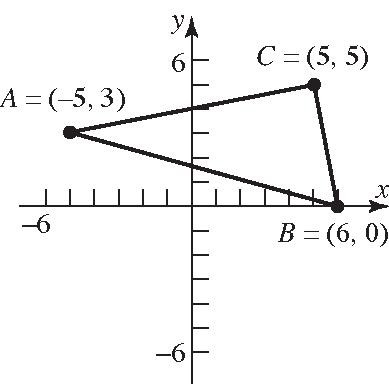
Verifying that ∆ ABC is a right triangle by the Pythagorean Theorem:
Graphs and Functions
The area of a triangle is 1 2 Abh . In this problem,
dAB dBC dAC
(,)3(6)(53) 9(8)8164 145 (,)13(5(5)) (4)1016100 116229 (,)1(6)(53) 52254 29
Verifying that ∆ ABC is a right triangle by the Pythagorean Theorem:
222 222 (,)(,)(,) 29229145 29429145 29116145 145145 dACdBCdAB
The area of a triangle is 1 2 Abh . In this problem,
AdACdBC
1 (,)(,) 2 1 29229 2 1 229 2 29 square units
37. (4,3),(0,3),(4,2)ABC
2 2 22 22 22 2 2 22 (,)(04)3(3) (4)0160 16 4 (,)402(3) 451625 41 (,)(44)2(3) 05025 25 5 dAB dBC dAC
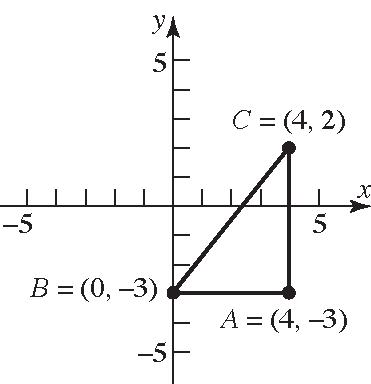
Verifying that ∆ ABC is a right triangle by the Pythagorean Theorem:
The
Verifying that ∆ ABC is a right triangle by the Pythagorean Theorem:
Section1.1: The Distance and Midpoint Formulas
4225 16420 2020 dABdBCdAC
The area of a triangle is 1 2 Abh . In this problem, 1 (,)(,) 2 1
39. The coordinates of the midpoint are: (,),1212 22 44 35 , 22 80 , 22 (4,0)
xxyy xy
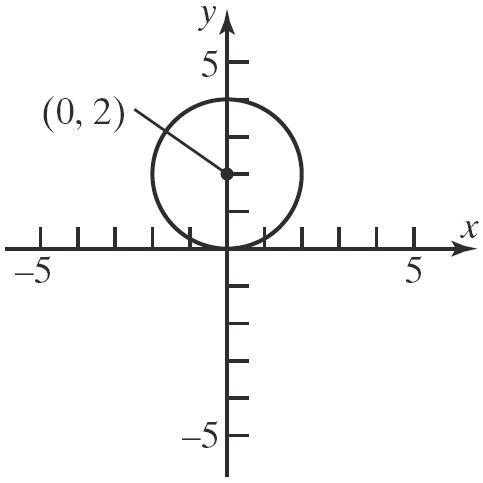
40. The coordinates of the midpoint are: (,),1212 22 2204 , 22 04 , 22 0,2 xxyy xy
41. The coordinates of the midpoint are: (,),1212 22 1840 , 22 74 , 22 7 ,2 2
xxyy xy
42. The coordinates of the midpoint are: (,),1212 22 2432 , 22 61 , 22 1 3, 2 xxyy xy
43. The coordinates of the midpoint are: (,),1212 22 7951 , 22 4 16 , 22 (8,2)
xxyy xy
44. The coordinates of the midpoint are: (,),1212 22 42 32 , 22 21 , 22 1 1, 2 xxyy xy
45. The coordinates of the midpoint are: (,),1212 22 00 , 22 , 22 xxyy xy ab ab
46. The coordinates of the midpoint are: (,),1212 22 00 , 22 , 22 xxyy xy
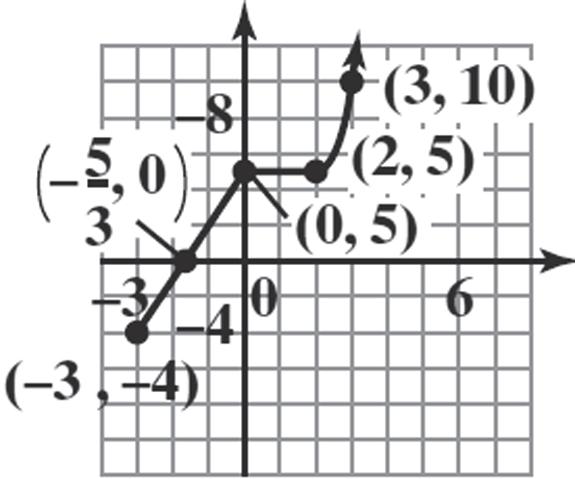
47. The x coordinate would be 235 and the y coordinate would be 523 . Thus the new point would be 5,3
48. The new x coordinate would be 123 and the new y coordinate would be 6410 . Thus the new point would be 3,10
49. a. If we use a right triangle to solve the problem, we know the hypotenuse is 13 units in length. One of the legs of the triangle will be 2+3=5. Thus the other leg will be: 222 2 2 513 25169 144 12 b b b b
Thus the coordinates will have an y value of 11213 and 11211 . So the points are 3,11 and 3,13 .
b. Consider points of the form 3, y that are a distance of 13 units from the point 2,1 .
22 2121 22 22 2 2 3(2)1 51 2512 226 dxxyy y y yy yy
2 2 22 2 2 13226 13226 169226 02143 01113 yy yy yy yy yy
110 11 y y or 130 13 y y
Thus, the points 3,11 and 3,13 are a distance of 13 units from the point 2,1
50. a. If we use a right triangle to solve the problem, we know the hypotenuse is 17 units in length. One of the legs of the triangle will be 2+6=8. Thus the other leg will be:
Thus the coordinates will have an x value of 11514 and 11516 . So the points are 14,6 and 16,6 .
b. Consider points of the form ,6 x that are a distance of 17 units from the point 1,2
2 2 22 2 2 17265 17265 289265 02224 01416 xx xx xx xx xx
140 14 x x or 160 16 x x Thus, the points 14,6 and 16,6 are a distance of 13 units from the point 1,2
51. Points on the x-axis have a y-coordinate of 0. Thus, we consider points of the form ,0x that are a distance of 6 units from the point 4,3
22 2121 22 2 2 2 2 430 1683 1689 825 dxxyy x xx xx xx
2 2 22 2 2 2 6825 6825 36825 0811 (8)(8)4(1)(11) 2(1) 864448108 22 863 433 2 xx xx xx xx x
433 x or 433 x
Thus, the points 433,0 and 433,0 are on the x-axis and a distance of 6 units from the point 4,3 .
52. Points on the y-axis have an x-coordinate of 0. Thus, we consider points of the form 0, y that are a distance of 6 units from the point 4,3
22 2121 22 22 2 2 403 496 1696 625 dxxyy y yy yy yy
y or 325 y
Thus, the points 0,325 and 0,325 are on the y-axis and a distance of 6 units from the point 4,3
53. a. To shift 3 units left and 4 units down, we subtract 3 from the x-coordinate and subtract 4 from the y-coordinate.
23,541,1
b. To shift left 2 units and up 8 units, we subtract 2 from the x-coordinate and add 8 to the y-coordinate.
22,580,13
54. Let the coordinates of point B be , xy . Using the midpoint formula, we can write
18 2,3, 22 xy
This leads to two equations we can solve.
Point B has coordinates 5,2 .
55. 1212 ,,22 Mxyxxyy
and (,)(1,4) xy , so
Thus, 1 (3,6) P .
57. The midpoint of AB is:
The midpoint of AC is:
The midpoint of BC is:
6404 , 22 5,2 F
dCD 2 2 22 (,)26(20) (4)2164 2025 dBE 22 22 (,)(20)(50) 25425 29 dAF
2 2 22 (,)04(34) (4)(1)16117
58. Let 12(0,0),(0,4),(,) PPPxy
22 12 22 1 22 22 22 2 22 22 ,(00)(40) 164 ,(0)(0) 4 16 ,(0)(4) (4)4 (4)16 dPP dPPxy xy xy dPPxy xy xy
Two triangles are possible. The third vertex is
23,2 or 23,2
59. 22 12 22 (,)(42)(11) (6)0 36 6 dPP
2 2 23 22 (,)4(4)(31) 0(4) 16 4 dPP
22 13 22 (,)(42)(31) (6)(4) 3616 52 213
Since 22 2 122313 (,)(,)(,) dPPdPPdPP , the triangle is a right triangle.
Section1.1: The Distance and Midpoint Formulas
60. 2 2 12 22 (,)6(1)(24) 7(2) 494
53 dPP 2 2 23 22 (,)46(52) (2)(7) 449
53 dPP 2 2 13 22 (,)4(1)(54) 5(9) 2581
106 dPP
Since 22 2 122313 (,)(,)(,) dPPdPPdPP , the triangle is a right triangle. Since 1223 ,, dPPdPP , the triangle is isosceles. Therefore, the triangle is an isosceles right triangle.
61. 22 12 22 (,)0(2)7(1) 2846468 217 dPP
2 2 23 22 (,)30(27) 3(5)925 34 dPP
22 13 22 (,)3(2)2(1) 53259 34 dPP
Since 2313 (,)(,) dPPdPP , the triangle is isosceles.
Since 22 2 132312 (,)(,)(,) dPPdPPdPP , the triangle is also a right triangle. Therefore, the triangle is an isosceles right triangle.
dPP
62. 22 12 22 (,)4702 (11)(2) 1214125
2 2 23 22 (,)4(4)(60) 866436
22 13 22 (,)4762 (3)4916 25 5 dPP
Since 22 2 132312 (,)(,)(,) dPPdPPdPP , the triangle is a right triangle.
63. Using the Pythagorean Theorem: 222 2 2 9090 81008100 16200 16200902127.28 feet d d d
64. Using the Pythagorean Theorem: 222 22 6060 360036007200 720060284.85 feet d dd d
65. a. First: (90, 0), Second: (90, 90), Third: (0, 90) (0,0) (0,90) (90,0) (90,90) X Y
b. Using the distance formula: 22 22 (31090)(1590) 220(75)54025 52161232.43 feet d
c. Using the distance formula: 22 22 (3000)(30090) 300210134100 30149366.20 feet
66. a. First: (60, 0), Second: (60, 60) Third: (0, 60) (0,0) (0,60) (60,0) (60,60) x y
b. Using the distance formula: 22 22 (18060)(2060) 120(40)16000 4010126.49 feet d
c. Using the distance formula: 22 22 (2200)(22060) 22016074000 20185272.03 feet
67. The Focus heading east moves a distance 60t after t hours. The truck heading south moves a distance 40t after t hours. Their distance apart after t hours is:
68. 15 miles5280 ft1 hr 22 ft/sec 1 hr1 mile3600 sec
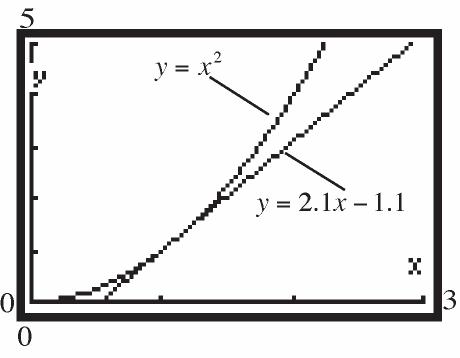
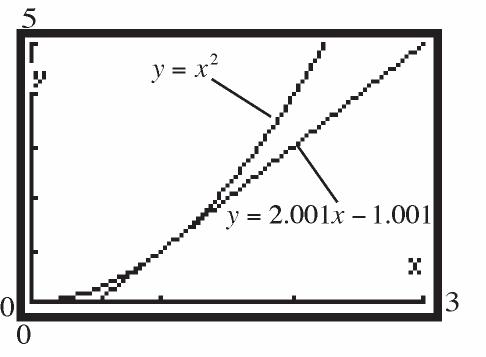
69. a. The shortest side is between 1 (2.6,1.5) P and 2 (2.7,1.7) P . The estimate for the desired intersection point is:
b. Using the distance formula: 22 22 (2.651.4)(1.61.3) (1.25)(0.3)
70. Let 1 (2013,102.87) P and 2 (2017,126.17) P . The midpoint is:
1212 ,,22 20132017102.87126.17 , 22 4030229.04 , 22 2015,114.52
The estimate for 2010 is $114.52 billion. The estimate net sales of Costco Wholesale Corporation in 2015 is $0.85 billion off from the reported value of $113.67 billion.
71. For 2009 we have the ordered pair 2009,21756 and for 2017 we have the ordered pair 2017,24858 . The midpoint is 200920172175624858 year, $,22 402646614 , 22 2013,23307
Using the midpoint, we estimate the poverty level in 2013 to be $23,307. This is lower than the actual value.
72. Let 1 0,0 P , 2 ,0 Pa , and 3 3 ,
Since the lengths of the three sides are all equal, the triangle is an equilateral triangle. The midpoints of the saids are
Since the lengths of the sides of the triangle formed by the midpoints are all equal, the triangle is equilateral.
73. Let 1 0,0 P , 2 0, Ps , 3 ,0 Ps , and 4 , Pss be the vertices of the square.
(0, ) s (0, 0) (, 0) s (, ) ss
PP ssss M
The points 1P and 4P are endpoints of one diagonal and the points 2P and 3P are the endpoints of the other diagonal. 14 00 ,, 2222
23 00 ,, 2222
PP ssss M
The midpoints of the diagonals are the same. Therefore, the diagonals of a square intersect at their midpoints.
74. Let ,2 Paa . Then
2222 2222 22 521424 521424 56265832 626832 26 3
Then (3,6) P .
75. Arrange the parallelogram on the coordinate plane so that the vertices are 1234 0,0,(,0),(,) and (,) PPaPabcPbc
Then the lengths of the sides are: 22 12 2 (,)000 dPPa aa 2 2 23 22 (,)()0 dPPabac bc y x
dPPbabcc aa and 22 14 22 (,)00 dPPbc bc
2 2 34 2 (,)()
13 and PP are the endpoints of one diagonal, and 24 and PP are the endpoints of the other diagonal. The lengths of the diagonals are 2 2 13 222 (,)()00 2
Section1.2: Graphs of Equations in Two Variables; Circles
3. intercepts
4. y-axis 5 3,4
6. True
7. False 8. radius
9. True; 2 93rr 10. d
11. False; the center of the circle 22 3213xy
dPPabc aabbc and 2 2 24 222 (,)()0 2
dPPbac aabbc
The point (0, 0) is on the graph of the equation.
Sum of the squares of the sides: 22222222 222 ()() 222
abcabc abc
Sum of the squares of the diagonals:
aabbcaabbc abc
22 222222 222 22 222
76. Answers will vary.
Section 1.2
1. add; 2 1 2 1025
2. 2 29 29 23 23 x x x x
The solution set is {1,5}.
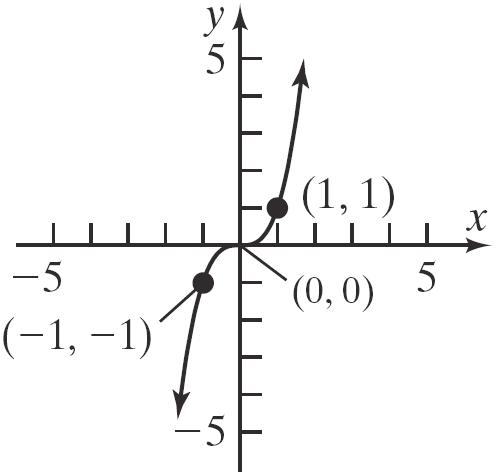
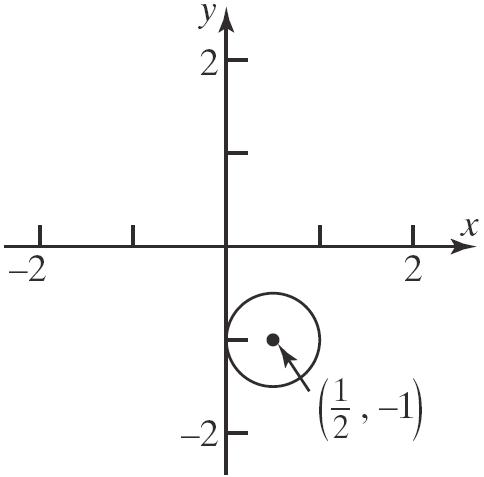
14. 3 2 yxx 3 0020 00 3 1121 11
The points (0, 0) and (1, –1) are on the graph of the equation.
15. 22 9 yx 22 309 99 22 039 018 22 0(3)9 018
The point (0, 3) is on the graph of the equation.
16. 3 1 yx 3 211 82 3 101 11 3 011 00
The points (0, 1) and (–1, 0) are on the graph of the equation.
17. 22 4 xy 22 024 44 22 (2)24 84
22 224 44
(0,2) and 2,2 are on the graph of the equation.
18.
xy
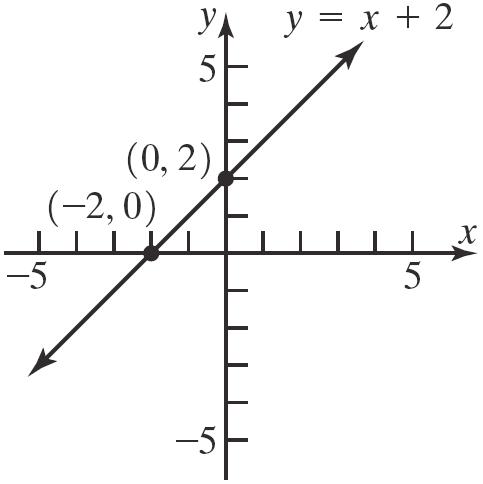
The points (0, 1) and (2, 0) are on the graph of the equation.
19. 2 yx
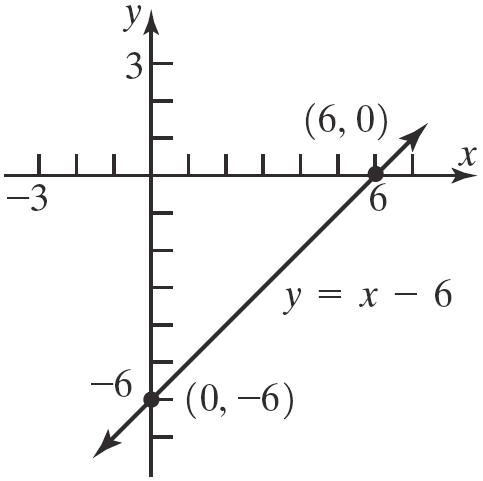
20. 6 yx
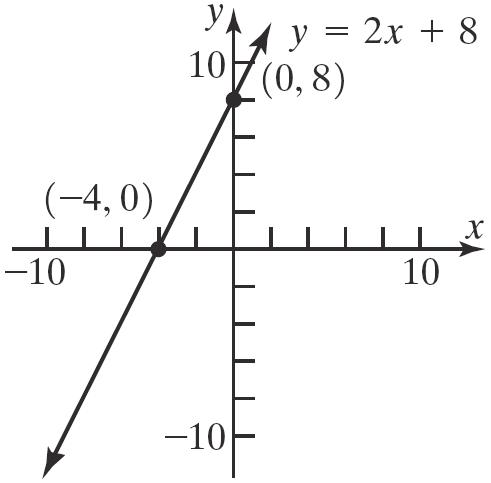
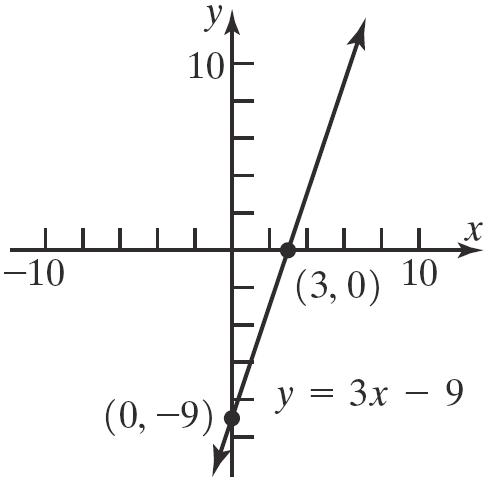
21. 28yx
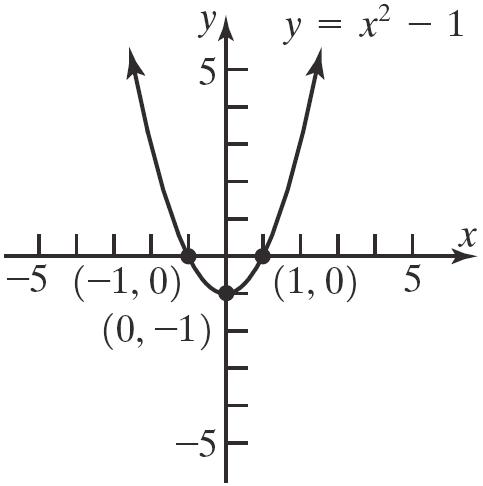
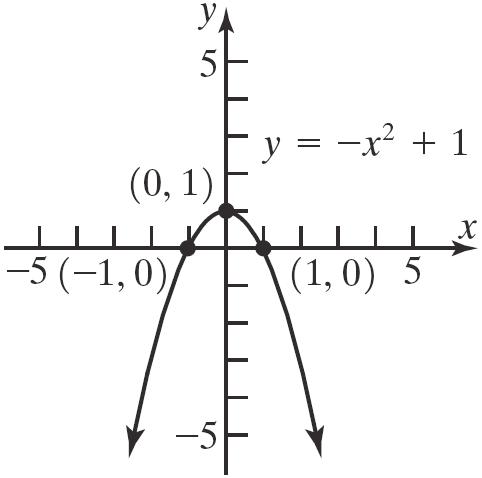
23. 2 1 yx
Section1.2: Graphs of Equations in Two Variables; Circles
24. 2 9 yx x-intercepts:
26. 2 1 yx x-intercepts: y-intercept:

25. 2 4 yx x-intercepts: y-intercepts: 2 2 04 4 2 x x
Chapter1: Graphs and Functions
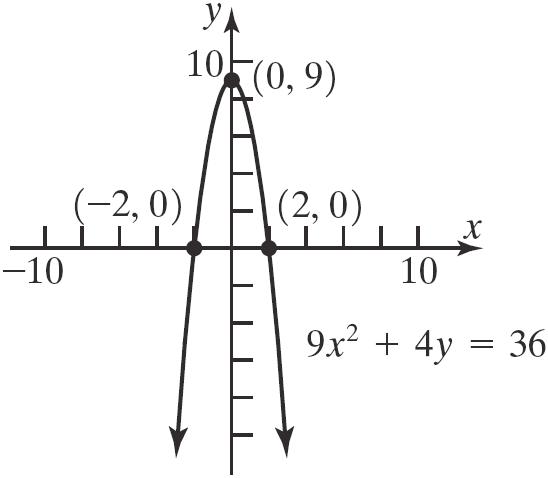
29. 2 9436 xy
x-intercepts: y-intercept:
30. 2 44 xy

Section1.2: Graphs of Equations in Two Variables; Circles
5 5 y
(a) = (5, 2) (b) = (5, 2) (c) = (5, 2)

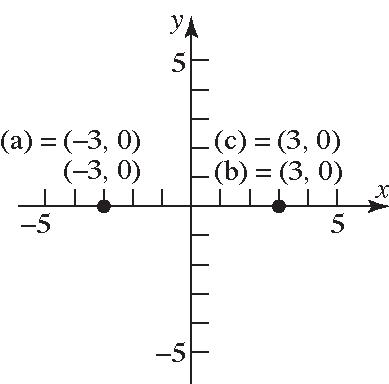
41. a. Intercepts: 1,0 and 1,0
b. Symmetric with respect to the x-axis, y-axis, and the origin.
42. a. Intercepts: 0,1
b. Not symmetric to the x-axis, the y-axis, nor the origin
43. a. Intercepts: 2 0 , , 0,1 , and 2 ,0
b. Symmetric with respect to the y-axis.
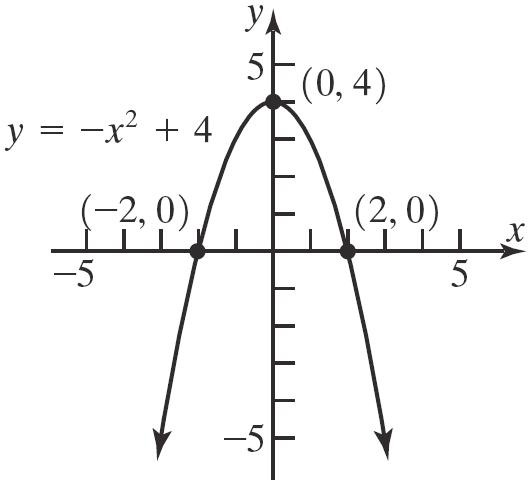
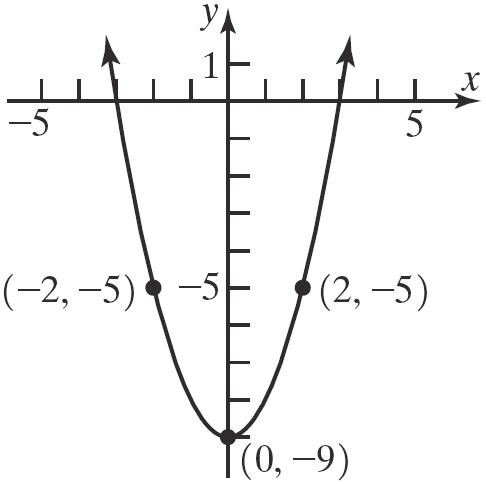
44. a. Intercepts: 2,0 , 0,3 , and 2,0
b. Symmetric with respect to the y-axis.
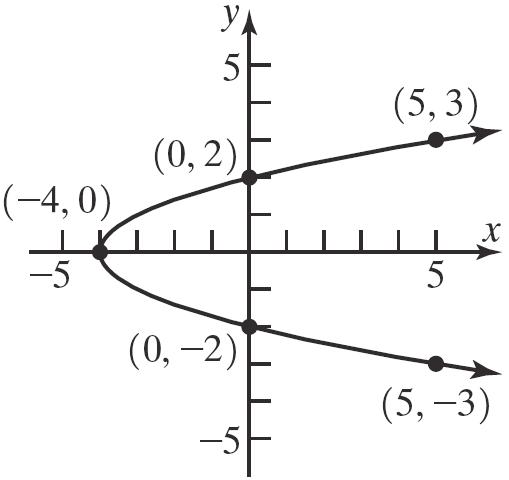
45. a. Intercepts: 0,0
b. Symmetric with respect to the x-axis.
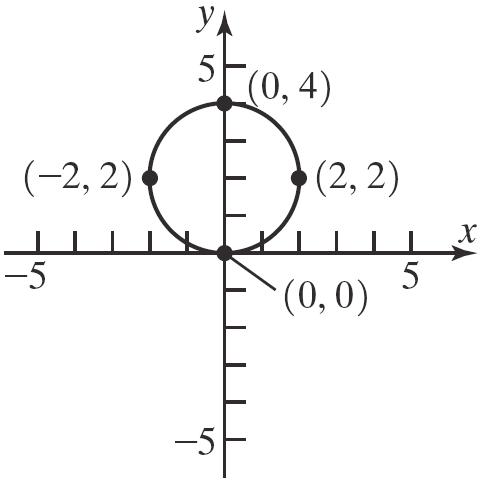
46. a. Intercepts: 2,0, 0,2, 0,2, and 2,0
b. Symmetric with respect to the x-axis, y-axis, and the origin.
47. a. Intercepts: 2,0 , 0,0 , and 2,0
b. Symmetric with respect to the origin.
48. a. Intercepts: 4,0 , 0,0 , and 4,0
b. Symmetric with respect to the origin.
Graphs and Functions
49. a. x-intercept: 2,1 , y-intercept 0
b. Not symmetric to x-axis, y-axis, or origin.
50. a. x-intercept: 1,2 , y-intercept 0
b. Not symmetric to x-axis, y-axis, or origin.
51. a. Intercepts: none
b. Symmetric with respect to the origin.
52. a. Intercepts: none
b. Symmetric with respect to the x-axis.

57. 2 4 yx x-intercepts: y-intercepts: 2 04 4 x x 2 2 04 4 2 y y y
The intercepts are 4,0 , 0,2 and 0,2 .
Test x-axis symmetry: Let yy
2 2 4 4 same yx yx
Test y-axis symmetry: Let xx 2 4 yx different
Test origin symmetry: Let xx and yy
2 2 4 4 different yx yx
Therefore, the graph will have x-axis symmetry.
58. 2 9 yx
x-intercepts: y-intercepts: 2 (0)9 09 9 x x x
2 2 09 9 3 y y y
The intercepts are 9,0 , 0,3 and 0,3 .
Test x-axis symmetry: Let yy
2 2 9 9 same yx yx
Test y-axis symmetry: Let xx 2 9 yx different
Test origin symmetry: Let xx and yy
2 2 9 9 different yx yx
Therefore, the graph will have x-axis symmetry.
59. 3 yx
x-intercepts: y-intercepts: 3 0 0 x x 3 00 y
The only intercept is 0,0 .
Test x-axis symmetry: Let yy 3 different yx
Test y-axis symmetry: Let xx 33 different yxx
Test origin symmetry: Let xx and yy
Section1.2: Graphs of Equations in Two Variables; Circles
Therefore, the graph will have origin symmetry.
60. 5 yx
intercepts: y
The only intercept is 0,0
Test x-axis symmetry: Let yy 5 different yx
Test y-axis symmetry: Let xx 55 different yxx
Test origin symmetry: Let xx
and yy
Therefore, the graph will have origin symmetry.
61. 2 90 xy
62. 2 40 xy x-intercepts: y-intercept: 2 2 040 4 2 x x x
2 040 4 4 y y y
The intercepts are 2,0 , 2,0 , and 0,4
Test x-axis symmetry: Let yy
2 2 40 40 different xy xy
Test y-axis symmetry: Let xx
2 2 40 40 same xy xy
Test origin symmetry: Let xx and yy
2 2 40 40 different xy xy
Therefore, the graph will have y-axis symmetry.
63. 22 9436 xy x-intercepts: y-intercepts: 2 2 2 2 94036 936 4 2 x x x x
2 2 2 2 90436 436 9 3 y y y y
The intercepts are 2,0 , 2,0, 0,3, and 0,3 .
Test x-axis symmetry: Let yy 2 2 22 9436 9436 same xy xy
The intercepts are 3,0 ,
3,0 , and 0,9
Test x-axis symmetry: Let yy
2 90 different xy
Test y-axis symmetry: Let xx
2 2 90 90 different xy xy
Therefore, the graph will have y-axis symmetry.
Test y-axis symmetry: Let xx 2 2 22 9436 9436 same xy xy
Test origin symmetry: Let xx and yy 22 22 9436 9436 same xy xy
Therefore, the graph will have x-axis, y-axis, and origin symmetry.
64. 22 44 xy x-intercepts: y-intercepts: 22 2 2 404 44 1 1 x x x x 2 2 2 404 4 2 y y y
Chapter1: Graphs and Functions
The intercepts are 1,0 , 1,0 , 0,2 , and
0,2 .
Test x-axis symmetry: Let yy
2 2 22 44 44 same xy xy
Test y-axis symmetry: Let xx
2 2 22 44 44 same xy xy
Test origin symmetry: Let xx and yy
22 22 44 44 same xy xy
Therefore, the graph will have x-axis, y-axis, and origin symmetry.
65. 3 27 yx
The intercepts are 3,0 and 0,27
Test x-axis symmetry: Let yy 3 27 different yx
Test y-axis symmetry: Let xx
3 3 27 27 different yx yx
Test origin symmetry: Let xx and yy
3 3 27 27 different yx yx
Therefore, the graph has none of the indicated symmetries.
66. 4 1 yx
x-intercepts:
The intercepts are
1,0 , and
Test x-axis symmetry: Let yy 4 1 different yx
Test y-axis symmetry: Let xx
4 4 1 1 same yx yx
Test origin symmetry: Let xx and yy
4 4 1 1 different yx yx
Therefore, the graph will have y-axis symmetry.
67. 2 34yxx
x-intercepts: y-intercepts:
2 034 041 4 or 1 xx xx xx
2 0304 4 y y
The intercepts are 4,0 ,
1,0 , and
Test x-axis symmetry: Let yy 2 34 different yxx
Test y-axis symmetry: Let xx
2 2 34 34 different yxx yxx
0,4
0,1
Test origin symmetry: Let xx and yy
2 2 34 34 different yxx yxx
Therefore, the graph has none of the indicated symmetries.
68. 2 4 yx
2 04 4 y y
x-intercepts: y-intercepts: 2 2 04 4 no real solution x x
The only intercept is 0,4
Test x-axis symmetry: Let yy 2 4 different yx
Test y-axis symmetry: Let xx
2 2 4 4 same yx yx
Test origin symmetry: Let xx and yy
2 2 4 4 different yx yx
69.
Therefore, the graph will have y-axis symmetry.
Section1.2: Graphs of Equations in Two Variables; Circles
Test y-axis symmetry: Let xx
2 2 4 2 4 different 2 x y x x y x
Test origin symmetry: Let xx
and yy
The only intercept is 0,0
Test x-axis symmetry: Let yy
2 2 2 4 2 4 2 4 same 2 x y x x y x x y x
Therefore, the graph has origin symmetry.
The only intercept is 0,0
Test x-axis symmetry: Let
Therefore, the graph has origin symmetry.
Test y-axis symmetry: Let xx
Test origin symmetry: Let xx
The intercepts are
Test x-axis symmetry: Let yy
Therefore, the graph has origin symmetry.
Chapter1: Graphs and Functions
72. 4 5 1 2 x y x
x-intercepts: y-intercepts: 4 5 4 1 0 2 1 x x x
no real solution
There are no intercepts for the graph of this equation.
Test x-axis symmetry: Let yy
Test y-axis symmetry: Let xx
4 5 4 5 1 2 1 different 2 x y x x y x
Test origin symmetry: Let xx and yy
Therefore, the graph has origin symmetry. 73. 3 yx
77. If the point ,4 a is on the graph of 2 3 yxx
, then we have
78. If the point ,5 a is on the graph of 2 6 yxx , then we have
Section1.2: Graphs of Equations in Two Variables; Circles
General form: 22 40 xy
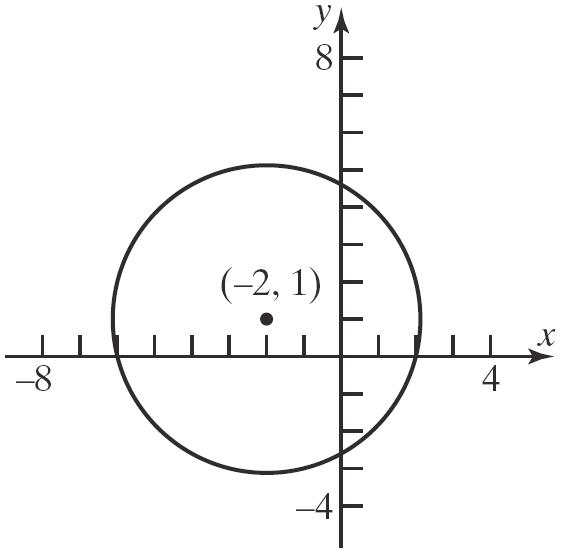
79. Center = (2, 1)
Radiusdistance from (0,1) to (2,1) (20)(11)42
Equation: 22 (2)(1)4 xy
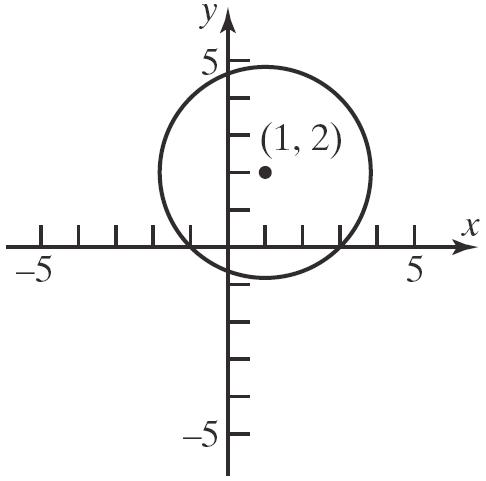
80. Center = (1, 2)
Radiusdistance from (1,0) to (1,2) (11)(20)42
Equation: 22 (1)(2)4 xy
81. Center = midpoint of (1, 2) and (4, 2)
84. ()()222 xhykr 222 22 (0)(0)3 9 xy xy
General form: 22 90 xy
1422 5 222,,2
Equation: 2 2 59 (2) 24xy
82. Center = midpoint of (0, 1) and (2, 3)
0213 22,1,2
83. ()()222 xhykr 222 22 (0)(0)2 4 xy xy
85. ()()222 xhykr 222 22 (0)(2)2 (2)4 xy xy
General form: 22 22 444 40 xyy xyy

86. ()()222 xhykr 222 22 (1)(0)3 (1)9 xy xy
General form: 22 22 219 280 xxy xyx

87. ()()222 xhykr 222 22 (4)((3))5 (4)(3)25 xy xy
General form: 22 22 8166925 860 xxyy xyxy
88. ()()222 xhykr 222 22 (2)((3))4 (2)(3)16 xy xy
General form: 22 22 446916 4630 xxyy xyxy
89. ()()222 xhykr 222 22 (2)(1)4 (2)(1)16 xy xy
General form: 22 22 442116 42110 xxyy xyxy
90. ()()222 xhykr
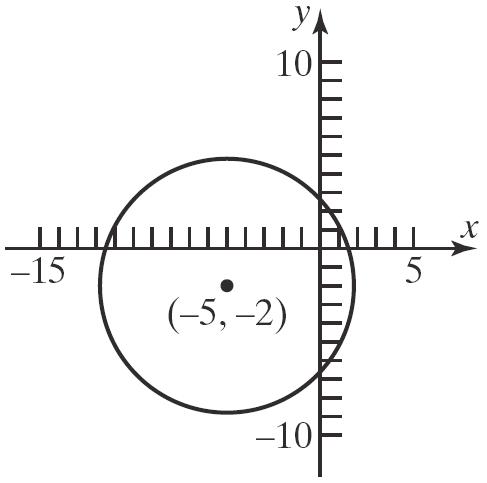
222 22 (5)((2))7 (5)(2)49 xy xy
General form: 22 22 10254449 104200 xxyy xyxy
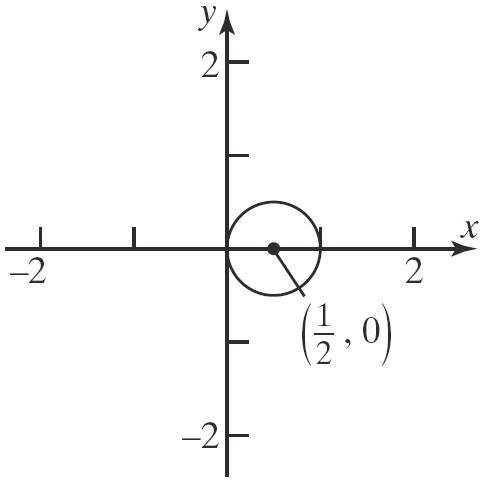
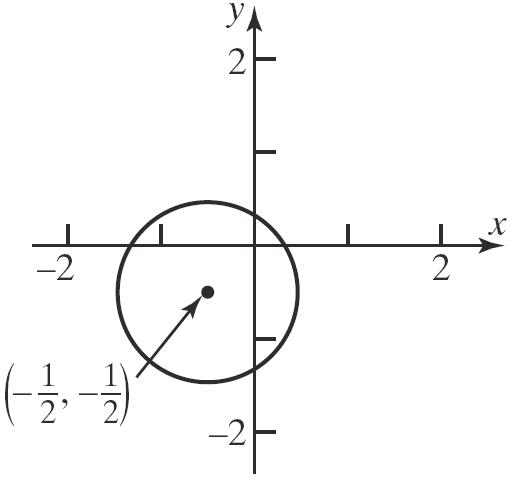
91. ()()222 xhykr 22 2 2 2 11 (0) 22 11 24 xy xy
General form: 22 22 11 44 0 xxy xyx
92. ()()222 xhykr
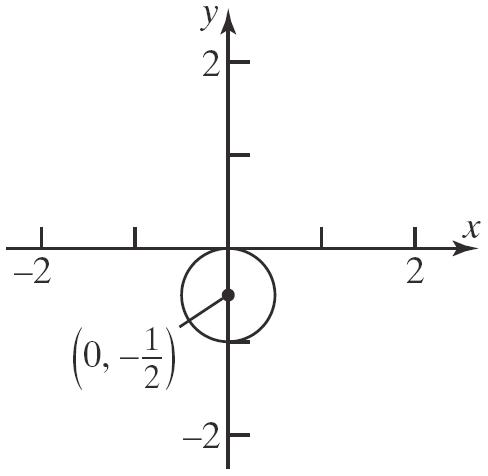
2 2 2 2 2 11 0 22 11 24 xy xy
General form: 22 22 11 44 0 xyy xyy
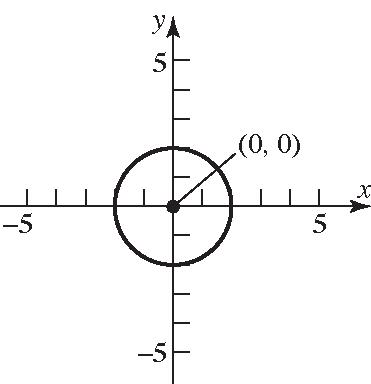
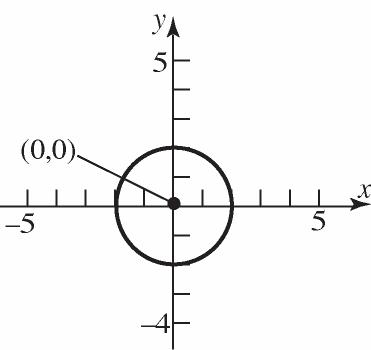
93. 22 4 xy 222 2 xy
a. Center: (0,0); Radius2
b.
Section1.2: Graphs of Equations in Two Variables; Circles
c. x-intercepts: 2 2 2 04 4 42 x x x
-intercepts:
The intercepts are 2,0,2,0, 0,2, and 0,2.
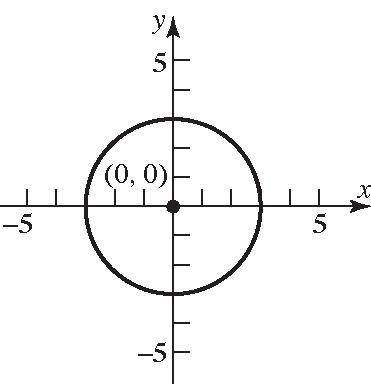
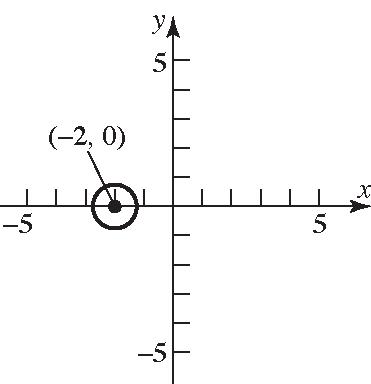
94. 22(1)1xy 222 (1)1xy
a. Center:(0,1); Radius1
b.
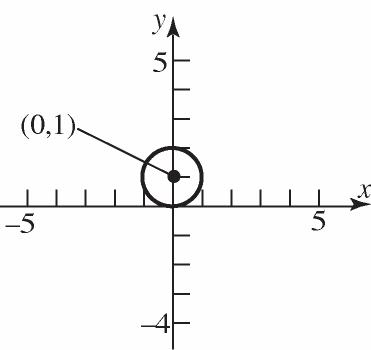
c. x-intercepts: 22 2 2 (01)1 11 0 00 x x x x
y-intercepts: 2 2 2 0(1)1 (1)1 11 11 11 y y y y y 2 or 0 yy
The intercepts are 0,0 and 0,2.
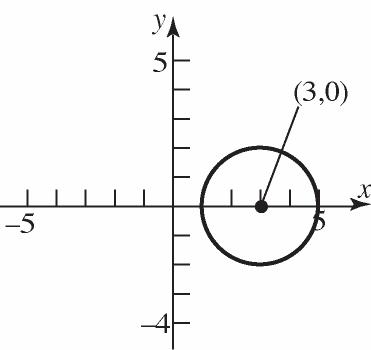
95. 2 2 2328 xy
2 2 34xy
a. Center: (3, 0); Radius 2
c. x-intercepts:
a. Center: (–1,1); Radius = 2
b. c. x-intercepts:
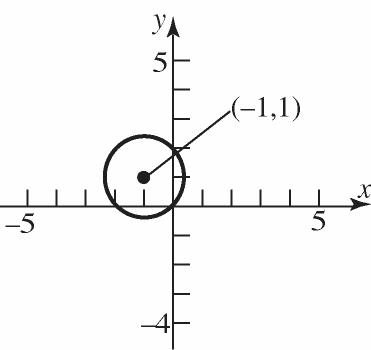
0 or 2 xx
y-intercepts:
a. Center: (1, 2); Radius = 3
b.
c. x-intercepts:
y-intercepts:
The intercepts are
15,0,15,0,
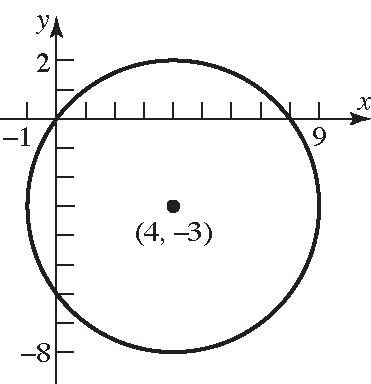
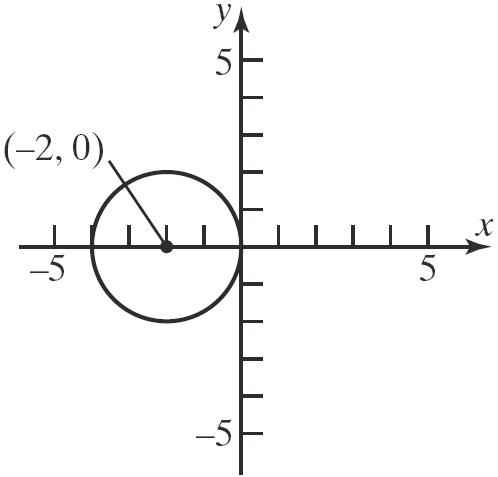
0,222, and 0,222. 98. 22 42200xyxy 22 22 222 4220 (44)(21)2041 (2)(1)5
a. Center: (–2,–1); Radius = 5 b.
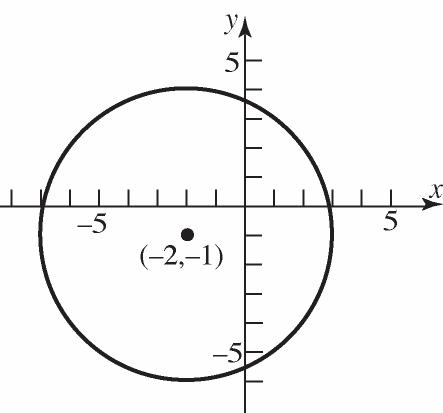
c. x-intercepts: 222 2 2 (2)(01)5 (2)125 (2)24 224 226 226 x x x x x x
y-intercepts: 222 2 2 (02)(1)5 4(1)25 (1)21 121 121 y y y y y
Section1.2: Graphs of Equations in Two Variables; Circles
a. Center: (–2, 2); Radius = 3 b. y x
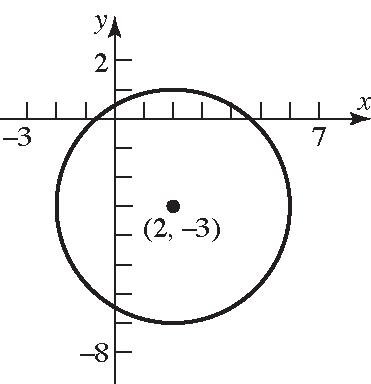
The intercepts are 226,0, 226,0, 0,121, and 0,121. 99. 22 22 22 222 4410 441 (44)(44)144 (2)(2)3 xyxy xxyy xxyy xy
c. x-intercepts: 222 2 2 (2)(02)3 (2)49 (2)5 25 25 x x x x x
y-intercepts: 222 2 2 (02)(2)3 4(2)9 (2)5 25 25 y y y y y
The intercepts are 25,0, 25,0, 0,25, and 0,25.
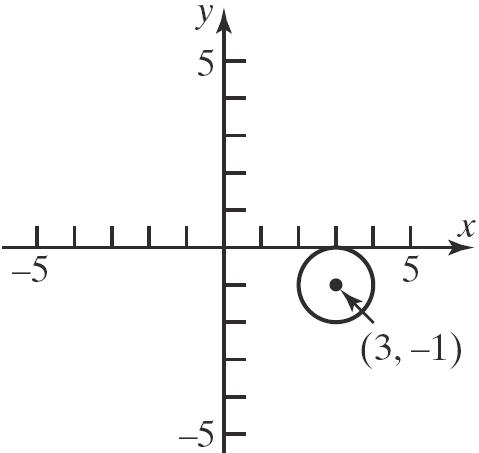
100. 22 22 22 222 6290 629 (69)(21)991 (3)(1)1 xyxy xxyy xxyy xy
a. Center: (3, –1); Radius = 1 b.
b.
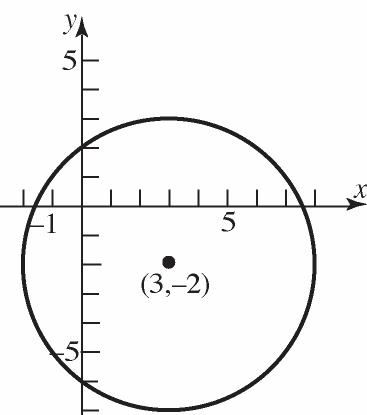
103.
a. Center: (3,–2); Radius = 5
b.
c. x-intercepts:
y-intercepts:
Section1.2: Graphs of Equations in Two Variables; Circles
0,6, and
Chapter1: Graphs and Functions
c. x-intercepts:
a.
The intercepts are
107. Center at (0, 0); containing point (–2, 3).
22 20304913 r
Equation: 2 22 22 (0)(0)13 13 xy xy
108. Center at (1, 0); containing point (–3, 2).
22 31201642025 r
Equation: 2 22 22 (1)(0)20 (1)20 xy xy
109. Endpoints of a diameter are (1, 4) and (–3, 2).
The center is at the midpoint of that diameter:
Center: 1(3)42,1,3 22
Radius: 22 (1(1))(43)415 r
Equation: 2 22 22 ((1))(3)5 (1)(3)5 xy xy
110. Endpoints of a diameter are (4, 3) and (0, 1). The center is at the midpoint of that diameter:
Center: 4031 ,2,2 22
Radius: 22 (42)(32)415 r
Equation: 2 22 22 (2)(2)5 (2)(2)5 xy xy
111. Center at (2, –4); circumference 16
This means that the radius of the circle is: 216 8
Equation: 222 22 (2)(4)(8) (2)(4)64
112. Center at (–5 ,6); area 49
This means that the radius of the circle is: 2 49 7
Equation: 222 22 (5)(6)(7) (5)(6)49
xy xy
113. For a graph with origin symmetry, if the point , ab is on the graph, then so is the point , ab . Since the point 1,2 is on the graph of an equation with origin symmetry, the point 1,2 must also be on the graph.
114. For a graph with y-axis symmetry, if the point , ab is on the graph, then so is the point
, ab . Since 6 is an x-intercept in this case, the point 6,0 is on the graph of the equation. Due to the y-axis symmetry, the point 6,0 must also be on the graph. Therefore, 6 is another xintercept.
115. For a graph with origin symmetry, if the point , ab is on the graph, then so is the point
, ab . Since 4 is an x-intercept in this case, the point 4,0 is on the graph of the equation. Due to the origin symmetry, the point 4,0 must also be on the graph. Therefore, 4 is another x-intercept.
116. For a graph with x-axis symmetry, if the point
, ab is on the graph, then so is the point
, ab . Since 2 is a y-intercept in this case, the point 0,2 is on the graph of the equation. Due to the x-axis symmetry, the point 0,2 must also be on the graph. Therefore, 2 is another yintercept.
117. a. 2 2222 xyxxy
x-intercepts:
3 0or20 02 xx xx
y-intercepts:
2 2222 2 22 42 42 22 000 0 10 yy yy yy yy yy
22 2 0or10 0 1 1 yy yy y
The intercepts are 0,0, 2,0, 0,1, and 0,1 .
b. Test x-axis symmetry: Let yy
2 2222 2 2222 same xyxxy xyxxy
Test y-axis symmetry: Let xx
2 2222 2 2222 different xyxxy xyxxy
Test origin symmetry: Let xx and yy
2 2222 2 2222 different xyxxy xyxxy
Thus, the graph will have x-axis symmetry.
118. a. 2 16120225 yx
x-intercepts:
2 2 2 161200225 16225 225 16 no real solution y y y
y-intercepts:
2 160120225 0120225 120225 22515 1208 x x x x
The only intercept is 15 ,0 8
b. Test x-axis symmetry: Let yy
2 2 16120225 16120225 same yx yx
Test y-axis symmetry: Let xx
2 2 16120225 16120225 different yx yx
Test origin symmetry: Let xx
and yy
2 2 16120225 16120225 different yx yx
Thus, the graph will have x-axis symmetry.
119. Let the upper-right corner of the square be the point , xy . The circle and the square are both centered about the origin. Because of symmetry, we have that xy at the upper-right corner of the square. Therefore, we get
The length of one side of the square is 2 x . Thus, the area is
120. The area of the shaded region is the area of the circle, less the area of the square. Let the upperright corner of the square be the point , xy
The circle and the square are both centered about the origin. Because of symmetry, we have that xy at the upper-right corner of the square. Therefore, we get
The length of one side of the square is 2 x . Thus, the area of the square is 2 23272 square units. From the equation of the circle, we have 6 r . The area of the circle is
2 2 636 r
square units. Therefore, the area of the shaded region is 3672 A square units.
121. The diameter of the Ferris wheel was 250 feet, so the radius was 125 feet. The maximum height was 264 feet, so the center was at a height of 264125139 feet above the ground. Since the center of the wheel is on the y-axis, it is the point (0, 139). Thus, an equation for the wheel is:
122. The diameter of the wheel is 520 feet, so the radius is 260 feet. The maximum height is 550 feet, so the center of the wheel is at a height of 550260290 feet above the ground. Since the center of the wheel is on the y-axis, it is the point (0, 290). Thus, an equation for the wheel is:
22 2 2 2 0290260 29067,600
123.
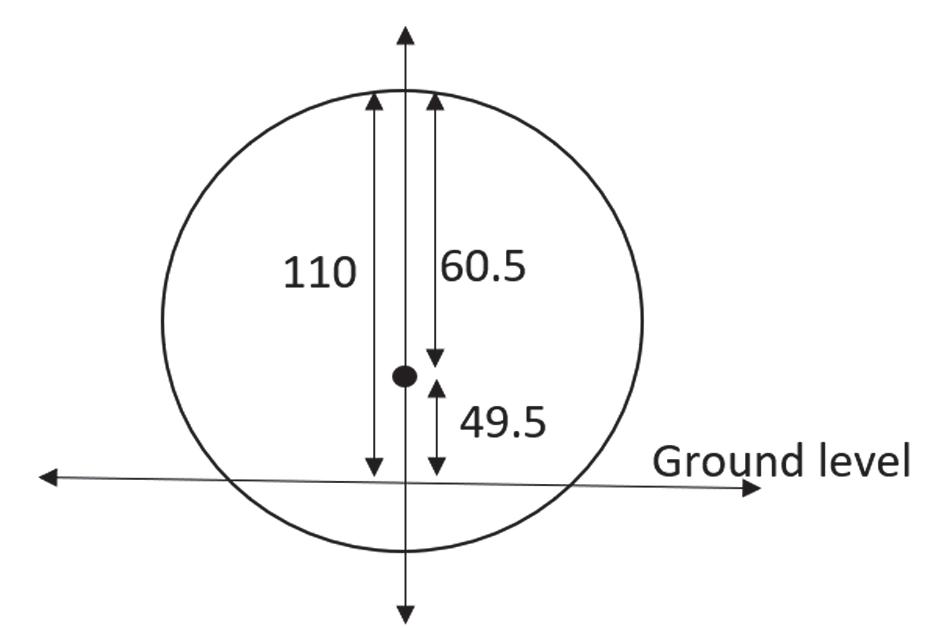
Refer to figure. Since the radius of the building is 60.5 m and the height of the building is 110 m, then the center of the building is 49.5 m above the ground, so the y-coordinate of the center is 49.5. The equation of the circle is given by 222(49.5)60.53660.25 xy
124. Complete the square to find the equation of the circle representing the formula for the building. 22 222 781521184315213364 (39)58
xyy xy

Refer to figure. The y coordinate of the center is 39. The radius is 58. Thus the height of the building is 58 + 39 = 97 m.
125. Center at (2, 3); tangent to the x-axis.
3 r
Equation: 222 22 (2)(3)3 (2)(3)9 xy xy
126. Center at (–3, 1); tangent to the y-axis.
3 r
Equation: 222 22 (3)(1)3 (3)(1)9 xy xy
127. Center at (–1, 3); tangent to the line y = 2. This means that the circle contains the point (–1, 2), so the radius is r = 1.
Equation: 222 22 (1)(3)(1) (1)(3)1 xy xy
Section1.2: Graphs of Equations in Two Variables; Circles
128. Center at (4, –2); tangent to the line x = 1. This means that the circle contains the point (1, –2), so the radius is r = 3.
Equation: 222 22 (4)(2)(3) (4)(2)9 xy xy
129. a. Substitute 222 into : ymxbxyr 222
This equation has one solution if and only if the discriminant is zero.
b. From part (a) we know 2222 (1)20 mxbmxbr . Using the quadratic formula, since the discriminant is zero, we get:
22 2 2 2 222222 2 2(1) bmbmbmrmr x mbb b r mr ymb b mrmrbr b bbb
The point of tangency is 22 ,.
mrr bb
c. The slope of the tangent line is m . The slope of the line joining the point of tangency and the center (0,0) is: 2 2 2 2 0 1 0 r brb bmmrmr b
The two lines are perpendicular.
Chapter1: Graphs and Functions
130. Let (,) hk be the center of the circle.
The slope from (,) hk to (3, –1) is 1 2 .
The slope of the tangent line is 1 2 . The slope from (,) hk to (0, 2) is –2. 2 2 0 22 k h kh
The other tangent line is 27yx , and it has slope 2.
131. The center of the circle is 1212 , 22
Solve the two equations in and hk : 22(12) 224 30 0
The center of the circle is (1, 0).
Section1.2: Graphs of Equations in Two Variables; Circles
Because 00 , xy is on the circle, 22 0000
133. Let y = 0. 222222 422 422 222 222 22 (0)(0) () 0 ()0 0 or ()0 0 or ,
xax xax xax xxa xxa xxa xaa
134. Let y = 0. 222222 432222 2 (0)(0) 20 (()(()0 0 or or
xaxbx xaxaxbx xxabxab xxab xab
yay yay yay yya y
Let x = 0. 222222 422 422 222 (0)(0) () 0 ()0 0
(Note that the solutions to 22 0 ya are not real)
So the intercepts are are (0,0), (a,0) and (-a,0).
Test x-axis symmetry: Replace y by -y 222222 222222 (())(()) ()() equivalent
xyaxy xyaxy
Test y-axis symmetry: replace x by -x 222222 222222 (())(()) ()() equivalent
xyaxy xyaxy
Test origin symmetry: replace x by -x and y by -y 222222 222222 (()())(()()) ()() equivalent
xyaxy xyaxy
The graph is symmetric by respect to the xaxis, the y-axis, and the origin.
Let x = 0. 222222 422 2 (00)(0) 0 ()()0 0,,
yaby yby yybyb yybyb
So the intercepts are (0,0), (a-b,0), (a+b,0), (0,-b), (0, b).
Test x-axis symmetry: replace y by -y 2 22222 222222 ()() ()() Equivalent xyaxbxy xyaxbxy
Test y-axis symmetry: replace x by -x 2 22222 222222 ()()() ()() Not equivalent
xyaxbxy xyaxbxy
Test origin symmetry: replace x by -x and y by -y 2 22222 222222 ()()()()() ()() No equivalent xyaxbxy xyaxbxy
The graph is symmetric with respect to the x-axis only.
Chapter1: Graphs and Functions
135. (b), (c), (e) and (g)
We need ,0hk and 0,0 on the graph.
136. (b), (e) and (g)
We need 0 h , 0 k , and hr
Thus, the graph will have x-axis symmetry.
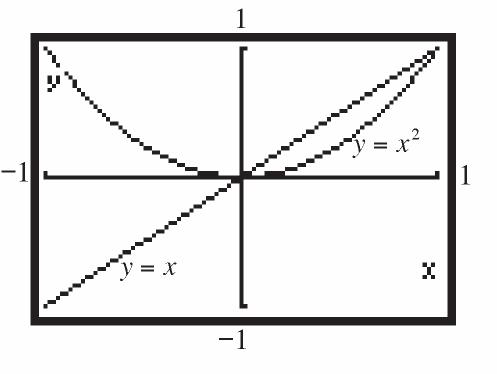
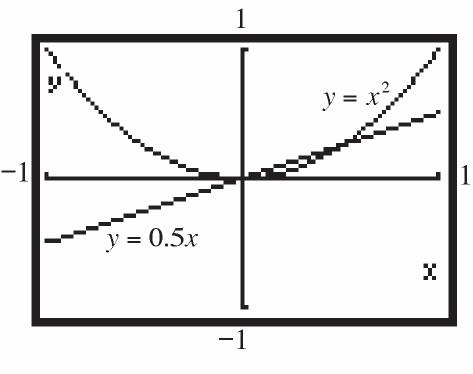
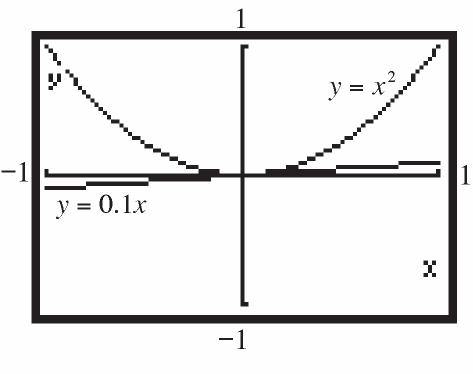
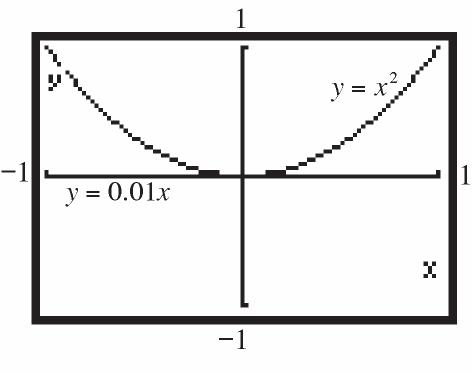
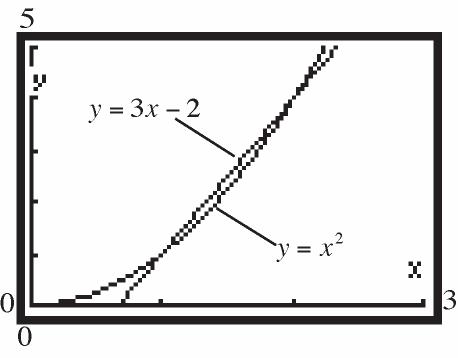
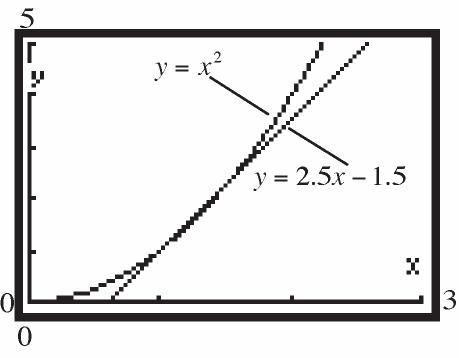
137. a.
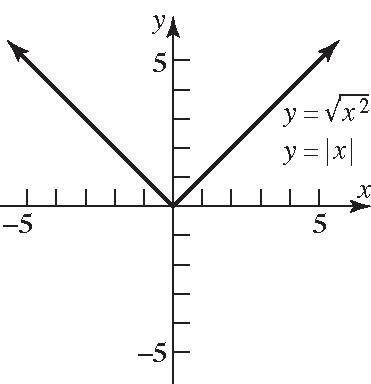
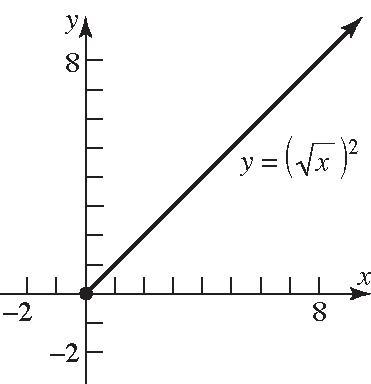
b. Since 2 xx for all x , the graphs of 2 and yxyx are the same.
c. For 2 yx , the domain of the variable x is 0 x ; for yx , the domain of the variable x is all real numbers. Thus, 2 only for 0. xxx
d. For 2 yx , the range of the variable y is 0 y ; for yx , the range of the variable
y is all real numbers. Also, 2 xx only if 0 x . Otherwise, 2 xx
138. Answers will vary. One example: y x
139. Answers will vary
140. Answers will vary
141. Answers will vary.
Case 1: Graph has x-axis and y-axis symmetry, show origin symmetry.
, on graph, on graph (from -axis symmetry) xyxy x
, on graph, on graph from -axis symmetry xyxy y
Since the point , xy is also on the graph, the graph has origin symmetry.
Case 2: Graph has x-axis and origin symmetry, show y-axis symmetry.
, on graph, on graph from -axis symmetry xyxy x
, on graph, on graph from origin symmetry xyxy
Since the point , xy is also on the graph, the graph has y-axis symmetry.
Case 3: Graph has y-axis and origin symmetry, show x-axis symmetry.
, on graph, on graph from -axis symmetry xyxy y
, on graph, on graph from origin symmetry xyxy
Since the point , xy is also on the graph, the graph has x-axis symmetry.
142. Answers may vary. The graph must contain the points 2,5 , 1,3 , and 0,2 . For the graph to be symmetric about the y-axis, the graph must also contain the points 2,5 and 1,3 (note that (0, 2) is on the y-axis).
For the graph to also be symmetric with respect to the x-axis, the graph must also contain the points 2,5 , 1,3 , 0,2 , 2,5 , and 1,3 . Recall that a graph with two of the symmetries (x-axis, y-axis, origin) will necessarily have the third. Therefore, if the original graph with y-axis symmetry also has xaxis symmetry, then it will also have origin symmetry.
143. Answers will vary.
144. The student has the correct radius, but the signs of the coordinates of the center are incorrect. The student needs to write the equation in the standard form
Section1.3: Functions and Their Graphs
3. We must not allow the denominator to be 0. 404xx ; Domain: 4 xx
4. 325 22 1 x x x Solution set: |1
5. 52
6. radicals
7. independent; dependent
8. False; every function is a relation, but not every relation is a function. For example, the relation 22 1 xy is not a function.
9. False
10. False; |0 xx
11. a
12. c
13. d
14. a
15. vertical
16. 3
17. 2 4 fxax 2 1422aa
18. False. The graph must pass the vertical line test in order to be the graph of a function.
19. True
20. a
21. a. Domain: {0,22,40,70,100} Range: {1.031, 1.121, 1.229, 1.305, 1.411}
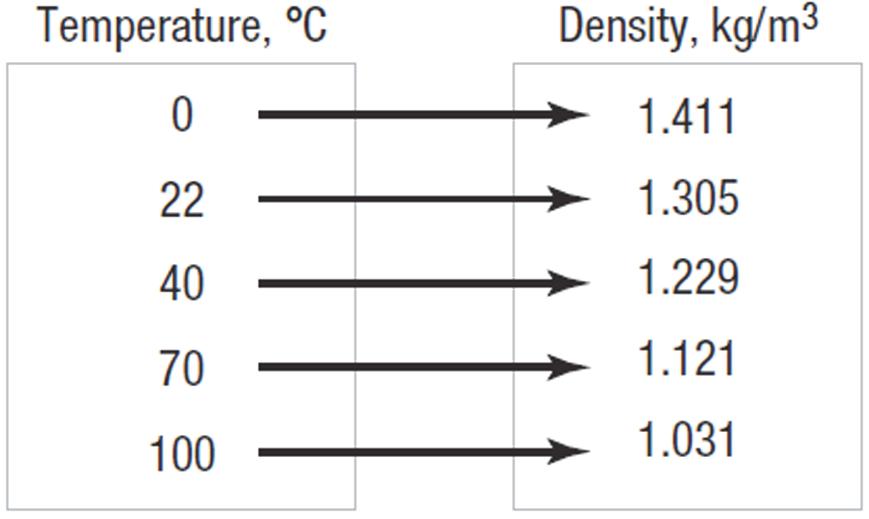
c. {(0, 1.411), (22, 1.305), (40, 1.229), (70, 1.121), (100, 1.031)}
22. a. Domain: {1.80, 1.78, 1.77}
b.
Range: {87.1, 86.9, 92.0, 84.1, 86.4}
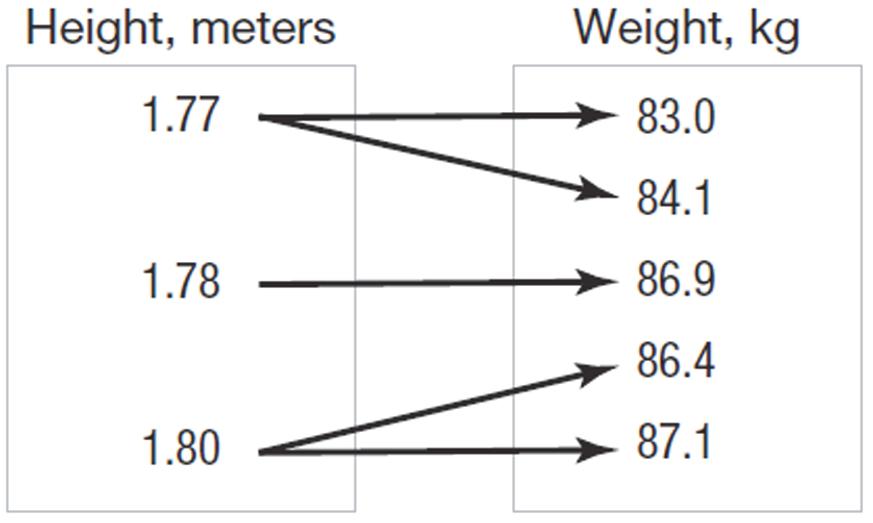
c. {(1.80, 87.1), (1.78, 86.9), (1.77, 83.0), (1.77, 84.1), (1.80, 86.4)}
23. Function
Domain: {Elvis, Colleen, Kaleigh, Marissa}
Range: {Jan. 8, Mar. 15, Sept. 17}
24. Domain: {Bob, John, Chuck}
Range: {Beth, Diane, Linda, Marcia}
Not a function
25. Domain: {20, 30, 40}
Range: {200, 300, 350, 425}
Not a function
26. Function
Domain: {Less than 9th grade, 9th-12th grade, High School Graduate, Some College, College Graduate}
Range: {$18,120, $23,251, $36,055, $45,810, $67,165}
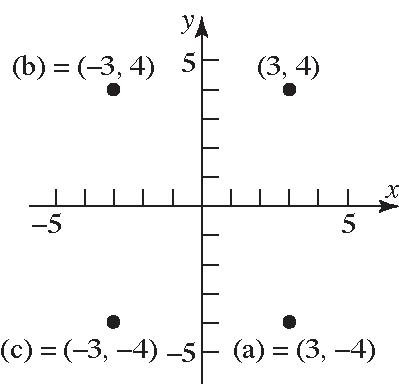
27. Domain: {-3, 2, 4} Range: {6, 9, 10} Not a function
28. Function
Domain: {–2, –1, 3, 4} Range: {3, 5, 7, 12}
29. Function Domain: {1, 2, 3, 4} Range: {3}
30. Function
Domain: {0, 1, 2, 3}
Range: {–2, 3, 7}
31. Domain: {-2, 0, 3} Range: {3, 4, 6, 7} Not a function
32. Domain: {-4, -3, -2, -1} Range: {0, 1, 2, 3, 4} Not a function
33. Function Domain: {–2, –1, 0, 1} Range: {0, 1, 4}
34. Function Domain: {–2, –1, 0, 1} Range: {3, 4, 16}
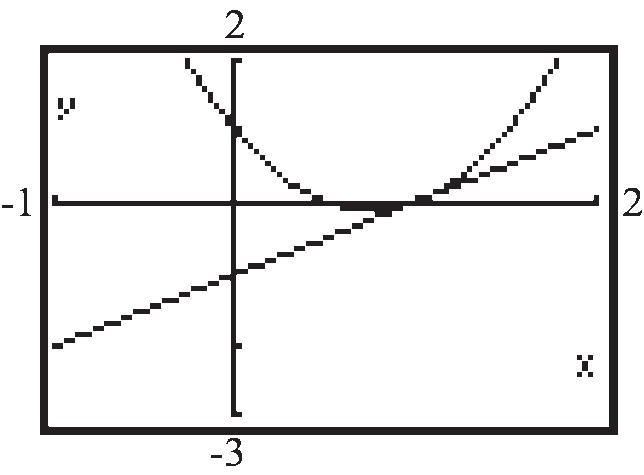
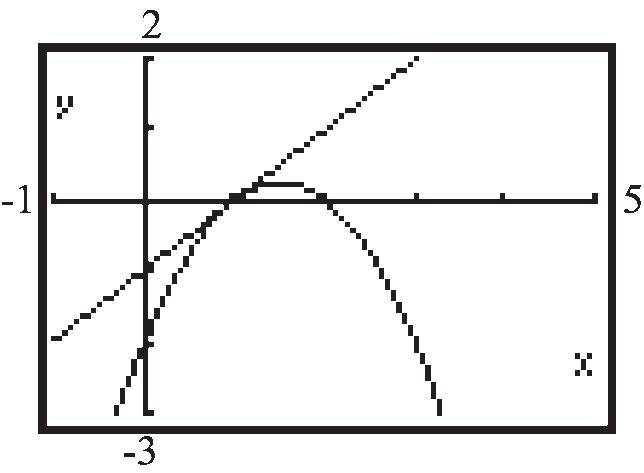
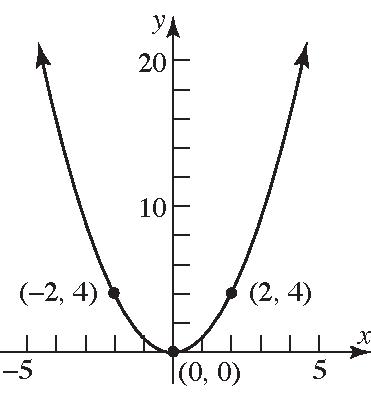
35. Graph 2 234yxx . The graph passes the vertical line test. Thus, the equation represents a function.
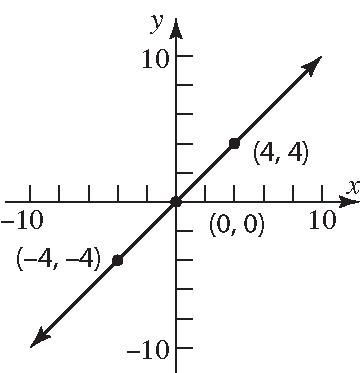
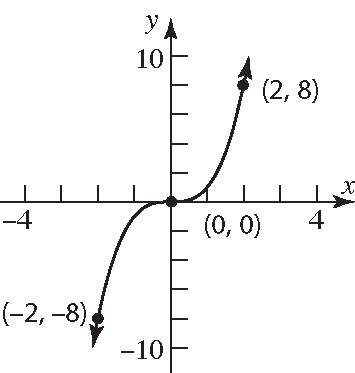
36. Graph 3 yx . The graph passes the vertical line test. Thus, the equation represents a function.
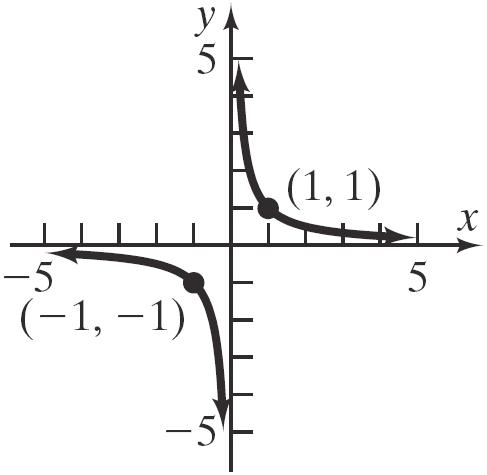
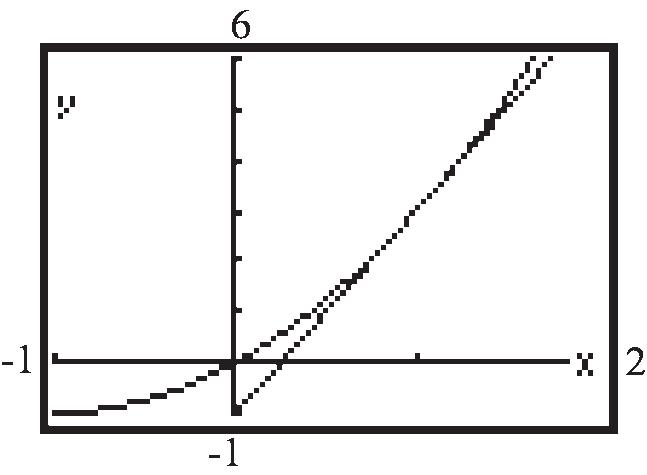
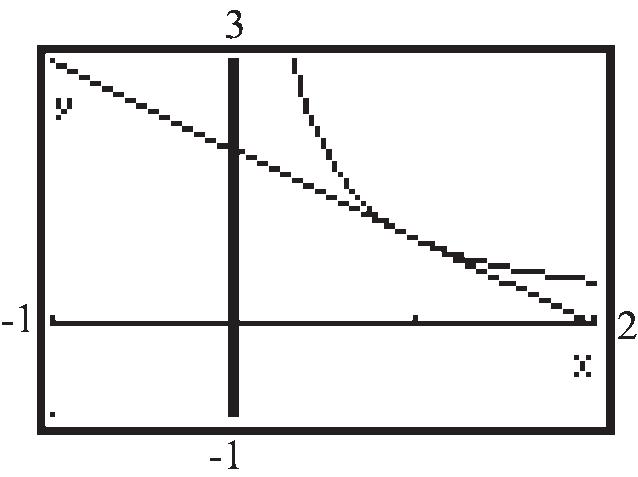
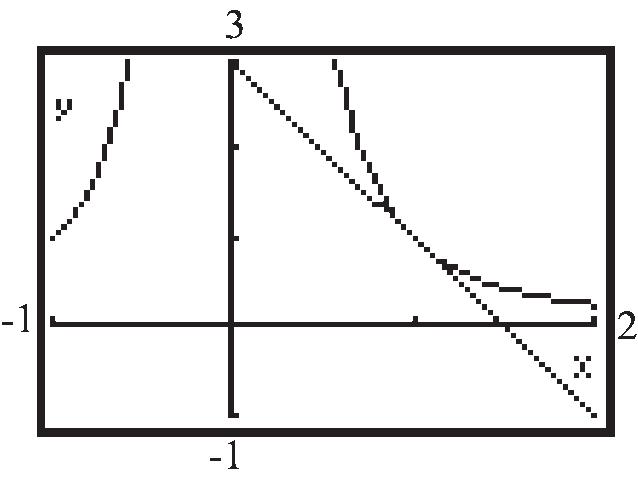
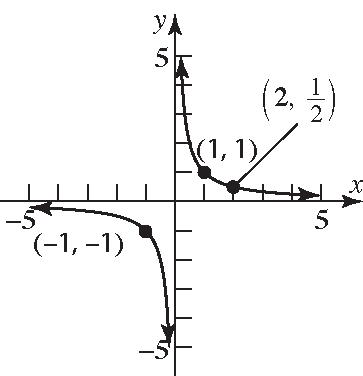
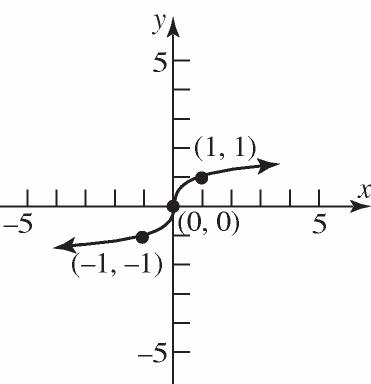
37. Graph 1 y x . The graph passes the vertical line test. Thus, the equation represents a function.
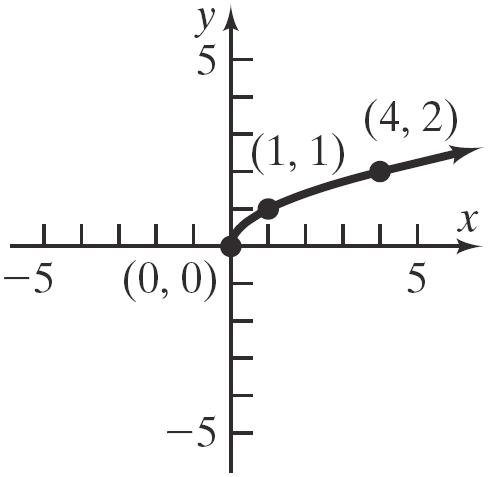
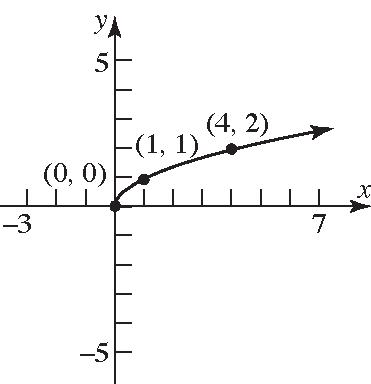
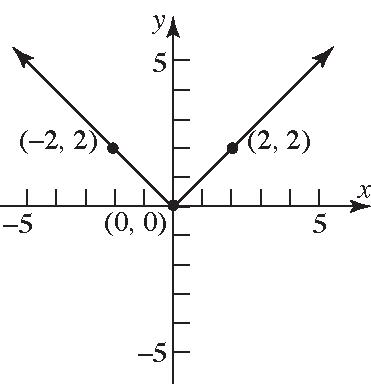
38. Graph yx . The graph passes the vertical line test. Thus, the equation represents a function.
39. 22 4 yx Solve for 2 :4 yyx For 0,2xy . Thus, (0, 2) and (0, –2) are on
the graph. This is not a function, since a distinct xvalue corresponds to two different y-values.
40. 12 yx
For 0,1xy . Thus, (0, 1) and (0, –1) are on the graph. This is not a function, since a distinct xvalue corresponds to two different y-values.
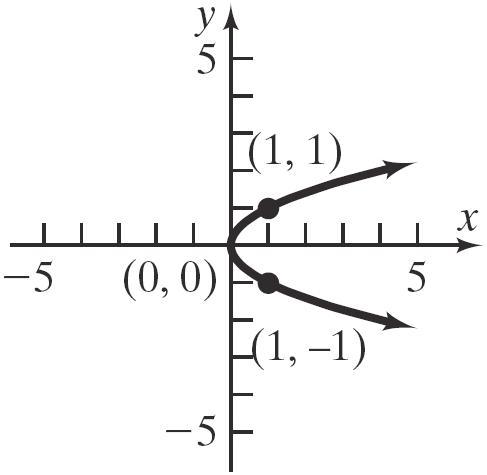
41. 2 xy
Solve for : yyx
For 1,1xy . Thus, (1, 1) and (1, –1) are on the graph. This is not a function, since a distinct x-value corresponds to two different y-values.
42. 2 1 xy
Solve for :1 yyx
For 0,1xy . Thus, (0, 1) and (0, –1) are on the graph. This is not a function, since a distinct xvalue corresponds to two different y-values.
43. Graph 2 yx . The graph passes the vertical line test. Thus, the equation represents a function.
44. Graph 31 2 x y x . The graph passes the vertical line test. Thus, the equation represents a function.
45. 22 231 xy
Solve for y: 22
Functions and Their Graphs
46. 2241xy Solve for y: 22 22 2 2 2 41 41 1 4 1 2 xy yx x y x y For 1 2, 2 xy . Thus, 1 2, 2 and 1 2, 2 are on the graph. This is not a function, since a distinct x-value corresponds to two different y-values.
47. 2 324fxxx
a. 2 0302044 f
b. 2 1312143241 f
c. 2 1312143243 f
d. 2 2 324324fxxxxx
e. 22 324324fxxxxx
f. 2 2 2 2 131214 321224 363224 381 fxxx xxx xxx xx
g. 2 2 2322241244 fxxxxx
h. 2 22 22 324 32224 363224 fxhxhxh xxhhxh xxhhxh
4. 2 21fxxx
and 1 0, 3 are on the graph. This is not a function, since a distinct x-value corresponds to two different y-values.
a. 2 020011 f
b. 2 121112 f
c. 2 121114 f
d. 2 2 2121fxxxxx
e. 22 2121fxxxxx
f.
g. 2 2 22221821
22 1 1 fxxx xx
22 22 2 41 21 fxxx xx
e.
2 2 1 1 44fxxx xx
2211 44fxxx xx
2 22 11 1 14 2112 55 x fx x xxxx xx
g. 2 2 21 41 2 2424fxxx xx
h. 2 22 1 21 44 xhxxhh fxhxhxh
51. 4 fxx
a. 004044 f
b. 114145 f
c. 114145 f
d. 44fxxx
e. 44fxxx
f. 114fxx
g. 22424fxxx
h. 4 fxhxh
52. 2 fxxx
a. 2 00000 f
Section1.3: Functions and Their Graphs
b. 2 1112 f
c. 2 1111100 f
d.
e.
f.
g.
h.
111 99 12
2 11 1110 1 12
2 1 1 2 fx x
22 11 11 22 fx xx
22 11 111 123 fx xx
g. 22 11 211 2241 fx xx
h.
2 1 1 2 fxh xh
55. ()54fxx
Domain: is any real number xx
56. 2 ()2fxx
Domain: is any real number xx
57. 2 () 1 fxx x
Domain: is any real number xx
58. 2 2 () 1 fxx x
Domain: is any real number xx
59. 2 () 16 x gx x 2 2 160 164 x xx
Domain: 4,4xxx
Chapter1: Graphs and Functions
60. 2 2 () 4 hxx x 2 2 40 42 x xx
Domain: 2,2xxx
61. 3 2 () x Fx xx 3 2 2 0 (1)0 0,1 xx xx xx
Domain: 0 xx
62. 3 4 () 4 Gxx xx 3 2 2 40 (4)0 0,4 0,2 xx xx xx xx
Domain: 2,0,2xxxx
63. ()312hxx 3120 312 4 x x x
Domain: 4 xx
64. ()1 Gxx 10 1 1 x x x
Domain: 1 xx
65. 22 () 1 1 px xx 10 1 x x
Domain: 1 xx
66. 4 () 9 fx x 90 9 x x
Domain: 9 xx
67. () 4 fxx x 40 4 x x
Domain: 4 xx
68. 2 () x x qx 20 2 2 x x x
Domain: 2 xx
69. 4 () 321 t Pt t 40 4 t t
Also 3210 t 3210 321 7 t t t
Domain: 4,7ttt
70. 3 () 2 hzz z 30 3 z z
Also 20 2 z z
Domain: 3,2zzz
71. ()43fxx ()()4()3(43) 44343 4 4 fxhfxxhx hh xhx h h h
72. ()31fxx ()()3()1(31) 33131 3 3 fxhfxxhx hh xhx h h h
73. 2 ()4fxx 22 222 2 ()() ()4(4) 244 2 2 fxhfx h xhx h xxhhx h xhh h xh
74. 2 ()32fxx 22 222 2 ()() 3()2(32) 363232 63 63 fxhfx h xhx h xxhhx h xhh h xh
Section1.3: Functions and Their Graphs
75. 2 ()4fxxx 22 222 2 ()() ()()4(4) 244 2 21 fxhfx h xhxhxx h xxhhxhxx h xhhh h xh
76. 2 326fxxx
2 2 222 2222 326326 32226326 36323632 632 fxhfx h xhxhxx h xxhhxhxx h xxhhhxxhhh hh xh
78. 1 ()
82. ()1fxx
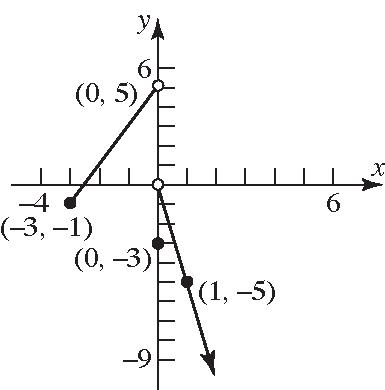
83. a. (0)3 since (0,3) is on the graph. f (6)3 since (6,3) is on the graph. f
b. (6)0 since (6,0) is on the graph. f (11)1 since (11,1) is on the graph. f
c. (3) is positive since (3)3.7. ff
d. (4) is negative since (4)1. ff
e. ()0 when 3,6, and 10. fxxxx
f. ()0 when 36, and 1011.fxxx
g. The domain of f is 611xx or 6,11 .
h. The range of f is 34yy or 3,4
i. The x-intercepts are 3 , 6, and 10.
j. The y-intercept is 3.
k. The line 1 2 y intersects the graph 3 times.
l. The line 5 x intersects the graph 1 time.
m. ()3 when 0 and 4. fxxx
n. ()2 when 5 and 8. fxxx
84.
a. (0)0 since (0,0) is on the graph. f (6)0 since (6,0) is on the graph. f
b. (2)2 since (2,2) is on the graph. f (2)1 since (2,1) is on the graph. f
c. (3) is negative since (3)1. ff
d. (1) is positive since (1)1.0. ff
e. ()0 when 0,4, and 6. fxxxx
f. ()0 when 04.fxx
g. The domain of f is 46xx or 4,6
h. The range of f is 23yy or 2,3
i. The x-intercepts are 0, 4, and 6.
j. The y-intercept is 0.
k. The line 1 y intersects the graph 2 times.
l. The line 1 x intersects the graph 1 time.
m. ()3 when 5. fxx
n. ()2 when 2. fxx
85. Not a function since vertical lines will intersect the graph in more than one point.
86. Function
a. Domain: is any real number xx ; Range: 0 yy
b. Intercepts: (0,1)
c. None
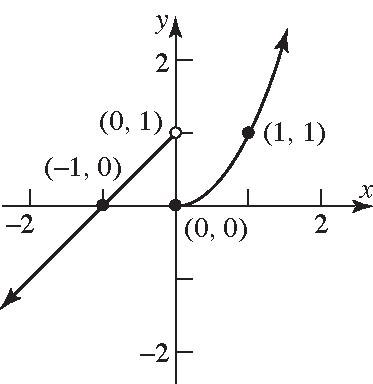
87. Function
a. Domain: xx ; Range: 11yy
b. Intercepts: ,0, ,0, (0,1) 22
c. Symmetry about y-axis.
88. Function
a. Domain: xx ; Range: 11yy
b. Intercepts: ,0, ,0, (0,0)
c. Symmetry about the origin.
89. Not a function since vertical lines will intersect the graph in more than one point.
90. Not a function since vertical lines will intersect the graph in more than one point.
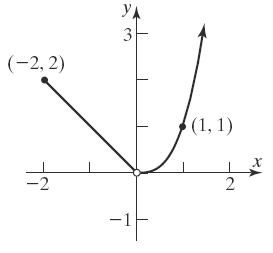
91. Function
a. Domain: 03xx ;
Range: <2 yy
b. Intercepts: (1, 0)
c. None
92. Function
a. Domain: 04xx ;
Range: 03yy
b. Intercepts: (0, 0)
c. None
93. Function
a. Domain: is any real number xx ;
Range: 2 yy
b. Intercepts: (–3, 0), (3, 0), (0,2)
c. Symmetry about y-axis.
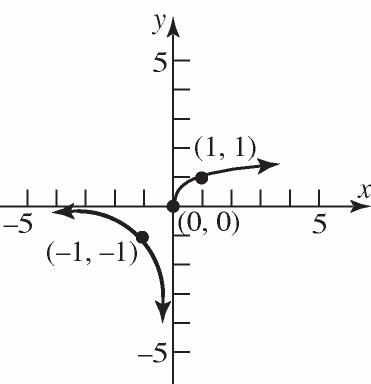
94. Function
a. Domain: 3 xx ;
Range: 0 yy
b. Intercepts: (–3, 0), (2,0), (0,2)
c. None
95. Function
a. Domain: is any real number xx ;
Range: 3 yy
b. Intercepts: (1, 0), (3,0), (0,9)
c. None
96. Function
a. Domain: is any real number xx ;
Range: 5 yy
b. Intercepts: (–1, 0), (2,0), (0,4)
c. None
97. 2 ()21 fxxx
a. 2 (1)21112 f
The point 1,2 is on the graph of f
b. 2 (2)22219 f
The point 2,9 is on the graph of f.
c. Solve for x : 2 2 1 2 121 02 0210, xx xx xxxx (0, –1) and 1 2 ,1 are on the graph of f
d. The domain of f is is any real number xx .
e. x-intercepts: 2 =0210 1 2110,1 2 1 ,0 and 1,0 2 fxxx xxxx
f. y-intercept:
2 0=200110,1 f
98. 2 ()35 fxxx
a.
2 (1)315182 f
The point 1,2 is not on the graph of f.
b. 2 (2)3252=22 f
The point 2,22 is on the graph of f
c. Solve for x : 22 1 3 2353520 3120,2 xxxx xxxx
(2, –2) and 1 3 ,2 on the graph of f .
d. The domain of f is is any real number xx
e. x-intercepts: 2 5 3 5 3 =0350 3500, 0,0 and ,0 fxxx xxxx
f. y-intercept: 2 0305000,0 f
99. 2 () 6 fxx x
a. 325 (3)14 363 f
The point 3,14 is not on the graph of f
b. 426 (4)3 462 f
The point 4,3 is on the graph of f.
c. Solve for x : 2 2 6 2122 14 x x xx x (14, 2) is a point on the graph of f
d. The domain of f is 6 xx .
e. x-intercepts:
2 =00 6 2022,0 fxx x xx
f. y-intercept: 0211 00,0633
100. 2 2 () 4 fxx x
a. 2 123 (1) 145 f
The point 3 1, 5
is on the graph of f.
b. 2 0221 (0) 0442 f
The point 1 0, 2
c. Solve for x :
is on the graph of f
2 2 2 12 424 24 02 1 2100 or 2 x xx x xx xxxx
are on the graph of f
Section1.3: Functions and Their Graphs
d. The domain of f is 4 xx
e. x-intercepts: 2 2 2 =0020 4 x fxx x
This is impossible, so there are no xintercepts.
f. y-intercept:
2 02211 00, 04422 f
101. 2 4 2 () 1 fxx x
a. 2 4 2(1)2 (1)1 2 (1)1 f
The point (–1,1) is on the graph of f
b. 2 4 2(2)8 (2) 17 (2)1 f
The point 8 2, 17 is on the graph of f
c. Solve for x : 2 4 42 42 22 2 1 1 12 210 (1)0 x x xx xx x 2 101xx (1,1) and (–1,1) are on the graph of f .
d. The domain of f is is any real number xx
e. x-intercept: 2 4 2 2 =00 1 2000,0 fxx x xx
f. y-intercept: 2 4 20 0 000,0 01 01 f
Chapter1: Graphs and Functions
102. 2 () 2fxx x
a. 1 2 112 2 13 23 2 22 f
The point 12 , 23
is on the graph of f.
b. 2(4)8 (4)4 422 f
The point 4,4 is on the graph of f
c. Solve for x : 2 2 122 2 x xxx x
(–2,1) is a point on the graph of f
d. The domain of f is 2 xx .
e. x-intercept:
f y-intercept:
103. 2 2 1123 280 (4)(2)0 40 or 20 4 2
xx xx xx xx xx
The solution set is 2,4 104. 753 1664 55 166 65 516 3 8
x x x x
The solution set is 3 8
105. 32 ()245 and (2)5 fxxAxxf 32 (2)2(2)(2)4(2)5 516485 5419 144 147 42 fA A A A A
106. 2 ()34 and (1)12 fxxBxf : 2 (1)3(1)(1)4 1234 5 fB B B
107. 38 () and (0)2 2 x fxf xA 3(0)8 (0) 2(0) 8 2 28 4 fA A A A
108. 21 () and (2) 342 xB fxf x 2(2) (2) 3(2)4 14 210 54 1 B f B B B
109. Let x represent the length of the rectangle. Then, 2 x represents the width of the rectangle since the length is twice the width. The function for the area is: 2 2 1 () 222 Axxxxx
110. Let x represent the length of one of the two equal sides. The function for the area is: 2 11 () 22 Axxxx
111. Let x represent the number of hours worked. The function for the gross salary is: ()14 Gxx
112. Let x represent the number of items sold. The function for the gross salary is:
113. a.
b. 2 2 2 15 152013 513 0.3846 0.62 seconds Hx x x x x
2 2 2 10 102013 1013
0.88 seconds Hx x x x x
2 2 2 5 52013 1513 1.1538 1.07 seconds Hx x x x x
c. 0 Hx 2 2 2 02013 2013 1.5385 1.24 seconds x x x x
115. 36,000 100 10 x Cx x
50036,000 500100 10500 1005072 $222 C
45036,000 450100 10450 1004580 $225 C
c. From part (a) we know the point 8,10.4 is on the graph and from part (b) we know the point 12,9.9 is on the graph. We could evaluate the function at several more values of x (e.g. 0 x , 15 x , and 20 x ) to obtain additional points.
Some additional points are 0,6 , 15,8.4 and 20,3.6 . The complete graph is given below.
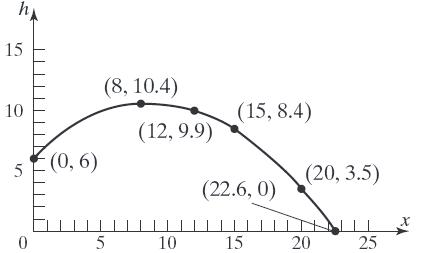
No; when the ball is 15 feet in front of the foul line, it will be below the hoop. Therefore it cannot go through the hoop.
In order for the ball to pass through the hoop, we need to have 1510 h
The ball must be shot with an initial velocity of 30 feet per second in order to go through the hoop.
a. We want
b.
The ball needs to be thrown with an initial velocity of 30 feet per second.
which simplifies to
c. Using the velocity from part (b),
The ball will be 15.56 feet above the floor when it has traveled 9 feet in front of the foul line.
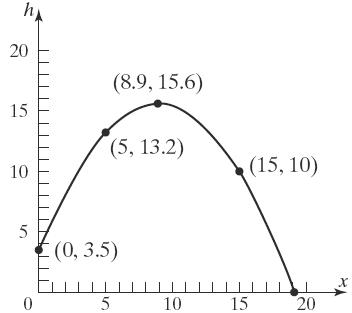
d. Select several values for x and use these to find the corresponding values for h. Use the results to form ordered pairs , xh . Plot the points and connect with a smooth curve.
Thus, some points on the graph are 0,3.5 ,
5,13.2 , and 15,10 . The complete graph is given below.

f. Use INTERSECT on the graphs of 2


The ball reaches a height of 90 feet twice. The first time is when the ball has traveled approximately 115.07 feet, and the second time is when the ball has traveled about 413.05 feet.
g. The ball travels approximately 275 feet before it reaches its maximum height of approximately 131.8 feet.
h. The ball travels approximately 264 feet before it reaches its maximum height of approximately 132.03 feet.
120. a. 05000 C
This represents the fixed overhead costs. That is, the company will incur costs of $5000 per day even if no computers are manufactured.
b. 1019,000 C
It costs the company $19,000 to produce 10 computers in a day.
c. 5051,000 C
It costs the company $51,000 to produce 50 computers in a day.
d. The domain is |080 qq . This indicates that production capacity is limited to 80 computers in a day.
e. The graph is curved down and rises slowly at first. As production increases, the graph becomes rises more quickly and changes to being curved up.
f. The inflection point is where the graph changes from being curved down to being curved up.
121. a. 0$50 C
It costs $50 if you use 0 gigabytes.
b. 5$50 C
It costs $50 if you use 5 gigabytes.
c. 15$150 C
It costs $150 if you use 15 gigabytes.
d. The domain is g|030 g . This indicates that there are at most 30 gigabytes in a month.
e. The graph is flat at first and then rises in a straight line.
122. a. 2 hxx 222 hababab hahb 2 hxx has the property.
b. 2 gxx 2 22 2 gababaabb Since 2222 2 aabbabgagb , 2 () gxx does not have the property.
c. 52Fxx
52552Fababab Since
x fx
124. 2 4 32 54
f 125. (2)5(2)4
gf Since 2 (2)(2)4(2) 12
Section1.3: Functions and Their Graphs
c c c c
fc c we have 2 12 45 3 12 9 3 1227 15 (3)3431512
126. 2 (5)525 ((5))(25)2524 so, 252 254 21
gnn fgfnn n n n 22 ()(21)(21)420 gnnn .
127. Answers will vary. From a graph, the domain can be found by visually locating the x-values for which the graph is defined. The range can be found in a similar fashion by visually locating the y-values for which the function is defined. If an equation is given, the domain can be found by locating any restricted values and removing them from the set of real numbers. The range can be found by using known properties of the graph of the equation, or estimated by means of a table of values.
128. The graph of a function can have any number of x-intercepts. The graph of a function can have at most one y-intercept (otherwise the graph would fail the vertical line test).
129. Yes, the graph of a single point is the graph of a function since it would pass the vertical line test. The equation of such a function would be something like the following: 2 fx , where
7 x .
130. (a) III; (b) IV; (c) I; (d) V; (e) II
131. (a) II; (b) V; (c) IV; (d) III; I I
132.

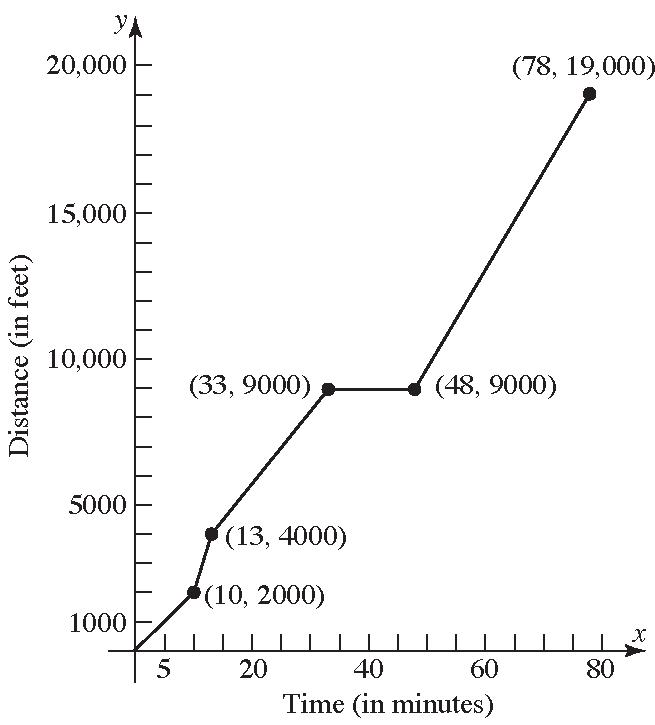
134. a. 2 hours elapsed; Kevin was between 0 and 3 miles from home.
b. 0.5 hours elapsed; Kevin was 3 miles from home.
c. 0.3 hours elapsed; Kevin was between 0 and 3 miles from home.
d. 0.2 hours elapsed; Kevin was at home.
e. 0.9 hours elapsed; Kevin was between 0 and 2.8 miles from home.
f. 0.3 hours elapsed; Kevin was 2.8 miles from home.
g. 1.1 hours elapsed; Kevin was between 0 and 2.8 miles from home.
h. The farthest distance Kevin is from home is 3 miles.
i. Kevin returned home 2 times.
135. a. Michael travels fastest between 7 and 7.4 minutes. That is, 7,7.4
b. Michael's speed is zero between 4.2 and 6 minutes. That is, 4.2,6 .
c. Between 0 and 2 minutes, Michael's speed increased from 0 to 30 miles/hour.
d. Between 4.2 and 6 minutes, Michael was stopped (i.e, his speed was 0 miles/hour).
e. Between 7 and 7.4 minutes, Michael was traveling at a steady rate of 50 miles/hour.
f. Michael's speed is constant between 2 and 4 minutes, between 4.2 and 6 minutes, between 7 and 7.4 minutes, and between 7.6 and 8 minutes. That is, on the intervals (2, 4), (4.2, 6), (7, 7.4), and (7.6, 8).
136. Answers (graphs) will vary. Points of the form (5, y) and of the form (x, 0) cannot be on the graph of the function.
137. The only such function is 0 fx because it is the only function for which fxfx . Any other such graph would fail the vertical line test.
138. Answers may vary.
Section 1.4
1. 25 x
2. 835 slope1 5 32 y x
3. x-axis: yy 2 2 2 51 51 51 different yx yx yx
y-axis: xx
2 2 51 51 same yx yx
origin: xx and yy
2 2 2 51 51 51 different yx yx yx
The equation has symmetry with respect to the y-axis only.
Section1.4: Properties of Functions
The intercepts are 3,0 , 3,0 , and 0,9
6. increasing
7. even; odd
8. True
9. True
10. False; odd functions are symmetric with respect to the origin. Even functions are symmetric with respect to the y-axis.
11. c
12. d
13. Yes
14. No, it is increasing.
15. No
16. Yes
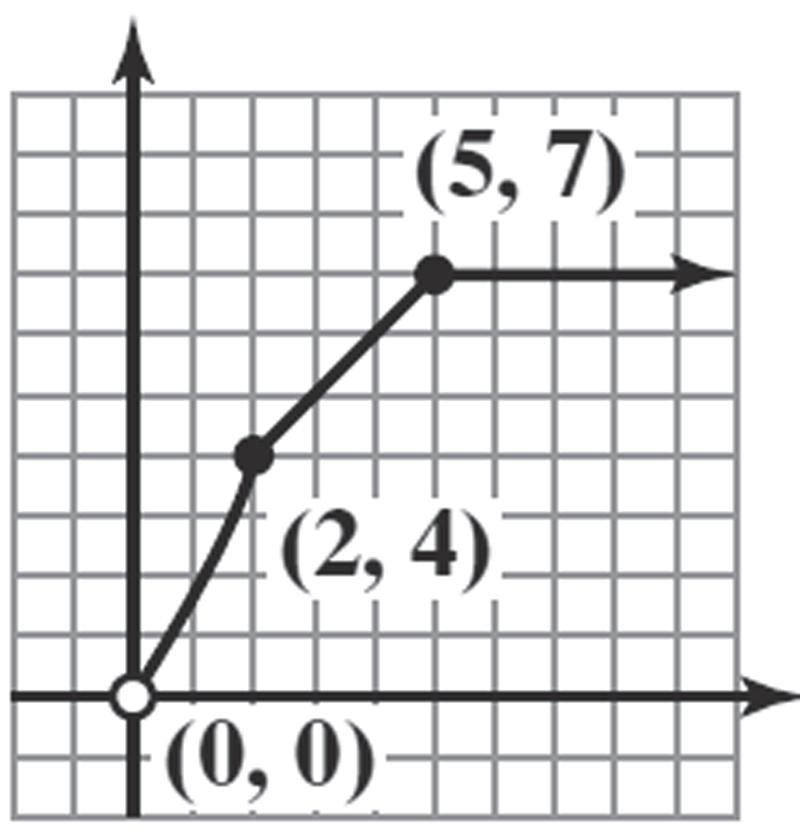
17. f is increasing on the intervals 8,2,0,2,5,7 .
18. f is decreasing on the intervals: 10,8,2,0,2,5 .
19. Yes. The local maximum at 2 is 10. x
20. No. There is a local minimum at 5 x ; the local minimum is 0.
21. f has local maxima at 2 and 2 xx . The local maxima are 6 and 10, respectively.
4.
11 253 253 yymxx yx yx
5. 2 9 yx
x-intercepts: 2 2 09 93 x xx
y-intercept: 2 099 y
22. f has local minima at 8,0 and 5 xxx . The local minima are –4, 0, and 0, respectively.
23. f has absolute minimum of 4 at x = –8.
24. f has absolute maximum of 10 at x = 2.
25. a. Intercepts: (–2, 0), (2, 0), and (0, 3).
b. Domain: 44xx or 4,4 ;
Range: 03yy or 0,3 .
c. Increasing: [–2, 0] and [2, 4]; Decreasing: [–4, –2] and [0, 2].
d. Since the graph is symmetric with respect to the y-axis, the function is even.
26. a. Intercepts: (–1, 0), (1, 0), and (0, 2).
b. Domain: 33xx or 3,3 ; Range: 03yy or 0,3
c. Increasing: [–1, 0] and [1, 3]; Decreasing: [–3, –1] and [0, 1].
d. Since the graph is symmetric with respect to the y-axis, the function is even.
27. a. Intercepts: (0, 1).
b. Domain: is any real number xx ; Range: 0 yy or 0,
c. Increasing: (,) ; Decreasing: never.
d. Since the graph is not symmetric with respect to the y-axis or the origin, the function is neither even nor odd.
28. a. Intercepts: (1, 0).
b. Domain: 0 xx or 0, ;
Range: is any real number yy
c. Increasing: [0,) ; Decreasing: never.
d. Since the graph is not symmetric with respect to the y-axis or the origin, the function is neither even nor odd.
29. a. Intercepts: (,0),(,0), and (0,0) .
b. Domain: xx or , ; Range: 11yy or
c. Increasing: , 22
; Decreasing: , and , 22
d. Since the graph is symmetric with respect to the origin, the function is odd.
30. a. Intercepts: ,0,,0, and (0,1) 22
b. Domain: xx
Range:
;
or
1,1 .
c. Increasing: ,0 ; Decreasing: 0,
d. Since the graph is symmetric with respect to the y-axis, the function is even.
31. a. Intercepts: 151 ,0,,0, and 0, 322
b. Domain: 33xx or 3,3 ; Range: 12yy or 1,2
c. Increasing: 2,3 ; Decreasing: 1,1 ; Constant: 3,1 and 1,2
d. Since the graph is not symmetric with respect to the y-axis or the origin, the function is neither even nor odd.
32. a. Intercepts: 2.3,0,3,0, and 0,1 .
b. Domain: 33xx or 3,3 ; Range: 22yy or 2,2
c. Increasing: 3,2 and 0,2 ; Decreasing: 2,3 ; Constant: 2,0 .
d. Since the graph is not symmetric with respect to the y-axis or the origin, the function is neither even nor odd.
33. a. f has a local maximum value of 3 at 0. x
b. f has a local minimum value of 0 at both 2 and 2. xx
34. a. f has a local maximum value of 2 at 0. x
b. f has a local minimum value of 0 at both 1 and 1. xx
35. a. f has a local maximum value of 1 at 2 x
b. f has a local minimum value of –1 at . 2 x
36. a. f has a local maximum value of 1 at 0. x
b. f has a local minimum value of –1 both at x and x
37. 3 ()4 fxx
()4()433 fxxxfx Therefore, f is odd.
38. 42 ()2 fxxx
()2()()24242 fxxxxxfx Therefore, f is even.
39. 2 ()10 gxx
()10()1022 gxxxgx Therefore, g is even.
40. 3 ()35hxx 33 ()3()535 hxxx h is neither even nor odd.
41. 3 ()4 Fxx
33 ()44 FxxxFx Therefore, F is odd.
42. () Gxx () Gxx G is neither even nor odd.
43. () fxxx () fxxxxx f is neither even nor odd.
44. 3 2 ()21fxx
3 22 3 ()2()121 fxxxfx
Therefore, f is even.
45. 2 1 () 8 gx x
22 11 () ()88 gxgx xx
Therefore, g is even.
46. 2 () 1 hxx x
22 () ()11 xx hxhx xx
Therefore, h is odd.
47. 3 2 () 39 hxx x 3 3 22 () () 3()939 xx hxhx xx
Therefore, h is odd.
48. 2 () Fxx x
2 2() () FxxxFx xx
Therefore, F is odd.
49. f has an absolute maximum of 4 at 1. x
f has an absolute minimum of 1 at 5. x
f has an local maximum value of 3 at 3. x
f has an local minimum value of 2 at 2. x
50. f has an absolute maximum of 4 at 4. x
f has an absolute minimum of 0 at 5. x
f has an local maximum value of 4 at 4. x
f has an local minimum value of 1 at 1. x
51. f has an absolute minimum of 1 at 1. x
f has an absolute maximum of 4 at x = 3.
f has an local minimum value of 1 at 1. x
f has an local maximum value of 4 at x = 3.
52. f has an absolute minimum of 1 at 0. x
f has no absolute maximum.
f has no local minimum.
f has no local maximum.
53. f has an absolute minimum of 0 at 0. x
f has no absolute maximum.
f has an local minimum value of 0 at 0. x
f has an local minimum value of 2 at 3. x
f has an local maximum value of 3 at 2. x
54. f has an absolute maximum of 4 at 2. x
f has no absolute minimum.
f has an local maximum value of 4 at 2. x
f has an local minimum value of 2 at 0. x
55. f has no absolute maximum or minimum.
f has no local maximum or minimum.
56. f has no absolute maximum or minimum.
f has no local maximum or minimum.
Chapter1: Graphs and Functions
57. 3 32fxxx on the interval 2,2
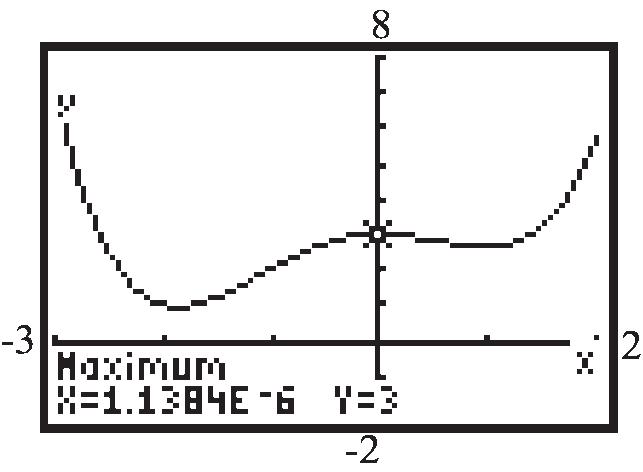
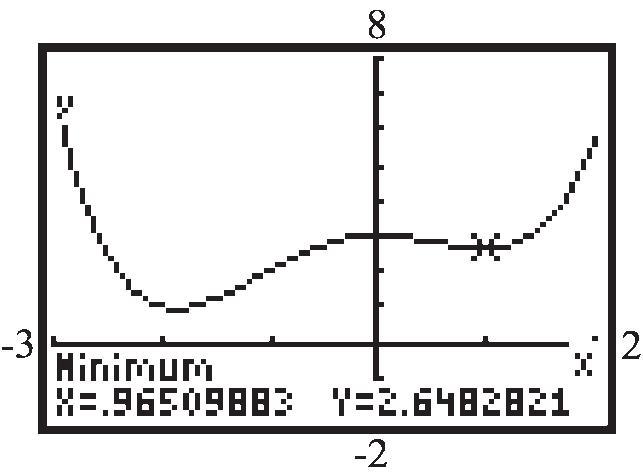
Use MAXIMUM and MINIMUM on the graph of 3 1 32yxx .
local maximum: (1)4 f
local minimum: (1)0 f
f is increasing on:
2,1 and 1,2 ; f is decreasing on:
1,1
58. 3235fxxx on the interval 1,3
Use MAXIMUM and MINIMUM on the graph of 32 1 35yxx

local maximum: (0)5 f
local minimum: (2)1 f f is increasing on:
1,0 and 2,3 ; f is decreasing on:
0,2
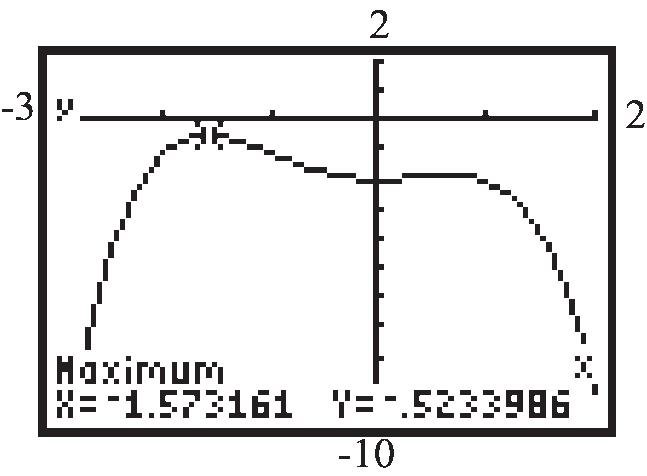
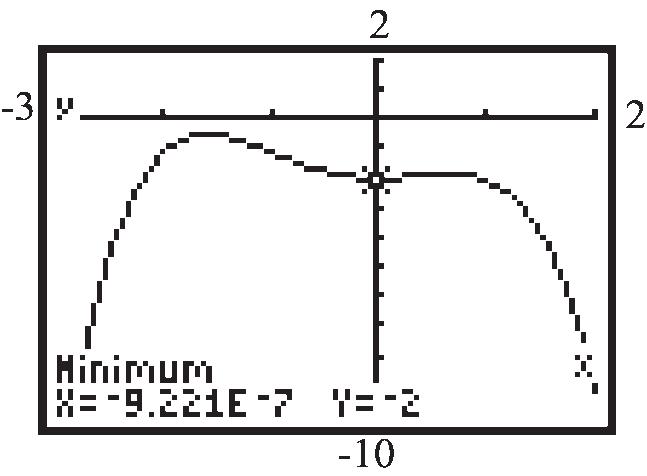
59. 53fxxx on the interval 2,2
Use MAXIMUM and MINIMUM on the graph of 53 1 yxx


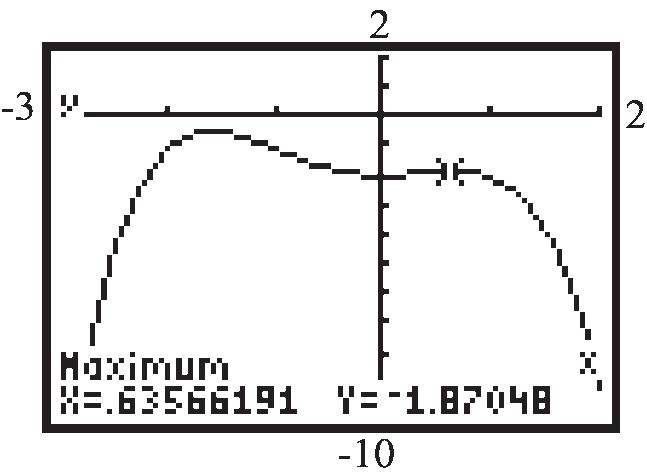
local maximum: (0.77)0.19 f
local minimum: (0.77)0.19 f
f is increasing on: 2,0.77 and 0.77,2 ; f is decreasing on: 0.77,0.77
60. 42fxxx on the interval 2,2
Use MAXIMUM and MINIMUM on the graph of 42 1 yxx
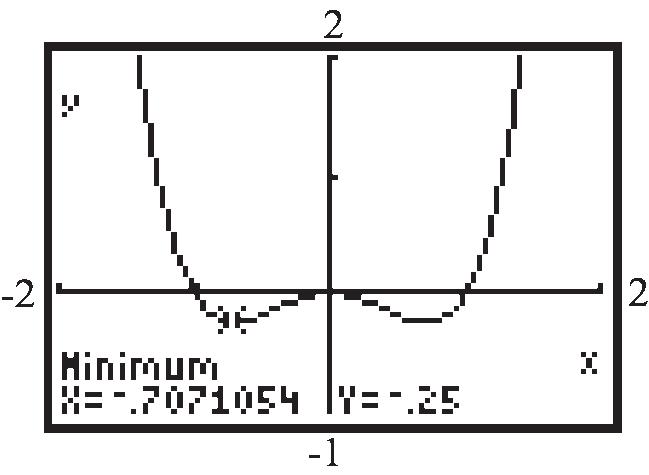
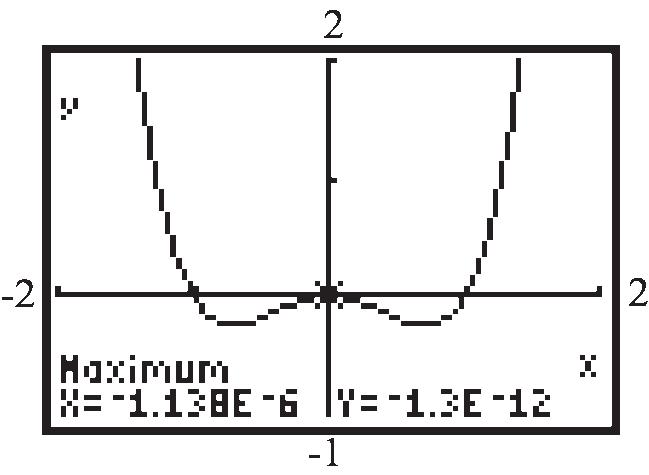
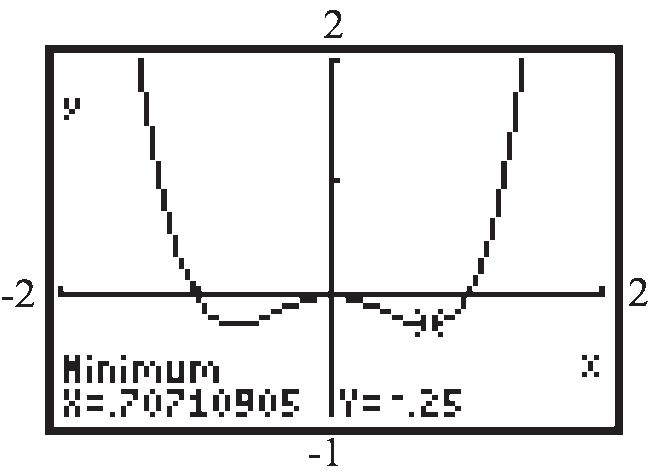
local maximum: (0)0 f
local minimum: (0.71)0.25 f ; (0.71)0.25 f f is increasing on: 0.71,0 and 0.71,2 ; f is decreasing on: 2,0.71 and 0,0.71
61. 32 0.20.646fxxxx on the interval 6,4
Use MAXIMUM and MINIMUM on the graph of 32 1 0.20.646yxxx
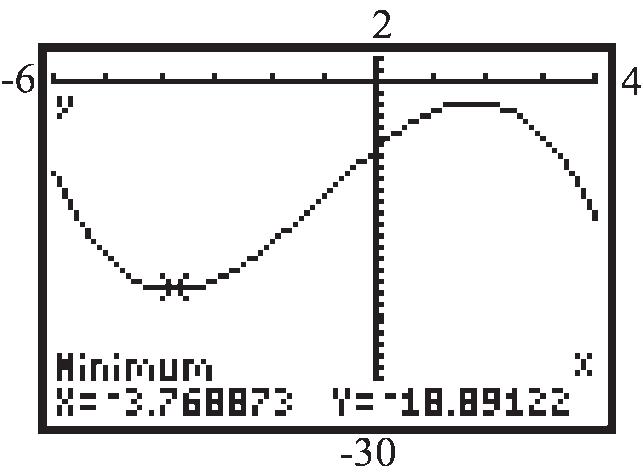
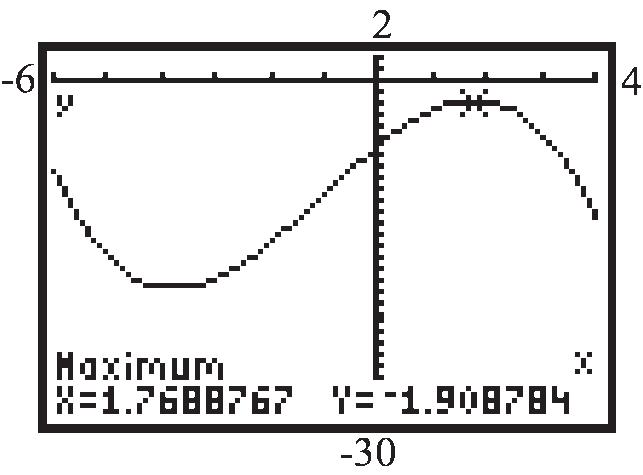
local maximum: (1.77)1.91 f local minimum: (3.77)18.89 f f is increasing on: 3.77,1.77 ; f is decreasing on: 6,3.77 and 1.77,4
62. 32 0.40.632fxxxx on the interval 4,5
Use MAXIMUM and MINIMUM on the graph of 32 1 0.40.632yxxx .
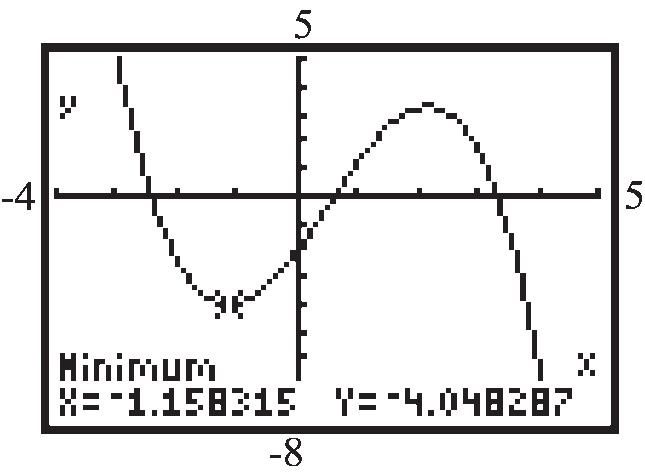

local maximum: (2.16)3.25 f local minimum: (1.16)4.05 f f is increasing on: 1.16,2.16 ; f is decreasing on: 4,1.16 and 2.16,5
63. 432 0.250.30.93fxxxx on the interval 3,2
Use MAXIMUM and MINIMUM on the graph of 432 1 0.250.30.93yxxx
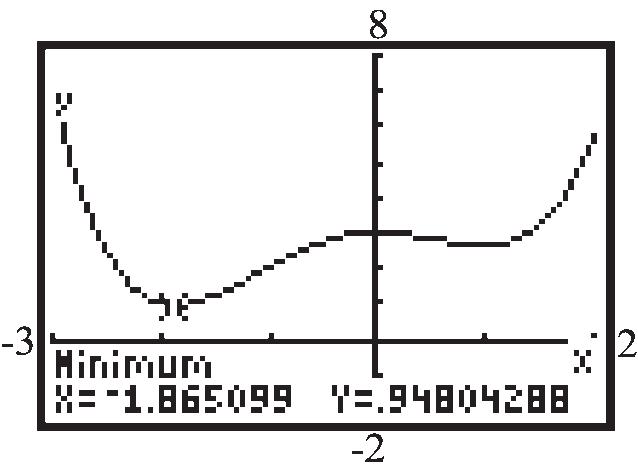
local maximum: (0)3 f local minimum: (1.87)0.95 f , (0.97)2.65 f f is increasing on: 1.87,0 and 0.97,2 ; f is decreasing on: 3,1.87 and 0,0.97
64. 432 0.40.50.82fxxxx on the interval 3,2
Use MAXIMUM and MINIMUM on the graph of 432 1 0.40.50.82yxxx .
local maxima: (1.57)0.52 f , (0.64)1.87 f
local minimum: 0,2 (0)2 f
f is increasing on:
3,1.57 and 0,0.64 ; f is decreasing on:
1.57,0 and 0.64,2
65. 2 ()24fxx
a. Average rate of change of f from 0 x to 2 x
b. Average rate of change of f from x = 1 to x =
c. Average rate of change of f from x = –1 to x = 1:
a. Average rate of change of g from 3 x to 2 x
b. Average rate of change of f from x = 1 to x = 3:
b. Average rate of change of g from 1 x to 1 x
c. Average rate of change of f from x =
a. Average rate of change of h from
b. Average rate of change of h from
69.
c. Average rate of change of h from
52fxx
a. Average rate of change of f from 1 to 3:
Thus, the average rate of change of f from 1 to 3 is 5.
b. From (a), the slope of the secant line joining
1,1 f and
3,3 f is 5. We use the point-slope form to find the equation of the secant line:
1sec1 351 355 52 yymxx yx yx yx
70. 41fxx
a. Average rate of change of f from 2 to 5: 52197 5252 12 4 3 yff x
Therefore, the average rate of change of f from 2 to 5 is 4
b. From (a), the slope of the secant line joining 2,2 f and 5,5 f is 4 . We use the point-slope form to find the equation of the secant line:
1sec1 742 748 41 yymxx yx yx yx
71. 2 2 gxx
a. Average rate of change of g from 2 to 1:
12 123 1 3 1212 ygg x
Therefore, the average rate of change of g from 2 to 1 is 1
b. From (a), the slope of the secant line joining 2,2 g and 1,1 g is 1 .We use the point-slope form to find the equation of the secant line:
1sec1 212 22 yymxx yx yx yx
72. 2 1 gxx
a. Average rate of change of g from 1 to 2:
21 523 1 3 2121 ygg x
Therefore, the average rate of change of g from 1 to 2 is 1.
b. From (a), the slope of the secant line joining 1,1 g and 2,2 g is 1. We use the point-slope form to find the equation of the
Chapter1: Graphs and Functions
secant line:
1sec1 211 21 3 yymxx yx
73. 2 2 hxxx
a. Average rate of change of h from 2 to 4:
42 808 4 42422 yhh x
Therefore, the average rate of change of h from 2 to 4 is 4.
b. From (a), the slope of the secant line joining 2,2 h and 4,4 h is 4. We use the point-slope form to find the equation of the secant line:
1sec1 042 48 yymxx yx
74. 2 2 hxxx
a. Average rate of change from 0 to 3:
30 150 3030 15 5 3 yhh x
Therefore, the average rate of change of h from 0 to 3 is 5
b. From (a), the slope of the secant line joining 0,(0) h and 3,(3) h is 5 . We use the point-slope form to find the equation of the secant line:
3 27 gxxx
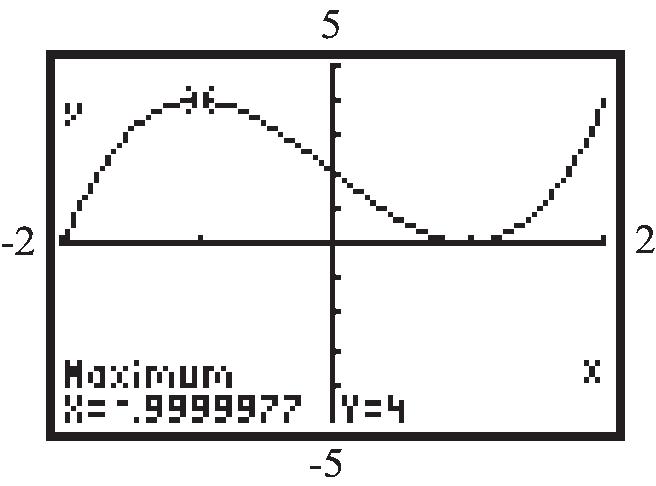
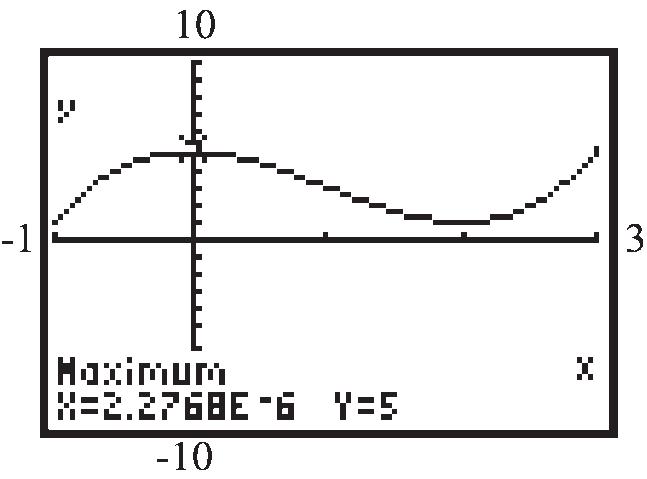
Since
b. Since gx is odd then it is symmetric about the origin so there exist a local maximum at 3 x
3 3(3)27(3)278154 g So there is a local maximum of 54 at 3 x .
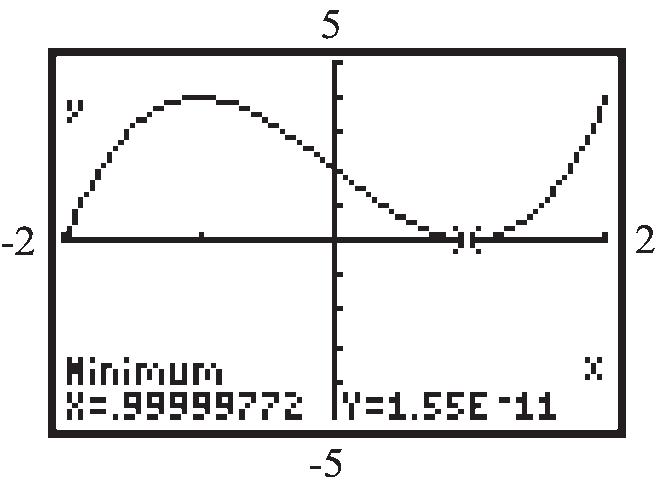
Since fxfx , the function is odd.
b. Since fx is odd then it is symmetric about the origin so there exist a local maximum at 3 x 3 2(2)12(2)82416 f
So there is a local minimum value of 16 at 2 x .
4289Fxxx
42 4 89 89
Fxxx xx Fx
Since FxFx , the function is even.
b. Since the function is even, its graph has y-axis symmetry. The second local maximum value is 25 and occurs at 2 x .
c. Because the graph has y-axis symmetry, the area under the graph between 0 x and 3 x bounded below by the x-axis is the same as the area under the graph between 3 x and 0 x bounded below the x-axis. Thus, the area is 50.4 square units.
78. 4232144Gxxx
a.
42 42 32144 32144 Gxxx xx Gx
Since GxGx , the function is even.
b. Since the function is even, its graph has y-axis symmetry. The second local maximum is in quadrant II and is 400 and occurs at 4 x
c. Because the graph has y-axis symmetry, the area under the graph between 0 x and 6 x bounded below by the x-axis is the same as the area under the graph between 6 x and 0 x bounded below the x-axis. Thus, the area is 1612.8 square units.
79. 2 2500 0.321251Cxxx x
a. 2 1 2500 0.321251yxx

b. Use MINIMUM. Rounding to the nearest whole number, the average cost is minimized when approximately 10 lawnmowers are produced per hour.

c. The minimum average cost is approximately $239 per mower.
80. a. 432 .002.039.285.766.085Cttttt
Graph the function on a graphing utility and use the Maximum option from the CALC menu.

The concentration will be highest after about 2.16 hours.
b. Enter the function in Y1 and 0.5 in Y2. Graph the two equations in the same window and use the Intersect option from the CALC menu.


After taking the medication, the woman can feed her child within the first 0.71 hours (about 42 minutes) or after 4.47 hours (about 4hours 28 minutes) have elapsed.
On average, the population is increasing at a rate of 0.036 gram per hour from 0 to 2.5 hours.
On average, the population is increasing at a
rate of 0.1 gram per hour from 4.5 to 6 hours.
c. The average rate of change is increasing as time passes. This indicates that the population is increasing at an increasing rate.
82. a.
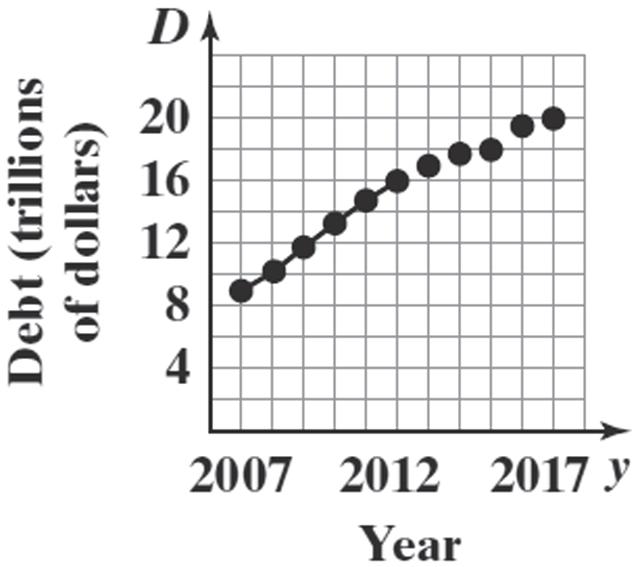
b. The slope represents the average rate of change of the debt from 2007 to 2012.
c.
d.
f. The average rate of change is decreasing as time passes. 83. 2 () fxx
a. Average rate of change of f from 0 x to 1 x
22 10 101 1 1011 ff
b. Average rate of change of f from 0 x to 0.5 x :
2 0.500.502 0.25 0.5 0.500.50.5 ff
c. Average rate of change of f from 0 x to 0.1 x : 2 0.100.102 0.01 0.1 0.100.10.1 ff
d. Average rate of change of f from 0 x to 0.01 x : 2 0.0100.0102 0.0100.01 0.0001 0.01 0.01 ff
e. Average rate of change of f from 0 x to 0.001 x : 2 0.00100.00102 0.00100.001 0.000001 0.001 0.001 ff
f. Graphing the secant lines:
Section1.4: Properties of Functions

g. The secant lines are beginning to look more and more like the tangent line to the graph of f at the point where 0 x
h. The slopes of the secant lines are getting smaller and smaller. They seem to be approaching the number zero. 84. 2 () fxx
a.
b.
c.
d.
e.
f. Graphing the secant lines:

Chapter1: Graphs and Functions
g. The secant lines are beginning to look more and more like the tangent line to the graph of f at the point where 1 x
h. The slopes of the secant lines are getting smaller and smaller. They seem to be approaching the number 2.
a.
b. When 1 x :
sec 0.52hm
sec 0.12hm
sec 0.012hm
sec as 0, 2 hm
c. Using the point
1,11,7 f and slope, 2 m , we get the secant line:
d. Graphing:
The graph and the secant line coincide.
86. ()32fxx
a. sec ()() 3()2(32) 3 3 fxhfx m h xhxh hh
b. When x = 1,
sec 0.53hm sec 0.13hm sec 0.013hm sec as 0, 3 hm
c. Using point 1,11,1 f and slope = 3 , we get the secant line:
131 133 32 yx yx yx
d. Graphing:
The graph and the secant line coincide.
87. 2 ()2 fxxx
a. sec 22 222 2 ()() ()2()(2) 2222 22 22 fxhfx m h xhxhxx h xxhhxhxx h xhhh h xh
b. When x = 1, sec 0.5210.524.5hm sec 0.1210.124.1hm sec 0.01210.0124.01hm sec as 0, 21024 hm
c. Using point 1,11,3 f and slope = 4.01, we get the secant line: 34.011 34.014.01 4.011.01 yx yx yx
d. Graphing:
88. 2 ()2 fxxx
a.
b. When x =
sec as 0, 412015 hm
c. Using point
d. Graphing:

b. When x = 1, sec 0.54120.532hm sec 0.14120.131.2hm sec 0.014120.0131.02hm sec as 0, 412031 hm
c. Using point 1,11,0 f and slope = 1.02, we get the secant line: 01.021 1.021.02 yx yx
d. Graphing:
90. 2 ()32 fxxx
a. sec ()() fxhfx m h 222 222 2 2 2 (2)33232 233232 3232 23 23 xxhhxhxx h xxhhxhxx h xhxhxx h xhhh h xh
b. When x = 1, sec 0.5210.530.5hm sec 0.1210.130.9hm sec 0.01210.0130.99hm sec as 0, 21031 hm
c. Using point 1,11,0 f and slope = 0.99, we get the secant line: 00.991 0.990.99 yx yx
d. Graphing:
d. Graphing:
b. When x = 1,
c. Using point
c. Using point 1,11,1 f and slope = 1.9704 , we get the secant line:
95. Answers will vary. One possibility follows:
d. Graphing:
93. 2 2 (2)12 and (1)8, so (2)(1) 12 4 2(1)3 ()4 3414 3450
x x
The only such number is 219 3
. 94. ()2233
96. Answers will vary. See solution to Problem 89 for one possibility.
97. A function that is increasing on an interval can have at most one x-intercept on the interval. The graph of f could not "turn" and cross it again or it would start to decrease.
98. An increasing function is a function whose graph goes up as you read from left to right. 5
A decreasing function is a function whose graph goes down as you read from left to right.
Chapter1: Graphs and Functions
99. To be an even function we need fxfx and to be an odd function we need fxfx . In order for a function be both even and odd, we would need fxfx . This is only possible if 0 fx
100. The graph of 5 y is a horizontal line.
The local maximum is 5 y and it occurs at each x-value in the interval.
101. Not necessarily. It just means 52ff . The function could have both increasing and decreasing intervals.
102. 21 2121 ()() 0 (2)(2) 00 0 4 22 fxfxbb xxxx ff
The solution set is 2,1
Section 1.5
1. y x 2. y 1 x
3. y x 3 8 y-intercept: Let 0 x , then 3 088 y . x-intercept: Let 0 y , then 3 3 08 8 2 x x x
The intercepts are 0,8 and 2,0 4. ,0
5. piecewise-defined
6. True
7. False; the cube root function is odd and increasing on the interval ,
8. False; the domain and range of the reciprocal function are both the set of real numbers except for 0.
9. b
a
C
A
E
G
B
D
Section1.5: Library of Functions; Piecewise-defined Functions
c. (2)3(3)27 f
28. a. 2326 f
b. 10 f
c. 2 02011 f
29. a. 22240 f
b. 02044 f
c. 12146 f d.
3 33126 f
30. a. 3 (1)(1)1 f
b. 3 (0)00 f
c. (1)3(1)25 f
d. 333211 f
31. 2if 0 () 1 if 0 xx fx x
a. Domain: is any real number xx
b. x-intercept: none y-intercept:
01 f
The only intercept is 0,1.
c. Graph:
d. Range: 0 yy ; ,00,
32. 3if 0 () 4 if 0 xx fx x
a. Domain: is any real number xx
b. x-intercept: none
y-intercept: 04 f
The only intercept is 0,4 .
c. Graph:
d. Range: 0 yy ; ,00,
33. 23if 1 () 32 if 1 xx fx xx
a. Domain: is any real number xx
b. x-intercept: none
y-intercept: 02033 f
The only intercept is 0,3.
c. Graph:
d. Range: 1 yy ; 1,
34. 3if 2 () 23if 2 xx fx xx
a. Domain: is any real number xx
x-intercepts: 3 3, 2
intercept:
c. Graph:

Range:
a. Domain:
intercept: 2
intercept:
The intercepts are
0,3 .
Section1.5: Library of Functions; Piecewise-defined Functions
c. Graph:
d. Range: 4, 5 yyy ;
36. 25if 30 ()3 if 0 5 if 0 xx fxx xx
a. Domain: 3 xx ; 3,
,45
b. 250 25 5 2 x x x 50 0 (not in domain of piece) x x
x-intercept: 5 2
y-intercept: 03 f
The intercepts are 5 ,0 2
and 0,3
c. Graph:
d. Range: 5 yy ; ,5 37. 2 1if 0 () if 0 xx fx xx
a. Domain: is any real number xx
b. 10 1 x x 2 0 0 x x
x-intercepts: 1,0
Chapter1: Graphs and Functions
y-intercept: 2 000 f
The intercepts are 1,0 and 0,0.
c. Graph:
d. Range: is any real number yy
38. 3 1 if 0 () if 0 x fxx xx
a. Domain: is any real number xx
b. 1 0 (no solution) x 3 0 0 x x
x-intercept: 0
y-intercept: 3 000 f
The only intercept is 0,0.
c. Graph:
d. Range: is any real number yy
39. 3 if 20 () if 0 xx fx xx
a. Domain: 20 and 0 xxx or
b. x-intercept: none
There are no x-intercepts since there are no values for x such that 0 fx
y-intercept: There is no y-intercept since 0 x is not in the domain.
c. Graph:
d. Range: 0 yy ; 0,
40. 2if 31 () if 1 xx fx xx
a. Domain: 31 and 1 xxx or |3,1xxx ; 3,11, .
b. 20 2 x x 0 0 (not in domain of piece) x x
no x-intercepts y-intercept: 0202 f The intercept is 0,2.
c. Graph: y 5 x 5 5 5 (3, 5) (0, 2) (4, 2)
d. Range: 1 yy ; 1,
Section1.5: Library of Functions; Piecewise-defined Functions
xx fxxx
41. 2 if 02 ()2 if 25 7 if 5
a. Domain: 0 xx ; 0,
b. 2 0 0 (not in domain of piece) x x 20 2 (not in domain of piece) x x 70 (not possible)
No intercepts.
c. Graph:
d. Range: 07 yy ; 0,7
42. 2 35 if 30 ()5 if 02 1 if 2
a. Domain: 3 xx ; 3,
b. 350 5 3
x x 50 (not possible) 2 2 10 1 (not possible)
x x x-intercept: 5 3 y-intercept: 05 f The intercepts are 5 (0,5) and ,0 3
c. Graph:
d. Range: 4,
43. Answers may vary. One possibility follows: if 10 () 1 if 02 2 xx fx xx
44. Answers may vary. One possibility follows: if 10 () 1 if 02 xx fx x
45. Answers may vary. One possibility follows: if 0 () 2 if 02 xx fx xx
46. Answers may vary. One possibility follows: 22 if 10 () if 0 xx fx xx
b. The domain is 0,6 .
c. Absolute max: (2)6 f Absolute min: (6)2 f
48. a.
b. The domain is 2,2 .
c. Absolute max: (2)(2)3ff Absolute min: none
49. 34.99 if 03 1510.01 if 3 x C xx
a. 2$34.99 C
b. 515510.01$64.99 C
c. 13151310.01$184.99 C
50. 304 41049 74924
a. 2325 F
Parking for 2 hours costs $5.
b. 74(7)1038 F
Parking for 7 hours costs $38.
c. 1574 F
Parking for 15 hours costs $74.
d. 94(9)146 F
Parking for 8 hours and 24 minutes costs $46.
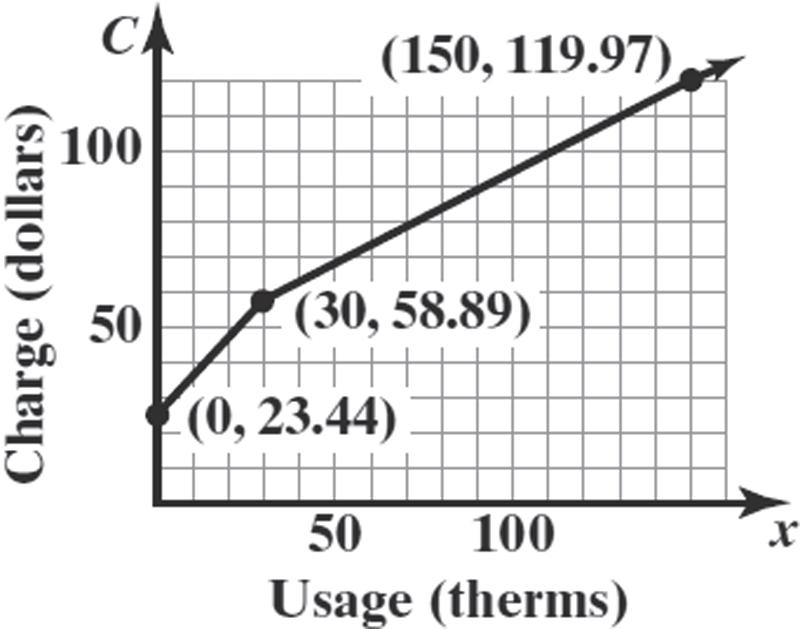
51. a. Charge for 20 therms: 23.440.91686(20)0.26486(20) $47.07 C
b. Charge for 150 therms: 23.440.91686(30)0.26486(30) 0.50897(120) $119.97
C
c. For 030 x : 23.440.916860.26486
1.1817223.44 Cxx x
For 30 x : 23.440.91686300.5089730
Cx x x
0.26486(30) 23.4427.50580.5089715.2691 7.9458 0.5089743.6225
The monthly charge function: 1.1817223.44 if 030 0.5089743.6225 if 30
d. Graph:
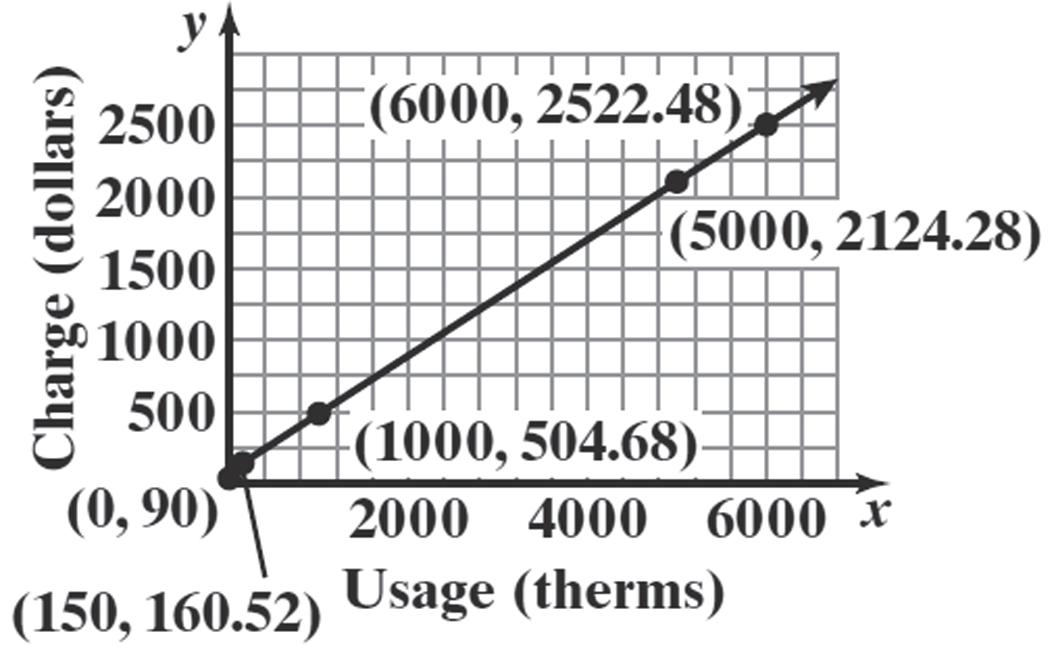
52. a. Charge for 1000 therms:
90.000.1201(150)0.0549(850) 0.35(1000)
$504.68
b. Charge for 6000 therms:
$2522.48
90.000.1201(150)0.0549(4850) +0.048210000.35(6000)
c. For 0150 x : 90.000.12010.35 0.470190.00
Cxx x
For 1505000 x :
Cx x x x x
90.000.12011500.0549150 0.35 90.0018.0150.05498.235 0.35
0.404999.78
Section1.5: Library of Functions; Piecewise-defined Functions
For 5000 x :
90.000.12011500.05494850
0.048250000.35
90.0018.015266.2650.0482241
0.35
0.3982133.28
The monthly charge function:
0.470190.00if0150
0.404982.38if1505000
0.3982115.88if5000
53. For Schedule X: 0.10if 09525
xx
952.500.12(9525)if 952538,700
4453.500.22(38,700)if 38,70082,500 () 14,089.500.24(82,500)if 82,500157,500
xx fxxx x x 57,500200,000 if 200,000500,000
32,089.750.32(157,500)if 1
45,689.500.35(200,000)
150,689.500.37(500,000)if 500,000
54. For Schedule Y1 : 0.10if 019,050
1905.000.12(19,050)if 19,05077,400
8,907.000.22(77,400)if 77,400165,000 ()
28,179.000.24(165,000)if 165,000315,000
64,179.000.32(315,000)
91,379.000.35(400
x x if 315,000400,000 ,000) if 400,000600,000
161,379.000.37(600,000)if 600,000
55. a. Let x represent the number of miles and C be the cost of transportation.
0.50 if 0100
0.50(100)0.40(100) if 100400 ()
0.50(100)0.40(300)0.25(400) if 400800
0.50(100)0.40(300)0.25(400)0(800) if 800960
0.50if 0100
100.40if 100400 () 700.25if 400800
270 if 800960
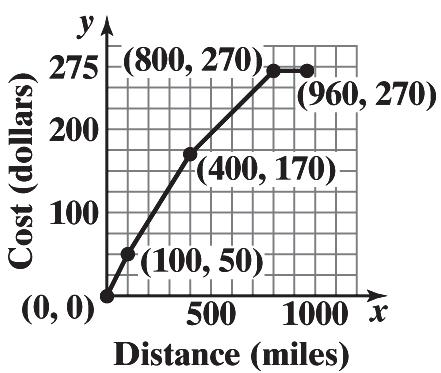
b. For hauls between 100 and 400 miles the cost is: ()100.40 Cxx
c. For hauls between 400 and 800 miles the cost is: ()700.25 Cxx
56. Let x = number of days car is used. The cost of renting is given by
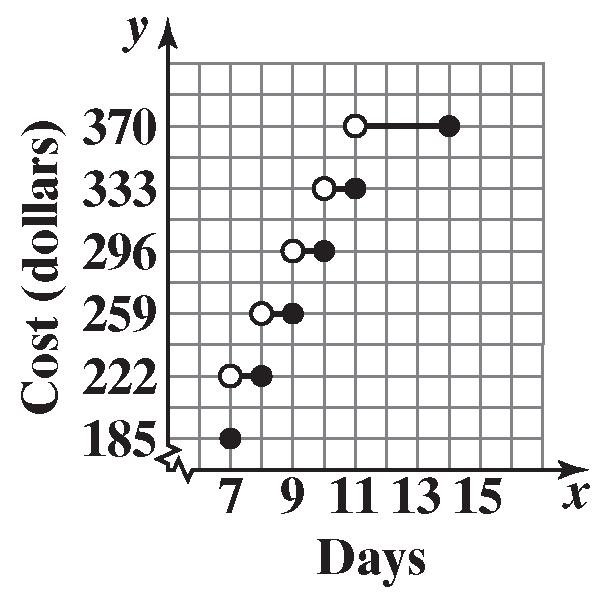
57. a. Let s = the credit score of an individual who wishes to borrow $300,000 with an 80% LTV ratio. The adverse market delivery charge is given by
185 if 7
222 if 78
259 if 89
296 if 910
333 if 1011
370 if 1114 x x x Cx x x x
9000 if 659 8250 if 660679 5250 if 680699 3750 if 700719 2250 if 720739
1500 if 740
b. 725 is between 720 and 739 so the charge would be $2250.
c. 670 is between 660 and 679 so the charge would be $8250.
58. Let x = the amount of the bill in dollars. The minimum payment due is given by
if 010
10 if 10500
30 if 5001000
50 if 10001500
70 if 1500 xx x
x x
Section1.5: Library of Functions; Piecewise-defined Functions

59. a. 10 WC
b. (10.451055)(3310)
WC
334 22.04
c. (10.45101515)(3310) 333 22.04
WC
d. 331.5958(3310)4 WC
e. When 01.79 v , the wind speed is so small that there is no effect on the temperature.
f. When the wind speed exceeds 20, the wind chill depends only on the air temperature.
60. a. 10 WC
b.
d. 331.5958331036 WC
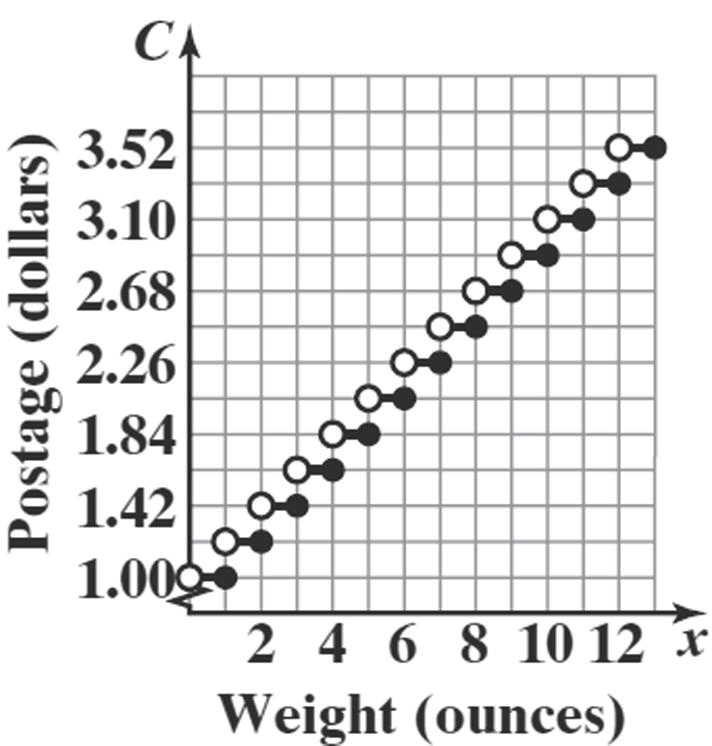
61. Let x = the number of ounces and Cx = the postage due.
For 01 x : $1.00 Cx
For 12 x : 1.000.21$1.21 Cx
For 23 x : 1.0020.21$1.42 Cx
For 34 x : 1.030.21$1.63 Cx
For 1213 x : 1.00120.21$3.52 Cx
62. Use intervals
0,8,8,16,16,32,32,38 (exclude 0 and 38 since those would be the walls). Depth for the intervals
8,16 and 32,38 are constant (8 ft and 3 ft respectively). The other two are linear functions. On 0,8 the endpoint coordinates can be thought or as 0,3 and 8,8
On 16,32 the endpoint coordinates can be thought of as 16,8 and 32,3
13 if 1632
if 3238
Chapter1: Graphs and Functions
63. The function f changes definition at 2 and the function g changes definition at 0. Combining these together, the sum function will change definitions at 0 and 2.
On the interval ,0 : ()()()()(23)(41)
fgxfxgxxx x .
On the interval 0,2 :
fgxfxgxxx x
On
interval
64. Each graph is that of 2 yx , but shifted vertically.
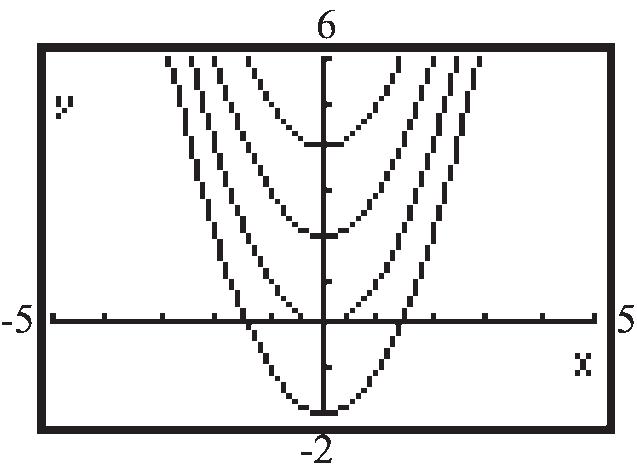
If 2 ,0yxkk , the shift is up k units; if 2 ,0yxkk , the shift is down k units. The graph of 2 4 yx is the same as the graph of 2 yx , but shifted down 4 units. The graph of 2 5 yx is the graph of 2 yx , but shifted up 5 units.
65. Each graph is that of 2 yx , but shifted horizontally.
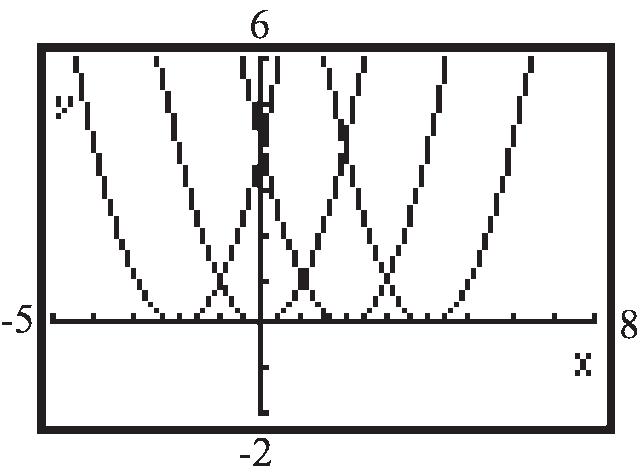
If 2 (),0yxkk , the shift is to the right k units; if 2 (),0yxkk , the shift is to the
left k units. The graph of 2 (4)yx is the same as the graph of 2 yx , but shifted to the left 4 units. The graph of 2 (5)yx is the graph of 2 yx , but shifted to the right 5 units.
66. Each graph is that of yx , but either compressed or stretched vertically.
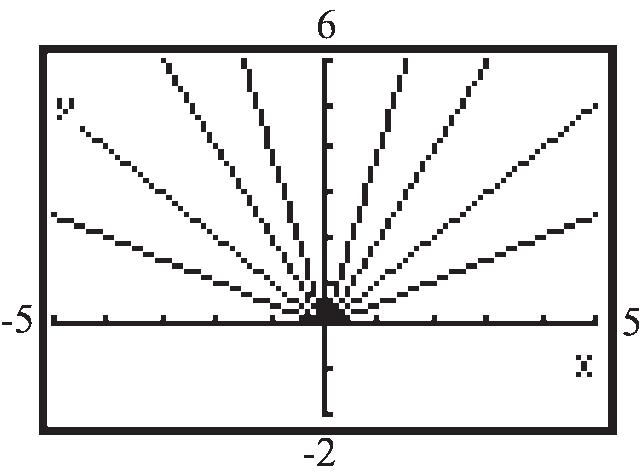
If ykx and 1 k , the graph is stretched vertically; if and 01ykxk , the graph is compressed vertically. The graph of 1 4 yx is the same as the graph of yx , but compressed vertically. The graph of 5 yx is the same as the graph of yx , but stretched vertically.
67. The graph of 2 yx is the reflection of the graph of 2 yx about the x-axis.
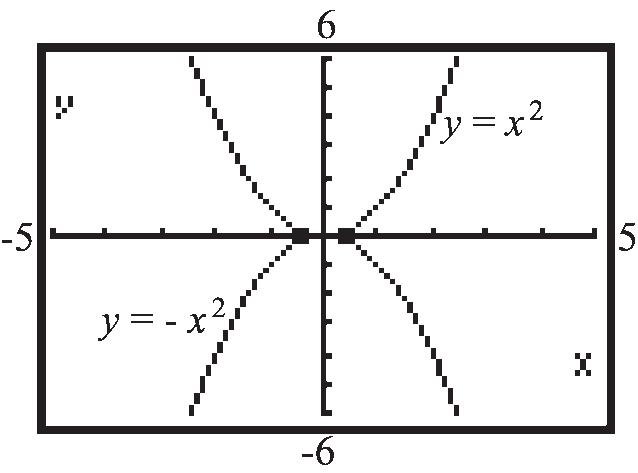
The graph of yx is the reflection of the graph of yx about the x-axis.

Multiplying a function by –1 causes the graph to be a reflection about the x-axis of the original function's graph.
Section1.5: Library of Functions; Piecewise-defined Functions
68. The graph of yx is the reflection about the y-axis of the graph of yx
5 yx yx

The same type of reflection occurs when graphing 21 and 2()1yxyx
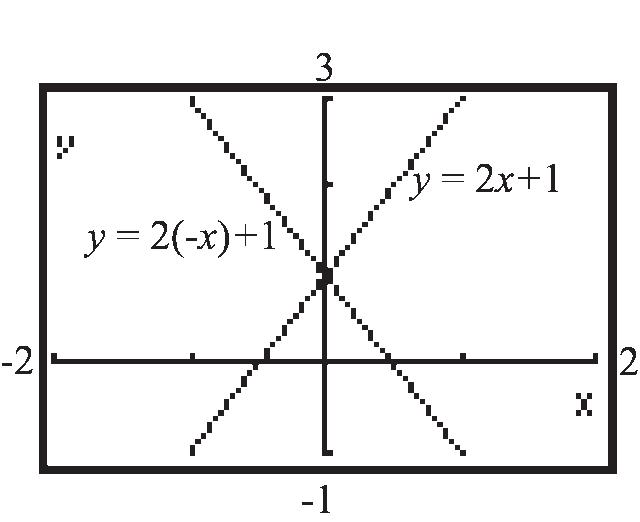
The graph of ()yfx is the reflection about the y-axis of the graph of ()yfx
69. The graph of 3 (1)2yx is a shifting of the graph of 3 yx one unit to the right and two units up. Yes, the result could be predicted.
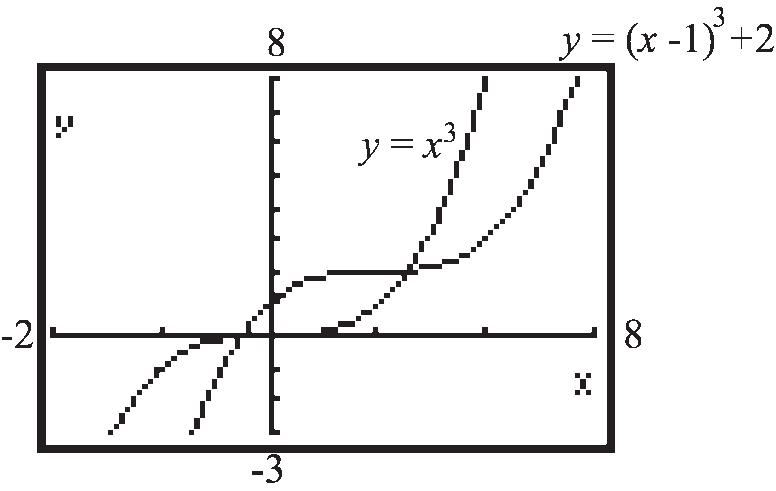
70. The graphs of , n yx n a positive even integer, are all U-shaped and open upward. All go through the points (1,1) , (0,0) , and (1,1) . As n increases, the graph of the function is narrower for 1 x and flatter for 1 x .
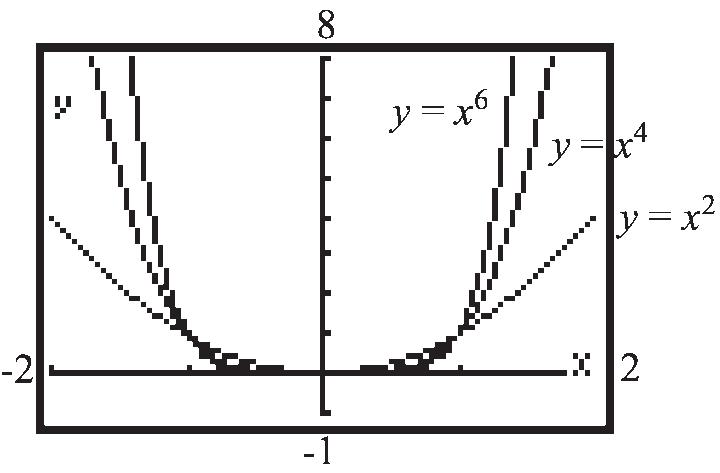
71. The graphs of , n yx n a positive odd integer, all have the same general shape. All go through the points (1,1) , (0,0) , and (1,1) . As n increases, the graph of the function increases at a greater rate for 1 x and is flatter around 0 for 1 x
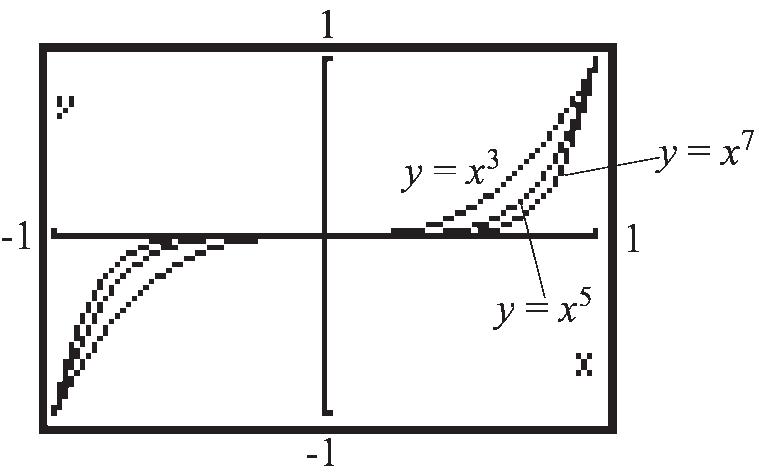
72. 1 if is rational 0 if is irrational x fx x
Yes, it is a function.
Domain = is any real number xx or ,
Range = {0, 1} or |0 or 1 yyy
y-intercept: 0 is rational1xxy
So the y-intercept is 1 y
x-intercept: 0 is irrational yx
So the graph has infinitely many x-intercepts, namely, there is an x-intercept at each irrational value of x. 1 fxfx when x is rational; 0 fxfx when x is irrational. Thus, f is even.
The graph of f consists of 2 infinite clusters of distinct points, extending horizontally in both directions. One cluster is located 1 unit above the x-axis, and the other is located along the x-axis.
73. Answers will vary.
Chapter1: Graphs and Functions
Section 1.6
1. horizontal; right
2. y
3. False
4. True; the graph of yfx is the reflection about the x-axis of the graph of yfx
5. False
6. d
b 8. True
B
E
H
D
I
A
L
C
F
J
G
K
(4)3yx
(4)3yx
3 4 yx
3 4 yx
3 yx
yx 28. 3 3 11 464 yxx
3 5
3 3 28 yxx
30. 3 1 4 yx
31. (1)2 yx
(2)2 (3)22 yx yxx
32. (1) yx (2)3 (3)32 yx yx
33. (1)3 yx (2)34 (3)354 yx yx
34. (1)2 yx (2)2 (3)(3)232 yx yxx
35. (c); To go from yfx to yfx we reflect about the x-axis. This means we change the sign of the y-coordinate for each point on the graph of ()yfx . Thus, the point (3,6) would become 3,6 .
36. (d); To go from yfx to yfx , we reflect each point on the graph of yfx about the y-axis. This means we change the sign of the x-coordinate for each point on the graph of yfx . Thus, the point 3,6 would become 3,6
37. (c); To go from yfx to 2 yfx , we stretch vertically by a factor of 2. Multiply the y-coordinate of each point on the graph of yfx by 2. Thus, the point 1,3 would become 1,6 .
38. (c); To go from yfx to 2 yfx , we compress horizontally by a factor of 2. Divide the x-coordinate of each point on the graph of yfx by 2. Thus, the point 4,2 would become 2,2
39. 2 ()1fxx
Using the graph of 2 yx , vertically shift downward 1 unit.
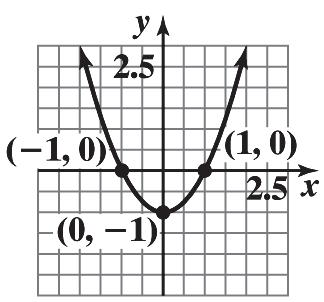
The domain is , and the range is 1,
40. 2 ()4fxx
Using the graph of 2 yx , vertically shift upward 4 units.
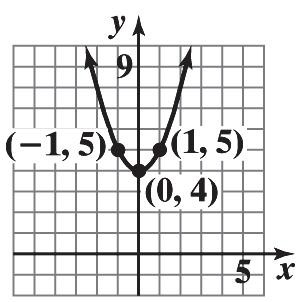
The domain is ,
and the range is
4,
41. ()3 gxx
Using the graph of yx , horizontally compress by a factor of 3.
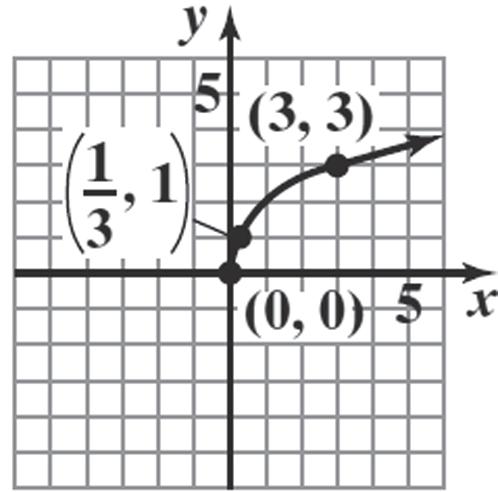
The domain is 0,
and the range is
Section1.6: Graphing Techniques: Transformations
42. 3 1 () 2 gxx
Using the graph of 3 yx , horizontally stretch by a factor of ½.
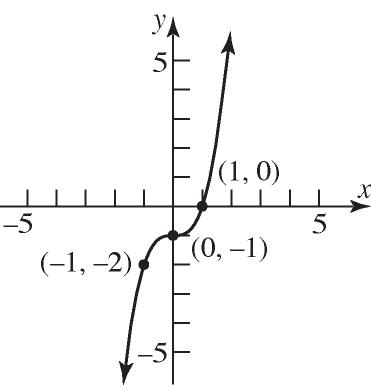
The domain is , and the range is ,
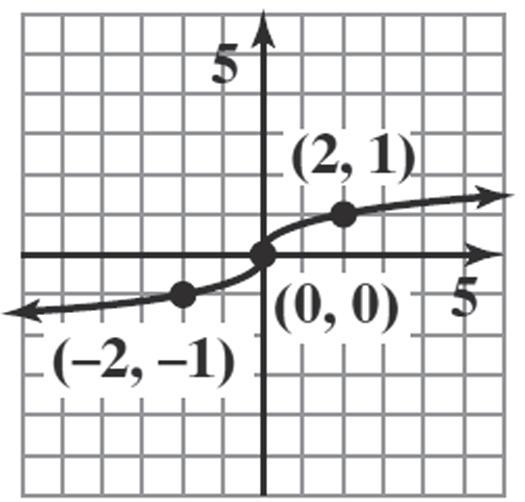
43. ()2hxx
Using the graph of yx , horizontally shift to the left 2 units.
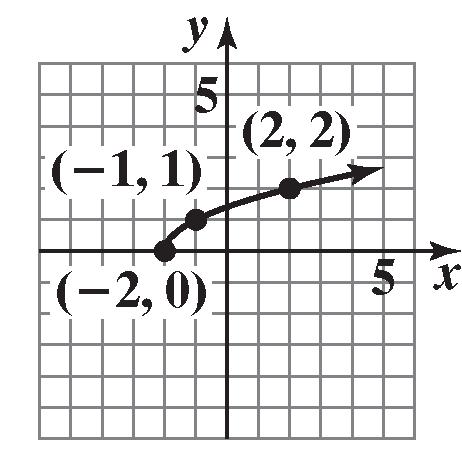
The domain is 2, and the range is 0,
44. ()1hxx
Using the graph of yx , horizontally shift to the left 1 unit.
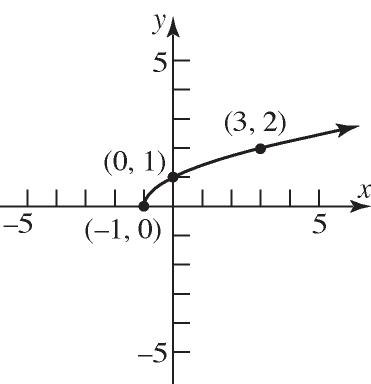
The domain is 1,
and the range is 0,
45. 3 ()(1)2fxx
Using the graph of 3 yx , horizontally shift to the right 1 unit
3 1 yx
, then vertically shift up 2 units
3 12 yx
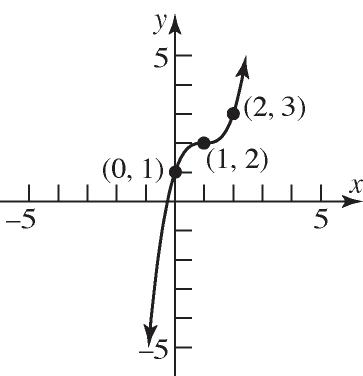
The domain is , and the range is
46. 3 ()(2)3fxx
Using the graph of 3 yx , horizontally shift to the left 2 units
3 2 yx
, then vertically shift down 3 units
3 23 yx
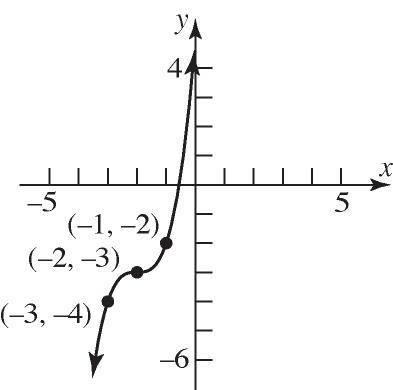
The domain is , and the range is
47. ()4 gxx
Using the graph of yx , vertically stretch by a factor of 4.
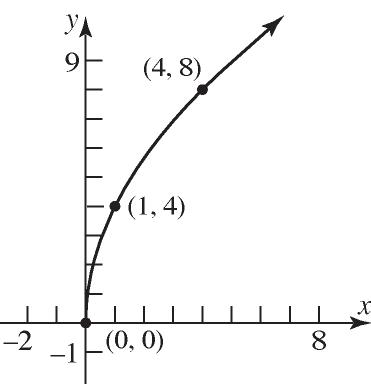
The domain is 0,
and the range is
48. 1 () 2 gxx
Using the graph of yx , vertically compress by a factor of 1 2 .

The domain is 0, and the range is 0,
49. 3 () fxx
Using the graph of 3 yx , reflect the graph about the x-axis.
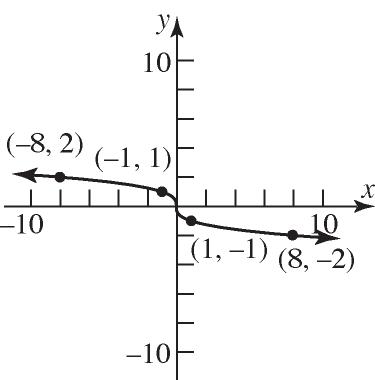
The domain is , and the range is ,
50. () fxx
Using the graph of yx , reflect the graph about the x-axis.
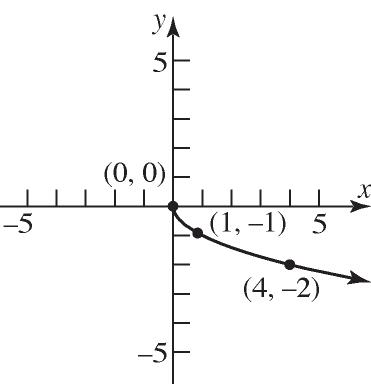
The domain is 0, and the range is ,0
.
51. 2 ()2(1)3fxx
Using the graph of 2 yx , horizontally shift to the left 1 unit 2 1 yx
, vertically stretch by a factor of 2 2 21yx
, and then vertically shift downward 3 units
2 213yx .
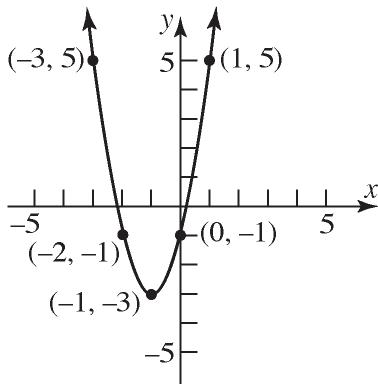
The domain is , and the range is
3,
52. 2 ()3(2)1fxx
Using the graph of 2 yx , horizontally shift to the right 2 units
2 2 yx
, vertically stretch by a factor of 3
2 32yx
, and then vertically shift upward 1 unit
Section1.6: Graphing Techniques: Transformations
2 321yx .
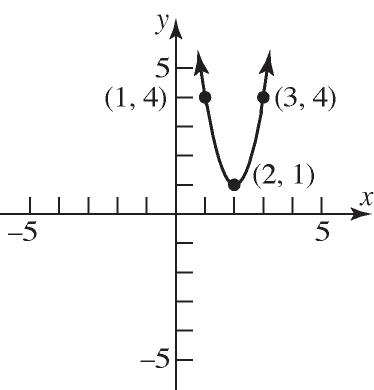
The domain is , and the range is 1,
.
53. ()221gxx
Using the graph of yx , horizontally shift to the right 2 units 2 yx
, vertically stretch by a factor of 2 22yx
, and vertically shift upward 1 unit 221yx .
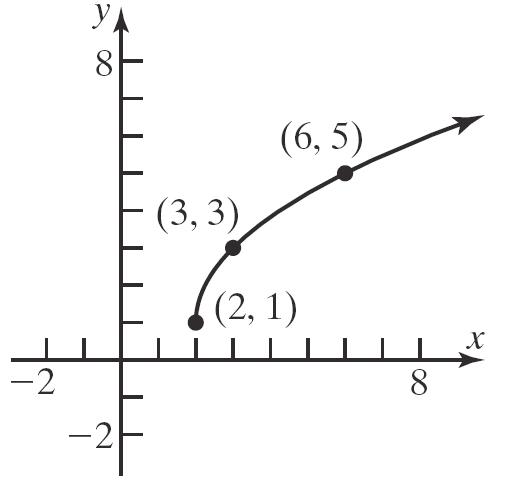
The domain is 2, and the range is
54. ()313gxx
.
Using the graph of yx , horizontally shift to the left 1 unit 1 yx , vertically stretch by a factor of 3 31yx , and vertically shift downward 3 units 313yx .
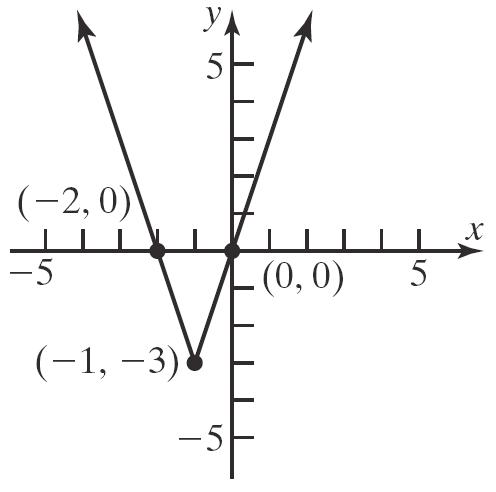
The domain is , and the range is 3,
.
55. ()2hxx
Using the graph of yx , reflect the graph about the y-axis yx
and vertically shift downward 2 units 2 yx
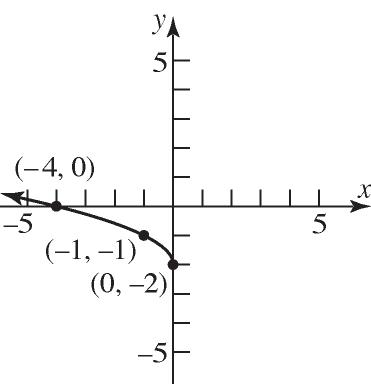
The domain is ,0
56. 41 ()242hx xx
and the range is
Stretch the graph of 1 y x
2,
vertically by a factor of 4 14 4 y
and vertically shift upward 2 units 4 2
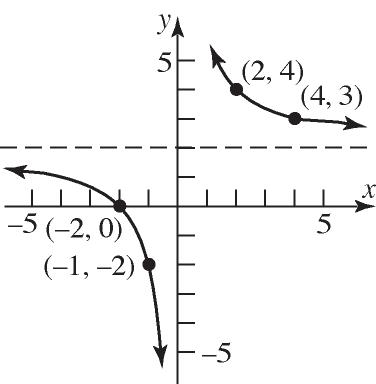
The domain is ,00, and the range is
,22,
57. 3 ()(1)1fxx
Using the graph of 3 yx , horizontally shift to the left 1 unit 3 1 yx
, reflect the graph about the x-axis
3 1 yx
, and vertically shift downward 1 unit 3 11 yx
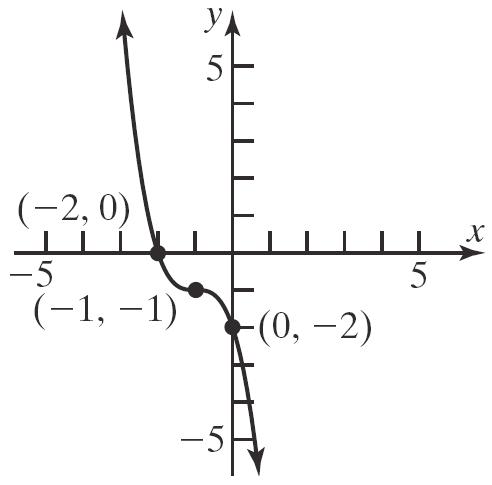
The domain is , and the range is
,
58. ()41fxx
Using the graph of yx , horizontally shift to the right 1 unit 1 yx , reflect the graph about the x-axis 1 yx , and stretch vertically by a factor of 4 41yx .
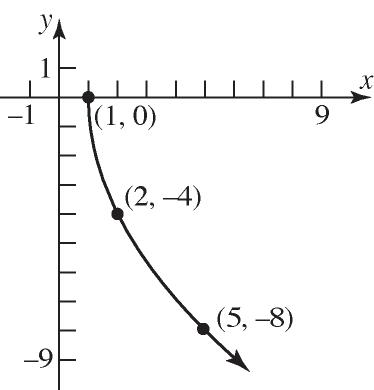
The domain is 1, and the range is ,0
59. ()212121 gxxxx
Using the graph of yx , horizontally shift to the right 1 unit 1 yx
, and vertically stretch by a factor or 2 21yx
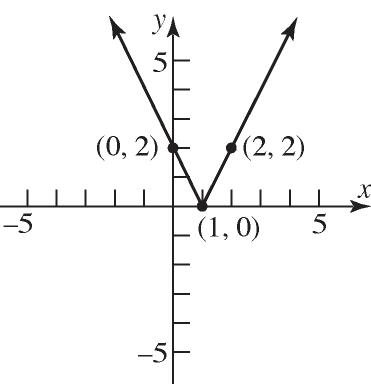
The domain is , and the range is 0, .
60. ()424(2) gxxx
Using the graph of yx , reflect the graph about the y-axis yx
, horizontally shift to the right 2 units
2 yx
, and vertically stretch by a factor of 4
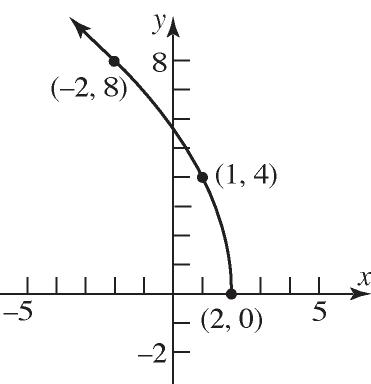
The domain is ,2 and the range is 0,
61. 1 () 2 hx x
Using the graph of 1 y x , vertically compress by a factor of 1 2
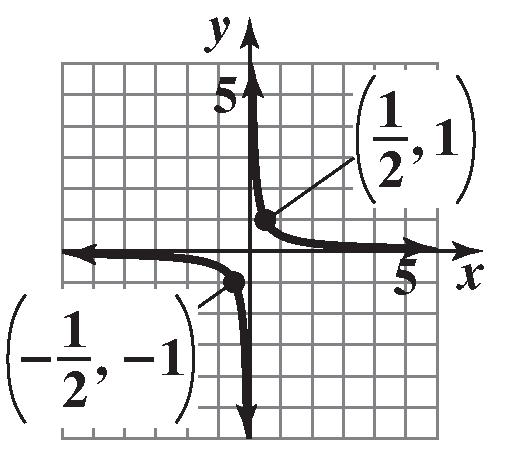
The domain is ,00, and the range is ,00,
62. 3 ()13fxx
Using the graph of 3 () fxx , horizontally shift to the right 1 unit 3 1 yx , then vertically shift up 3 units 3 13 yx
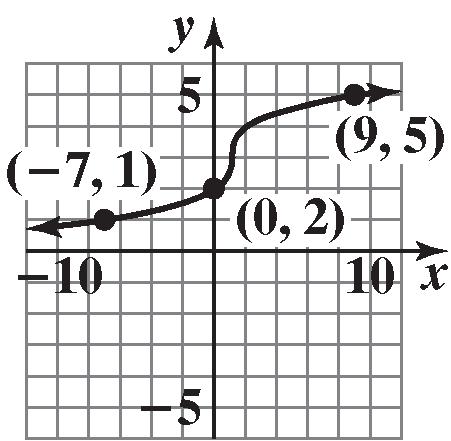
The domain is , and the range is ,
Chapter1: Graphs and Functions
63. a. ()()3Fxfx
Shift up 3 units.
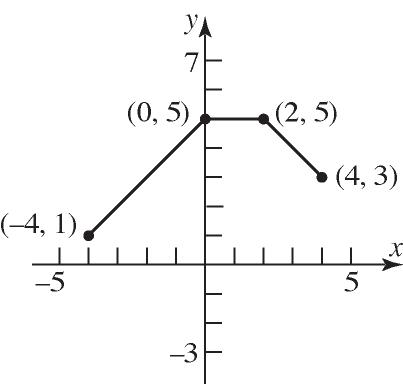
b. ()(2)Gxfx
Shift left 2 units.
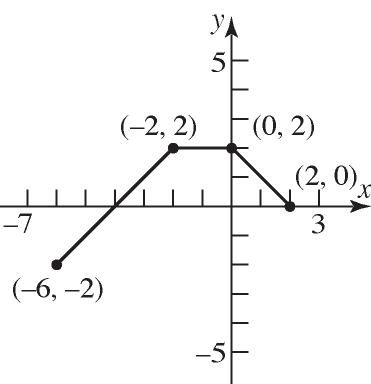
c. ()() Pxfx
Reflect about the x-axis.
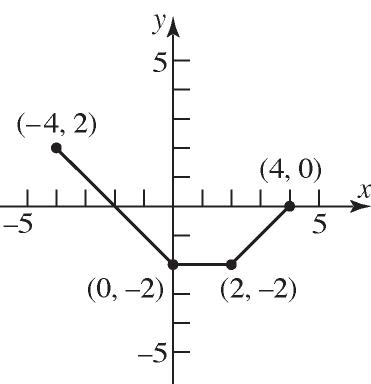
d. ()(1)2Hxfx
Shift left 1 unit and shift down 2 units.
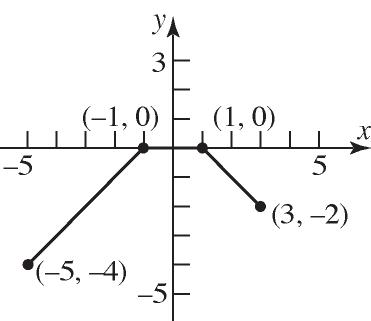
e. 1 ()() 2 Qxfx
Compress vertically by a factor of 1 2 .
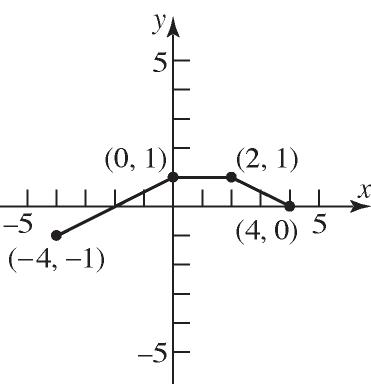
f. ()() gxfx
Reflect about the y-axis.
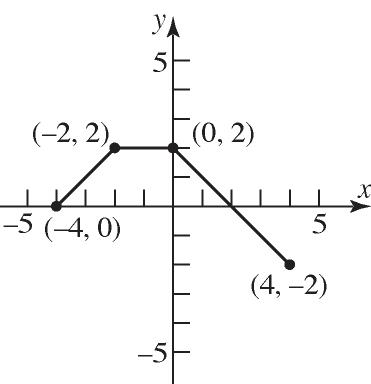
g. ()(2) hxfx
Compress horizontally by a factor of 1 2
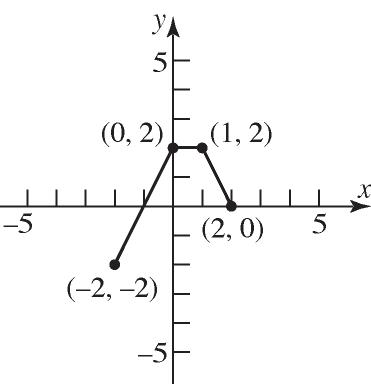
64. a. ()()3Fxfx
Shift up 3 units.
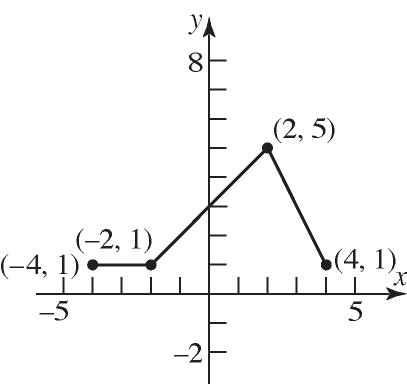
b. ()(2)Gxfx
Shift left 2 units.
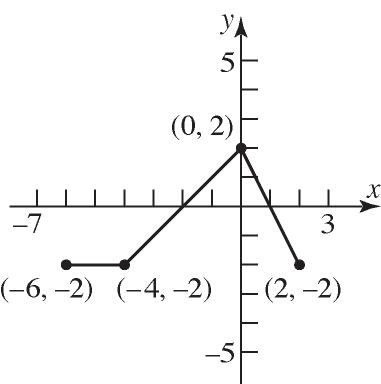
c. ()() Pxfx
Reflect about the x-axis.
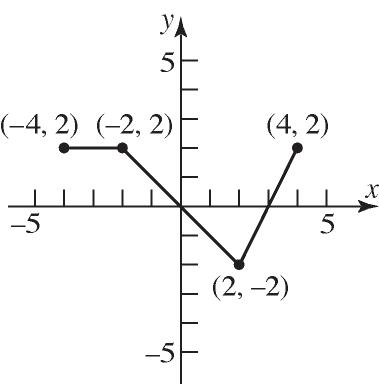
d. ()(1)2Hxfx
Shift left 1 unit and shift down 2 units.
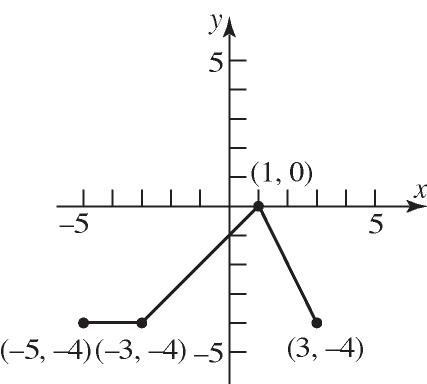
Section1.6: Graphing Techniques: Transformations
e. 1 ()() 2 Qxfx
Compress vertically by a factor of 1 2 .
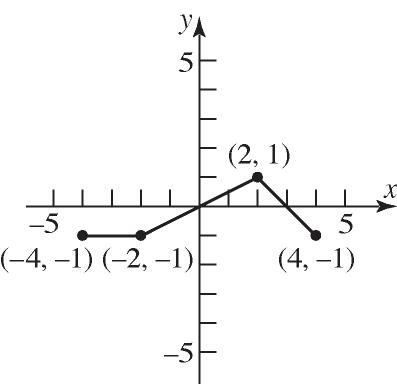
f. ()() gxfx Reflect about the y-axis.
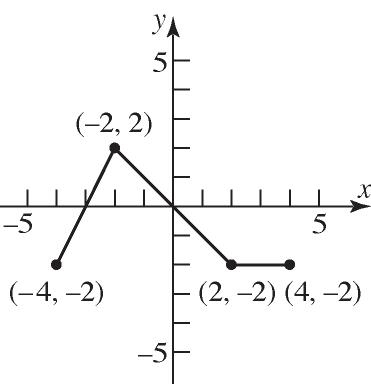
g. ()(2) hxfx
Compress horizontally by a factor of 1 2 .

65. a. ()()3Fxfx
Shift up 3 units.
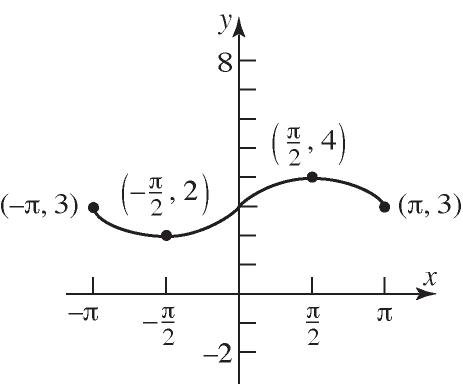
Chapter1: Graphs and Functions
b. ()(2)Gxfx Shift left 2 units.

c. ()() Pxfx
Reflect about the x-axis.
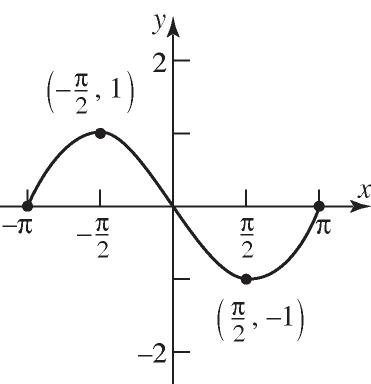
d. ()(1)2Hxfx Shift left 1 unit and shift down 2 units.
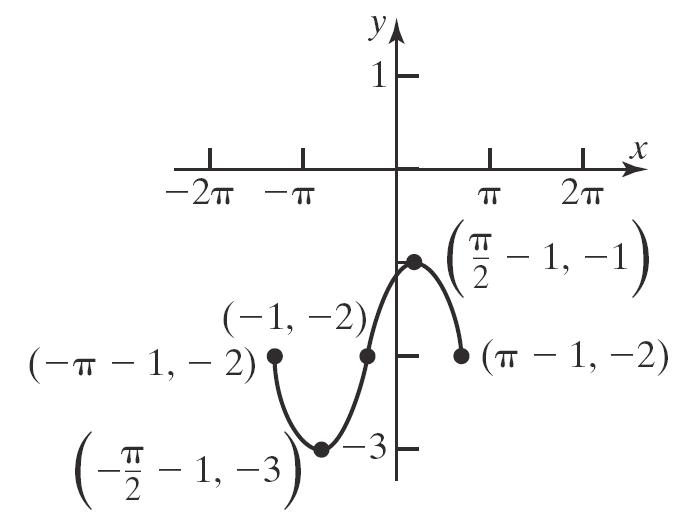
e. 1 ()() 2 Qxfx
Compress vertically by a factor of 1 2
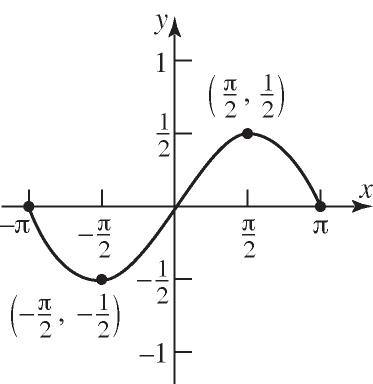
f. ()() gxfx
Reflect about the y-axis.
g. ()(2) hxfx
Compress horizontally by a factor of 1 2
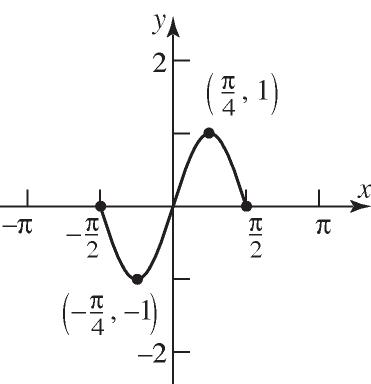
66. a. ()()3Fxfx Shift up 3 units.
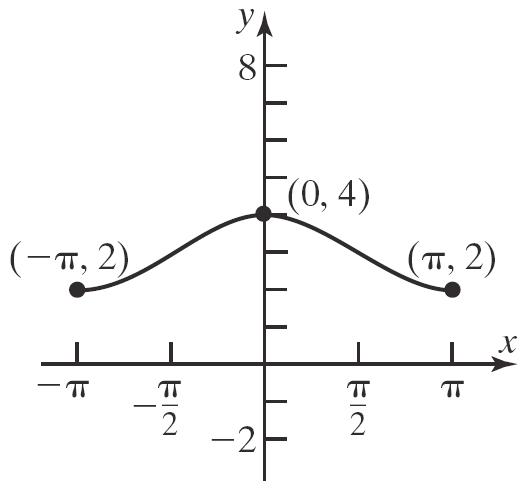
b. ()(2)Gxfx Shift left 2 units.
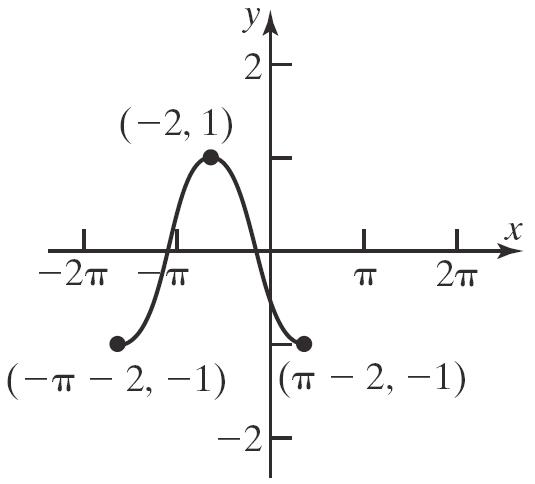
c. ()() Pxfx
Reflect about the x-axis.
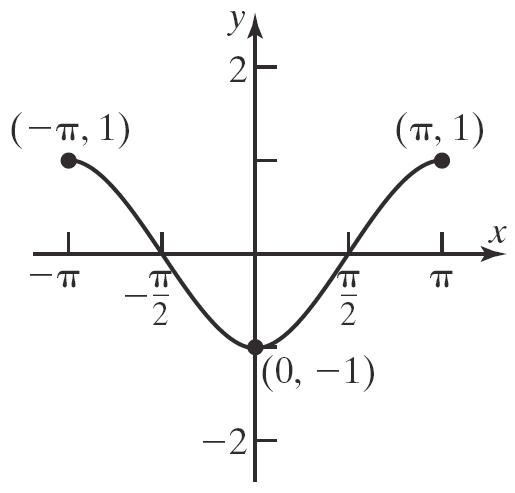
d. ()(1)2Hxfx
Shift left 1 unit and shift down 2 units.
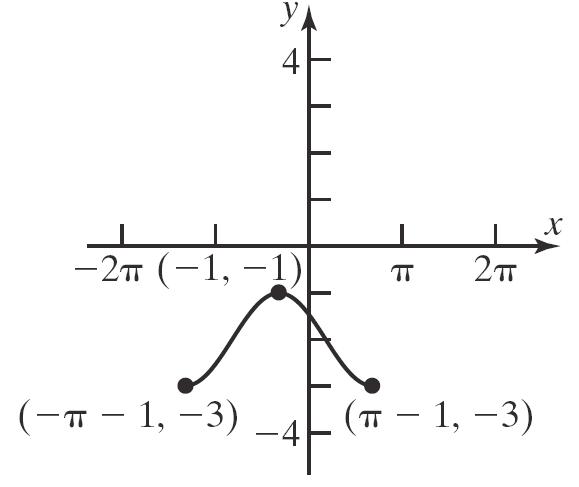
e. 1 ()() 2 Qxfx
Compress vertically by a factor of 1 2 .
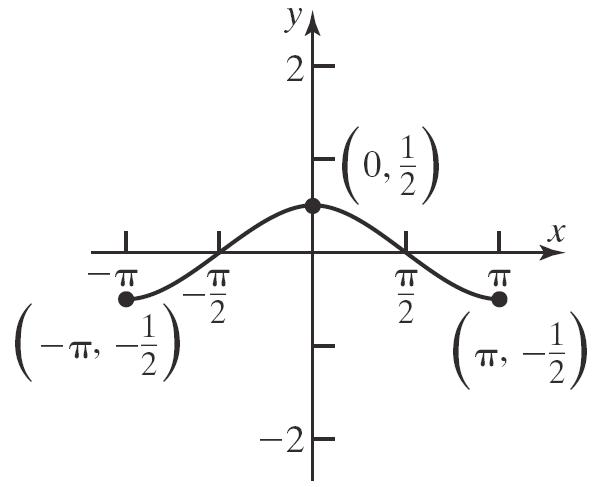
f. ()() gxfx
Reflect about the y-axis.
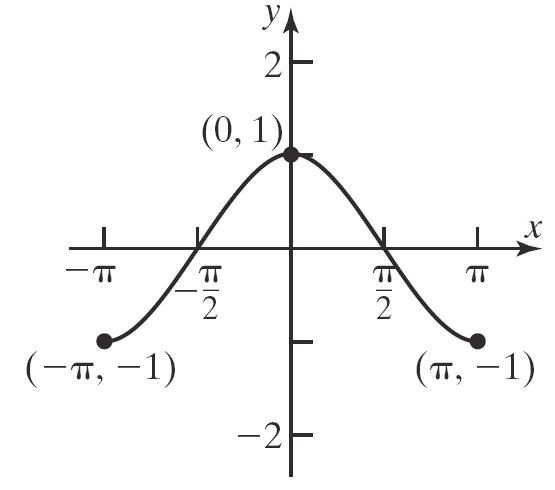
Section1.6: Graphing Techniques: Transformations
g. ()(2) hxfx
Compress horizontally by a factor of 1 2
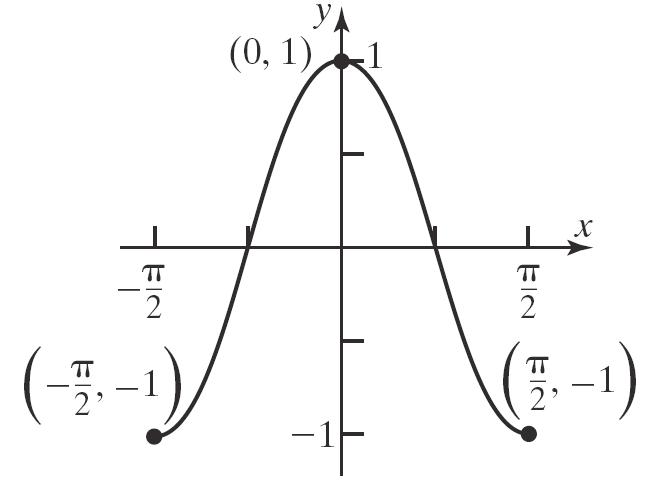
67. 2 ()2 fxxx 2 2 ()(21)1 ()(1)1 fxxx fxx
Using 2 () fxx , shift left 1 unit and shift down 1 unit.
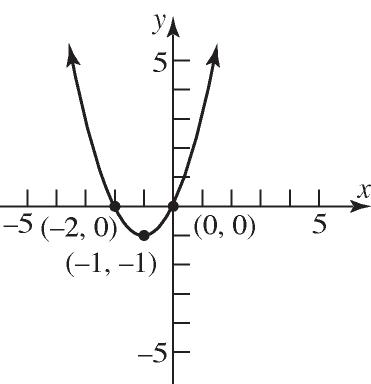
68. 2 ()6 fxxx 2 2 ()(69)9 ()(3)9 fxxx fxx
Using 2 () fxx , shift right 3 units and shift down 9 units.
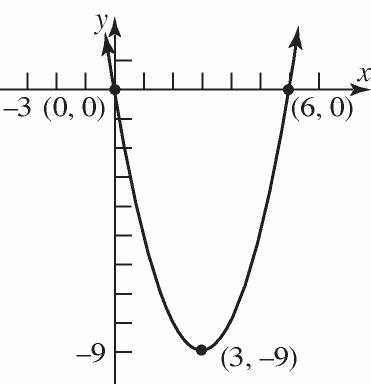
Chapter1: Graphs and Functions
69. 2 ()81 fxxx
2 2 ()816116 ()415 fxxx fxx
Using 2 () fxx , shift right 4 units and shift down 15 units.
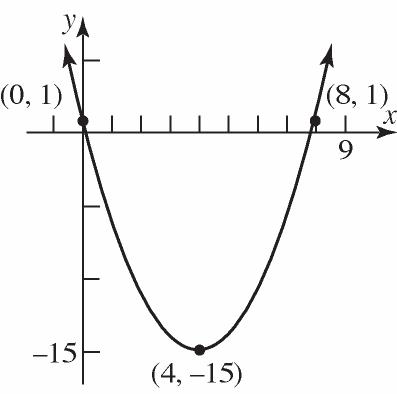
70. 2 ()42 fxxx
2 2 ()4424 ()22 fxxx fxx
Using 2 () fxx , shift left 2 units and shift down 2 units. 71.
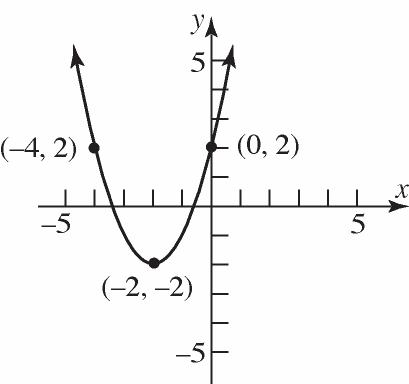
2 2 2 2 21219 2619 2691918 231 fxxx xx xx x
Using 2 fxx , shift right 3 units, vertically stretch by a factor of 2, and then shift up 1 unit.
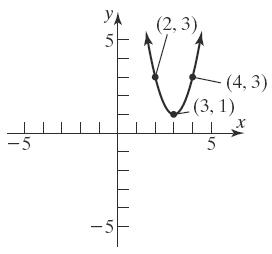
2 2 2 2 361 321 32113 312 fxxx xx xx x
Using 2 fxx , shift left 1 unit, vertically stretch by a factor of 3, and shift down 2 units. 73.
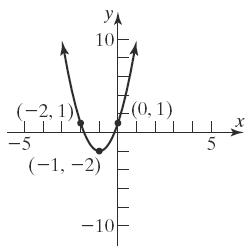
2 2 2 2 31217 3417 3441712 325 fxxx xx xx x
Using 2 fxx , shift left 2 units, stretch vertically by a factor of 3, reflect about the xaxis, and shift down 5 units.
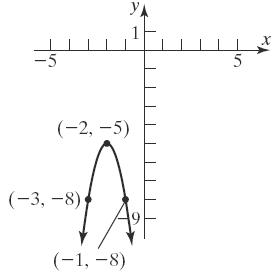
Using 2 fxx , shift left 3 units, stretch vertically by a factor of 2, reflect about the xaxis, and shift up 5 units.
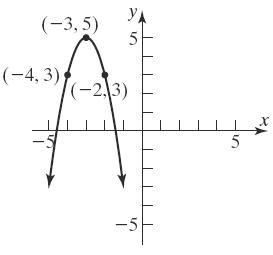
75. a. The graph of 2 yfx is the same as the graph of yfx , but shifted 2 units to the left. Therefore, the x-intercepts are 7 and 1.
b. The graph of 2 yfx is the same as the graph of yfx , but shifted 2 units to the right. Therefore, the x-intercepts are 3 and 5.
c. The graph of 4 yfx is the same as the graph of yfx , but stretched vertically by a factor of 4. Therefore, the x-intercepts are still 5 and 3 since the y-coordinate of each is 0.
d. The graph of yfx is the same as the graph of yfx , but reflected about the y-axis. Therefore, the x-intercepts are 5 and 3
76. a. The graph of 4 yfx is the same as the graph of yfx , but shifted 4 units to the left. Therefore, the x-intercepts are 12 and 3
b. The graph of 3 yfx is the same as the graph of yfx , but shifted 3 units to
the right. Therefore, the x-intercepts are 5 and 4.
c. The graph of 2 yfx is the same as the graph of yfx , but stretched vertically by a factor of 2. Therefore, the x-intercepts are still 8 and 1 since the y-coordinate of each is 0.
d. The graph of yfx is the same as the graph of yfx , but reflected about the y-axis. Therefore, the x-intercepts are 8 and 1 .
77. a. The graph of 2 yfx is the same as the graph of yfx , but shifted 2 units to the left. Therefore, the graph of 2 fx is increasing on the interval 3,3
b. The graph of 5 yfx is the same as the graph of yfx , but shifted 5 units to the right. Therefore, the graph of 5 fx is increasing on the interval 4,10 .
c. The graph of yfx is the same as the graph of yfx , but reflected about the x-axis. Therefore, we can say that the graph of yfx must be decreasing on the interval 1,5
d. The graph of yfx is the same as the graph of yfx , but reflected about the y-axis. Therefore, we can say that the graph of yfx must be decreasing on the interval 5,1
78. a. The graph of 2 yfx is the same as the graph of yfx , but shifted 2 units to the left. Therefore, the graph of 2 fx is decreasing on the interval 4,5
b. The graph of 5 yfx is the same as the graph of yfx , but shifted 5 units to
Chapter1: Graphs and Functions
the right. Therefore, the graph of 5 fx is decreasing on the interval 3,12 .
c. The graph of yfx is the same as the graph of yfx , but reflected about the x-axis. Therefore, we can say that the graph of yfx must be increasing on the interval 2,7
d. The graph of yfx is the same as the graph of yfx , but reflected about the y-axis. Therefore, we can say that the graph of yfx must be increasing on the interval 7,2
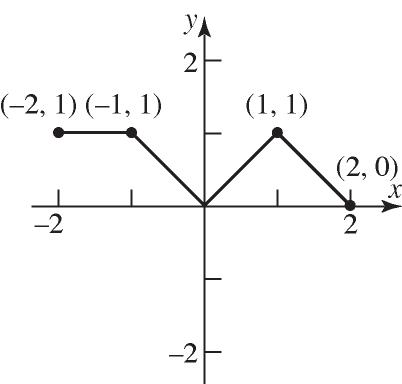
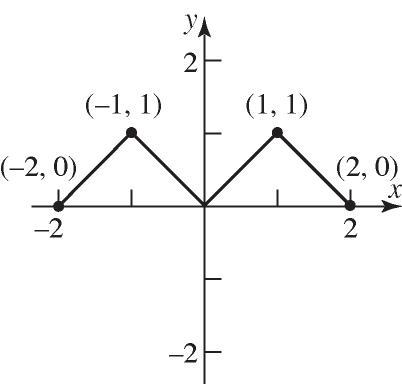
80. a. To graph ()yfx , the part of the graph for f that lies in quadrants III or IV is
reflected about the x-axis.
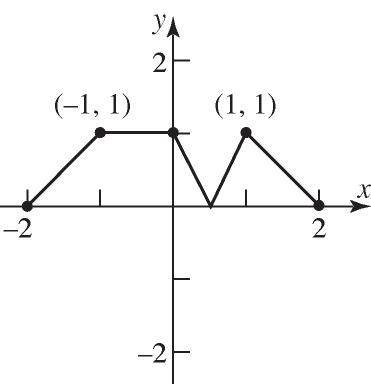
b. To graph yfx , the part of the graph for f that lies in quadrants II or III is replaced by the reflection of the part in quadrants I and IV reflected about the yaxis.
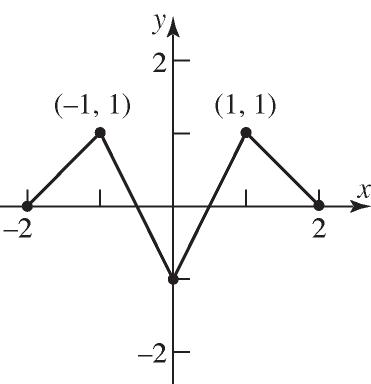
81. a. The graph of 35 yfx is the graph of yfx but shifted left 3 units and down 5 units. Thus, the point 1,3 becomes the point 2,2 .
b. The graph of 221yfx is the graph of yfx but shifted right 2 units, stretched vertically by a factor of 2, reflected about the x-axis, and shifted up 1 unit. Thus, the point 1,3 becomes the point 3,5
c. The graph of 23yfx is the graph of yfx but shifted left 3 units and horizontally compressed by a factor of 2. Thus, the point 1,3 becomes the point 1,3
82. a. The graph of 13 ygx is the graph of ygx but shifted left 1 unit and down 3 units. Thus, the point 3,5 becomes the point 4,2
b. The graph of 343ygx is the graph of ygx but shifted right 4 units, stretched vertically by a factor of 3, reflected about the x-axis, and shifted up 3 units. Thus, the point 3,5 becomes the point 1,12
c. The graph of 39ygx is the graph of yfx but shifted left 9 units and horizontally compressed by a factor of 3. Thus, the point 3,5 becomes the point
4,5 .
83. a. ()33fxx
Using the graph of yx , horizontally shift to the right 3 units 3 yx and vertically shift downward 3 units 33 yx .
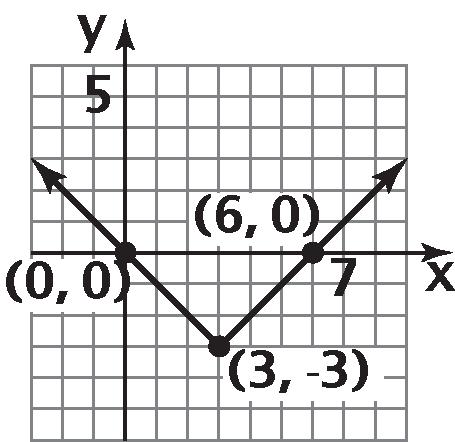
b. 1 2 1 (6)(3)9 2 Abh
The area is 9 square units.
84. a. ()244fxx
Using the graph of yx , horizontally shift to the right 4 units 4 yx , vertically stretch by a factor of 2 and flip on the x-axis
Section1.6: Graphing Techniques: Transformations
24yx , and vertically shift upward 4 units 244yx
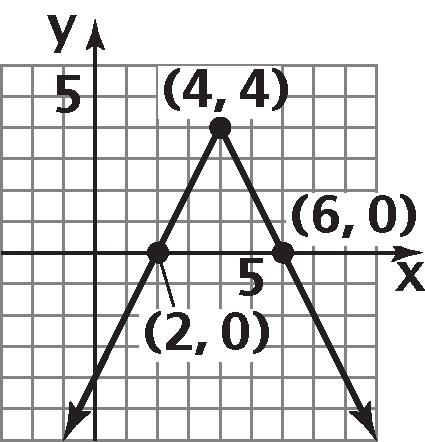
b. 1 2 1 (4)(4)8 2 Abh The area is 8 square units.
85. a. From the graph, the thermostat is set at 72F during the daytime hours. The thermostat appears to be set at 65F overnight.
b. To graph 2 yTt , the graph of Tt is shifted down 2 units. This change will lower the temperature in the house by 2 degrees.
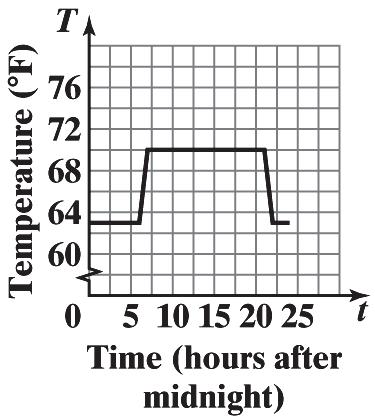
c. To graph 1 yTt , the graph of Tt should be shifted left one unit. This change will cause the program to switch between the daytime temperature and overnight temperature one hour sooner. The home will begin warming up at 5am instead of 6am
and will begin cooling down at 8pm instead of 9pm.
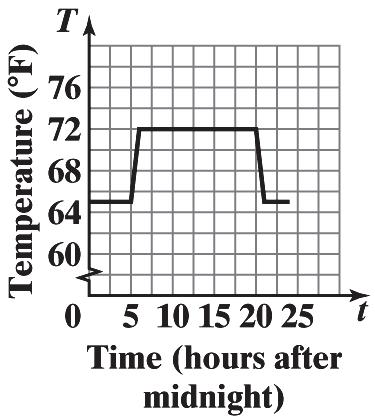
86.
b.
c. The graph of rx is the graph of Rx shifted 2 units to the left. Thus, rx represents the estimated worldwide music revenue, x years after 2010.
The estimated worldwide music revenue for 2012 is $5.46 billion.
2 50.1550.6356.12 6.72 r
The estimated worldwide music revenue for 2015 is $6.72 billion.
2 70.1570.6376.12 9.06 r
The estimated worldwide music revenue for 2017 is $9.06 billion.
d. In rx , x represents the number of years after 2010 (see the previous part).
e. Answers will vary. One advantage might be that it is easier to determine what value should be substituted for x when using rx instead of Rx to estimate worldwide music revenue.
87. 9 32 5 FC
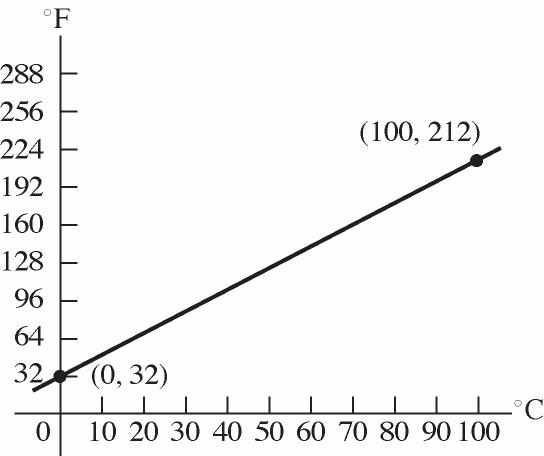
9 (273)32 5 FK
Shift the graph 273 units to the right.
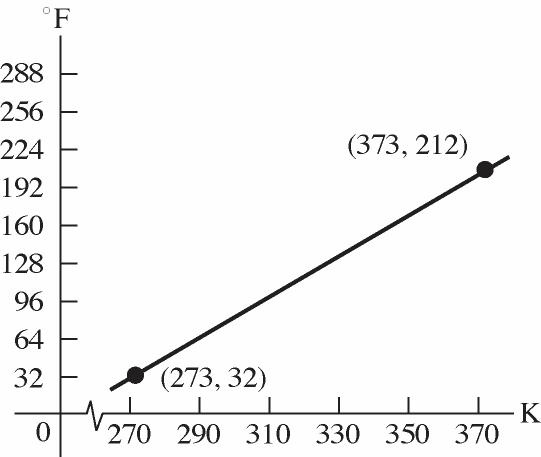
88. a. 2 l T g
b. 1 1 2 l T g ; 2 2 2 l T g ; 3 3 2 l T g
c. As the length of the pendulum increases, the period increases.
d. 1 2 2 l T g ; 2 3 2 l T g ; 3 4 2 l T g
e. If the length of the pendulum is multiplied by k , the period is multiplied by k
89. 2 ()yxc 2 2 2 If 0,. If 3,(3); shift right 3 units. If 2,(2); shift left 2 units. cyx cyx cyx

Section1.6: Graphing Techniques: Transformations
90. 2 yxc 2 2 2 If 0,. If 3,3; shift up 3 units. If 2,2; shift down 2 units. cyx cyx cyx
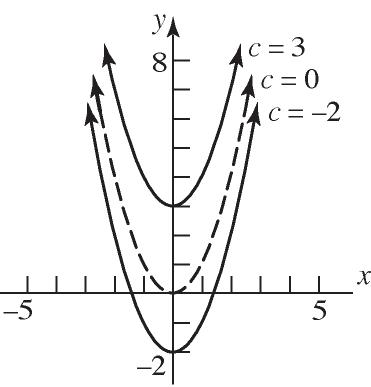
91. (5)fx is a shift right 5 units; increasing on
2,8 and 16,24 ; decreasing of 8,16 . (25)fx compresses horizontally by a factor of ½; increasing on 1,4 and 8,12 ; decreasing on 4,8 . (25)fx reflects about the x-axis; increasing on 4,8 ; decreasing on
1,4 and 8,12 . 3(25) fx stretches vertically by a factor or 3 but does not affect increasing/decreasing. Therefore 3(25) fx is increasing on 4,8
92. Write the general normal density as 2 11 ()exp 2 2
x fx . Starting with the standard normal density, 2 1 ()exp 2 2
fxx , stretch/compress horizontally by a factor of to get 2 1 ()exp 2 2
x fx 1 multiply all the -coordinates by x , then shift the graph horizontally units (left if 0 and right if 0 ) to get
Chapter1: Graphs and Functions
fx . Then stretch/compress
vertically by a factor of 1 to get
multiply all the -coordinates by
1. Stretch/compress horizontally by a factor or (stretch if 1 )
2. Shift horizontally units (left if 0 and right if 0 ).
3.Stretch/compress vertically by a factor of 1 (compress if 1 )
93. The graph of 4()yfx is a vertical stretch of the graph of f by a factor of 4, while the graph of (4)yfx is a horizontal compression of the graph of f by a factor of 1 4 .
94. The graph of ()2yfx will shift the graph of ()yfx down by 2 units. The graph of (2)yfx will shift the graph of ()yfx to the right by 2 units.
95. The graph of yx is the graph of yx but reflected about the y-axis. Therefore, our region is simply rotated about the y-axis and does not change shape. Instead of the region being bounded on the right by 4 x , it is bounded on the left by 4 x . Thus, the area of the second region would also be 16 3 square units.
96. The range of 2 () fxx is 0, . The graph of ()() gxfxk is the graph of f shifted up k units if k > 0 and shifted down k units if k < 0, so the range of g is , k .
97. The domain of () gxx is 0, . The graph of ()gxk is the graph of g shifted k units to the right, so the domaine of g is , k
Section 1.7
1. 22 4222 44
fxxxx .
2. The function 2 () fxx is increasing on the interval 0, . It is decreasing on the interval ,0
3. The function is not defined when 2 3180xx Solve: 2 3180 (6)(3)0 xx xx 6 or 3 xx The domain is {|6, 3} xxx . 4. 38 38 8 3 818 333
xy yx x y x yx 5. 12 fxfx 6. one-to-one 7. 3 8. yx 9. 4, 10. True 11. a 12. d
13. The function is one-to-one because there are no two distinct inputs that correspond to the same output.
14. The function is one-to-one because there are no two distinct inputs that correspond to the same output.
15. The function is not one-to-one because there are two different inputs, 20 Hours and 50 Hours, that correspond to the same output, $200.
16. The function is not one-to-one because there are two different inputs, John and Chuck, that correspond to the same output, Phoebe.
17. The function is not one-to-one because there are two distinct inputs, 2 and 3 , that correspond to the same output.
18. The function is one-to-one because there are no two distinct inputs that correspond to the same output.
19. The function is one-to-one because there are no two distinct inputs that correspond to the same output.
20. The function is one-to-one because there are no two distinct inputs that correspond to the same output.
21. The function f is one-to-one because every horizontal line intersects the graph at exactly one point.
22. The function f is one-to-one because every horizontal line intersects the graph through at most one point.
23. The function f is not one-to-one because there are horizontal lines (for example, 1 y ) that intersect the graph at more than one point.
24. The function f is not one-to-one because there are horizontal lines (for example, 1 y ) that intersect the graph at more than one point.
25. The function f is one-to-one because every horizontal line intersects the graph through at most one point.
26. The function f is not one-to-one because the horizontal line 2 y intersects the graph at more than one point.
Graphs and Functions
31. Graphing the inverse:
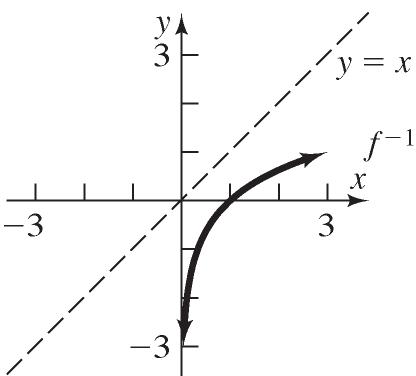
32. Graphing the inverse: yx =
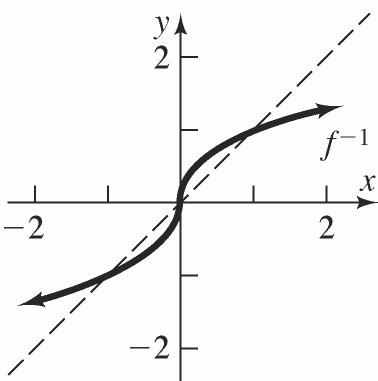
33. 1 ()34;()(4) 3 fxxgxx
1 ()(4) 3 1 3(4)4 3 (4)4 fgxfx x x x
()(34) 1 (34)4 3 1 (3) 3 gfxgx x xx
Thus, f and g are inverses of each other.
34. 1 ()32;()(3) 2 fxxgxx 1 ()(3) 2 1 32(3) 2 3(3) fgxfx x x x
()(32) 1 (32)3 2 1 (2) 2 gfxgx x x x
Thus, f and g are inverses of each other.
35. ()48;()2 4 fxxgxx ()2 4 428 4 88 fgxfx x x x
(48) () 48 2 4 22 gfxgx x x x
Thus, f and g are inverses of each other.
36. 1 ()26;()3 2 fxxgxx 1 ()3 2 1 23666 2 fgxfx xx x
()26() 1 (26)333 2 g gfxx xx x
Thus, f and g are inverses of each other.
37. 3 3 ()8;()8 fxxgxx
3 3 3 ()8 88 88 fgxfx x x x
3 3 3 3 3 ()(8) (8)8 gfxgx x x x
Thus, f and g are inverses of each other.
38. 2 ()(2),2; ()2fxxxgxx
2 2 ()2 22 fgxfx x x x
2 2 ()(2) (2)2 22 gfxgx x x x
Thus, f and g are inverses of each other.
39. ();()11 fxgx xx 11 ()1 1 1 fx gxfx x x
11 ()1 1 1 x gfxgx x x
Thus, f and g are inverses of each other.
40. ();() fxxgxx () fgxfxx
() gfxgxx
Thus, f and g are inverses of each other.
Section1.7: One-to-One Functions; Inverse Functions
41. ();2343 () 42 xxfxgx xx
2(43)3(2) 434(2) 8663 4384 5 5 x fgxfx x x x x x x x x x x x xx xx xx xx x x
23
4 4 23 43 4 23 2 4 23 43(4) 4 23 2(4) 4 4(23)3(4) 2(4)(23) 812312 2823 5 5 x gfxgx x x x x x x x x x x x xx xx xx xx x x
Thus, f and g are inverses of each other.
42. ();()535 2312 xxfxgx
(),351 122 35 5 12 35 23 12 35 5(12) 12 35 23(12) 12 355(12)
2(35)3(12) 35510 61036 13 13
3(5)5(23)
1(23)2(5) 3151015 23210 13 13
Thus, f and g are inverses of each other. 43. a. 1 ()3 3 3Inverse 3 1 () 3 fxx yx xy x
Verifying: 1 11 ()333 ffxfxxx
b 1 1 domain of range of all real numbers range of domain of all real numbers ff ff
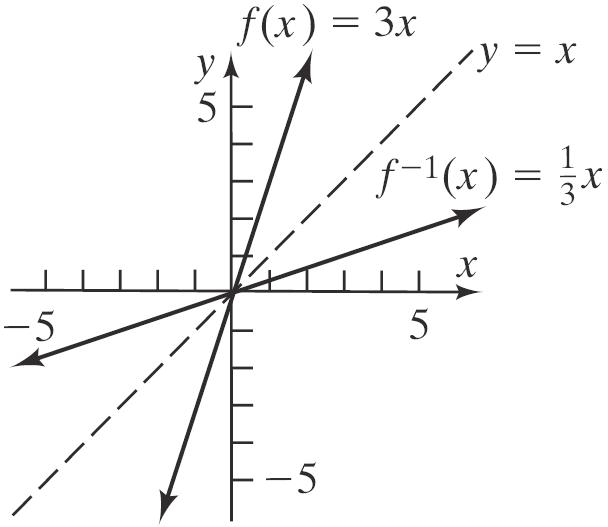
44. a. 1 ()4 4 4Inverse 4 1 () 4 fxx yx xy x y fxx
Verifying:
1 11 ()444 ffxfxxx
11 1 ()(4)(4) 4 ffxfxxx
b. 1 1 domain of range of all real numbers range of domain of all real numbers ff ff
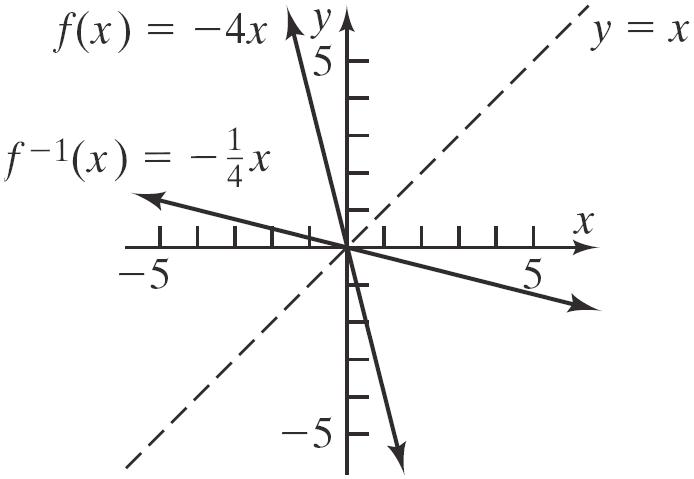
45. a. 1 ()42 42 42Inverse 42 2 4 1 42 1 () 42 fxx yx xy yx x y x y fxx
Verifying:
b.
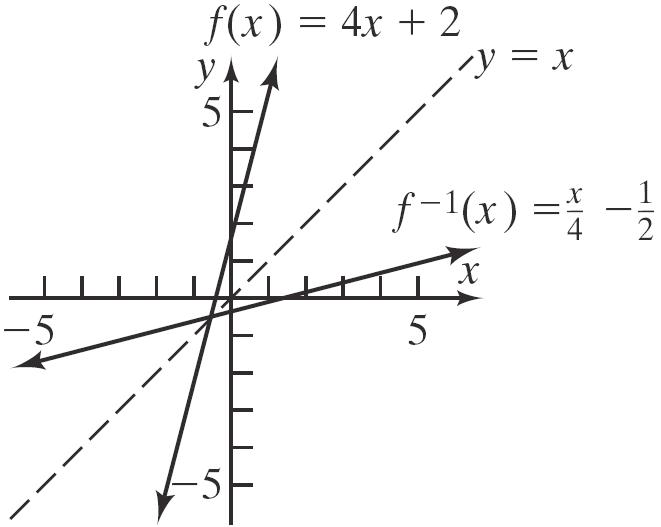
46. a. 1 ()13 13 13Inverse 31 1 3 1 () 3 fxx yx xy
Verifying:
Section1.7: One-to-One Functions; Inverse Functions
b. 1 1 domain of range of all real numbers range of domain of all real numbers ff ff
c. 47. a. 3 3 3 3 3 1 3 ()1 1 1Inverse 1 1 ()1 fxx yx xy yx yx fxx
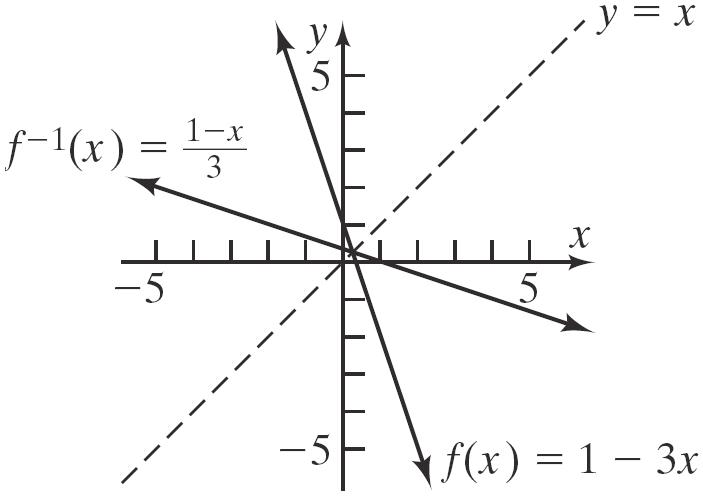
Verifying:
3 1 33 ()111 11 ffxfxx xx
1133 3 3 3 ()111ffxfxx xx
b. 1 1 domain of range of all real numbers range of domain of all real numbers ff ff
c.
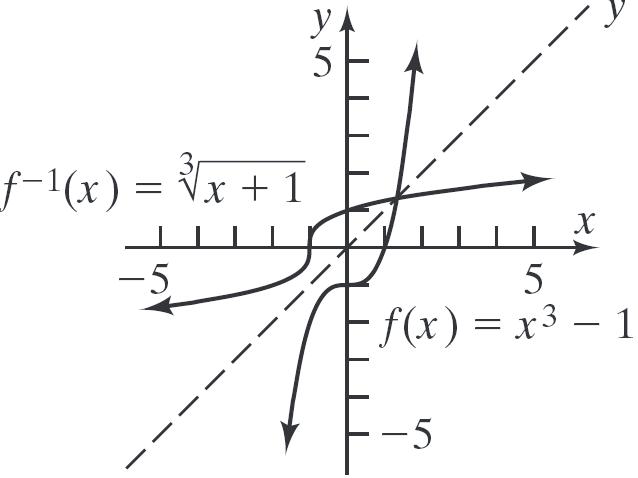
Chapter1: Graphs and Functions
48. a. 3 3 3 3 3 1 3 ()1 1 1Inverse 1 1 ()1 fxx yx xy yx yx fxx
Verifying:
3 1 33 ()111 11 ffxfxx xx
1133 3 3 3 ()111ffxfxx xx
b. 1 1 domain of range of all real numbers range of domain of all real numbers ff ff
c.

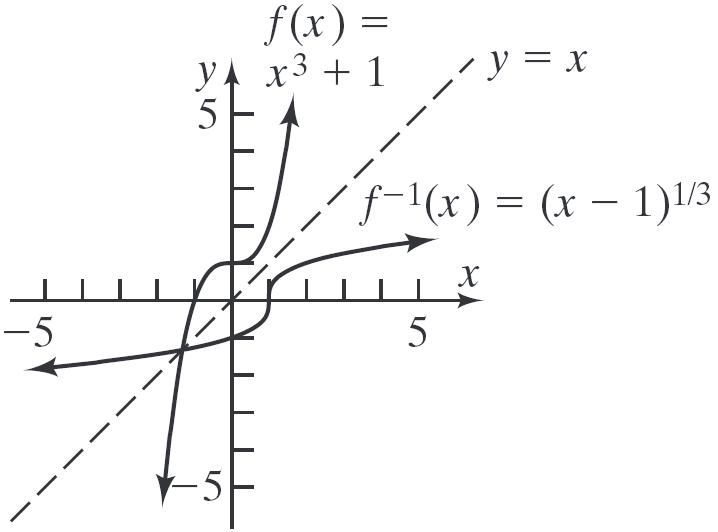
49. a. 2 2 2 2 1 ()4,0 4,0 4,0Inverse 4,4 4, 4 ()4,4 fxxx yxx xyy yxx yxx fxxx
Verifying: 1 2 ()4 44 44 ffxfx x xx
112 2 2 ()4 44 ,0 ffxfx x xx xx
b. 1 1 domain of range of |0 range of domain of |4 ffxx ffxx
c.
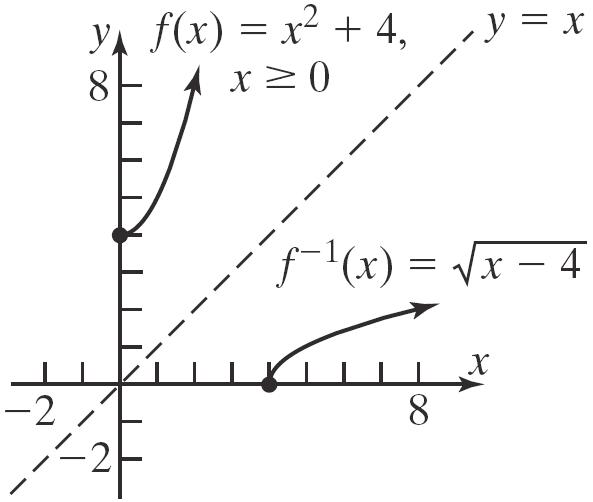
50. a. 2 2 2 2 1 ()9,0 9,0 9,0Inverse 9,9 9,9 ()9,9 fxxx yxx xyy yxx yxx fxxx
Verifying:
1 2 ()9 99 99 ffxfx x x x
112 2 2 ()9 99 ,0 ffxfx x x x xx
b.
1 1 domain of range of |0 range of domain of |9 ffxx ffxx
Section1.7: One-to-One Functions; Inverse Functions
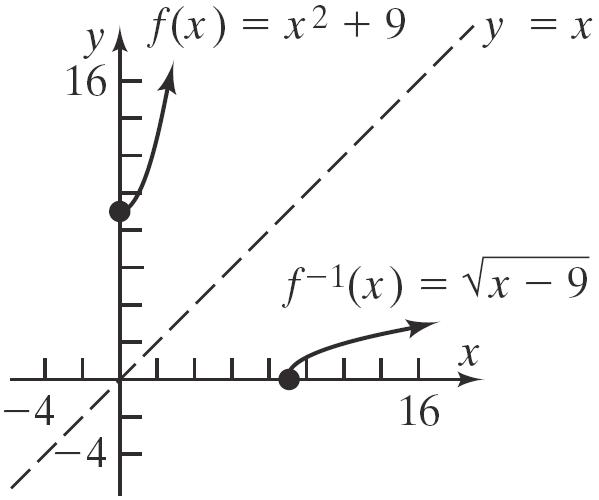
Verifying:
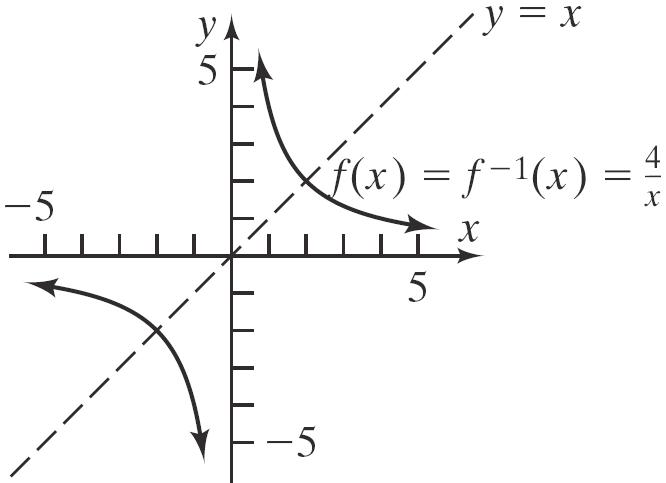
c.
11 33 ()3 3 3 fxfxfx x x
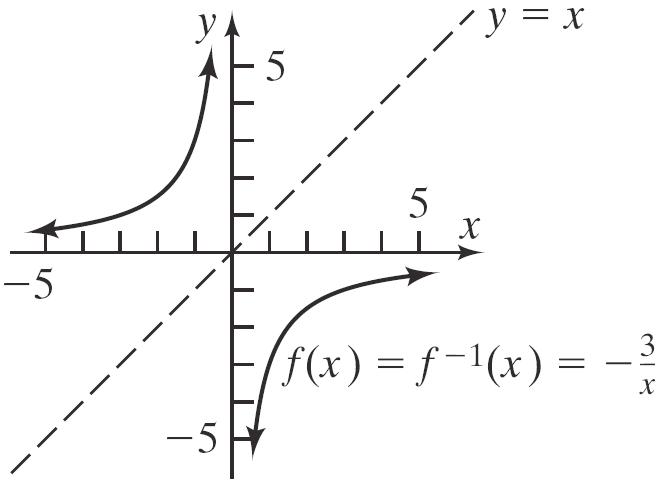
53. a. 1 () 2 fx x 1 1 2 1 Inverse 2 21 21 21 21 () y x x y xyx xyx x y x
Chapter1: Graphs and Functions
c.
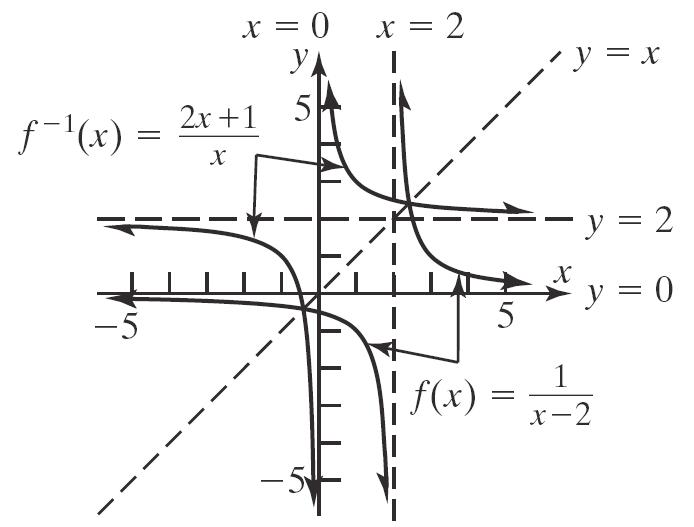
b.
Section1.7: One-to-One Functions; Inverse Functions
Graphs and Functions
Verifying:
1 43 23 43 2 () 43 2 4 2 2(43)3(2) 434(2) 8663 4384 11 11 x ffxfxx xx x xx xx xx xx x x
11 34 () 2 34 24 2 34 3 2 2(34)4(2) 343(2) 6848 3436 10 10 ffxfx x x x x x xx xx xx xx x x
65. a. 2 2 4 (), 0 2 x fxx x
2 2 2 2 22 22 2 2 2 1 4 , 0 2 4 , 0Inverse 2 1 24, 2 1 24, 2 1 214, 2 1 124, 2 41 , 122 41 , 122 21 , 2 12 2 , 12 x yx x y xy y xyyx xyyx yxx yxx yx x yx x yx x fxx x
1 2
Chapter1: Graphs and Functions
Section1.7: One-to-One Functions; Inverse Functions
b
68. a
ffxfx x xxx
1 1 domain of range of |0 range of domain of |4
ffxx ffxx
fxx yx xy yx yxx fxxx
1 ()5 5 5Inverse 5 (5),5 ()(5),5
Verifying:
1 ()(5) (5)5 55,since 5
ffxfx x xxx b. 1 1 domain of range
Verifying:
ffxfx x xxx
b. 1 1 domain of range of all real numbers range of domain of all real numbers ff ff
Chapter1: Graphs and Functions
1 1 domain of range of |3 range of domain of |5
73. a. Because the ordered pair (1,0) is on the graph, (1)0 f .
b. Because the ordered pair (1,2) is on the graph, (1)2 f
c. Because the ordered pair (0,1) is on the graph, 1 (1)0 f
d. Because the ordered pair (1,2) is on the graph, 1 (2)1 f .
74. a. Because the ordered pair 1 2, 2 is on the graph, 1 (2) 2 f .
b. Because the ordered pair (1,0) is on the graph, (1)0 f .
c. Because the ordered pair (1,0) is on the graph, 1 (0)1 f
d. Because the ordered pair (0,1) is on the graph, 1 (1)0 f
75. Since 713 f , we have 1 137 f ; the input of the function is the output of the inverse when the output of the function is the input of the inverse.
76. Since 53 g , we have 1 35 g ; the input of the function is the output of the inverse when the output of the function is the input of the inverse.
77. Since the domain of a function is the range of the inverse, and the range of the function is the domain of the inverse, we get the following for 1 f : Domain: 2, Range: 5,
78. Since the domain of a function is the range of the inverse, and the range of the function is the domain of the inverse, we get the following for 1 f :
Domain: 5, Range: 0,
79. Since the domain of a function is the range of the inverse, and the range of the function is the domain of the inverse, we get the following for 1 g :
Domain: 0, Range: ,0
80. Since the domain of a function is the range of the inverse, and the range of the function is the domain of the inverse, we get the following for 1 g :
Domain: 0,8 Range: 0,15
81. Since fx is increasing on the interval 0,5 , it is one-to-one on the interval and has an inverse, 1 fx . In addition, we can say that 1 fx is increasing on the interval 0,5 ff
82. Since fx is decreasing on the interval 0,5 , it is one-to-one on the interval and has an inverse,
1 fx . In addition, we can say that 1 fx is decreasing on the interval
(5),(0)ff
83.
85. If , ab is on the graph of f, then , ba is on the graph of 1 f . Since the graph of 1 f lies in quadrant I, both coordinates of (,) ab are positive, which means that both coordinates of (,) ba are positive. Thus, the graph of 1 f must lie in quadrant I.
86. If , ab is on the graph of f, then , ba is on the graph of 1 f . Since the graph of f lies in quadrant II, a must be negative and b must be positive. Thus, (,) ba must be a point in quadrant IV, which means the graph of 1 f lies in quadrant IV.
87. Answers may vary. One possibility follows: (),0fxxx is one-to-one.
Thus, 1 (),0 ,0 (),0 fxxx yxx fxxx
88. Answers may vary. One possibility follows: 4 (),0fxxx is one-to-one.
Thus, 4 4 4 4 1 4 (),0 ,0 Inverse ,0 (),0 fxxx yxx xy yxx fxxx
89. a. 6.9790.39 90.396.97 90.39 6.97 dr dr d r
Therefore, we would write 90.39 6.97 rdd b.
6.9790.3990.39 6.97 6.9790.3990.396.97 6.976.97
r rdr rr r
90.39 6.9790.39 6.97 90.3990.39 d drd d d
Chapter1: Graphs and Functions
If the distance required to stop was 300 feet, the speed of the car was roughly 56 miles per hour.
90. a.
The head circumference of a child who is 26 inches tall is about 17 inches.
The height of a male who is at his ideal weight of 80 kg is roughly 73 inches.
Therefore, we would write
93. a. From the restriction given in the problem statement, the domain is
38,7004453.500.2238,70038,700 4453.50
82,5004453.500.2282,50038,700 14,089.50
Since T is linear and increasing, we have that the range is |4453.5014,089.50 TT or 4453.50,14089.50
4453.500.2238,700
c.
4453.500.2238,700
4453.50 38,700 0.22
4453.50 38,700 0.22
Therefore, we would write
4453.50 38,700 0.22 T gT
Domain: |4453.5014,089.50 TT
Range: |38,70082,500 gg
94. a. From the restriction given in the problem statement, the domain is |19,05077,400 gg or 19050,77400
b. 19,05019050.1219,05019,050 1905 T 77,40019050.1277,40019,050 8907
T
Since T is linear and increasing, we have that the range is |19058907 TT or 1905,8907
Section1.7: One-to-One Functions; Inverse Functions
we would write
(Note: we only need the principal square root since we know 0 t )
c.
19050.1219,050
19050.1219,050
1905 19,050 0.12
1905 19,050 0.12
We would write 1905 19,050 0.12 T gT
Domain: |19058907 TT
Range: |19,05077,400 gg
95. a. The graph of H is symmetric about the y-axis. Since t represents the number of seconds after the rock begins to fall, we know that 0 t . The graph is strictly decreasing over its domain, so it is one-to-one.
It will take the rock about 2.02 seconds to fall 80 meters.
Chapter1: Graphs and Functions
97. () axbaxb fxycxdcxd
Interchange x and y, and then solve for y: 1 () () So ()
ayb x cyd xcydayb cxydxayb cxyaybdx ycxabdx bdx y cxa dxb fx cxa
Now, 1 ff
2222 2222
axbdxb cxdcxa axbcxadxbcxd acxaxbcxabcdxdxbcxbd acxabcxabcdxdbcxbd
So 22 ;;, accdabcdbcabbd which means ad
98. ()(()) (()) hxfgx yfgx .
Interchange x and y, and then solve for y: 111 (()) ()()(()) xfgy fxgygfxy
So, 111 ()(()) hxgfx
99. a. The domain of f is , . From 23yx , x < 0, then y < 3, From 34yx , 0, then 4. xy The range of f is
,34,
fxxxyxx xy xyyNoteyx x xyxyx x fxx
b. Consider the piece 1 ()23,023,0 Interchange and : 23,0:If 0 then 3 so 3 32,3,3 2 3 (),3 2
fxxxyxx xy xyyNoteyx x xyxyx x fxx
Now consider the piece 1 ()34,034,0. Interchange and : 34,0:If 0, then 4 so 4 43,4,4 3 4 (),4 3
Putting the pieces together we have 1 3 ,3 2 () 4 ,4 3
x x fx x x
c. The domain of 1 f is ,34, , the range of f
The range is 1 f is , , the domain of f
100. Yes. In order for a one-to-one function and its inverse to be equal, its graph must be symmetric about the line yx . One such example is the function 1 fx x .
101. Answers will vary.
102. Answers will vary. One example is 1 , if 0 , if 0 fxx x xx

This function is one-to-one since the graph passes the Horizontal Line Test. However, the function is neither increasing nor decreasing on its domain.
103. No, not every odd function is one-to-one. For example, 3 () fxxx is an odd function, but it is not one-to-one.
104. 1 (800,000) C represents the number of cars manufactured for $800,000.
105. If a horizontal line passes through two points on a graph of a function, then the y value associated with that horizontal line will be assigned to two different x values which violates the definition of one-to-one.
106. Answers may vary.
Chapter 1 Review Exercises
1.
12 0,0 and 4,2 PP a.
2212,4020 1642025
b. The coordinates of the midpoint are:
(,),1212 22 040242 ,,2,1 2222
2. 12 1,1 and 2,3 PP
a.
2 2 12,2131 916255
b. The coordinates of the midpoint are:
(,),1212 22 12 13 , 22 121 ,,1 222
3.
2 2 12,4484 014414412
b. The coordinates of the midpoint are:
4. 2 4 yx
5. x-intercepts: 4,0, 2 ; y-intercepts: 2,0,2 Intercepts: (4,0), (0,0),(2,0),(0,2),(0,2)
6. 2 23xy
x-intercepts: y-intercepts:
0 0 y y y
The only intercept is (0,0).
Test x-axis symmetry: Let yy 2 2 23() 23 same xy xy
Test y-axis symmetry: Let xx 2 2 2()3 23 different xy xy
Test origin symmetry: Let xx and yy . 2 2 2()3() 23 different xy xy
Therefore, the graph will have x-axis symmetry.
7. 22+4=16xy
x-intercepts: y-intercepts:
+40=16
The intercepts are (4,0),(4,0),(0,2), and (0,2).
Test x-axis symmetry: Let yy
2 2 22 4=16 4=16 same xy xy
Chapter1: Graphs and Functions
Test y-axis symmetry: Let xx
2 2 22 4=16 4=16 same xy xy
Test origin symmetry: Let xx and yy
22 22 4=16 +4=16 same xy xy
Therefore, the graph will have x-axis, y-axis, and origin symmetry.
8. 42+2+1yxx
x-intercepts: y-intercepts:
42 22 2 2 0+2+1 011 10 1 xx xx x x
no real solutions
The only intercept is (0, 1).
Test x-axis symmetry: Let yy 42 42 21 21 different yxx yxx
Test y-axis symmetry: Let xx
42 42 21 21 same yxx yxx
Test origin symmetry: Let xx and yy
42 42 42 21 21 21 different yxx yxx yxx
Therefore, the graph will have y-axis symmetry. 9. 3 yxx
x-intercepts: y-intercepts:
3 (0)0 0 y
xxx
The intercepts are (1,0), (0,0), and (1,0).
Test x-axis symmetry: Let yy 3 3 different yxx yxx
Test y-axis symmetry: Let xx 3 3 ()() different yxx yxx
Test origin symmetry: Let xx and yy 3 3 3 ()() same yxx yxx yxx
Therefore, the graph will have origin symmetry.
10. 22 20xxyy
x-intercepts: 22 2 (0)2(0)0 0 (1)0 xx xx xx 0,1xx
y-intercepts: 22 2 (0)020 20 (2)0 yy yy yy 0,2yy
The intercepts are (1,0), (0,0), and (0,2).
Test x-axis symmetry: Let yy 22 22 ()2()0 20 different xxyy xxyy
Test y-axis symmetry: Let xx 22 22 ()()20 20 different xxyy xxyy
Test origin symmetry: Let xx and yy . 22 22 ()()()2()0 20 different xxyy xxyy
The graph has none of the indicated symmetries.
11.
222 2 2 2 22 ()() 234 2316 xhykr xy xy
12.
222 22 2 22 ()() 121 121 xhykr xy xy
13.
2 2 2 22 14 12 xy xy
Center: (0,1); Radius = 2

The
Center: (1, –2) Radius = 5
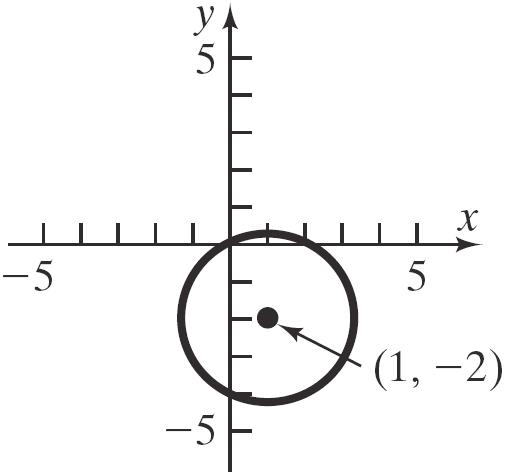
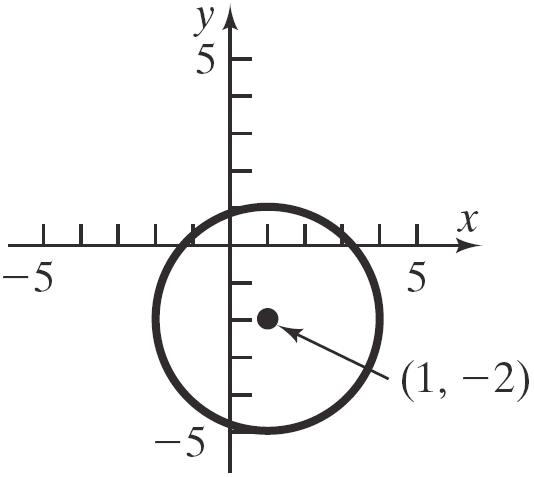
Chapter1: Graphs and Functions
16. Find the distance between each pair of points. 22 , 22 , 22 , (13)(14)4913 (21)(31)9413 (23)(34)25126 AB BC AC d d d
Since AB = BC, triangle ABC is isosceles.
17. Endpoints of the diameter are (–3, 2) and (5,–6). The center is at the midpoint of the diameter:
Center:
Radius: 22 (1(3))(22) 1616 3242
Equation:
18. a. Domain {8, 16, 20, 24}
Range {$6.30, $12.32, $13.99}
b. {(8,$6.30), (16,$13.99), (20,$12.32), (24,$13.99)}
c.
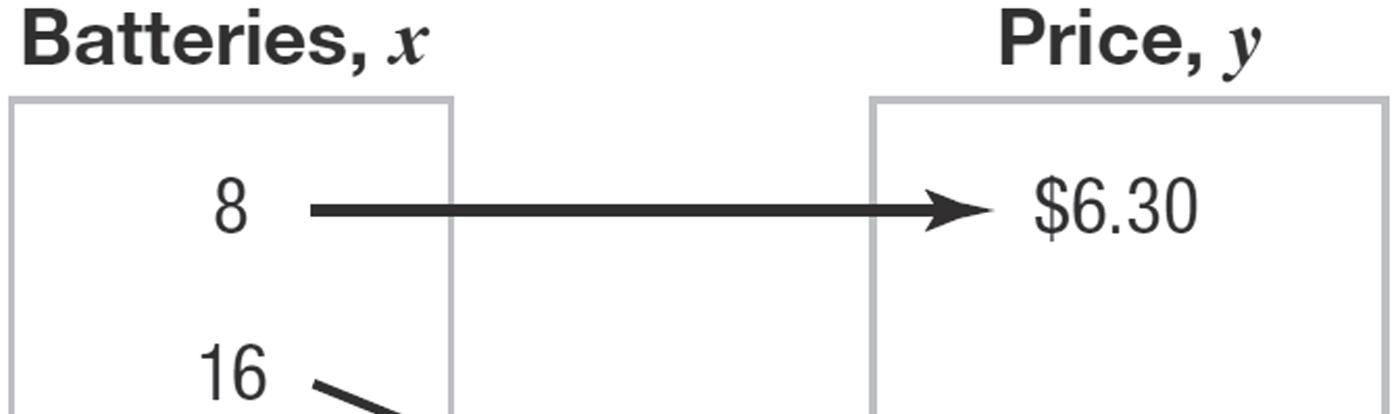
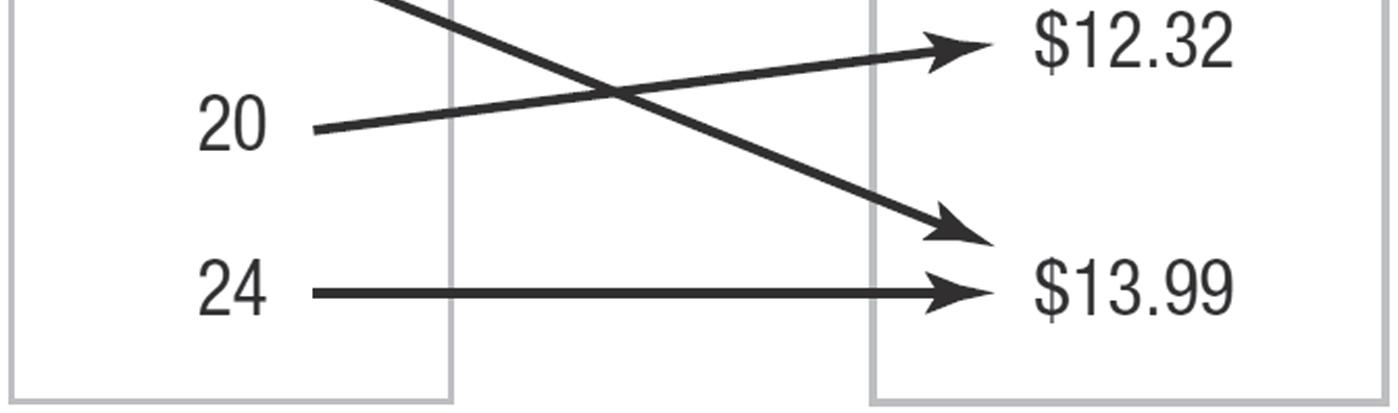
d.
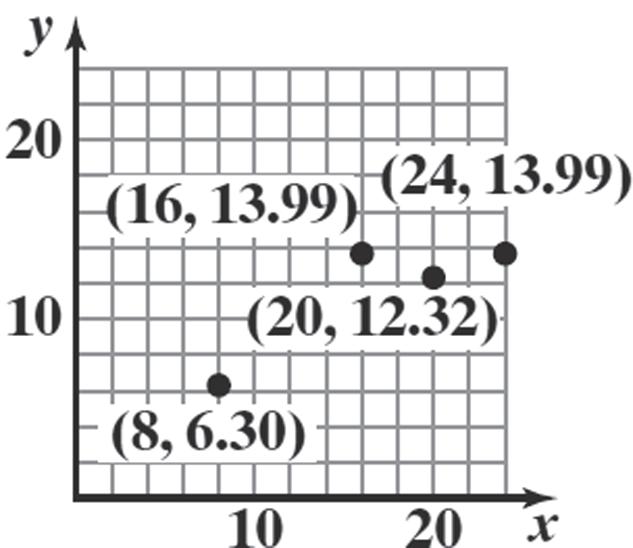
19. This relation represents a function. Domain = {–1, 2, 4}; Range = {0, 3}.
20. This relation does not represent a function, since 4 is paired with two different values.
21. 2 3 () 1 fxx x
a. 2 3(2) 66 (2)2 413 (2)1 f
b. 2 3(2) 66 (2)2 413 (2)1 f
c. 22 3() 3 () ()11 fxxx xx
d. 22 33 () 11 fxxx xx
e. 2 22 3(2) (2) (2)1 32 36 44143 fxx x xx xxxx
f. 22 3(2) 6 (2) (2)141 fxxx xx
22. 2 ()4fxx
a. 2 (2)244400 f
b. 2 (2)244400 f
c. 22 ()()44 fxxx
d. 2 ()4fxx
e. 2 2 2 (2)(2)4 444 4 fxx xx xx
f. 22 22 (2)(2)444 4121 fxxx xx
23. 2 2 4 () fxx x
a. 2 2 24440 (2)0 44 2 f
b. 2 2 24 440 (2)0 44 2 f
c. 2 2 22 ()4 4 () () fxxx xx
d. 222 222 444 () fxxxx xxx
e. 2 2 22 2 22 (2)4 444 (2) (2)(2) 4 4 (2)(2) fxxxx xx xxxx xx
f. 2 2 22 2 2 22 (2)4 44 (2) (2)4 41 1 4 fxxx xx xx xx
24. 2 () 9 fxx x
The denominator cannot be zero: 2 90 (3)(3)0 3 or 3 x xx x
Domain: 3,3xxx
25. ()2 fxx
The radicand must be non-negative: 20 2 x x
Domain: 2 or ,2 xx
26. () x gx x
The denominator cannot be zero: 0 x
Domain: 0 xx
27. 2 () 23 fxx xx
The denominator cannot be zero:
Domain:3, 1 xx xx x xxx
2 230 310 3 or 1
28. 2 1 () 4 fxx x
The denominator cannot be zero:
2 40 220 2 or 2 x xx x
Also, the radicand must be non-negative: 10 1 x x Domain: 1,22,
29. () 8 fxx x
The radicand must be non-negative and not zero: 80 8 x x
Domain: 8 xx
30. 2 ()21 fxxx
31. a. Domain: 43xx ;
b. Intercept: 0,0
c. 21 f
d. 3 fx when x = –4
e. ()0fx when 03 x
|03xx
Chapter1: Graphs and Functions
f. To graph 3 yfx , shift the graph of f horizontally 3 units to the right.
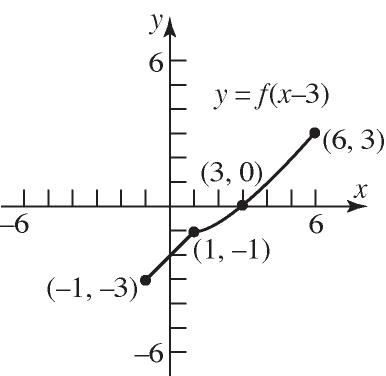
g. To graph 1 2 yfx , stretch the graph of f horizontally by a factor of 2.
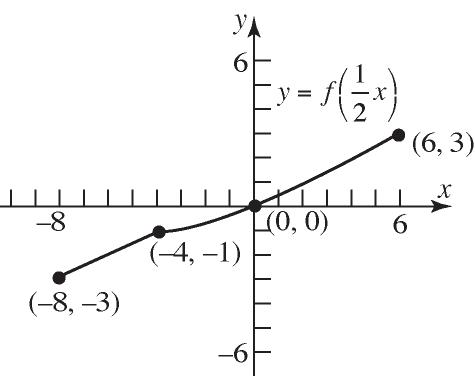
h. To graph yfx , reflect the graph of f vertically about the y-axis.
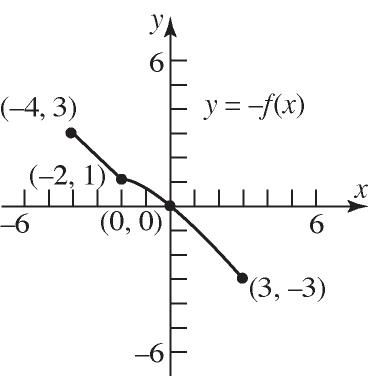
32. a. Domain: ,4 Range: ,3
b. Increasing: ,2 and 2,4 ; Decreasing: 2,2
c. Local minimum is 1 at 2 x ; Local maximum is 1 at 2 x
d. No absolute minimum; Absolute maximum is 3 at 4 x
e. The graph has no symmetry.
f. The function is neither.
g. x-intercepts: 3,0,3 ; y-intercept: 0
33. 3 ()4 fxxx 33 3 ()()4()4 4() fxxxxx xxfx f is odd.
34. 2 4 4 () 1 x gx x 2 2 44 4() 4 ()() 1()1 xx gxgx xx g is even.
35. 3 ()1 Gxxx 3 3 ()1()() 1() or () Gxxx xxGxGx G is neither even nor odd.
36. 2 () 1 fxx x 22 ()() 1()1 fxxxfx xx f is odd.
37. 3 251fxxx on the interval 3,3 Use MAXIMUM and MINIMUM on the graph of 3 1 251yxx .


local maximum: 4.04 when 0.91 x local minimum: 2.04 when 0.91 x f is increasing on: 3,0.91 and 0.91,3 ; f is decreasing on: 0.91,0.91
38. 43 2521fxxxx on the interval 2,3 Use MAXIMUM and MINIMUM on the graph of 43 1 2521yxxx . 2 20 3


local maximum: 1.53 when 0.41 x local minima: 0.54 when 0.34 x , 3.56 when 1.80 x f is increasing on: 0.34,0.41 and 1.80,3 ; f is decreasing on:
2,0.34 and 0.41,1.80
39. 2 ()8 fxxx
a. 22 (2)(1)8(2)2[8(1)1] 211 322(7)23 ff
b.
22 (1)(0)8(1)1[8(0)0] 101 8107 ff
3343324222 (3)(2) 3232 936616 1 271017 ff
42. The graph does not pass the Vertical Line Test and is therefore not a function.
43. The graph passes the Vertical Line Test and is therefore a function. 44. () fxx

Chapter1: Graphs and Functions
46. ()4Fxx . Using the graph of yx , vertically shift the graph downward 4 units.
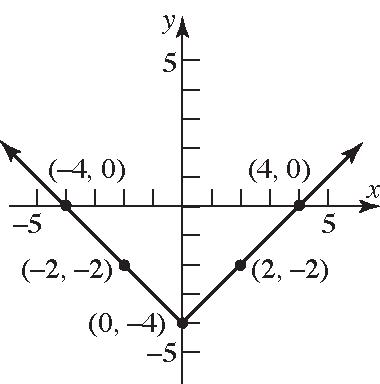
Intercepts: (–4,0), (4,0), (0,–4)
Domain: is any real number xx
Range: 4 yy or 4,
47. ()2 gxx . Reflect the graph of yx about the x-axis and vertically stretch the graph by a factor of 2.
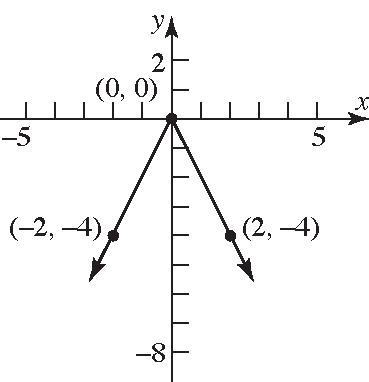
Intercepts: (0, 0)
Domain: is any real number xx
Range: 0 yy or ,0
48. ()1hxx . Using the graph of yx , horizontally shift the graph to the right 1 unit.
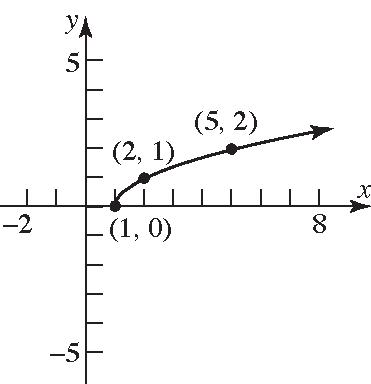
Intercept: (1, 0)
Domain: 1 xx or 1,
Range: 0 yy or 0,
49. ()1(1) fxxx . Reflect the graph of yx about the y-axis and horizontally shift the graph to the right 1 unit.
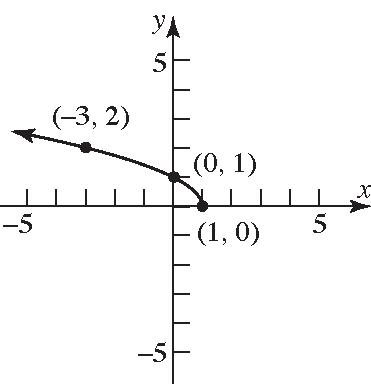
Intercepts: (1, 0), (0, 1)
Domain: 1 xx or ,1
Range: 0 yy or 0,
50. 2 ()(1)2hxx . Using the graph of 2 yx , horizontally shift the graph to the right 1 unit and vertically shift the graph up 2 units.
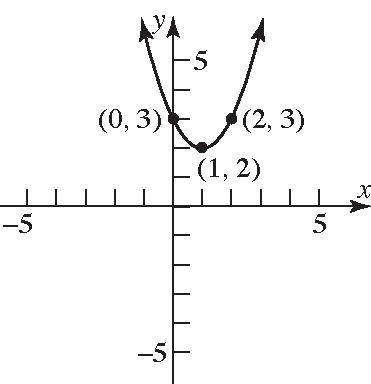
Intercepts: (0, 3)
Domain: is any real number xx
Range: 2 yy or 2,
51. 3 ()2(2)8gxx
Using the graph of 3 yx , horizontally shift the graph to the left 2 units, vertically stretch the graph by a factor of 2, reflect about the x-axis, and vertically shift the graph down 8 units.
3 24,0
y x 5
Intercepts: (0,–24), 3 24,03.6,0
Domain: is any real number xx
Range: is any real number yy
52. 3 if 21 () 1 if 1 xx fx xx
a. Domain: 2 xx or 2,
b. Intercept: 0,0
c. Graph:
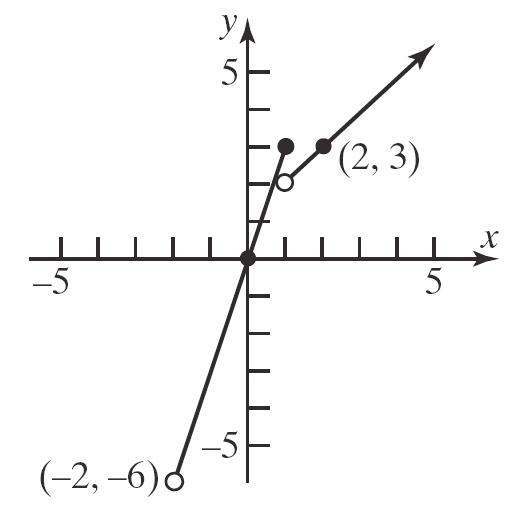
d. Range: |6yy or 6,
53. if 40 ()1if 0 3 if 0 xx fxx xx
a. Domain: 4 xx or 4,
b. Intercept: (0, 1)
c. Graph:
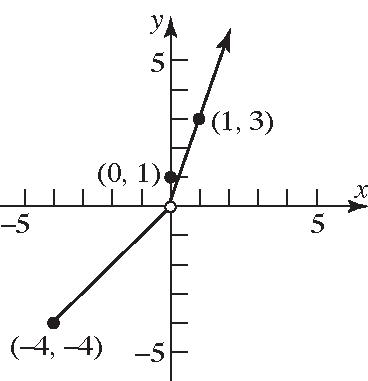
d. Range: 4,0yyy
54. 5 () and (1)4 62 Ax fxf x (1)5 4 6(1)2 5 4 4 516 11 A A A A
55. a. The function is one-to-one because there are no two distinct inputs that correspond to the same output.
b. The inverse is 2,1,5,3,8,5,10,6 .
56. The function f is one-to-one because every horizontal line intersects the graph at exactly one point.

Chapter1: Graphs and Functions
57. 1 ()510;()2 5 fxxgxx 1 (())2 5 1 52101010 5 (())(510) 1 (510)222 5
Thus, f and g are inverses of each other.
x
58. 44 ();() 1
fgxf x xx x x xx gfxgx x x xxx x x xx
Thus, f and g are inverses of each other.
59. 23 () 52fxx x 1 23 52 23 Inverse 52 (52)23 5223 5223 (52)23 23 52 23 () 52 x y x y x y xyy xyxy xyyx yxx x y x fxx x
Domain of f = Range of 1 f = All real numbers except 2 5
Range of f = Domain of 1 f = All real numbers except 2 5
60. 1 () 1 fx x 1 1 1 1 Inverse 1 (1)1 1 1 1 1 () y x x y xy xyx xyx x y x fxx x
Domain of f = Range of 1 f = All real numbers except 1
Range of f = Domain of 1 f = All real numbers except 0
61. ()2fxx 2 2 12 2 2Inverse 20 20 ()20 yx xy xyx yxx fxxx
Domain of f = Range of 1 f |2xx or 2,
Range of f = Domain of 1 f |0xx or 0,
62. 1/3 1/3 1/3 1/3 3 13 ()1 1 1Inverse 1 (1) ()(1) fxx yx xy yx yx fxx
Domain of f = Range of 1 f = All real numbers or ,
Range of f = Domain of 1 f = All real numbers or ,
Chapter 1 Test
1.
2. The coordinates of the midpoint are:
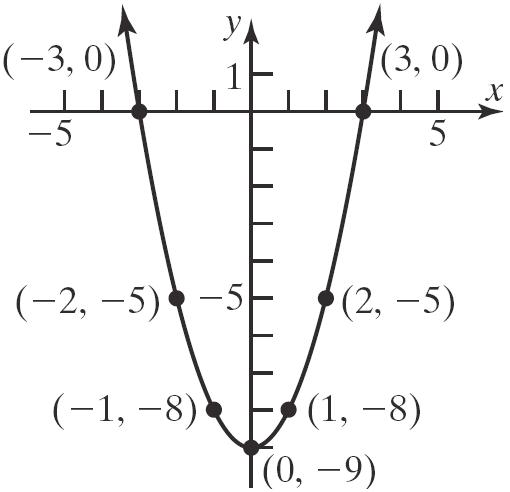
5. 2 9 xy
x-intercepts: y-intercept:
2 2 09 9 3 x x x
2 (0)9 9 y y
The intercepts are 3,0, 3,0, and 0,9.
Test x-axis symmetry: Let yy
2 2 9 9 different xy xy
Test y-axis symmetry: Let xx
2 2 9 9 same xy xy
Test origin symmetry: Let xx and yy 2 2 9 9 different xy xy
Therefore, the graph will have y-axis symmetry.
6. ()()222 xhykr 22 2 22 4(3)5 4325 xy xy
General form: 22 22 22 4325 8166925 860 xy xxyy xyxy
7. 22 22 22 222 4240 424 (44)(21)441 (2)(1)3 xyxy xxyy xxyy xy
Center: (–2, 1); Radius = 3 y x
8. a. 2,5,4,6,6,7,8,8
This relation is a function because there are no ordered pairs that have the same first element and different second elements.
Chapter1: Graphs and Functions
Domain: 2,4,6,8
Range: 5,6,7,8
b. 1,3,4,2,3,5,1,7
This relation is not a function because there are two ordered pairs that have the same first element but different second elements.
c. This relation is not a function because the graph fails the vertical line test.
d. This relation is a function because it passes the vertical line test.
Domain: is any real number xx
Range: |2yy or 2,
The function tells us to take the square root of 45 x . Only nonnegative numbers have real square roots so we need 450 x
10.
or 4 , 5
11.
2 2 x gx x
The function tells us to divide 2 x by 2 x . Division by 0 is undefined, so the denominator can never equal 0. This means that 2 x
Domain: |2xx
12 1 11 1 12 g
2 4 536 hxx xx
The function tells us to divide 4 x by 2 536xx . Since division by 0 is not defined, we need to exclude any values which make the denominator 0. 2 5360 940 xx xx 9 or 4 xx
Domain: |9,4xxx
(note: there is a common factor of 4 x but we must determine the domain prior to simplifying)
2 14 51 1 408 15136 h
12. a. To find the domain, note that all the points on the graph will have an x-coordinate between 5 and 5, inclusive. To find the range, note that all the points on the graph will have a y-coordinate between 3 and 3, inclusive.
Domain: |55xx or 5,5
Range: |33yy or 3,3
b. The intercepts are 0,2 , 2,0 , and 2,0 . x-intercepts: 2,2 y-intercept: 2
c. 1 f is the value of the function when 1 x . According to the graph, 13 f .
d. Since 5,3 and 3,3 are the only points on the graph for which 3 yfx , we have 3 fx when 5 x and 3 x
e. To solve 0 fx , we want to find xvalues such that the graph is below the xaxis. The graph is below the x-axis for values in the domain that are less than 2 and greater than 2. Therefore, the solution set is |52 or 25xxx . In interval notation we would write the solution set as 5,22,5
13. 432242fxxxx
We set Xmin = 5 and Xmax = 5. The standard Ymin and Ymax will not be good enough to see the whole picture so some adjustment must be made.
c. To find 5 g we first note that 5 x so we must use the first “piece” because 51 . 52511019 g
d. To find 2 g we first note that 2 x so we must use the second “piece” because 21
2242 g
15. The average rate of change from 3 to 4 is given by
We see that the graph has a local maximum of 0.86 (rounded to two places) when 0.85 x and another local maximum of 15.55 when 2.35 x . There is a local minimum of 2 when 0 x . Thus, we have
Local maxima:
Local minima: 02 f
The function is increasing on the intervals 5,0.85 and 0,2.35 and decreasing on the intervals 0.85,0 and 2.35,5
To graph the function, we graph each “piece”. First we graph the line 21yx but only keep the part for which 1 x . Then we plot the line 4 yx but only keep the part for which 1 x
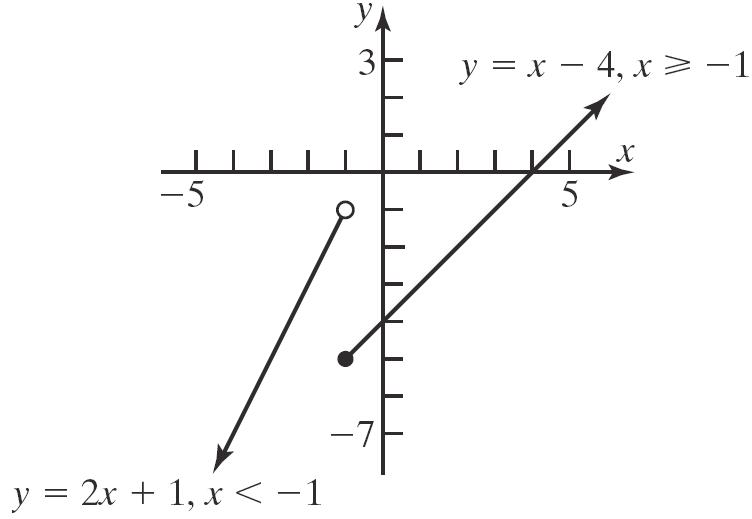
b. To find the intercepts, notice that the only piece that hits either axis is 4 yx . 4 04 4 yx y y
The intercepts are 0,4 and 4,0
16. a. The basic function is 3 yx so we start with the graph of this function.
Next we shift this graph 1 unit to the left to obtain the graph of 3 1 yx .
Next we reflect this graph about the x-axis to obtain the graph of
3 1 yx
Next we stretch this graph vertically by a
Chapter1: Graphs and Functions
factor of 2 to obtain the graph of 3 21yx .
The last step is to shift this graph up 3 units to obtain the graph of 3 213yx
b. The basic function is yx so we start with the graph of this function. y x yx
Next we shift this graph 4 units to the left to obtain the graph of 4 yx .
the graph of 42 yx y
17. 2 () 35 fx x 1 2 35 2 Inverse 35 (35)2 352 352 52 3 52 () 3 y x x y xy xyx
Domain of f = Range of 1 f = 5 3 | xx
Range of f = Domain of 1 f = |0xx
18. If the point (3,5) is on the graph of f, then the point (5, 3) must be on the graph of 1 f
Chapter 1 Projects
Project I – Internet-based Project – Answers will vary
Next we shift this graph up 2 units to obtain
Project II
1.
3. Let y = #K-bytes of service over the plan minimum.
Silver: 200.1650 0.1630 187.5 y y y
Silver is the best up to 187.5200387.5 K-bytes of service.
Gold: 500.08100 0.0850 625 y y y
Gold is the best from 387.5 K-bytes to 62510001625 K-bytes of service.
Platinum: Platinum will be the best if more than 1625 K-bytes is needed.
4. Answers will vary.
01000140425$753.92 11001140416$726.10 2100214049$704.78 3100314044$695.98 4100414041$713.05 5100514040$780.00
The choice where the cable goes 3 miles down the road then cutting up to the house seems to yield the lowest cost.
4. Since all of the costs are less than $800, there would be a profit made with any of the plans.
C() dollars x
x miles
Using the MINIMUM function on a graphing calculator, the minimum occurs at 2.96 x
C() dollars x

The minimum cost occurs when the cable runs for 2.96 mile along the road.
Chapter1: Graphs and Functions
6. 2 C(4.5) = 100(4.5) + 1404(54.5) $738.62
The cost for the Steven’s cable would be $738.62.
7. 5000(738.62) = $3,693,100 State legislated 5000(695.96) = $3,479,800 cheapest cost It will cost the company $213,300 more.
Project IV 1. 2
4. 22 22 (4.4)60.82ft (5.5)95.03ft A A
5. (2.2)4.8422 Att
22 22 4.84(2)60.82ft 4.84(2.5)95.03ft
7. (2.5)(2)95.0360.82 68.42 ft/hr 2.520.5
8. (3.5)(3)186.27136.85 98.84ft/hr 3.530.5
9. The average rate of change is increasing.
10. 150 yds = 450 ft 2.2 450 204.5 hours 2.2 rt
11. 6 miles = 31680 ft Therefore, we need a radius of 15,840 ft. 15,840 7200 hours 2.2