Chapter 2 Graphs, Lines, and Inequalities
Section 2.1 Graphs, Lines, and Inequalities
1. (1, –2) lies in quadrant IV (–2, 1)lies in quadrant II (3, 4) lies in quadrant I (–5, –6) lies in quadrant III
2. (,2) lies in quadrant I
3,2 lies in quadrant IV (4,0) lies in no quadrant (3,3) lies in quadrant II
3. (1, –3) is a solution to 3x – y – 6 = 0 because 3(1) – (–3) – 6 = 0 is a true statement.
4. (2, –1) is a solution to 22 6815xyxy because 22 (2)(–1)6(2)8(1)15 is a true statement.
5. (3, 4) is not a solution to 22 226xy because 22 (32)(42)37, not 6.
6. (1, –1) is not a solution to 22 4 23 xy because 22 1(1)5 236 , not 4 .
7. 4y + 3x = 12
Find the y-intercept. If x = 0, 43(0)124123 yyy
The y-intercept is 3.
Next find the x-intercept. If y = 0, 403123124 xxx
The x-intercept is 4. Using these intercepts, graph the line.
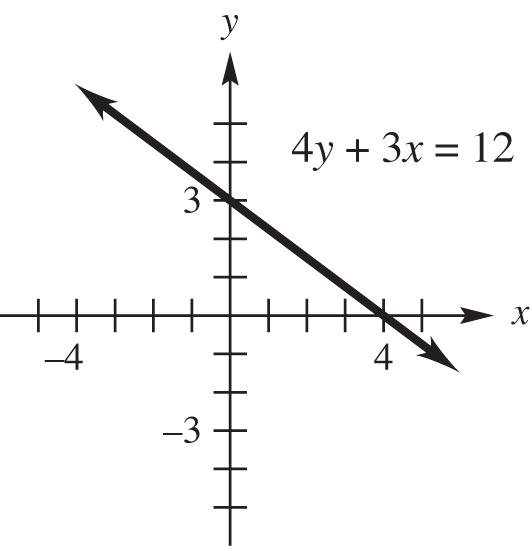
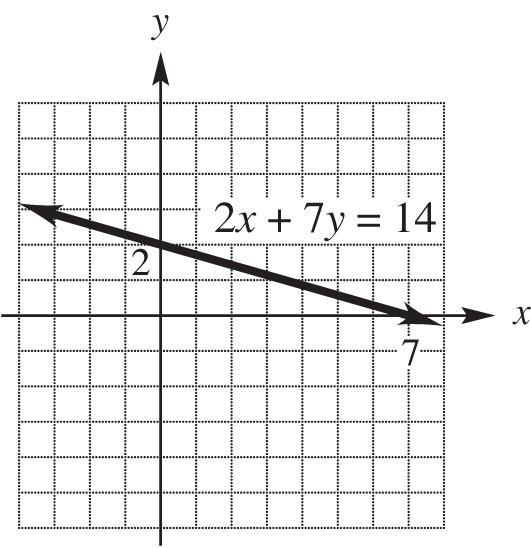
8. 2x + 7y = 14
Find the y-intercept. If x = 0, 2(0)7147142 yyy
The y-intercept is 2.
Next find the x-intercept. If y = 0, 270142147 xxx
The x-intercept is 7.
Using these intercepts, graph the line.
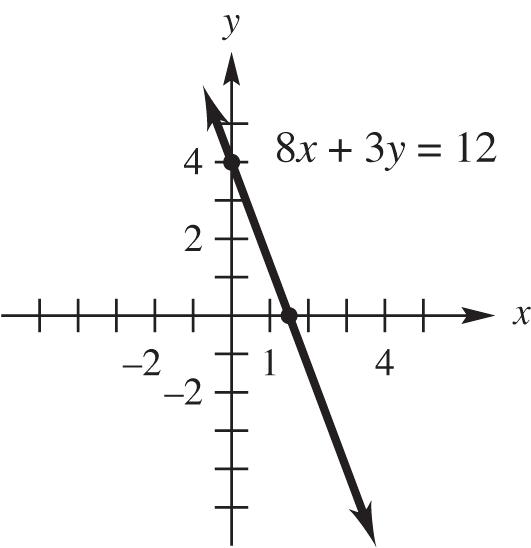
9. 8x + 3y = 12
Find the y-intercept. If x = 0, 3124 yy
The y-intercept is 4.
Next, find the x-intercept. If y = 0, 123 812 82 xx
The x-intercept is 3 2
Using these intercepts, graph the line.
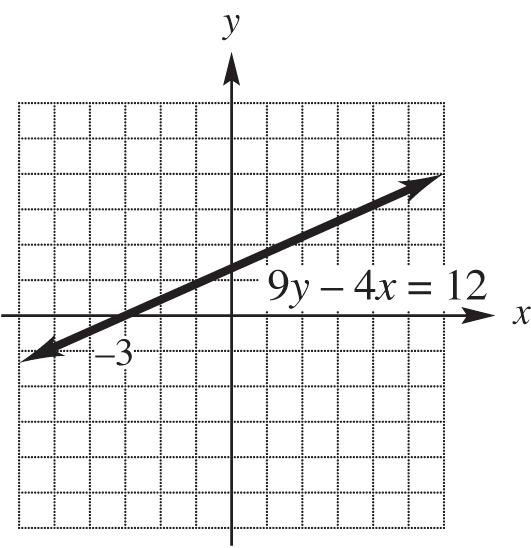
10. 9y – 4x = 12
Find the y-intercept. If x = 0, 124 94(0)12912 93 yyy
The y-intercept is 4 3
Next find the x-intercept. If y = 0, 9(0)4124123 xxx
The x-intercept is –3.
Using these intercepts, graph the line.
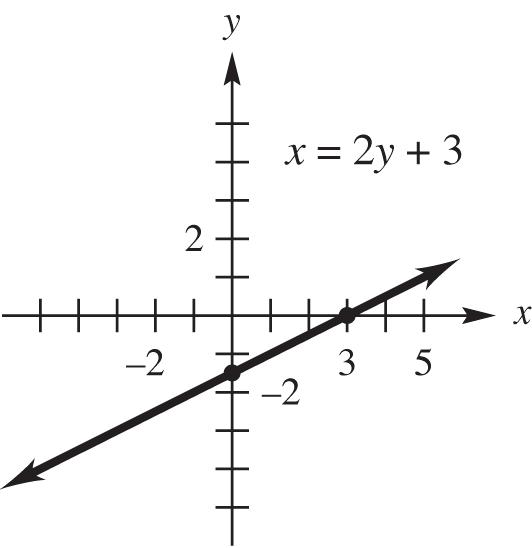
11. x = 2y + 3
Find the y-intercept. If x = 0, 3 02323 2 yyy
The y-intercept is 3 2
Next, find the x-intercept. If y = 0, 2(0)33xx
The x-intercept is 3.
Using these intercepts, graph the line.
12. x – 3y = 0
Find the y-intercept. If x = 0, 300 y
The y-intercept is 0. Since the line passes through the origin, the x-intercept is also 0. Find another point on the line by arbitrarily choosing a value for x. Let x = 3. Then, 331 yy
The point with coordinates (3, 1) is on the line. Using this point and the origin, graph the line.

13. The x-intercepts are where the rays cross the x-axis, –2.5 and 3. The y-intercept is where the ray crosses the y-axis, 3.
14. The x-intercept is 3; the y-intercept is 1.
15. The x-intercepts are –1 and 2. The y-intercept is –2.
16. The x-intercept is 1. There is no y-intercept.
17. 3x + 4y = 12
To find the x-intercept, let y = 0: 34(0)123124 xxx
The x-intercept is 4.
To find the y-intercept, let x = 0: 304124123 yyy
The y-intercept is 3.
18. x – 2y = 5
To find the x-intercept, let y = 0: 2(0)55xx
The x-intercept is 5.
To find the y-intercept, let x = 0. 5 02525 2 yyy
The y-intercept is 5 2 .
19. 2x – 3y = 24
To find the x-intercept, let y = 0: 23(0)2422412 xxx
The x-intercept is 12.
To find the y-intercept, let x = 0: 2(0)3243248 yyy
The y-intercept is –8.
20. 3x + y = 4
To find the x-intercept, let y = 0: 4 30434 3 xxx
The x-intercept is 4 3 .
To find the y-intercept, let x = 0: 3(0)44 yy
The y-intercept is 4.
21. 2 9 yx
To find the x-intercepts, let y = 0: 22 09993 xxx
The x-intercepts are 3 and –3.
To find the y-intercept, let x = 0: 099 y
The y-intercept is –9.
Copyright © 2019 Pearson Education, Inc.
22. 2 4 yx
To find the x-intercepts, let y = 0:
22 044
4 not a real number xx x
There is no x-intercept.
To find the y-intercept, let x = 0:
2 044 y
The y-intercept is 4.
23. 2 20 yxx
To find the x-intercepts, let y = 0:
2 0200(5)(4) 505 or 404 xxxx xxxx
The x-intercepts are –5 and 4.
To find the y-intercept, let x = 0:
2 002020 y
The y-intercept is –20.
24. 2 561yxx
To find the x-intercepts, let y = 0:
2 05610(51)(1)
1 510 or 101 5 xxxx xxxx
The x-intercepts are 1 5 and –1.
To find the y-intercept, let x = 0:
2 5(0)6(0)11 y
The y-intercept is 1.
25. 2 257yxx
To find the x-intercepts, let y = 0:
2 0257 xx
This equation does not have real solutions, so there are no x-intercepts.
To find the y-intercept, let x = 0:
2 2(0)5(0)77 y
The y-intercept is 7.
26. 2 344yxx
To find the x-intercepts, let y = 0: 2 03440(32)(2) 2 320 or 202 3 xxxx xxxx
The x-intercepts are 2 and 2 3
To find the y-intercept, let x = 0: 2 3(0)4(0)44 y The y-intercept is –4.
27. 2 yx x-intercept: 2 00 xx y-intercept: y = 0 x y –2 4 –1 1 0 0 1 1 2 4
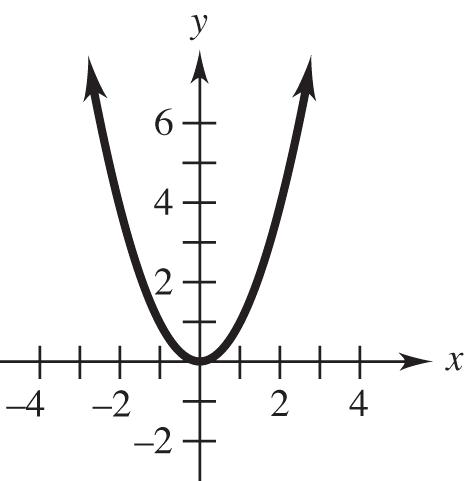
28. 2 2 yx
x-intercept: 22 022 2 not a real number xx x y-intercept: 2 022yy
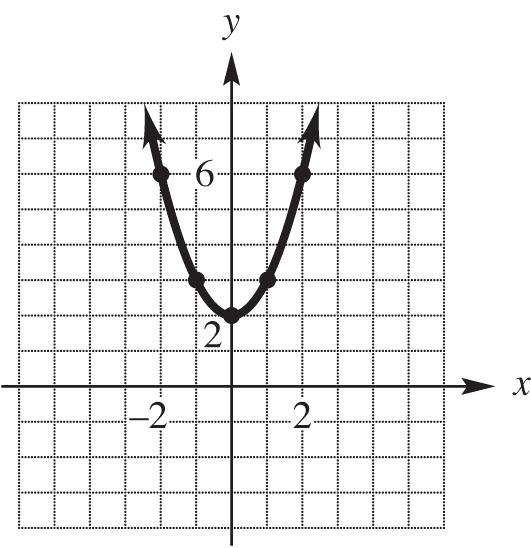
29. 2 3 yx x-intercepts: 22 0333 xxx y-intercepts: 2 033 y x y –3 6 –1 –2

Copyright © 2019 Pearson Education, Inc.
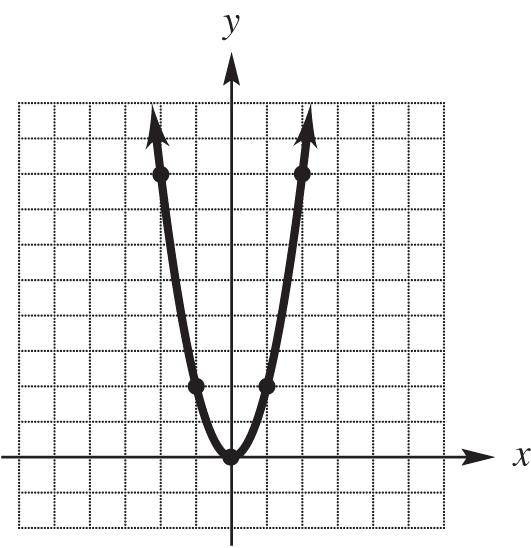
30. 2 2 yx x-intercept: 2 020 xx y-intercept: 2(0)0 y x y
31. 2 65yxx x-intercept: 2 0650(1)(5) 101 or 505 xxxx xxxx
y-intercept: 2 (0)6(0)55 y
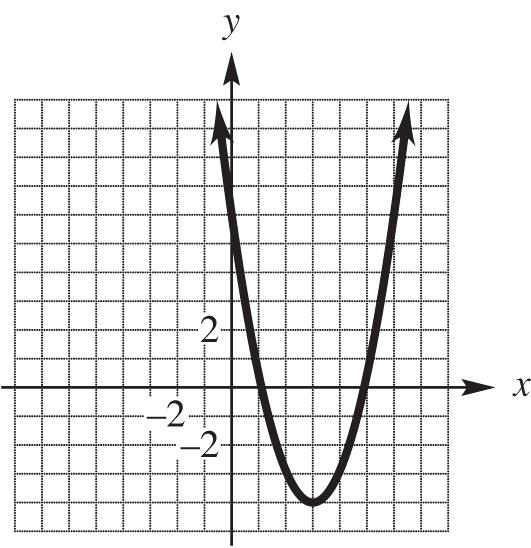
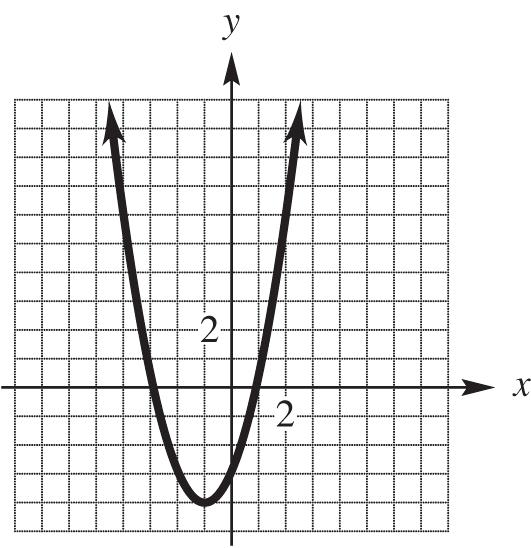
32. 2 23yxx x-intercept: 2 0230(3)(1) 303 or 101 xxxx xxxx y-intercept: 2 (0)2(0)33 y
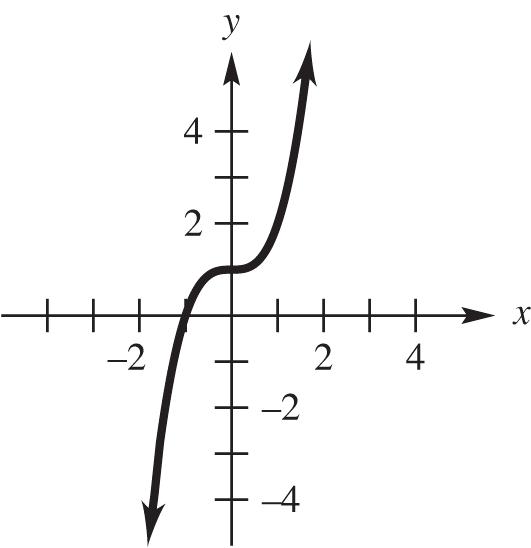
33. 3 1 yx x-intercept: 33 3 01111 xxx y-intercept: 3 011 y x y –2 –7 –1 0 0 1 1 2 2 9
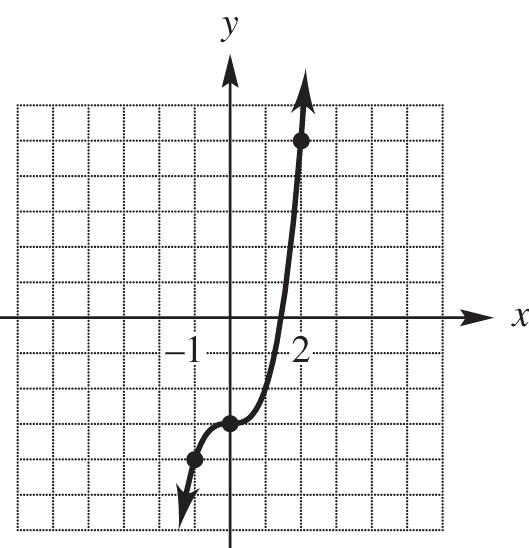
34. 3 3 yx x-intercept: 33 3 0333 xxx y-intercept: 3 033yy x y –2 –11 –1 –4 0 –3 1 –2 2 5
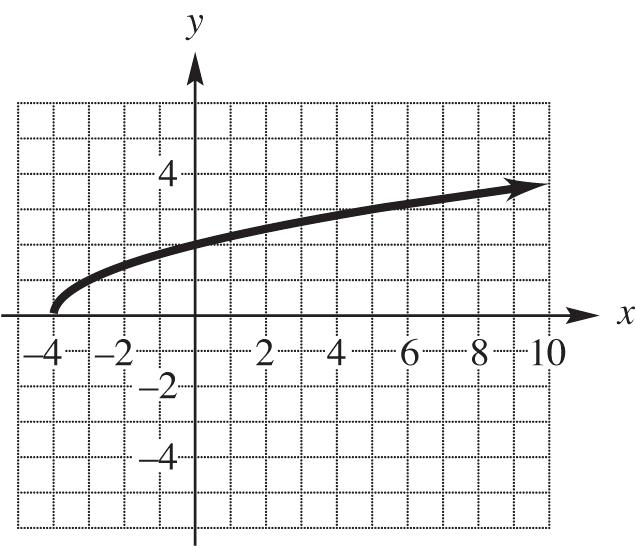
35. 4 yx x-intercept: 04044 xxx y-intercept: 0442 y x y –2 21.4 –1 31.7 0 2 2 62.4 5 3
Copyright © 2019 Pearson Education, Inc.
36. 2 yx
x-intercept: 02022 xxx
y-intercept: 022, y
not a real number




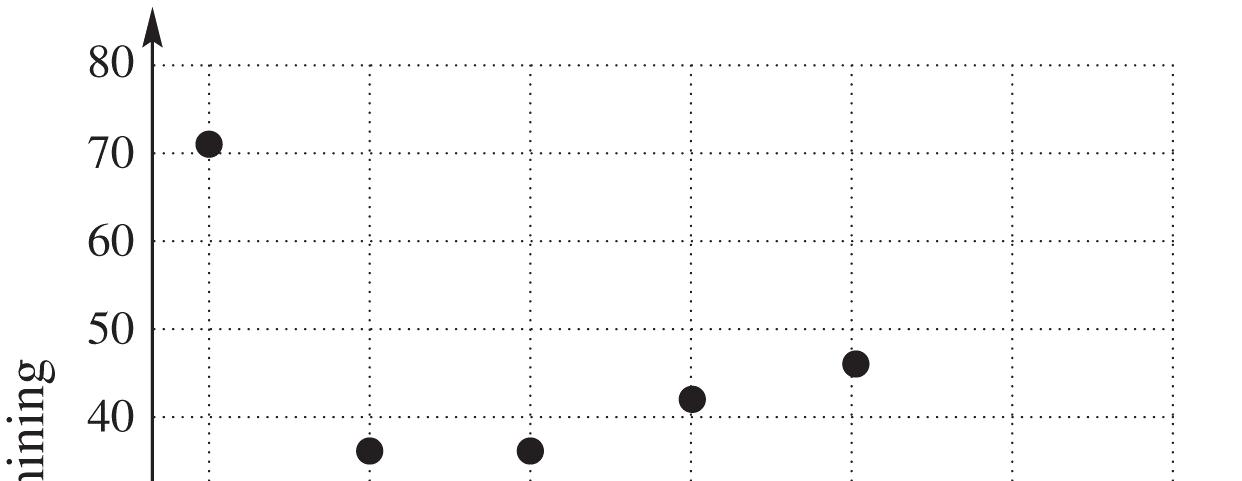
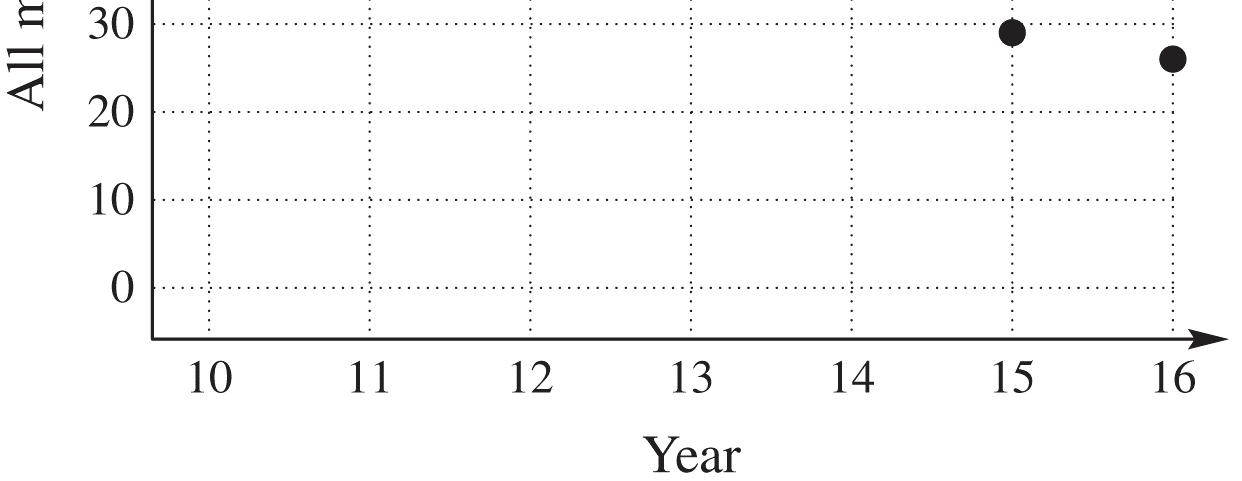
41. 1999
42. 2012
43. 2011
44. 2007
45. (a) about $1,250,000 (b) about $1,750,000 (c) about $4,250,000
46. (a) about $1,000,000 (b) about $2,250,000. (c) about $3,250,000.
47. (a) about $500,000 (b) about $1,000,000. (c) about $1,500,000.
48. (a) about $250,000 (b) about $1,250,000 (c) about $1,500,000.
49. beef, about 57 pounds; chicken, about 81 pounds; pork, about 45 pounds
50. 2007
51. 2009
52. In 2007, annual per person beef consumption was about 75 pounds, while in 2014, annual per person beef consumption was about 64 pounds, so beef consumption decreased about 11 pounds between 2007 and 2014.
53. about $115
54. about $123
55. days 6, 12, and 14 – 21
56. days 1 – 9
57. Day 19; about $117.50
58. Day 19; about $129.00
59. Day 2; about $117.00
60. Day 2; about $109.00
61. about $8.50
62. about $6.00 63. 2 1 yxx
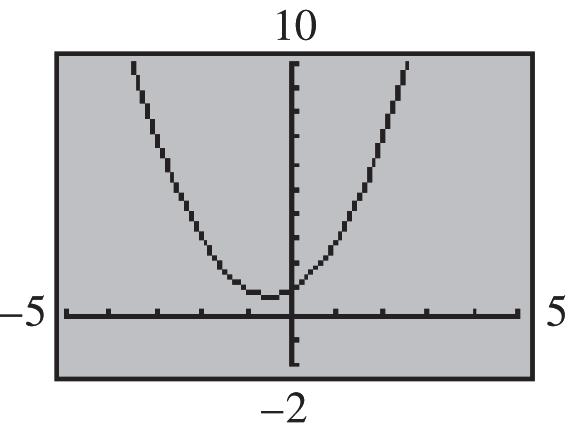
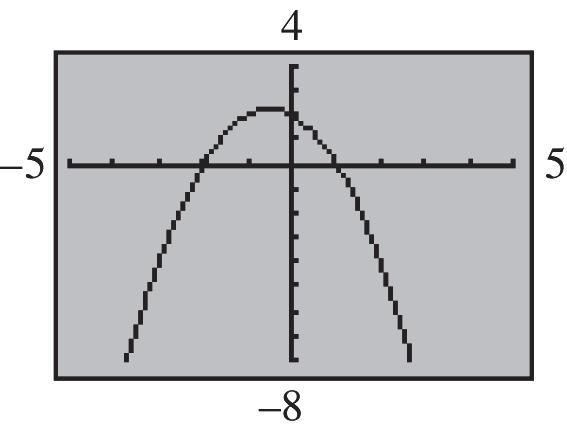
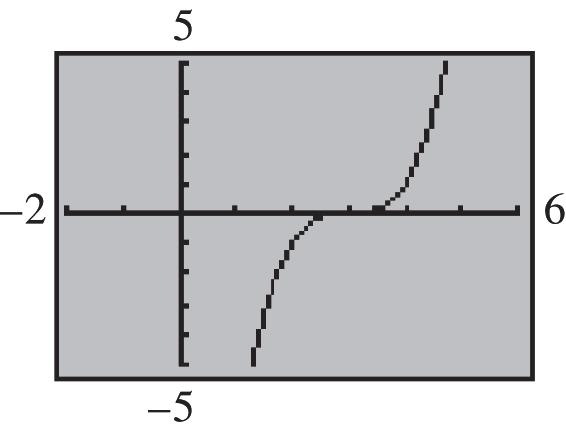
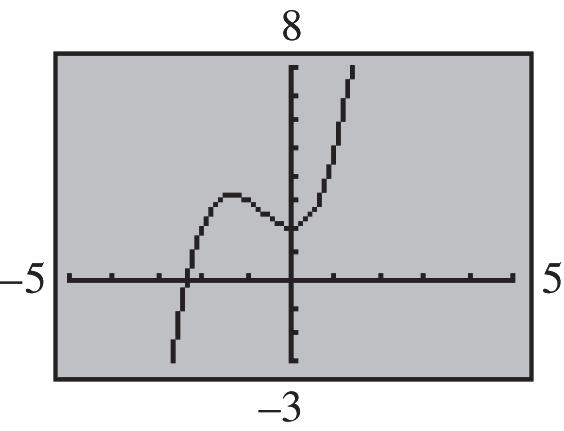
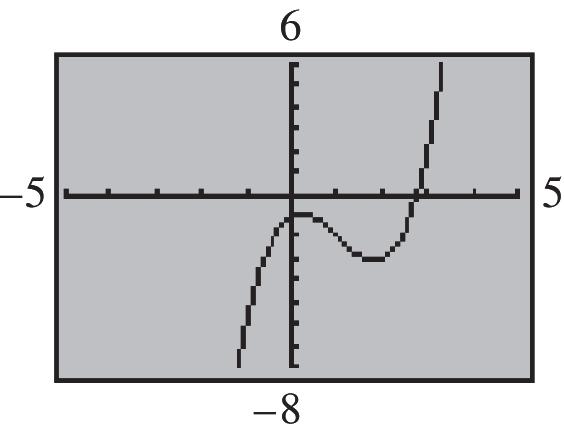
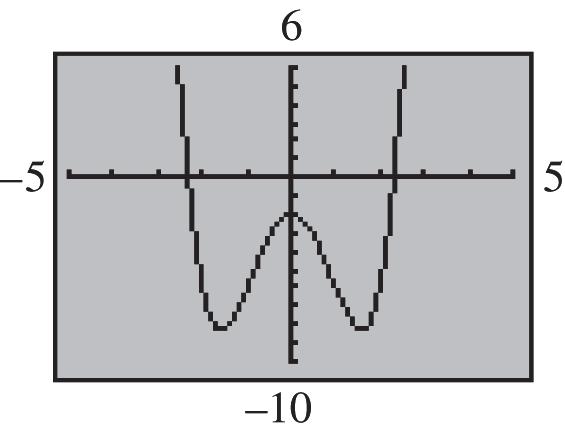
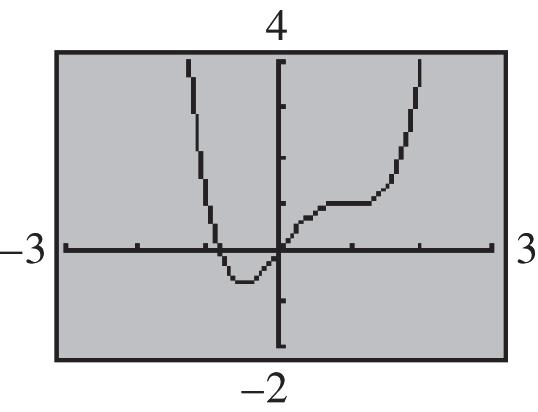
The “flat” part of the graph near 1 x looks like a horizontal line segment, but it is not. The y values increase slightly as you trace along the segment from left to right.
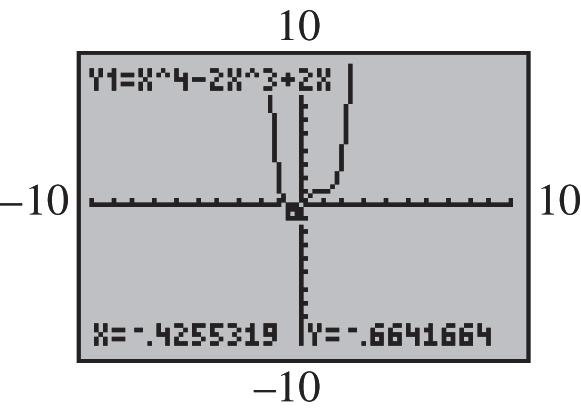
(b) The lowest point on the graph is approximately at (–.5, –.6875). Answers vary. 71. 1.1038 x
[–3, 3] by [–2, 6]
Copyright © 2019 Pearson Education, Inc.
72. .6823 x
[–3, 3] by [–3, 3]
73. 2.1017 x
[–3, 3] by [–5, 5]
74. x ≈ .7555
[–3, 3] by [–5, 5]
75. x ≈ –1.7521
[–3, 3] by [–2, 12]
76. x ≈ 2.7693
[–1, 53] by [–5, 5]
Section 2.2 Equations of Lines
1. Through (2, 5) and (0, 8) 8533 slope 0222 y x
2. Through (9, 0) and (12, 12) slope 12012 4 1293
3. Through (–4, 14) and (3, 0) slope 14014 2 437
4. Through (–5, –2) and (–4, 11) slope 21113 13 5(4)1
5. Through the origin and (–4, 10); the origin has coordinate (0, 0). 100105 slope 4042
6. Through the origin, (0, 0), and (8, –2) slope 2021 8084
7. Through (–1, 4) and (–1, 6) 642 slope ,not defined 1(1)0
The slope is undefined.
8. Through (–3, 5) and (2, 5) slope 550 0 2(3)5
9. b = 5, m = 4 y = mx + b y = 4x + 5
10. b = –3, m = –7 y = mx + b y = –7x – 3
11. b = 1.5, m = –2.3 y = mx + b
y = –2.3x + 1.5
12. b = –4.5, m =2.5 y = mx + b y = 2.5x – 4.5
13. b = 4, 3 4 m y = mx + b 3 4 4 yx
14. b = –3, 4 3 m y = mx + b 4 3 3 yx
Copyright © 2019 Pearson Education, Inc.
15. 2x – y = 9
Rewrite in slope-intercept form. 29 29 yx yx
m = 2, b = –9.
16. x + 2y = 7
Rewrite in slope-intercept form. 27 17 22 yx
17. 6x = 2y + 4
Rewrite in slope-intercept form. 26432 yxyx m = 3, b = –2.
18. 4x + 3y = 24
Rewrite in slope-intercept form. 3424 4 8 3 yx yx
19. 6x – 9y = 16
Write in slope-intercept form. 9616 9616 216 39 yx
20. 4x + 2y = 0
Rewrite in slope-intercept form. 242 y xyx m = –2, b = 0.
21. 2x – 3y = 0
Rewrite in slope-intercept form. 2 32 3 yxyx 2 ,0. 3 mb
22. y = 7 can be written as y = 0x + 7
m = 0, b = 7.
23. x = y – 5
Rewrite in slope-intercept form.
y = x + 5
m = 1, b = 5
24. There are many correct answers, including:

25. (a) Largest value of slope is at C.
(b) Smallest value of slope is at B.
(c) Largest absolute value is at B
(d) Closest to 0 is at D
26. (a) y = 3x + 2
The slope is positive, and the y-intercept is positive. This is line D.
(b) y = –3x + 2
The slope is negative, and the y-intercept is positive. This is line B.
(c) y = 3x – 2
The slope is positive, and the y-intercept is negative. This is line A.
(d) y = –3x – 2
The slope is negative, and the y-intercept is negative. This is line C.
27. 2x – y = –2
Find the x-intercept by setting y = 0 and solving for x: 202221 xxx
Find the y-intercept by setting x = 0 and solving for y: 2(0)222 yyy
Use the points (–1, 0) and (0, 2) to sketch the graph:

Copyright © 2019 Pearson Education, Inc.
28. 2y + x = 4
Find the x-intercept by setting y = 0 and solving for x: 2(0)44 xx
Find the y-intercept by setting x = 0 and solving for y: 204242 yyy
Use the points (4, 0) and (0, 2) to sketch the graph:

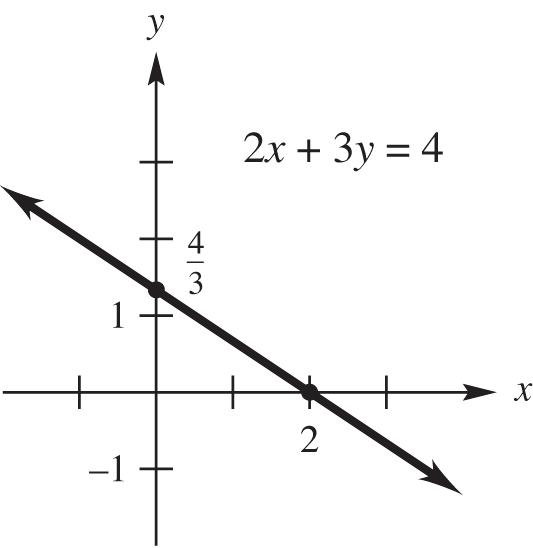
29. 2x + 3y = 4
Find the x-intercept by setting y = 0 and solving for x: 23(0)4242 xxx
Find the y-intercept by setting x = 0 and solving for y: 4 2(0)3434 3 yyy
Use the points (2, 0) and 4 0, 3 to sketch the graph:
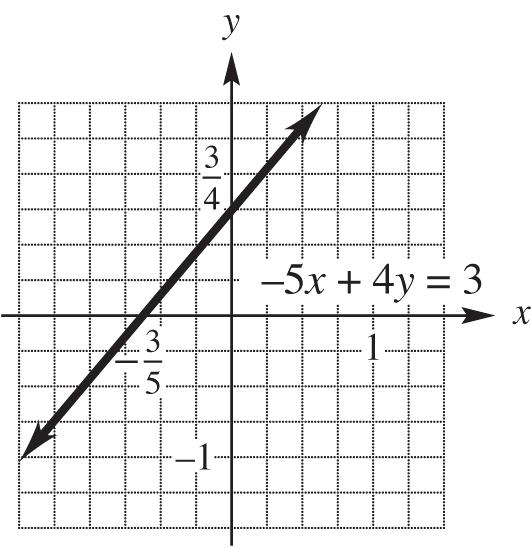
30. –5x + 4y = 3
Find the x-intercept by setting y = 0 and solving for x: 3 54(0)353 5 xxx
Find the y-intercept by setting x = 0 and solving for y: 3 5(0)4343 4 yyy
Use the points 3 ,0 5
and 3 0, 4
to sketch the graph:
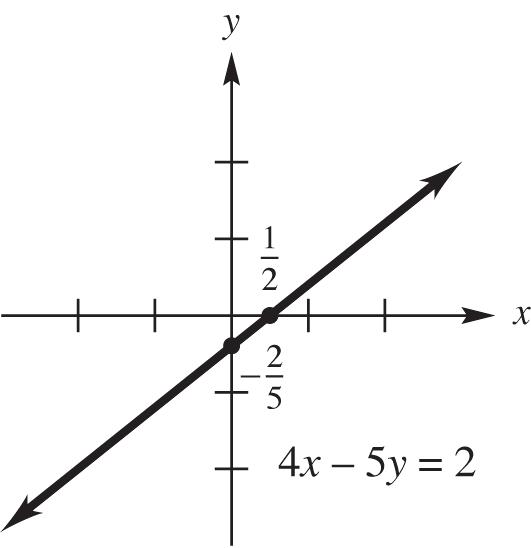
31. 4x – 5y = 2
Find the x-intercept, by setting y = 0 and solving for x: 1
45(0)242 2 xxx
Find the y-intercept by setting x = 0 and solving for y: 2
4(0)5252 5 yyy
Use the points 1 ,0 2
and 2 0, 5
to sketch the graph:
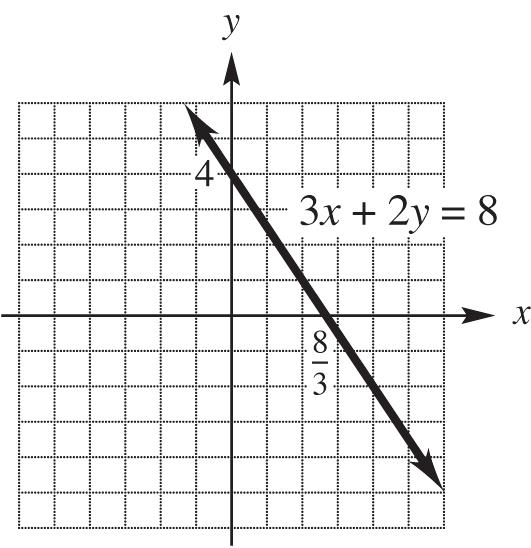
32. 3x + 2y = 8
Find the x-intercept by setting y = 0 and solving for x: 8
32(0)838 3 xxx
Find the y-intercept by setting x = 0 and solving for y:
3(0)28284 yyy
Use the points 8 ,0 3
and (0, 4) to sketch the graph:
Copyright © 2019 Pearson Education, Inc.
33. For 4x – 3y = 6, solve for y 4 2 3 yx
For 3x + 4y = 8, solve for y. 2 4 yx
The two slopes are 4 3 and 3 4 . Since
, the lines are perpendicular.
34. 2x – 5y = 7 and 15y – 5 = 6x Solve each equation for y to find the slope.
The slope of each line is 2 , 5 so the lines are parallel.
35. For 3x + 2y = 8, solve for y. 3 4 2 yx
For 6y = 5 – 9x, solve for y 35 26
Since the slopes are both 3 2 , the lines are parallel.
36. x – 3y = 4 and y = 1 – 3x Solve each equation for y to find the slope.
The product of the slopes is
, so the lines are perpendicular.
37. For 4x = 2y + 3, solve for y 3 2 2
For 2y = 2x + 3, solve for y.
Since the two slopes are 2 and 1, the lines are neither parallel nor perpendicular.
38. 2x – y = 6 and x – 2y = 4
Solve each equation for y to find the slope. 262626 1 24242 2
The slopes are not equal, and their product is 1 21 2
, not –1, so the lines are neither parallel nor perpendicular.
39. Triangle with vertices (9, 6), (–1, 2) and (1, –3).
a. Slope of side between vertices (9, 6) and (–1, 2): 6242
9(1)105
m
Slope of side between vertices (–1, 2) and (1, –3): 2(3)55 1122
m
Slope of side between vertices (1, –3) and (9, 6): 3699 1988
b. The sides with slopes 2 5 and 5 2 are perpendicular, because 25 1 52
. Thus, the triangle is a right triangle.
40. Quadrilateral with vertices (–5, –2), (–3, 1), (3, 0), and (1, –3):
a. Slope of side between vertices (–5, –2) and (–3, 1): 2133 5(3)22
m
m
Slope of side between vertices (–3, 1) and (3, 0): 1011 3366
m
Slope of side between vertices (3, 0) and (1, –3): 0(3)3 312
m
Slope of side between vertices (1, –3) and (–5, –2): 3(2)321 1(5)156
b. Yes, the quadrilateral is a parallelogram because opposite sides have the same slope and are therefore parallel.
41. Use point-slope form with 11 2 (,)(3,2), 3 xym 11() 2 2((3)) 3 2 2(3) 3 2 22 3 2 3 yymxx yx yx yx yx
42. 11 4 (,)(5,2), 5 xym 11() 4 (2)((5)) 5 4 2(5) 5 4 24 5 4 2 5 yymxx yx yx yx yx
43. 11 (,)(2,3),3 xym 11() 33(2) 336 33 yymxx yx yx yx
44. 11 1 (,)(3,4), 4 xym
11() 1 (4)(3) 4 1 4(3) 4 4163 413 113 44 yymxx yx yx yx yx yx
45. 11 (,)(10,1),0 xym 11() 10(10) 101 yymxx yx yy
46. 11 (,)(3,9),0 xym 11() (9)0((3)) 909 yymxx yx yy
47. Since the slope is undefined, the equation is that of a vertical line through (–2, 12).
x = –2
48. Since the slope is undefined, the equation is that of a vertical line through (1, 1).
x = 1
49. Through (–1, 1) and (2, 7) Find the slope. 716 2 2(1)3
m
Use the point-slope form with (2,7),11 x y
11 72(2) 724 23 yymxx yx yx yx
50. Through (2, 5) and (0, 6) Find the slope. 561 202 m
Use the point-slope form with (0,6),11 x y 11 1 6(0) 2 yymxx yx
1 6 2 1 6 2 yx yx
Copyright © 2019 Pearson Education, Inc.
51. Through (1, 2) and (3, 9)
Find the slope. 927 312 m
Use the point-slope form with (1,2),11 x y .
11 7 2(1) 2 77 2 22 73 22 273 yymxx yx yx yx yx
52. Through (–1, –2) and (2, –1)
Find the slope. 2(1)11 1233 m
Use the point-slope form with
(1,2),11 x y
11 1 (2)((1)) 3 1 2(1) 3 361 35 yymxx yx yx yx yx
53. Through the origin with slope 5.
11,(0,0)xy ; m = 5
11 05(0)5 yymxx yxyx
54. Through the origin and horizontal. A horizontal line has slope 0.
11,(0,0)xy
11 00(0) 0 yymxx ym y
55. Through (6, 8) and vertical. A vertical line has undefined slope.
11,(6,8)xy x = 6
56. Through (7, 9) and parallel to y = 6. The line y = 6 has slope 0.
11,(7,9)xy 11 90(7) 909 yymxx yx yy
57. Through (3, 4) and parallel to 4x – 2y = 5. Find the slope of the given line because a line parallel to the line has the same slope.
11,(3,4)xy 425 245 5 22 2 xy yx yxm
11 42(3) 426 22 yymxx yx yx yx
58. Through (6, 8) and perpendicular to y = 2x – 3.
The slope of the given line is 2, so the slope of a line perpendicular to the given line has the slope 1 . 2 m
11,(6,8)xy 11 1 8(6) 2 2166 222 yymxx yx yx yx
59. x-intercept 6; y-intercept –6 Through the points (6, 0) and (0, –6).
0(6)6 1 606 m
11,(6,0)xy 11 01(6)6 yymxx yxyx
Copyright © 2019 Pearson Education, Inc.
60. Through (–5, 2) and parallel to the line through (1, 2) and (4, 3).
The slope of the given line is 2311 , 1433 m so the slope of a line parallel to the line is also 1 . 3
11,(5,2)xy
61. Through (–1, 3) and perpendicular to the line through (0, 1) and (2, 3).
The slope of the given line is 1 132 1, 022 m so the slope of a line perpendicular to the line is 2 1 1. 1 m
11,(1,3)xy
11 31((1)) 31 2 yymxx yx yx yx
62. y-intercept 3 and perpendicular to 2x – y + 6 = 0. 26026 xyyx
The slope of this line is 2, so the slope of a line perpendicular to the line is 1 . 2
11,(0,3)xy
11 1 3(0) 2 26 26 yymxx yx yx yx
63. Let cost x = 15,965 and life: 12 years. Find D
11 15,9651330.42 12 Dx n
The depreciation is $1330.42 per year.
64. Cost: $41,762; life: 15 years 11 41,7622784.13 15
The depreciation is $2784.13 per year.
65. Let cost x = $201,457; life: 30 years
The depreciation is $6715.23 per year.
66. Let x = the amount of the bonus. The manager received as a bonus .10(165,000 – x),so x = .10(165,000 – x). Solve this equation. 16,500.10 1.1016,500 16,500 15,000 1.10 x x x x
The bonus amounted to $15,000.
67. x = 10
3.91027.311.7 y
There was a decrease of 11.7% for Miller Lite beer between 2007 and 2010.
68. x = 14 3.91427.327.3 y
There was a decrease of 27.3% for Miller Lite beer between 2007 and 2015.
69. y = –32
323.927.3 59.33.9 15.21 x x x
The first full year that there will be a decrease of 32% in Miller Lite beer shipments was 2016.
70. y = –40
67.33.9 17.26 x x x
403.927.3
The first full year that there will be a decrease of 40% in Miller Lite beer shipments will be 2018.
71. x = 7
5.675291.2 y
There were 91.2 million malaria cases in 2007.
72. x = 15 5.61552136 y
There were 136 million malaria cases in 2015.
73. y = 150 1505.652 985.6 17.5 x x x
The first full year that there will be 150 million global malaria cases will be 2018.
74. y = 175
1235.6 21.96 x x x
1755.652
The first full year that there will be 175 million global malaria cases will be 2022.
75. .0135(2016)40.3213.104 y
The model predicts that the time for the men’s 5000-m run will be about 13.104 minutes in the 2016 Olympics. This was a difference of .044 minutes from the actual time.
76. The slope of –.0135 indicates that on average, the men’s 5000-meter run is being run .0135 seconds faster every year. It is negative because the times are generally decreasing as time progresses.
77. a. 11 , 11,5 xy and 22 , 15,23 xy
Find the slope. 23518
b. The year 2013 corresponds to x = 2013 – 2000 = 13. 4.5(13)44.514 y
In 2013, Michael Kors had 14% of the luxury handbag market.
c. y = 30 304.544.5 74.54.5 16.56 x x x
The first full year that Michael Kors will had 30% of the luxury handbag market was 2017.
78. a. 11 , 5,3.3 xy and 22 , 15,4.1 xy
Find the slope. 4.13.3.8 .08 15510 m 3.3.085 3.3.08.4 .082.9 yx yx yx
b. The year 2012 corresponds to x = 2012 – 2000 = 12. .08(12)2.93.86 y
In 2012, the global cocoa bean production was 3.86 million metric tons.
c. y = 5 5.082.9 2.1.08 26.25 x x x
The first full year that global cocoa bean production will be 5 million metric tons will be 2027.
79. a. 11 , 10,3500 xy and 22 , 15,5000 xy
Find the slope. 500035001500 300 15105 m 350030010 35003003000 300500 yx yx yx
b. The year 2014 corresponds to x = 2014 – 2000 = 14. 300(14)5004700 y
In 2014, the average annual cost to employees for employer family health coverage was $4700.
c. y = 6000 6000300500 5500300 18.33 x x x
The first full year that the average annual cost to employees for employer family health coverage will exceed $6000 will be 2019.
Copyright © 2019 Pearson Education, Inc.
80. a. 11 , 10,10000 xy and 22 , 15,17000 xy
Find the slope. 17000100007000 1400 15105 m
10000140010 10000140014000 14004000 yx yx yx
b. The year 2012 corresponds to x = 2012 – 2000 = 12. 1400(12)400012,800 y
In 2012, the average annual cost to employers for employer family health coverage was $12,800.
c. y = 25,000 25,00014004000 29,0001400 20.71 x x x
The first full year that the average annual cost to employers for employer family health coverage will exceed $25,000 will be 2021.
Section 2.3 Linear Models
1. a. Let (,11 ) x y be (32, 0) and (,22 ) x y be (68, 20).
Find the slope. 200205 6832369 m
Use the point-slope form with (32, 0). 55 0(32)(32) 99 yxyx
b. Let x = 50. 55(5032)(18)10C 99 y
Let x = 75. 55(7532)(43)23.89C 99 y
2. 55 3232 99 yxCF
a. F = 58°F 55(5832)(26)14.4 99 CC
b. C = 50°C 5 5032 9 4505160 6105122 F F FF
c. C = –10°C 5 1032 9 905160 70514 F F FF
d. F = –20°F 55(2032)(52)28.9 99 CC
3. F = 867° 55(86732)(835)463.89 99 CC
4. When are Celsius and Fahrenheit temperatures numerically equal? Set F = C: 5 3295160 9 416040 CFFFF FF The temperatures are numerically equal at –40°.
Copyright © 2019 Pearson Education, Inc.
5. Let 11 , 11,224.9 xy and 22 , 16,240.0. xy Find the slope.
240.0224.9 3.02 1611 m
224.93.02(11)
224.93.0233.22
3.02191.68 yx yx yx
To estimate the CPI in 2012, let x = 12.
3.0212191.68227.92 y
To estimate the CPI in 2015, let x = 15.
3.0215191.68236.98 y
6. Let 11 , 5,68.5 xy and 22 , 16,123.7. xy Find the slope.
123.768.555.2 5.02 16511 m
68.55.02(5)
5.0243.4 yx yx yx
68.55.0226.10
To estimate the number of electronically filed returns in 2010, let x = 2010 – 2000 = 10.
5.021043.493.6 y
There were about 93.6 million electronically filed tax returns in 2010.
To estimate the number of electronically filed returns in 2015, let x = 2015 – 2000 = 15
5.021543.4113.7 y
There were about 113.7 million electronically filed tax returns in 2015.
7. Let 11 , 5,12.3 xy and 22 , 14,13.3. xy Find the slope.
13.312.31 .11 1459 m
12.3.11(5)
12.3.11.55 .1111.75 yx yx yx
To estimate the number of employees working in educational services in 2012, let x = 2012 – 2000 = 12.
.111211.7513.08 y
The number of employees was estimated to be 13.08 million in 2012.
8. Let 11 , 5,12.1 xy and 22 , 14,13.5. xy Find the slope.
13.512.1 .16 145 m
12.1.16(5)
12.1.16.78 .1611.32 yx yx yx
To estimate the number of employees working in the leisure and hospitality industries in 2013, let x = 2013 – 2000 = 13. .161311.3213.4 y
The number of employees was about 13.4 million in 2013.
9. Find the slope of the line. 11 22 ,(50,320) ,(80,440) xy xy 21 21 440320120 4 805030 yy m xx
Each mile per hour increase in the speed of the bat will make the ball travel 4 more feet.
10. 1120 gal60 min12 hr 806,400 minhrday yxx
After 30 days, y = 806,400(30) = 24,192,000 gallons
11. a. .07.83yx
Data Point (x, y)
Model Point
(6, .7) (6,1.25) –.55 .3025 (8, 1.22) (8, 1.39) –.17 .0289
(10, 1.53)(10, 1.53) 0 0
(12,2.02) (12, 1.67) .35 .1225 (14,1.81) (14,1.81) 0 0
Copyright © 2019 Pearson Education, Inc.
.2.38yx
Data Point (x, y)
Point
y
Residu al ˆ yy Squared Residual 2 ˆ y y
(6, .7) (6,.82) –.12 .0144
(8, 1.22) (8, 1.22) 0 0 (10, 1.53) (10, 1.62) –.09 .0081 (12,2.02) (12, 2.02) 0 0 (14,1.81) (14,2.42) –.61 .3721
Sum of the residuals for model 1 = –.37
Sum of the residuals for model 2 = –.82
b. Sum of the squares of the residuals for model 1 = .4539
Sum of the squares of the residuals for model 2 = .3946
c. Model 2 is the better fit.
12. a. 1.352.5yx
Data Point (x, y)
ˆ , x y
al ˆ yy Squared Residual
(10, 16) (10,16) 0 0
(11, 21) (11,17.35) 3.65 13.3225
(12, 21) (12,18.7) 2.3 5.29
(13, 23) (13,20.05) 2.95 8.7025
(14,21.4) (14,21.4) 0 0
23yx
Data Point (x, y) Model Point
(10, 16) (10,17) –1 1
(11, 21) (11,19) 2 4
(12, 21) (12,21) 0 0
(13, 23) (13,23) 0 0
(14,21.4) (14,25) –3.6 12.96
Sum of the residuals for equation 1 = 8.9
Sum of the residuals for equation 2 = –2.6
b. Sum of the squares of the residuals for equation 1= 27.315. Sum of the squares of the residuals for equation 2= 17.96.
c. Equation 2 is the better fit.
13. Plot the points.
[10, 16] by [3500, 4500]
Visually, a straight line looks to be a good model for the data.
The coefficient of correlation is r ≈ –.9999, which indicates that the regression line is a good fit for the data.
14. Plot the points.
[0, 12] by [0, 3]
Visually, a straight line looks to be a poor model for the data because it shows a great deal of curvature.
The coefficient of correlation is r ≈ .068, which indicates that the regression line is not a good fit for the data.
Copyright © 2019 Pearson Education, Inc.
15. a. Using a graphing calculator, the regressionline model is 170.86320.yx
b. The year 2018 corresponds to x = 18. Using the regression-line model generated by a graphing calculator, we have 170.81863203246, y or about 3246 credit unions.
16. a. Using a graphing calculator, we find that the linear model is 23.9486.4yx
b. Let x = 35. Using the regression-line model generated by a graphing calculator, we have 23.98486.4678, y or about $678 billion.
17. a. Using a graphing calculator, the regressionline model is y = .8x + 14.2.
b. The third quarter of 2017 corresponds to x = 11. Using the regression-line model generated by a graphing calculator, we have .81114.223, y or about $23 billion in revenue.
18. a. Using a graphing calculator, the regressionline model is y = 85.4 + .842x
b. Using the regression-line model:
Let x = 42 years-old.
y = 85.4 + .842(42) = 120.764
Let x = 53 years-old.
y = 85.4 + .842(53) = 130.026
Let x = 69 years-old.
y = 85.4 + .842(69) = 143.498
The predicted values are very close to the actual data values.
c. Using the regression-line model:
Let x = 45 years-old.
y = 85.4 + .842(45) = 123.29
Let x = 70 years-old.
y = 85.4 + .842(70) = 144.34
The systolic blood pressure for a 45 yearold and a 70 year-old are predicted to be 123.29 and 144.34 respectively.
19. a. Using a graphing calculator, the regression line model for amount of construction spending on highways and streets (in billions of dollars) is given by 1.82998.4.yx
b. Let x = 12 (December 2016). 1.8291298.476.5 billion y
The total amount of construction spending on highways and streets was about $76.5 billion in December 2016.
20. a. Using a graphing calculator, the regression-line model is 1.4975.76.yx
b. 1.49(13)75.7656.39. y There were about 56.39 million subscribers in 2013.
c. Let y = 50. 501.4975.76
25.761.49 17.28 x x x
There will be 50 million subscribers in the year 2018.
d. Using a graphing calculator, the coefficient of correlation is about –.986.
21. a. Using a graphing calculator, the regression-line model is .29548.yx
b. .295(10)4850.95. y There was about $50.95 billion in revenue for the second quarter of 2017.
c. Let y = 52. 52.29548 4.295 13.56 x x x
There will be $52 billion in revenue during the second quarter of 2018.
d. Using a graphing calculator, the coefficient of correlation is about .795.
22. a. Using a graphing calculator, the regression-line model for men is .21452.6.yx
b. Using a graphing calculator, the regression-line model for women is .13466.3.yx
c. .21452.5.13466.3 .0813.8 172.5 xx x x
According to the models, the life expectancy of men will be the same as women in the year 2072.
Copyright © 2019 Pearson Education, Inc.
Section 2.4 Linear Inequalities
1. Use brackets if you want to include the endpoint, and parentheses if you want to exclude it.
2. (c). –7 > –10
3. –8k ≤ 32
Multiply both sides of the inequality by 1 8
Since this is a negative number, change the direction of the inequality symbol.
11
88(8)(32)4 kk
The solution is [–4, ∞).

4. –4a ≤ 36
Multiply both sides by 1 4 . Change the direction of the inequality symbol.
11
44(4)(36)9 aa
The solution is [– 9, ∞).

5. 20 b
Multiply both sides by 1 2 11
20(2)(0)0 22 bbb
The solution is (–∞, 0). To graph this solution, put a parenthesis at 0 and draw an arrow extending to the left.

6. 6 – 6z < 0
Add 6z to both sides.
6660666 zzzz
Multiply both sides by 1 6
11 (6)(6)1 or 1 66 zzz
The solution is (1, ∞).

7. 3414 x
Subtract 4 from both sides.
344144310 xx
Multiply each side by 1 3
1110 310 333 xx
The solution is 10 , 3

8. 2y – 7 < 9
Add 7 to both sides. 27797216 yy
Multiply both sides by 1 2 11 22(2)(16)8 yy
Solution is (–∞, 8).

For exercises 9–26, we give the solutions without additional explanation.
9. 53 5535 8 (1)()(1)(8) 8 p p p p p
The solution is (–∞, –8].

10. 53(5)4(5) 39 11 (3)9 33 3 r r r r
The solution is [3, ∞).

Copyright © 2019 Pearson Education, Inc.
11. 75210 5510 515 11 55(5)(15) 3 mm m m m m
The solution is (–∞, 3).

12. 62410 6244104 2210 222102 28 11 22(2)(8) 4 xx x xxx x x x x x
The solution is (–4, ∞).

13. (42)322 42322 122 mmm mmm mm
11 33(3)(3) 1 m m
The solution is (–1, ∞).

14. 2(3)72 2372 337–2 1032 101 1 10 ppp ppp pp p p p
The solution is 1 , 10

15. 2(38)5(42) 6162010 1610206 2626 1 or 1 yy yy yy y yy
The solution is (–∞, 1].

16. 5(2)3(1)6 52336 4233 23 5 rrr rrr rr r r
The solution is [5, ∞).

17. 3162(1) 31622 12623 15 11 or 55 ppp ppp ppp p pp
The solution is 1 , 5 .

18. 5(1)4(2) 5584 6583 958 93 1 3 x xxx x xxx xx x x x
The solution is 1 , 3

Copyright © 2019 Pearson Education, Inc.
19. 725 722252 57 y y y
The solution is (–5, 7).

20. 362 3(6)6(6)2(6) 94 m m m
The solution is (–9, –4).

21. 83116 813161 7315 7 5 3 r r r r
The solution is 7 ,5 3

22. 6235 6323353 328 111 (3)(2)(8) 222 3 4 2 p p p p p
The solution is 3 ,4 2

23. 21 42 3 21 4(3)32(3) 3 12216 121261 1127 117 22 k k k k
The solution is 117 , 22

24. 52 14 3 52 3(1)33(4) 3 35212 5510 12 y y y y y
The solution is [–1, 2].

25. 31 510(23)(51)
31 10(23)10(51) 510 6(23)51 121851 717 17 7 pp pp pp pp p p
The solution is 17 , 7

26. 82 39(4)(32) 83224 3339 6324 339 432 2 93 10050 2 99
The solution is 50 , 9

27. 2 x 28. x < –2 29. –3 < x ≤ 5
Copyright © 2019 Pearson Education, Inc.
30. 44 x
31. C = 50x + 6000; R = 65x To at least break even, R ≥ C 65506000 156000400 xx xx
The number of units of wire must be in the interval [400, ∞).
32. Given C = 100x + 6000; R = 500x Since R ≥ C, 5001006000400600015 xxxx
The number of units of squash must be in the interval [15, ∞).
33. C = 85x + 1000; R = 105x 105851000 201000 1000 50 20 RC xx x xx x must be in the interval [50, ∞).
34. C = 70x + 500; R = 60x 6070500 10500 10500 500 50 10 RC xx x x xx
It is impossible to break even.
35. C = 1000x + 5000; R = 900x 90010005000 1005000 5000 50 100 RC xx x xx
It is impossible to break even.
36. C = 25,000x + 21,700,000; R = 102,500x 102,50025,00021,700,000 77,50021,700,000 21,700,000 280 77,500 RC xx x xx x must be in the interval 280,.
37. 7 p p < –7 or p > 7
The solution is (–∞, –7) or (7, ∞).

38. 222mm
The solution is (–2, 2).

39. 555rr
The solution is [–5, 5].

40. 2 a
Since the absolute value of a number is never negative, the inequality has no solution.

41. 5 b
The absolute value of a number is always nonnegative. Therefore, 5 b is always true, so the solution is the set of all real numbers.
42. 251 1251 15215 624 3–2 x x x x x
The solution is (–3, –2).

43. 1 2 2 1 22 2 35 22 x x x
The solution is 35 , 22

Copyright © 2019 Pearson Education, Inc.
44. 314 314or314 341341 3335 5 1 3 z zz zz zz zz
The solution is 5 , 3

45. 857 b 857or857 812or82 31 or 24 bb bb bb
The solution is 3 , 2

46. 1 525 2 1 57 2 1 757 2 11 757 22 1513 5 22 151131 2525 313 210 x x x x x x x
The solution is 313 , 210

47. 837 7837 7690 T T T
48. 6327 276327 3690 T T T
49. 6121 216121 4082 T T T
50. 4322 224322 2165 T T T
51. 35.53 P 35.53 335.53
32.538.5 P P P
52. 10012 x
53. 3543 B
54. 13.115.1 U
55. The seven income ranges are: 09325 932537,950 37,95091,900 91,900191,650 191,650416,700 416,700418,400 418,400 x x x x x x x
56. The eight income ranges are: 08450 845011,650 11,65013,850 13,85021,300 21,30080,150 80,150214,000 214,0001,070,350 1,070,350 x x x x x x x x
Copyright © 2019 Pearson Education, Inc.
Section 2.5 Polynomial and Rational Inequalities
1. (x + 4)(2x – 3) ≤ 0
Solve the corresponding equation.
(x + 4)(2x – 3) = 0 40or230 3 4 2
Note that because the inequality symbol is “≤,” –4 and 3 2 are solutions of the original inequality. These numbers separate the number line into three regions.
In region A, let x = –6: (–6 + 4)[2(–6)–3] = 30 > 0.
In region B, let x = 0: (0 + 4)[2(0) – 3] = –12 < 0.
In region C, let x = 2: (2 + 4)[2(2) – 3] = 6 > 0.
The only region where (x + 4)(2x – 3) is negative is region B, so the solution is 3 4, 2
. To graph this solution, put brackets at –4 and 3 2 and draw a line segment between these two endpoints.

2. (51)(3)0 yy
Solve the corresponding equation. (51)(3)0 yy 510 or 3 0 5 1 3 1 5 yy yy y
Note that because the inequality symbol is "" , 1 and 3 5 are not solutions of the original inequality. These numbers separate the number line into three regions.
In region A, let x = –6: [5(–6) – 1][–6+3] = 93 > 0.
In region B, let x = 0: [5(0) – 1][0 + 3] = – 3 < 0.
In region C, let x = 2: [5(2) – 1][2 + 3] = 45 > 0
The regions where (5y – 1)(y + 3) is positive are regions A and C, so the solutions are 1 5 ,3 and ,. To graph this solution, put parentheses at –3 and 1 5 and draw rays as shown below.

3. 2 43rr
Solve the corresponding equation. 2 2 43 430 (1)(3)0 rr rr rr 10or30 1or3 rr rr
Note that because the inequality symbol is “>,” –1 and –3 are not solutions of the original inequality.
In region A, let r = –4: 2 (4)4(4)03 .
In region B, let r = –2: 2 (2)4(2)43 .
In region C, let r = 0: 2 04(0)03
The solution is (–∞, –3) or (–1, ∞).
To graph the solution, put a parenthesis at –3 and draw a ray extending to the left, and put a parenthesis at 1 and draw a ray extending to the right.

Copyright © 2019 Pearson Education, Inc.
4. 2 68zz
Solve the corresponding equation.
2 68zz 2 680zz (2)(4)0 20or 40
2or 4 zz zz zz
Because the inequality symbol is “>”, 2 and 4 are not solutions of the original inequality.

6. 2 61130 pp
Solve the corresponding equation.
2 61130 (31)(23)0 pp pp 310or230 13 or 32 pp pp
In region A, let 5: z 2 56(5)830
In region B, let 3: z 2 36(3)810
In region C, let 0: z
2 06(0)880
The solution is ,4 or 2,.

5. 2 4720 mm
Solve the corresponding equation.
2 4720 (41)(2)0 mm mm 410or20 1 or2 4 mm mm
Because the inequality symbol is “≤” 1 4 and –2 are solutions of the original inequality.
Because the inequality symbol is “ ,” 1 3 and 3 2 are solutions of the original inequality. These points divide a number line into three regions.
In region A, let m = –3:
2 4(3)7(3)2130 .
In region B, let m = 0: 2 4(0)7(0)220
In region C, let m = 1:
2 4(1)7(1)290
The solution is 1 2, 4
.
In region A, let p = 0.
2 6(0)11(0)330
In region B, let p = 1.
2 6(1)11(1)320
In region C, let p = 10.
2 6(10)11(10)34930
The numbers in regions A and C do not satisfy the inequality, so the solution is 13 , 32

7. 2 4310 xx
Solve the corresponding equation.
2 4310 (41)(1)0 xx xx 410or10 1 or1 4 xx xx
Note that 1 4 and –1 are not solutions of the original inequality.
Copyright © 2019 Pearson Education, Inc.
In region A, let x = –2:
2 4(2)3(2)190
In region B, let x = 0:
2 4(0)3(0)110 .
In region C, let x = 1:
2 4(1)3(1)160 .
The solution is (–∞, –1) or 1 , 4
.

8. 22 3523520 xxxx
Solve the corresponding equation.
2 3520 (31)(2)0 xx xx 310or20 1 or2 3 xx xx
Because the inequality symbol is“>,” 1 3 and 2 are not solutions of the original inequality.
9. 2 36 x
Solve the corresponding equation.
2 366xx
For region A, let x = –7: 2 (7)4936 .
For region B, let x = 0: 2 0036
For region C, let x = 7: 2 74936 .
Both endpoints are included. The solution is [–6, 6].

10. 2 9 y
Solve the corresponding equation.
2 93yy
Note that –3 and 3 are solutions to the original inequality.
In region A, let x = –1.
2 3(1)5(1)82
In region B, let x = 0.
2 3(0)5(0)02
In region C, let x = 10.
2 3(10)5(10)2502
The numbers in regions A and C satisfy the inequality, so the solution is 1 , 3
or (2, ∞).

In region A, let y = –4: 2 (4)169
In region B, let y = 0:
2 009
In region C, let y = 4: 2 (4)169
The solution is (–∞, –3] or [3, ∞).

11. 2 160pp
Solve the corresponding equation.
2 160(16)0 0 or 16 pppp pp
Since the inequality is “>”, 0 and 16 are not solutions of the original inequality.
Copyright © 2019 Pearson Education, Inc.
For region A, let p = –1:
2 (1)16(1)170 .
For region B, let p = 1:
2 116(1)150 .
For region C, let p = 17:
2 1716(17)170
The solution is (–∞, 0) or (16, ∞).

12. 2 90rr
Solve the corresponding equation.
2 90 (9)0 rr rr 0or90 0or9 rr rr
Note that 0 and 9 are not solutions to the original inequality.
In region A, let x = –4:
3 (4)9(4)280 .
In region B, let x = –1:
3 (1)9(1)80 .
In region C, let x = 1:
3 (1)9(1)80
In region D, let x = 4:
3 49(4)280
The solution is [–3, 0] or [3, ∞).
14. 3 250pp
Solve the corresponding equation.
3 2 250 250 (5)(5)0 pp pp ppp
p = 0 or p = –5 or p = 5
Because the inequality is “≤,” 0, –5, and 5 are solutions of the original inequality. Locate these points and regions A, B, C, and D on a number line.
In region A, let r = –1:
2 (1)9(1)19100
In region B, let r = 1:
2 (1)9(1)1980
In region C, let r = 10:
2 (10)9(10)10090100
The solution is (0, 9).

13. 3 90xx
Solve the corresponding equation.
3 2 90 90 (3)(3)0 xx xx xxx
x = 0 or x = –3 or x = 3
Note that 0, –3, and 3 are all solutions of the original inequality.
Test a number from each region in
3 250pp .
In region A, let p = –10.
3 (10)25(10)7500
In region B, let p = –1.
3 (–1)25(1)240
In region C, let p = 1.
3 125(1)240
In region D, let p = 10.
3 1025(10)7500
The numbers in regions A and C satisfy the inequality, so the solution is (–∞, –5] or [0, 5].
15. (x + 7)(x + 2)(x – 2) ≥ 0
Solve the corresponding equation.
(x + 7)(x + 2)(x – 2) = 0 70or20or20 7or2or2 xxx xxx
Note that –7, –2 and 2 are all solutions of the original inequality.
Copyright © 2019 Pearson Education, Inc.

In region A, let x = –8:
(–8 + 7)(–8 + 2)(–8 – 2) = –60 < 0
In region B, let x = –4:
(–4 + 7)(–4 + 2)(–4 – 2) = 36 > 0
In region C, let x = 0:
(0 + 7)(0 + 2)(0 – 2) = –28 < 0
In region D, let x = 3:
(3 + 7)(3 + 2)(3 – 2) = 50 > 0
The solution is [–7, –2] or [2, ∞).
16. 2 (24)90 xx
Solve the corresponding equation.
2 (24)(9)0 xx
(2x + 4)(x + 3)(x – 3) = 0
240or30or30 2or3or3 xxx xxx
Note that –2, –3 and 3 are all solutions of the original inequality.

In region A, let x = –5:
2 25459616960
In region B, let x = –2.5:
2 22.542.5912.75
In region C, let x = 0:
2 2040949360
In region D, let x = 4:
2 24449127840
The solution is ,3 or [–2, 3].
17. 2 (5)230 xxx
Solve the corresponding equation.
2 (5)230 xxx
(x + 5)(x + 1)(x – 3) = 0 50or10or30 5or1or3 xxx xxx
Note that –5, –1 and 3 are not solutions of the original inequality.

18.
In region A, let x = –6: 2 656263145 450
In region B, let x = –2: 2 25222335150
In region C, let x = 0: 2 05020353150
In region D, let x = 4: 2 45424395450
The solution is (–∞, –5) or (–1, 3).
32230 xxx
Solve the corresponding equation.
32230 xxx
2 230xxx
x(x + 1)(x – 3) = 0 x = –1 or x = 0 or x = 3
Note that –1, 0 and 3 are solutions of the original inequality.
In region A, let x = –2: 32 (2)2(2)3(2)886100
In region B, let 1 2 x : 32 111 23 222 1137 0 8228
In region C, let x = 1: 32 12(1)3(1)12340
In region D, let x = 4: 32 42(4)3(4)643212200
The solution is [– , 1 ] or [0, 3]
Copyright © 2019 Pearson Education, Inc.
19. 3232 6546540 kkkkkk
Solve the corresponding equation.
32 2 6540 6540 (34)(21)0 kkk kkk kkk
k = 0 or 4 3 k or 1 2 k
Note that 0, 4 3 , and 1 2 are not solutions of the original inequality.
In region A, let k = –1:
32 6(1)5(1)4(1)70
In region B, let 1 4 k : 32 11119 6540; 44432
In region C, let k = 1:
32 6(1)5(1)4(1)30
In region D, let k = 10:
32 6(10)5(10)4(10)5460
The given inequality is true in regions A and C.
The solution is 1 , 2
or 4 0, 3
20. 3232 2742740 mmmmmm
Solve the corresponding equation.
32 2 2740 2740 (21)(4)0 mmm mmm mmm
m = 0 or 1 2 m or m = –4
Since the inequality is“>,” 0, 1 2 , and –4 are not solutions of the original inequality. Locate these points and regions, A, B, C, and D on a number line.
In region A, let m = –10.
32 2(10)7(10)4(10)12600
In region B, let m = –1.
32 2(1)7(1)4(1)90
In region C, let 1 4 m
32 11117 2740 44432
In region D, let m = 1.
32 2(1)7(1)4(1)50
The numbers in regions B and D satisfy the inequality, so the solution is (–4, 0) or 1 , 2
21. The inequality 2 16 p should be rewritten as 2 160 p and solved by the method shown in this section for solving quadratic inequalities. This method will lead to the correct solution (–4, 4). The student’s method and solution are incorrect.
22. To solve 2 672, x x write the inequality as 2 2670 xx .
Graph the equation 2 267yxx .
Enter this equation as 1y and use –4 < x < 4 and –15 < y < 5. On the CALC menu, use “zero” to find the x-values where the graph crosses the xaxis. These values are x = – 0.8979 and x = 3.8979. The graph is above the x-axis to the left of – 0.8979 and to the right of 3.8979. The solution of the inequality is (–∞,–0.8979) or (3.8979, ∞).
[–4, 6] by [–15,5]
Copyright © 2019 Pearson Education, Inc.
23. To solve 2 .51.2.2 xx ,write the inequality as 2 .51.2.20 xx . Graph the equation 2 .51.2.2yxx . Enter this equation as 1y and use –4 ≤ x ≤ 6 and –5 ≤ y ≤ 5. On the CALC menu, use “zero” to find the x-values where the graph crosses the x-axis. These values are x = –.1565 and x = 2.5565. The graph is below the x-axis between these two values. The solution of the inequality is (–.1565, 2.5565).
[–4, 6] by [–5,5]
24. To solve 2 3.17.43.20 xx , graph the equation 2 3.17.43.2yxx . Enter this equation as 1y and use –5 ≤ x ≤ 5 and –5 ≤ y ≤ 5. On the CALC menu, use “zero” to find the x-values where the graph crosses the x-axis. These values are x = .5672 and x = 1.8199. The graph is above the x-axis to the left of .5672 and to the right of 1.8199. The solution of the inequality is ,.5672 or 1.8199,.
26. To solve 4326252 xxxx , graph
432 1 62 yxxx and 2 52yx in the window [–2, 8] by[–100, 100]. On the CALC menu, use “intersect” to find the x-values where the graphs intersect. These values are x = .3936 and x = 5.7935. The graph of y1 is below the graph of y2 for (.3936, 5.7935), so the solution is (.3936, 5.7935).
27. To solve 432 23242, xxxx graph
43 1 23 yxx and 2 2 242yxx in the window [–2, 2] by[–5, 5]. On the CALC menu, use “intersect” to find the x-values where the graphs intersect. These values are x = .5 and x = .8393. The graph of y1 is below the graph of y2 to the right of .5 and to the left of .8393. The solution of the inequality is (.5, .8393).
[–5, 5] by [–5, 5]
25. To solve 3225721 x xxx , graph
32 1 257yxxx and 2 21yx in the window [–5, 5] by[–10, 10]. On the CALC menu, use “intersect” to find the x-values where the graphs intersect. These values are x = –2.2635, x = .7556 and x = 3.5079. The graph of y1 is above the graph of y2 for [–2.2635, .7556] or [3.5079, ∞).
28. To solve 54325432, xxxx graph
54 1 5 yxx and 32 2 432yxx in the window [–8, 4] by[–1600, 400]. There is clearly one intersection near x = –6. On the CALC menu, use “intersect” to find this value, x = –5.78323. Next, change the window to [–2, 2] by [–5, 5] to examine the behavior of the graphs near the origin. From this view, it is clear that the graphs do not intersect, and y1 is below the graph of y2 The graph of y1 is above the graph of y2 for (–5.78323, ∞).
Copyright © 2019 Pearson Education, Inc.
29. 4 0 1 r r
Solve the corresponding equation. 4 0 1 r r
The quotient can change sign only when the numerator is 0 or the denominator is 0. The numerator is 0 when r = 4. The denominator is 0 when r = 1. Note that 4 is a solution of the original inequality, but 1 is not.
In region A, let r = 0: 04
40 01 .
In region B, let r = 2: 24
20 21
In region C, let r = 5: 531 0 514
The given inequality is true in regions A and C, so the solution is (–∞, 1) or [4, ∞).
30. 6 1 4 z
Solve
Therefore, the function has no solutions. The denominator is zero when z = –4. Note that –4 is not a solution of the original inequality.
Test a number from each region in the original inequality.
In region A, let z = –6. 66 01 64
In region B, let z = 0. 063 1 042
The numbers in region B satisfy the inequality, so the solution is (– 4, ∞).
31. 2 1 5 a a
Solve the corresponding equation. 2 1 5 2 10 5 25 0 55 27 0 5 a a a a aa aa a a
The numerator is 0 when 7 2 a . The denominator is 0 when a = 5. Note that 7 2 and 5 are not solutions of the original inequality.
.
In region A, let a = 0: 022 1 055
In region B, let a = 4: 422 21 451
In region C, let a = 10: 1028 1 1055
The solution is 7 ,5 2
32. 11
353 k
Solve the corresponding equation 11 353 11 0 353
33. 11 23 p
311(35) 0
3(35)3(35) 3(35) 0 3(35) 335 0 3(35) 83 0 3(35) k k k kk k k k k k k
The numerator is zero when 8 3 k . The denominator is zero when 5 3 k . Note that 8 3 and 5 3 are not solutions of the original inequality.
Solve the corresponding equation. 11 23 11 0 23 3(2) 0 3(2) 32 0 3(2) 5 0 3(2) p p p p p p p p
The numerator is 0 when p = 5. The denominator is 0 when p = 2. Note that 2 and 5 are not solutions of the original inequality.
Test a number from each region in the original inequality.
In region A, let k = 0. 111
3(0)553
In region B, let k = 2. 11 1 3(2)53
In region C, let k = 3. 111
3(3)543
The numbers in regions A and C satisfy the inequality, so the solution is 5 , 3
or 8 , 3
In region A, let p = 0: 111 0223
In region B, let p = 3: 11 1 323
In region C, let p = 6: 111 6243 . The solution is (–∞, 2) or (5, ∞).
34. 71 22kk
Solve the corresponding equation. 71 22 71 0 22 6 0 2 kk kk k
Therefore, the numerator is never zero, but the denominator is zero when k + 2 = 0 or k = –2, but the inequality is undefined when k = –2.
Copyright © 2019 Pearson Education, Inc.
Test a number from each region in the original inequality.
For region A, let k = –3. 7 7 32 and 1 1 32
Since –7 ≤ –1, –3 is not a solution of the inequality.
For region B, let k = 0. 77
022 and 11 022
Since 71 22 , 0 is a solution of the inequality.
The numbers from region B satisfy the inequality, so the solution is (–2, ∞).
35. 512 11pp
Solve the corresponding equation.
The numerator is never 0. The denominator is 0 when p = –1. Therefore, in this case, we separate the number line into only two regions.
36. 2 4 0 x x
Solve the corresponding equation.
2 4 0 x x 2 40or0 (2)(2)0or0 xx xxx 20or20or0 2or2or0 xxx xxx
Note that –2, 0 and 2 are not solutions of the original inequality.
In region A, let p = –2:
In region B, let p = 0: 5
In region A, let x = –3, 2 (3)4945 0 333
In region B, let x = –1: 2 (1)414 30 11
In region C, let x = 1: 2 143 30 11
In region D, let x = 3: 2 34945 0 333 .
The solution is (–2, 0) or (2, ∞).
37. 2 6 0 xx x
Solve the corresponding equation. 2 6 0 xx x 2 60or0 (3)(2)0or0 xxx xxx 30or20or0 3or2or0 xxx xxx
Note that –2, 0 and 3 are not solutions of the original inequality.
Therefore, the given inequality is true in region A. The only endpoint, –1, is not included because the symbol is “>.” Therefore, the solution is (–∞, –1).
Copyright © 2019 Pearson Education, Inc.
In region A, let x = –3: 2 (3)(3)69366 20 333
In region B, let x = –1: 2 (1)(1)61164 40 111
In region C, let x = 1: 2 116 60 1
In region D, let x = 4: 2 446161063 0 4442 The solution is (–∞, –2) or (0, 3).
38. a. When 440xx , let 0 x 0440 is positive. Therefore 4 x is positive when 4 x
b. When 440xx , 4 x is negative. Let 5. x 5410.
c. When 4 x , the quantity 4 x is positive, so you don’t change the direction of the inequality. When x < –4, x + 4 is negative, so you must change the direction of the inequality sign.
d. Answers vary, but you must consider two separate cases ( 4 x and 4 x ) and solve the inequality in each case.
39. To solve 2 2 21 0 44 xx x x , break the inequality into two inequalities 2 210 xx and 2 440xx . Graph the equations 2 21yxx and 2 44yxx . Enter these equations as 1y and 2 y , and use –3 < x < 3 and –2 < y < 2. On the CALC menu, use “zero” to find the x-values where the graphs cross the x-axis. These values for 1y are x = –1 and x = .5. The graph of 1y is below the x-axis to the right of –1 and to the left of .5. The graph of 2 y is never below the x-axis. The solution of the inequality is [–1, .5].
40. To solve 32 2 3529 3 7 xxx x , rewrite the inequality with 0 on one side.
32 2 3529 30 7 xxx x
322 2 352937 0 7 xxxx x
322 2 3529321 0 7 xxxx x
32 2 658 0 7 xxx x
Now break the inequality into two inequalities: 326580 xxx and 2 70 x . Graph the equations 32658yxxx and 2 7 yx .
Enter these equations as 1y and 2 y , and use –6 < x < 6 and –25 < y < 10. On the CALC menu, use “zero” or “root” to find the x-values where the graphs cross the x-axis. The value for 1y is x = 5.3445. The graph of 1y is above the x-axis to the right of 5.3445. The values for 2 y are x = –2.6458 and x = 2.6458. The graph of 2 y is above the x-axis to the left of –2.6458 and to the right of 2.6458. The solution of the inequality is 7,7 or (5.3445, ∞).
Copyright © 2019 Pearson Education, Inc.
41. 2 21232Pxx
The company makes a profit when 2 212320 xx . Solve the corresponding equation.
2 2 212320 26160 2802 or 8 xx xx xxxx
The test regions are ,2,2,8,AB and 8,. C Region A makes no sense in this context, so we ignore this. Test a number from regions B and C in the original inequality.
For region B, let x = 0.
2 2012032320
For region C, let x = 10.
2 210121032480
The numbers in region C satisfy the inequality. The company makes a profit when the amount spent on advertising in hundreds of thousands of dollars is in the interval 8,.
42. 2 43014Ptt
We want to find the values of t for which P > 0, that is, we must solve the inequality
2 430140 tt
Solve the corresponding equation.
2 2 430140 221570 1 2170 or 7 2 tt tt tttt
We only consider positive values of t because t represents time (in months). The test regions are 11 22 0,,,7,AB and 7,. C
In region A, let 1 4 . t : 2 1127 430140. 444
In region B, let t = 3: 2 4330314400.
In region C, let t = 10: 2 4103010141140. .
The solution is 1 2 0, or 7, .
The investor makes a profit between t = 0 and 1 2 t month and after 7 months.
43. 2 30018,000Pxx
The complex makes a profit when 2 30018,0000.xx
Solve the corresponding equation. 2 2 030018,000
xx x xx
300(300)4(1)(18,000) 2(1)
51.25 or 351.25
We only consider positive values of x because x represents the number of apartments rented. The test regions are 0,52 A and 52,200. B
In region A, let x = 1: 2 1300118,00017,6990 .
In region B, let x = 100: 2 10030010018,00022,0000 .
The complex makes a profit when the number of units rented is between 52 and 200, inclusive, or when x is in the interval [52, 200].
44. 2 55300xx
Use a graphing calculator to solve 2 55300xx
[0, 30] by [–10, 10]
The graph lies above the x-axis for x > 20.657. Thus, the salesman needs to make 21 pitches or more to earn a profit.
Copyright © 2019 Pearson Education, Inc.


