SHORT ANSWER. Write the word or phrase that best completes each statement or answers the question. Solve the problem.
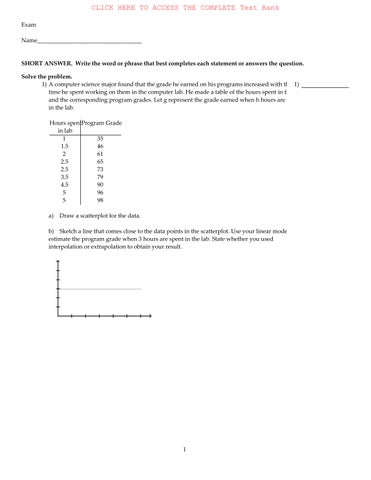
1) A computer science major found that the grade he earned on his programs increased with the time he spent working on them in the computer lab. He made a table of the hours spent in the lab and the corresponding program grades. Let g represent the grade earned when h hours are spent in the lab.
a)Draw a scatterplot for the data.
b) Sketch a line that comes close to the data points in the scatterplot. Use your linear model to estimate the program grade when 3 hours are spent in the lab. State whether you used interpolation or extrapolation to obtain your result.
2) Since the end of the Cold War, jobs in defense manufacturing and aerospace have disappeared as the U.S. government spends less on defense. Employments at Aerospace Tech for various years are listed in the table below.
Year Employment (thousands)
2011 27.8
2013 25
2014 21
2016 16
2017 13.5
Let L represent the employment (in thousands of people) at Aerospace Tech t years since 1922.
i) Use your graphing calculator to create a scatterplot of the Aerospace Tech data. Then use your calculator to sketch the graph of the equation L = -2.48t + 249.38. Which data point(s) are above the line?
ii) Use the linear model to estimate when there were 35 thousand employees at Aerospace Tech.
iii) Use the linear model to predict the number of employees at Aerospace Tech in 2032. Has model breakdown occurred?
iv)What is the slope of the equation y = -2.48x + 249.38? What does the slope tell you in terms of the employment at Aerospace Tech - be as specific and complete as you can be.
v)Find the t-intercept. What does your result mean in terms of Aerospace Tech?
vi)Find the L-intercept. What does your result mean in terms of Aerospace Tech?
3) Although the number of people arrested for arson has remained fairly constant in recent decades, the percent of arson arrests that have been juveniles has been on the rise. The data is printed in the table below.
Let P represent the percent of arson arrests that are juveniles at t years since 2012. The equation P = 1.83t + 44.76 models the data well.
i)Use the linear model to predict when 75 percent of arson arrests will be juveniles.
ii) Use the linear model to estimate the percent of arson arrests that were juveniles in 2007.
iii)Find the t-intercept. What does it mean in terms of arson arrests?
iv)What is the slope of the equation P = 1.83t + 44.76? What does the slope represent in terms of arson arrests?
v)Find the P-intercept. What does it mean in terms of arson arrests?
vi)Find P when t = 10. What does your result mean in terms of the situation?
vii)Find t when P = 100. What does your result mean in term of the situation?
MULTIPLE CHOICE. Choose the one alternative that best completes the statement or answers the question.
4) The average value of a certain type of automobile was $15,840 in 2014 and depreciated to $8700 in 2017. Let y be the average value of the automobile in the year x, where x = 0 represents 2014. Write a linear equation that models the value of the automobile in terms of the year x.
A) y = -2380x + 15,840 B) y = -2380x + 1560
C) y = -2380x + 8700 D) y =1 2380 x - 8700
5) An investment is worth $2864 in 2013. By 2018 it has grown to $4254. Let y be the value of the investment in the year x, where x = 0 represents 2013. Write a linear equation that models the value of the investment in the year x.
A) y = 1 278 x + 2864
y = -278x + 5644
y = -278x + 2864
y = 278x + 2864
6) A faucet is used to add water to a large bottle that already contained some water. After it has been filling for 5 seconds, the gauge on the bottle indicates that it contains 17 ounces of water. After it has been filling for 12 seconds, the gauge indicates the bottle contains 38 ounces of water. Let y be the amount of water in the bottle x seconds after the faucet was turned on. Write a linear equation that models the amount of water in the bottle in terms of x.
A) y = 3x + 2 B)
7) When making a telephone call using a calling card, a call lasting 6 minutes costs $1.95. A call lasting 13 minutes costs $3.70. Let y be the cost of making a call lasting x minutes using a calling card. Write a linear equation that models the cost of making a call lasting x minutes.
8) A vendor has learned that, by pricing hot dogs at $1.25, sales will reach 113 hot dogs per day. Raising the price to $2.00 will cause the sales to fall to 74 hot dogs per day. Let y be the number of hot dogs the vendor sells at x dollars each. Write a linear equation that models the number of hot dogs sold per day when the price is x dollars each.
y = -52x + 178
9) In 2012, the average annual salary for elementary school teachers was $24,269. In 2017, the average annual salary for elementary school teachers was $28,148. Let y be the average annual salary in the year x, where x = 0 represents the year 2012.
a) Write a linear equation that models the average annual salary for elementary school teachers in terms of year x.
b) Use this equation to determine the average annual salary for elementary school teachers in 2014.
A) a) y = 770.8x + 24,269
b) $25,820.60
C) a) y = 775.8x + 24,269
b) $26,596.40
B) a) y = 770.8x + 24,269
b) $25,810.60
D) a) y = 775.8x + 24,269
b) $25,820.60
10) In 2012, the average annual salary for elementary school teachers was $24,269. In 2017, the average annual salary for elementary school teachers was $28,148. Let y be the average annual salary in the year x, where x = 0 represents the year 2012.
a) Write a linear equation that models the average annual salary for elementary school teachers in terms of year x.
b) Use this equation to determine the average annual salary for elementary school teachers in 2027.
A) a) y = 770.8x + 24,269
b) $35,831.00
C) a) y = 775.8x - 24,269
b) $35,906.00
B) a) y = 775.8x + 24,269
b) $35,906.00
D) a) y = 770.8x - 24,269
b) $35,831.00
SHORT ANSWER. Write the word or phrase that best completes each statement or answers the question.
11) Consider the graph of the data and the model y = mx + b. Sketch the graph of a linear model that better describes the data and then explain how you would adjust the slope and the y-intercept of the original model so that it would better describe the data.
12) The number of people who have committed violent crimes (per 100,000 people) in the U.S. during various years are listed in the table below.
of Violent Crime Offenders
Let N represent the number of people who have committed violent crimes (per 100,000 people) in the U.S. in the year that is t years since 1927. Find an equation of a linear model to describe the data.
13) The percents of male teenagers who have had sex is grouped by age in the table below.
Let P represent the percent of male teenagers of age a that have had sex. Find an equation of a linear model to describe the data. 13)
14) Given below are the winning times for the men's 100 meter Olympic freestyle for various years. Year
Let W represent the winning time (in seconds) at t years since 1971. Find an equation of a linear model to describe the data. 14)
15) Three students are to find a linear model for the data in the table below. Student A uses the points (30, 14.2) and (35, 14.1), student B uses the points (40, 12.1) and (50, 9.7), and student C uses the points (60, 6.8) and (65, 7.2). Which student seems to have made the best choice of points? Explain.
MULTIPLE CHOICE. Choose the one alternative that best completes the statement or answers the question.
16) Draw a scatterplot of the given data. Find the equation of the line containing the points (2, 1.3) and (9, 4.2). Graph the line on the scatterplot. x24589
17) Draw a scatterplot of the given data. Find the equation of the line containing the points (2.1, 8.1) and (4.6, 3.0). Graph the line on the scatterplot.
SHORT ANSWER. Write the word or phrase that best completes each statement or answers the question.
18) The following data represents the height (in inches) and weight (in pounds) of 9 randomly selected adults.
Graph the data on a scatterplot treating height as the independent variable. Find an equation of the line containing the points (62, 124) and (70, 180). Graph the line on the scatterplot. Interpret the slope of the line. Use the line to predict the weight of a person who is 67.2 inches tall. Round to the nearest pound.

MULTIPLE CHOICE. Choose the one alternative that best completes the statement or answers the question.
Evaluate the function at the given value of x. 19) f(x) = 8x + 5, f(6)
13
20) f(x) = -3x - 2, f(- 1)
7 3
21) f(x) = 3x + 5, g(a - 1)
22) f(x) = 9 - 3x2, f(-5)
24
23) f(x) = x + 9 14x - 8 , f(7)
8 53
39
43
78
84
-66
f(x) = x + 3 2x - 12, f(-5)
1 11
26) f(x) = x - 5 3x + 7 , f(-3)
For the given function, find the value of x that corresponds to the given value of f(x).
f(x) = -2x - 4, f(x) = 10.4
A graph of the function f is sketched in the figure below. Use the graph to find the indicated values.
28) Find f(-2)
4
29) Find x when f(x) = -3
-12
-2
-6
Find the x-intercept and y-intercept of the function.
30) f(x) = 3x - 6
A) x-intercept: (6, 0) y-intercept: (0, -2)
C) x-intercept: (-6, 0) y-intercept: (0, 2)
31) f(x) = -5x
A) x-intercept: (-5, 0) y-intercept: (0, 0)
C) x-intercept: (0, -5) y-intercept: (-5, 0)
32) f(x) = 3
A) x-intercept: (3, 0) y-intercept: none
C) x-intercept: (0, 3) y-intercept: (3, 0)
1
-4
B) x-intercept: (2, 0) y-intercept: (0, -6)
2
3
D) x-intercept: (-2, 0) y-intercept: (0, 6) 30)
31)
B) x-intercept: (-5, 0) y-intercept: (0, -5)
D) x-intercept: (0, 0) y-intercept: (0, 0)
B) x-intercept: (3, 0) y-intercept: (0, 3)
D) x-intercept: none y-intercept: (0, 3)
32)
SHORT ANSWER. Write the word or phrase that best completes each statement or answers the question.
Solve the problem.
33) Ultraviolet radiation from the sun is thought to be one factor causing skin cancer. The amount of UV radiation a person receives is a function of the thickness of the earth's ozone layer which depends on the latitude of the area where the person lives. The following data represent the latitudes and melanoma rates for nine randomly selected areas in the United States. The melanoma rates refer to a three-year period.
Graph the data on a scatterplot treating latitude as the independent variable. Find an equation of the line containing the points (32.4, 7.3) and (43.2, 3.3). Express the relationship using the function name f. Graph the line on the scatterplot. Interpret the slope of the line. Use the line to predict the melanoma rate of an area with a latitude of 39.1 degrees north.
MULTIPLE CHOICE. Choose the one alternative that best completes the statement or answers the question.
34) The percentage of Americans owning a car with a cassette tape player during particular years is given in the following table:
Year Percent
1992 35
1997 31
2002 26
2007 22
2012 18
2017 15
Let t be the number of years since 1992. Find a linear function, P(t), for the line containing the points and (15, 22).
35) The percentage of Americans owning a car with a cassette tape player during particular years is given in the following table:
Year Percent
1992 50
1997 46
2002 41
2007 37 2012 33
2017 30
Let t be the number of years since 1992. Find a linear function, f(t), for the line containing the points and (15, 37). Find P(9). What does this situation mean?
A) f(9) = 44.2. In 2001, 44.2% of the population owned a car with a cassette player.
B) f(9) = 44.2. In 2001, 44.2% of the population owned a car without a cassette player.
C) f(9) = 42.4. In 2001, 57.6% of the population owned a car with a cassette player.
D) f(9) = 42.4. In 2001, 42.4% of the population owned a car with a cassette player. 35)
36) The percentage of Americans owning a car with a cassette tape player during particular years is given in the following table:
Year Percent
1992 39
1997 35
2002 30
2007 25
2012 22
2017 19
Let t be the number of years since 1992. Find a linear function, f(t), for the line containing the points and (15, 25). Find the t-intercept. What does it mean in this situation?
A) (44, 0) It means that in the year 1997, there will be no cars with cassette players.
B) (40, 0) It means that in the year 2032, there will be no cars with cassette players.
C) (39, 0) It means that in the year 2031, there will be no cars with cassette players.
D) (40, 0) It means that in the year 2032, there will be 1000 cars with cassette players. 36)
37) The cost of renting a certain type of car is $40 per day plus $0.11 per mile. Find a linear function f(x) that expresses the cost of renting a car for one day as a function of the number of miles driven x.
A) f(x) = (x + 0.11) + 40
C) f(x) = 40x + 0.11
B) f(x) = 0.11x + 40x
D) f(x) = 0.11x + 40 37)
38) The cost of renting a certain type of car is $35 per day plus $0.10 per mile. Find the linear function f(x) that expresses the cost of renting a car for one day as a function of the number of miles driven, x. Graph the linear function. Use a domain of 0 ≤ x ≤ 500.
39) David recently switched to a long distance phone company which charges a monthly fee of $5.45 plus $0.04 per minute. Find a linear function f(m) that expresses the monthly bill as a function of minutes used m.
A) f(m) = 0.04m + 5.45m
B) f(m) = 5.45m + 0.04 C) f(m) = 5.49m D) f(m) = 0.04m + 5.45
40) David recently switched to a long distance phone company which charges a monthly fee of $5.95 plus $0.05 per minute. Find the linear function f(m) that expresses the monthly bill as a function of minutes used, m. Graph the linear function. Use a domain of 0 ≤ m ≤ 300.
41) A company has just purchased a new computer for $7000. The company chooses to depreciate the computer using the straight-line method over 5 years. A linear function that expresses the book value of the computer as a function of its age x is f(x) = -1400x + 7000. What is the book value of the computer after 2 years?
SHORT ANSWER. Write the word or phrase that best completes each statement or answers the question.
42) Sprint charges a flat monthly fee of $16.89 to use their services. You also must pay $0.10 per minute of talking on the telephone. Let f(t) represent the monthly phone bill (in dollars) from talking on the phone for t minutes.
i)Find an equation for f.
ii)What is the slope of f? What does it mean in terms of the situation?
43) A basement is flooded with 230 cubic feet of water. Water can be pumped out of the basement at a rate of 47 cubic feet of water per hour. Let f(t) represent the number of cubic feet of water that remains in the basement after t hours of pumping out water.
i)Find an equation for f.
ii)Find t when f(t) = 0. What does your result mean in terms of the situation?
iii)What is the domain and range of the model? Explain.
44) In 2015, the enrollment at a college is 20,700 students. Each year the enrollment decreases by 300 students. Let f(t) represent the enrollment at t years since 2015.
i)Find an equation for f.
ii)Use f to predict when the enrollment will be 18,000 students.
iii)What is the slope of f? What does it mean in terms of enrollment?
45) The gas mileage, m, of a compact car is a linear function of the speed, s, at which the car is driven, for 40 ≤ s ≤ 90. For example, from the graph we see that the gas mileage for the compact car is 45 miles per gallon if the car is driven at a speed of 40 mph.

Find the average rate of change in gas mileage between speeds of 40 mph and 60 mph. Find the average rate of change in gas mileage between speeds of 50 mph and 70 mph. Find the average rate of change in gas mileage between speeds of 70 mph and 90 mph. Based on your results, do you think that gas mileage is linearly related to speed? Explain. 45)
MULTIPLE CHOICE. Choose the one alternative that best completes the statement or answers the question.
46) The gas mileage, m, of a compact car is a linear function of the speed, s, at which the car is driven, for 40 ≤ s ≤ 90. For example, from the graph we see that the gas mileage for the compact car is 45 miles per gallon if the car is driven at a speed of 40 mph.
Find and interpret the average rate of change in gas mileage between speeds of 40 mph and 90 mph.
A) -0.5 miles per gallon/mph;
Between speeds of 40 and 90 mph, speed decreases at a rate of 0.5 miles per hour for each 1 mpg increase in gas mileage.
B) 0.5 miles per gallon/mph;
Between speeds of 40 and 90 mph, gas mileage increases at a rate of 0.5 miles per gallon for each 1 mph increase in speed.
C) -0.5 miles per gallon/mph;
Between speeds of 40 mph and 90 mph, gas mileage decreases at a rate of 0.5 miles per gallon for each 1 mph increase in speed.
D) -0.75 miles per gallon/mph;
Between speeds of 40 mph and 90 mph, gas mileage decreases at a rate of 0.75 miles per gallon for each 1 mph increase in speed.
47) When a tow truck is called, the cost of the service is given by the linear function y = 3x + 65, where y is in dollars and x is the number of miles the car is towed. Find and interpret the slope of the linear equation.
A) m = 65; The number of miles the car is towed increases at a rate of 65 miles per dollar spent on the service.
B) m = 3; The cost of the service increases at a rate of $3 per mile the car is towed.
C) m = 3; The number of miles the car is towed increases at a rate of 3 miles per dollar spent on the service.
D) m = 65; The cost of the service increases at a rate of $65 per mile the car is towed.
Find the slope then describe what it means in the given situation.
48) The linear function f(x) = 3.5x + 25 represents the percentage of people, f(x), who graduated from college x years after 2017.
A) m = 3.5; the percentage of people graduating from college has increased at a rate of 3.5% per year after 2017.
B) m = 25; the percentage of people graduating from college has increased at a rate of 25% per year after 2017.
C) m = 3.5; the percentage of people graduating from college has decreased at a rate of 3.5% per year after 2017.
D) m = -3.5; the percentage of people graduating from college has decreased at a rate of 3.5% per year after 2017.
49) The linear function f(x) = -5.9x + 22 models the percentage of people, f(x), who eat at fast food restaurants x years after 2017.
A) m = -5.9; the percentage of people eating at fast food restaurants has decreased at a rate of -5.9% per year after 2017.
B) m = 5.9; the percentage of people eating at fast food restaurants has increased at a rate of 5.9% per year after 2017.
C) m = -5.9; the percentage of people eating at fast food restaurants has decreased at a rate of 5.9% since 2017.
D) m = 22; the percentage of people eating at fast food restaurants has increased at a rate of 22% per year after 2017.
SHORT ANSWER. Write the word or phrase that best completes each statement or answers the question.
Solve the problem.
50) The following data represents the Olympic winning time in Women's 100 m Freestyle. year winning time
58.59
55.65
54.79
55.92
54.93
2013 54.65
2017 54.50
a) Let f(t) represent the winning time in the Women's 100 m Freestyle at t years since 1993. Perform the first three steps of the four-step modeling process to find an equation for f. b)Find the slope of f. What does it represent in this situation? 50)
MULTIPLE CHOICE. Choose the one alternative that best completes the statement or answers the question.
51) From April through December 2015, the stock price of QRS Company had a roller coaster ride. The chart below indicates the price of the stock at the beginning of each month during that period. Find the monthly average rate of change in price between April, month 1, and December, month 9.
Month Price
April (x = 1)116
May 107
June 87
July 100
August 94
September112
October 93
November 84
December 66
A) $5.56 per month
C) -$5.56 per month
B) -$6.25 per month
D) $6.25 per month
52) From April through December 2015, the stock price of QRS Company had a roller coaster ride. The chart below indicates the price of the stock at the beginning of each month during that period. Find the monthly average rate of change in price between June and September.
Month Price
April (x = 1)114
May 108
June 88
July 101
August 95
September111
October 91
November 86
December 65
A) -$7.67 per month
C) $7.67 per month
B) -$11.50 per month
D) $11.50 per month 52)
53)
53) The total individual income tax collected by the tax collecting body of a country is a function of the number of people working, their income, and the tax rates. It has increased each year since 1992. The table below shows the individual income tax collected (in billions) for the time period between 1992 and 2017. Find the average annual rate of change between 2002 and 2012.
YearTax Collected (billions)
1992 $99
1997 $163
2002 $286
2007 $393
2012 $546
2017 $685
A) $38.3 billion per year
C) $39.9 billion per year
B) $34.8 billion per year
D) $26 billion per year
54) Along with incomes, people's charitable contributions have steadily increased over the past few years. The table below shows the average deduction for charitable contributions reported on individual income tax returns for the period 2012 to 2017. Find the slope of the model between 2014 and 2016.
YearCharitable Contributions
2012 $1720
2013 $2450
2014 $2470
2015 $2780
2016 $3000
2017 $3160
55) The price of a certain commodity is a function of supply and demand. The table below shows the price of the commodity per barrel between 2012 and 2017. Find the average annual rate of change between 2013 and 2015.
YearPrice/barrel
2012 $21
2013 $25
2014 $18
2015 $11
2016 $26
2017 $35
A) -$14.00 per year
B) $2.50 per year
C) -$7.00 per year D) $7.00 per year
56) The price of a certain commodity is a function of supply and demand. The table below shows the price of the commodity per barrel between 2012 and 2017. Find the average annual rate of change between 2015 and 2017.
YearPrice/barrel
2012 $20
2013 $24
2014 $17
2015 $12
2016 $26
2017 $36
A) $3.00 per year
C) $12.00 per year
B) $24.00 per year
D) -$12.00 per year
57) From April through December 2015, the stock price of QRS Company had a roller coaster ride. The chart below indicates the price of the stock at the beginning of each month during that period. The slope of the model between April and December is -$6.50 per month. Interpret this average rate of change.
Month Price
April (x = 1)116
May 108
June 89
July 101
August 96
September112
October 92
November 84
December 64
A) In each month between April and December, the price of the stock decreased by $6.50.
B) Between April and December, the price of the stock decreased by $6.50 per month.
C) In each month between April and December, the price of the stock increased by $6.50.
D) Between April and December, the price of the stock increased by $6.50 per month.
58) The total individual income tax collected by the tax collecting body of a country is a function of the number of people working, their income, and the tax rates. It has increased each year since 1992. The table below shows the individual income tax collected (in billions) for the time period between 1992 and 2017. Between 2002 and 2012, the average rate of change in the amount of tax collected is $24.9 billion per year. Interpret this average rate of change.
YearTax Collected (billions)
1992
1997
2002
2007
2012
2017
$101
$164
$292
$403
$541
$675
A) Between 2002 and 2012, the amount of tax collected increased by $24.9 billion.
B) In each year between 2002 and 2012, the amount of tax collected increased by $24.9 billion.
C) Between 2002 and 2012, the amount of tax collected increased at a rate of $24.9 billion per year.
D) Between 2002 and 2012, the amount of tax collected decreased at a rate of $24.9 billion per year.
59) The total individual income tax collected by the tax collecting body of a country is a function of the number of people working, their income, and the tax rates. It has increased each year since 1992. The table below shows the individual income tax collected (in billions) for the time period between 1992 and 2017. Do you think that the amount of income tax collected is linearly related to the year? Explain your thinking.
[Hint: determine the average rate of change in tax collected for different time periods.]
YearTax Collected (billions)
1992 $101
1997 $160
2002 $294
2007 $396
2012 $540
2017 $679
A) Yes, the amount of tax collected is linearly related to the year. The average rate of change (slope) is constant.
B) No, the amount of tax collected is not linearly related to the year. The average rate of change (slope) is not constant.
C) No, the amount of tax collected is not linearly related to the year. The average rate of change (slope) is increasing throughout the period 1992 to 2017.
D) Yes, the amount of tax collected is linearly related to the year. There is a constant difference of 5 between each of the years listed.
1) a) b)


The Program grade should be about 71. Answers may vary slightly. Interpolation was used to obtain the result.
2) i) (91, 25)
ii)2008
iii) -23,420 employees; Model breakdown has occurred.
iv) -2.48; Employment decreases by 2480 people each year.
v)(100.56, 0); No one will be employed in 2023.
vi)(0, 249.38); Employment was 249,380 people in 1922.
3) i) 2029
ii)36%
iii)(-24.46, 0); No juveniles were arrested for arson in 1987.
iv)1.83; The percent of arson arrests that were juveniles increases by 1.83 each year.
v)(0, 44.76); The percent of arson arrests that were juveniles in 2012 was 44.76%.
vi)63.06; 63% of arson arrests were juveniles in 2022.
vii)30.19; All arson arrests will be juveniles in 2042.
4) A
5) D
6) A
7) C
8) A
9) D
10) B
11) Decrease the slope and raise the y-intercept. The improved model is sketched in the figure below.
12) N = 18.89t - 973.39; Answers may vary.
13) P = 11.60a - 145.47; Answers may vary.
14) W = -0.17t + 55.55; Answers may vary.
15) Student B
16) C
17) C
18)
If height is increased by one inch, then weight will increase by 7 pounds
19) B
20) C
21) A
22) D
23) D
24) A
25) D
26) B
27) D
28) B
29) C
30) B
31) D
32) D
33) x 303234363840424446
y = -0.37x + 40.1
f(x) = -0.37x + 40.1
If latitude is increased by one degree north, then melanoma rate will decrease by 0.37 per 100,000 25.63 per 100,000
34) A
35) D
36) B
37) D
38) C
39) D
40) A
41) C
42) i) f(t) = 0.10t + 16.89
ii)0.10; The charge per minute is $0.10.
43) i) f(t) = -47t + 230
ii)4.89; It takes 4.89 hours to pump out all the water.
iii)domain 0 ≤ x ≤ 4.89; range 0 ≤ x ≤ 230
44) i) f(t) = -300t + 20,700
ii)2024
iii) -300; The enrollment decreases by 300 students each year.
45) -0.5 miles per gallon/mph; -0.5 miles per gallon/mph; -0.5 miles per gallon/mph; Yes, the average rate of change (slope) is constant.
46) C
47) B
48) A
49) A
50) a) f(t) = -0.13x + 57.09 Answers may vary.
b)The slope is about -0.13 which means that the winning time is decreasing by 0.13 of a second each year.
51) B
52) C
53) D
Answer Key Testname: UNTITLED81
54) C
55) C
56) C
57) B
58) C
59) B