2 THE ECONOMIC PROBLEM
Answers to the Review Quizzes
Page 36
1. How does the production possibilities frontier illustrate scarcity?
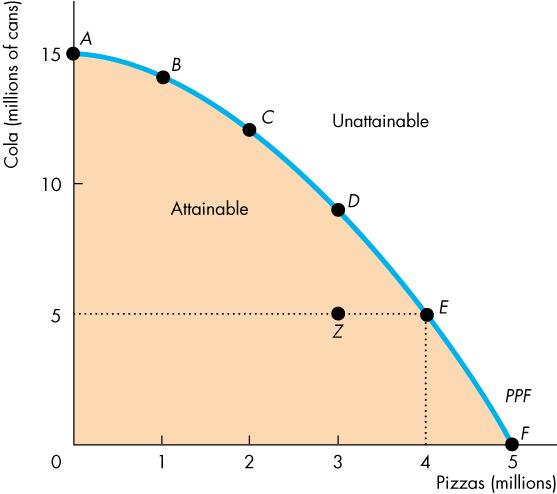
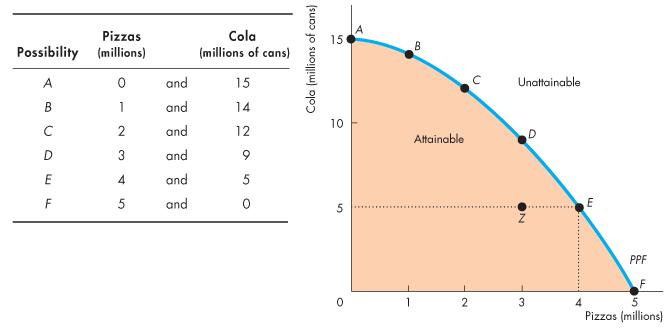
The unattainable combinations of production that lie beyond the PPF illustrate the concept of scarcity There simply are not enough resources to produce any of these combinations of outputs. Additionally, while moving along the PPF to increase the production of one good requires that the production of another good be reduced, which also illustrates scarcity.
2. How does the production possibilities frontier illustrate production efficiency?
The combinations of outputs that lie on the PPF illustrate the concept of production efficiency. These points are the maximum production points possible and are attained only by producing the goods and services at the lowest possible cost. Any point inside the frontier reflects production where one or both outputs may be increased without decreasing the other output level. Clearly, such points cannot be production efficient.
3. How does the production possibilities frontier show that every choice involves a tradeoff?
Movements along the PPF frontier illustrate that producing more of one good requires producing less of other good. This observation reflects the result that a tradeoff must be made when producing output efficiently.
4. How does the production possibilities frontier illustrate opportunity cost?
The negative slope of the production possibility curve illustrates the concept of opportunity cost. Moving along the production possibility frontier, producing additional units of a good requires that the output of another good must fall. This sacrifice is the opportunity cost of producing more of the first good.
5. Why is opportunity cost a ratio?
The slope of the PPF is a ratio that expresses the quantity of lost production of the good on the y-axis to the increase in the production of the good on the x-axis moving downward along the PPF. The steeper the slope, the greater ratio, and the greater is the opportunity cost of increasing the output of the good measured on the horizontal axis.
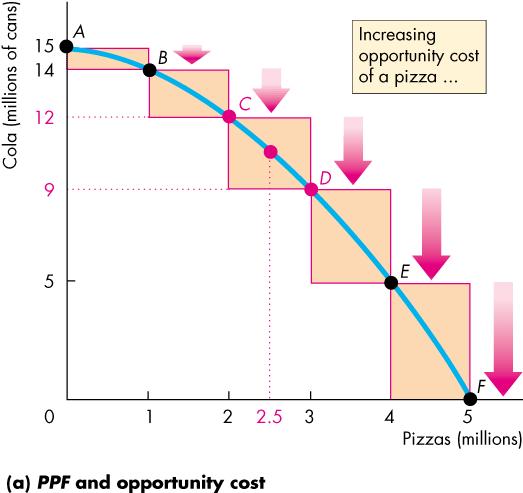
6. Why does the PPF bow outward and what does that imply about the relationship between opportunity cost and the quantity produced?
Some resources are better suited to produce one type of good or service, like pizza. Other resources are better suited to produce other goods or services, like DVDs. If society allocates resources wisely, it will use each resource to produce the kind of output for which it is best suited. Consider a PPF with pizza measured on the x-axis and DVDs measured on the y-axis. A small increase in pizza output when pizza production is relatively low requires only a small increase in the use of those resources still good at making pizza and not good at making DVDs. This yields a small decrease in DVD production for a large increase in pizza production, creating a relatively low opportunity cost reflected in the gentle slope of the PPF over this range of output. However, the same small increase in pizza output when pizza production is relatively large will require society to devote to pizza production those resources that are less suited to making pizza and more suited to making DVDs. This reallocation of resources yields a relatively small increase in pizza
output for a large decrease in DVD output, creating a relatively high opportunity cost reflected in the steep slope of the PPF over this range of output. The opportunity cost of pizza production increases with the quantity of pizza produced as the slope of the PPF becomes ever steeper. This effect creates the bowed out effect (the concavity of the PPF function) and means that as more of a good is produced, the opportunity cost of producing additional units increases.
Page 39
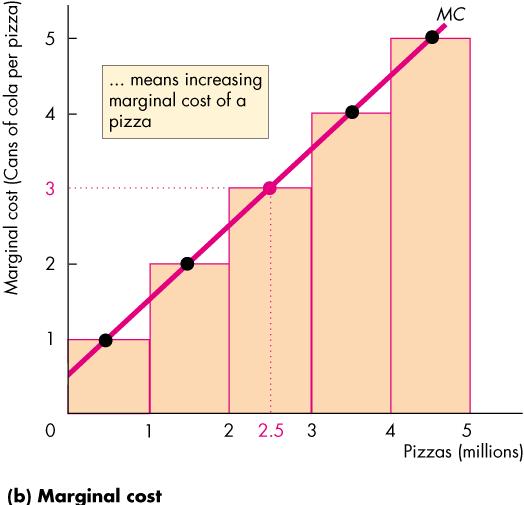
1. What is marginal cost? How is it measured?
Marginal cost is the opportunity cost of producing one more unit of a good or service. Along a PPF marginal cost is reflected in the absolute value of the slope of the PPF. In particular, the magnitude of the slope of the PPF is the marginal cost of a unit of the good measured along the x-axis. As the magnitude of the slope changes moving along the PPF, the marginal cost changes.
2. What is marginal benefit? How is it measured?
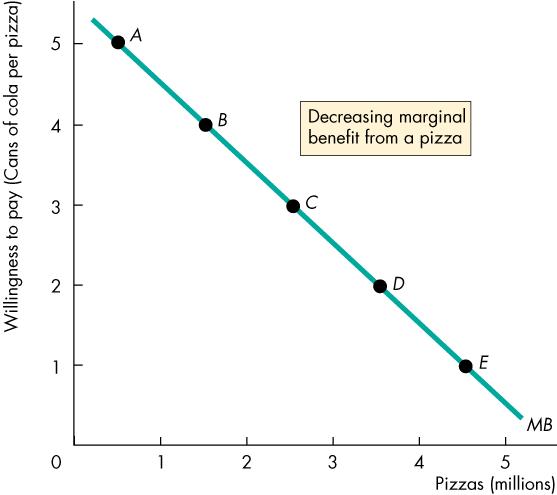
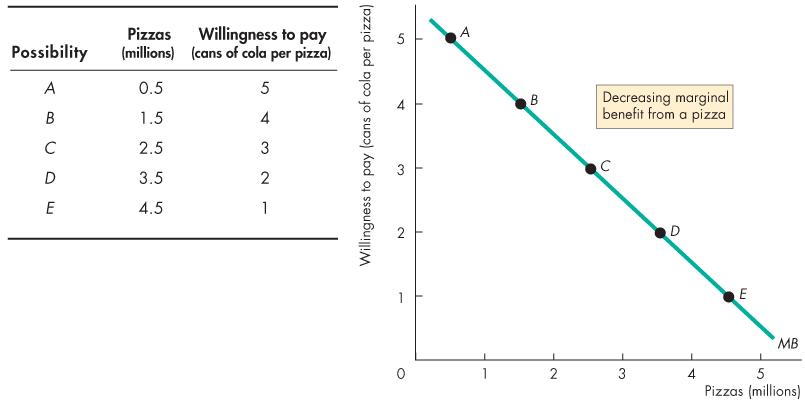
The marginal benefit from a good or service is the benefit received from consuming one more unit of it. It is measured by what an individual is willing to give up (or pay) for an additional that last unit.
3. How does the marginal benefit from a good change as the quantity produced of that good increases?
As the more of a good is consumed, the marginal benefit received from each unit is smaller than the marginal benefit received from the unit consumed immediately before it, and is larger than the marginal benefit from the unit consumed immediately after it. This set of results is known as the principle of decreasing marginal benefit and is often assumed by economists to be a common characteristic of an individual’s preferences over most goods and services in the economy.
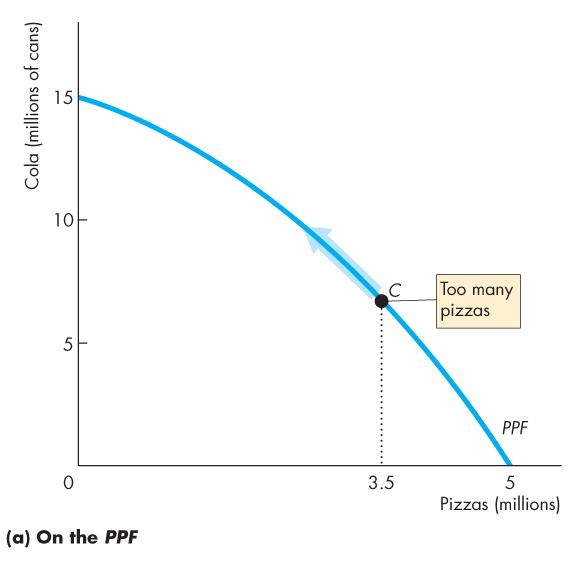
4. What is allocative efficiency and how does it relate to the production possibilities frontier?
Production efficiency occurs when production takes place at a point on the PPF. This indicates that all available resources are being used for production and society cannot produce additional units of one good or service without reducing the output of another good or service. Allocative efficiency, however, requires that the goods and services produced are those that provide the greatest possible benefit. This definition means that the allocative efficient level of output is the point on the PPF (and hence is a production efficient point) for which the marginal benefit equals the marginal cost.
5. What conditions must be satisfied if resources are used efficiently?
Resources are used efficiently when more of one good or service cannot be produced without producing less of some of another good or service that is valued more highly. This is known as allocative efficiency and it occurs when: 1) production efficiency is achieved, and 2) the marginal benefit received from the last unit produced is equal to the marginal cost of producing the last unit.
Page 44
1. What gives a person a comparative advantage?
A person has a comparative advantage in an activity if that person can perform the activity at a lower opportunity cost than anyone else, If the person gives up the least amount of other goods and services to produce a particular good or service, the person has the lowest opportunity cost of producing that good or service.
2. Distinguish between comparative advantage and absolute advantage.
A person has a comparative advantage in producing a good when he or she has the lowest opportunity cost of producing it. Comparative advantage is based on the output forgone. A person has an absolute advantage in production when he or she uses the least amount of time or resources to produce one unit of that particular good or service. Absolute advantage is a measure of productivity in using inputs
3. Why do people specialize and trade?
People can compare consumption possibilities from producing all goods and services through selfsufficiency against specializing in producing only those goods and services that reflect their comparative advantage and trading their output with others who do the same. People can then see that the consumption possibilities from specialization and trade are greater than under self-sufficiency. Therefore it is in people’s own self-interest to specialize. It was Adam Smith who first pointed out in the Wealth of Nations how individuals voluntarily engage in this socially beneficial and cooperative activity through the pursuit of their own self-interest, rather than for society’s best interests.
4. What are the gains from specialization and trade?
From society’s standpoint, the total output of goods and services available for consumption is greater with specialization and trade. From an individual’s perspective, each person who specializes enjoys being able to consume a larger bundle of goods and services after trading with others who have also specialized, than would otherwise be possible under self-sufficiency. These increases are the gains from specialization and trade for society and for individuals.
5. What is the source of the gains from trade?
As long as people have different opportunity costs of producing goods or services, total output is higher with specialization and trade than if each individual produced goods and services under self-sufficiency. This increase in output is the gains from trade.
6. Why does specialization and the gains from trade make the economy’s PPF outward bowed?
Specialization and the gains from trade make the economy’s PPF bow outward because the resources that have the comparative advantage in producing a good or service are the first to be utilized to produce that good or service. Consequently when the good or service is first produced, its opportunity cost—the amount of the other good or service forgone—is small and so the PPF is relatively flat. Ultimately, when so much of the good or service is produced such that resources without a comparative advantage in it must be utilized, the opportunity cost becomes larger so that the PPF becomes steeper. When the PPF starts out flatter and becomes steeper, it bows outward.
7. Why is not specializing and reaping the gains from trade inefficient?
By not specializing and trading, some suppliers are not producing the good in which they have a comparative advantage. Consequently production occurs inside the PPF at a production inefficient point. All of the economy’s resources might be employed but they are misallocated.
Page 47
1. What generates economic growth?
The two key factors that generate economic growth are technological change and capital accumulation. Technological change allows an economy to produce more with the same amount of limited resources, Capital accumulation, the growth of capital resources including human capital, means that an economy has increased its available resources for production.
2. How does economic growth influence the production possibilities frontier?
Economic growth shifts the PPF outward. Persistent outward shifts in the production possibility frontier—economic growth—are caused by the accumulation of resources, such as more capital equipment or by the development of new technology.
3. What is the opportunity cost of economic growth?
When a society devotes more of its scarce resources to research and development of new technologies, or devotes additional resources to produce more capital equipment, both decisions lead to increased consumption opportunities in future periods at the cost of less consumption today. The loss of consumption today is the opportunity cost borne by society for creating economic growth.
© 2018 Pearson Education, Inc.
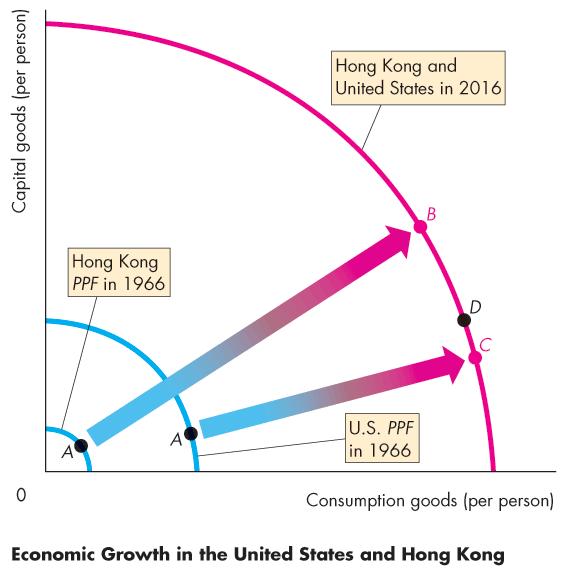
4. Explain why Hong Kong has experienced faster economic growth than the United States. Hong Kong chose to devote a greater proportion of its available resources to the production of capital than the United States. This allowed Hong Kong to grow at a faster rate than the United States. By foregoing consumption and producing a greater proportion of capital goods over the last few decades, Hong Kong was able to achieve output per person equal to 94 percent of that in the United States.
5. Does economic growth overcome scarcity?
Scarcity reflects the inability to satisfy all our wants. Regardless of the amount of economic growth, scarcity will remain present because it will never be possible to satisfy all our wants. For instance it will never be possible to satisfy all the wants of the several thousand people who all would like to ski the best slopes on Vail with only their family and a few best friends present. So economic growth allows more wants to be satisfied but it does not eliminate scarcity.
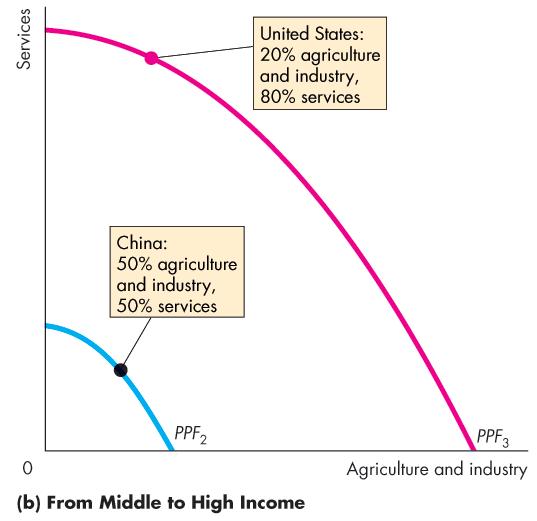
6. How does economic growth change the patterns of production?
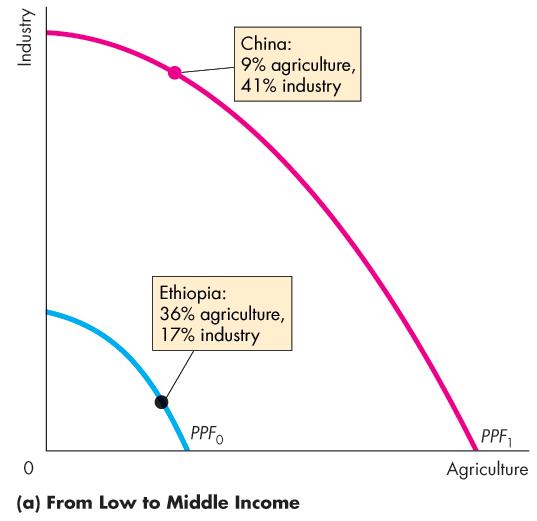
In low-income nations a large fraction of production is agriculture with distinctly less devoted to industry. For example, in Ethiopia agriculture accounts for 36 percent of production and industry for 17 percent. As the nation grows to middle income, investment in capital and new technology leads to an increase in the fraction of production that is industrial and a decrease in the fraction that is agricultural. For example, in China 9 percent of production is agriculture and 41 percent is industry. Finally, in high-income nations, services becomes an increasingly large proportion of production. In the United States, for example, services account for 80 percent of production while industry and agriculture together account for 20 percent of production.
7. Why does economic growth destroy and create jobs?
Economic growth leads to changes in the pattern of production—some sectors and products increase while others decrease. In the areas that increase in size, new jobs are created while in those that decrease, jobs are destroyed. Often workers who lose their jobs in the declining sectors need to acquire new skills for the new jobs and/or uproot their life to move to a new location. Some unemployed workers are unwilling to incur these costs and, as a result, remain unemployed, leading the economy to produce at a point inside its PPF
Page 49
1. Why are social institutions such as firms, markets, property rights, and money necessary?
These social institutions factors necessary for a decentralized economy to coordinate production. Firms are necessary to allow people to specialize. Without firms, specialization would be limited because a person would need to specialize in the entire production of a good or service. With firms people are able to specialize in producing particular bits of a good or service. For a society to enjoy the fruits of specialization and trade, the individuals who comprise that society must voluntarily desire to specialize in the first place. Discovering trade opportunities after a person has specialized in his or her comparative advantage in production is what allows that person to gain from his or her own specialization efforts. Trading opportunities can only take place if a market exists where people observe prices to discover available trade opportunities. Money is necessary to allow low-cost trading in markets. Without money, goods would need to be directly exchanged for other goods, a difficult and unwieldy situation. Finally people must enjoy social recognition of and government protection of property rights to have confidence that their commitments to trade arrangements will be respected by everyone in the market.
2. What are the main functions of markets?
The main function of a market is to enable buyers and sellers to get information and to do business with each other. Markets have evolved because they facilitate trade, that is, they facilitate the ability of buyers and sellers to trade with each other.
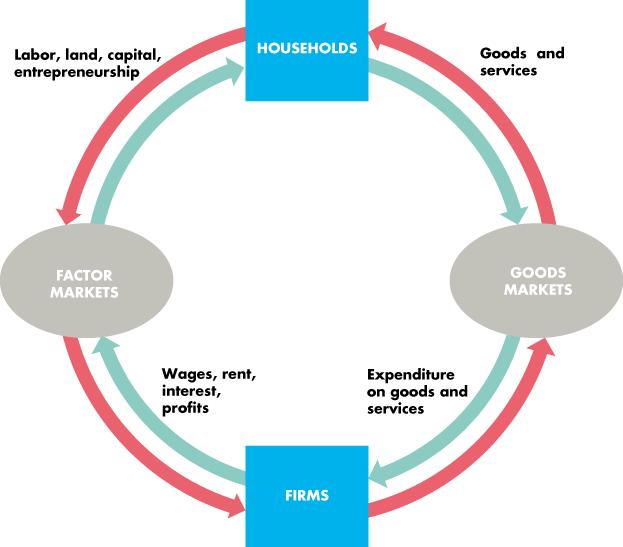
3. What are the flows in the market economy that go from firms to households and the flows from households to firms?
On the real side of the economy, goods and services flow from firms to households. On the monetary side of the economy, payments for factors of production, wages, rent, interest, and profits, flow from firms to households. Flowing from households to firms on the monetary side of the economy are the expenditures on goods and services and on the real side are the factors of production, labor, land, capital, and entrepreneurship.
Answers to the Study Plan Problems and Applications
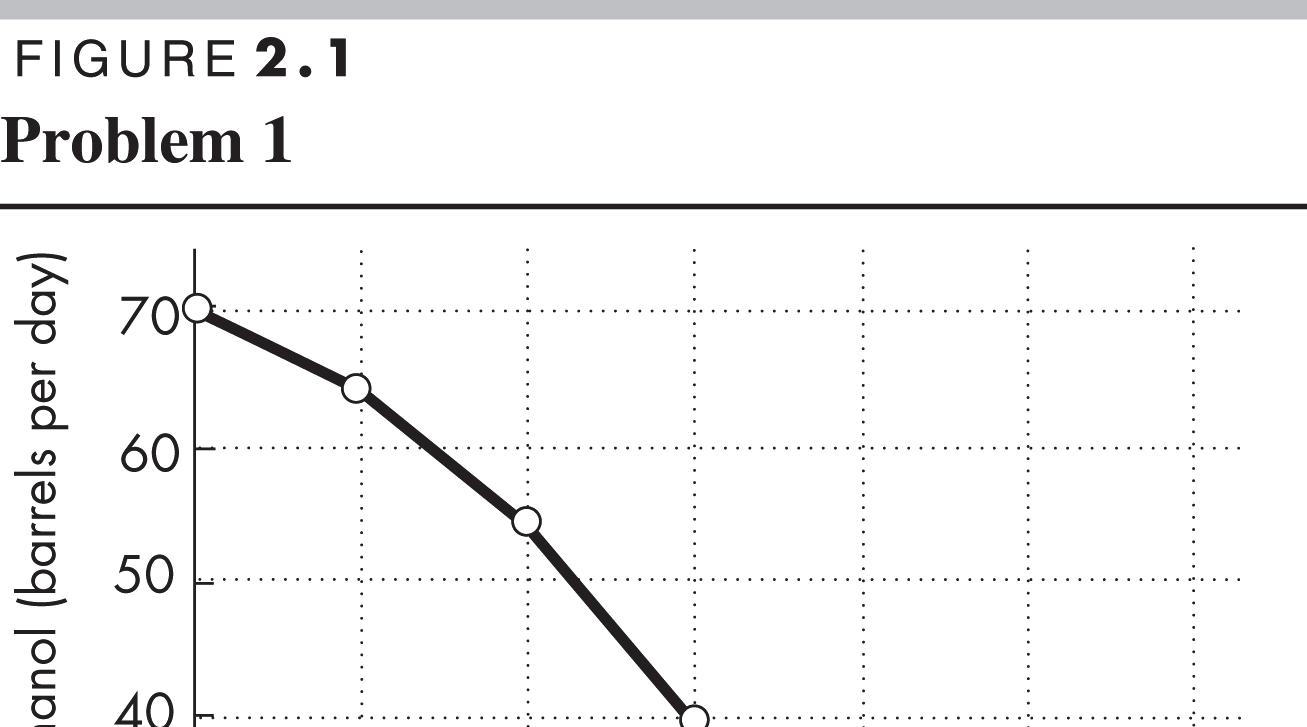
Use the following data to work Problems 1 to 3. Brazil produces ethanol from sugar, and the land used to grow sugar can be used to grow food crops. The table to the right sets out Brazil’s production possibilities for ethanol and food crops.
1. a. Draw a graph of Brazil’s PPF and explain how your graph illustrates scarcity.
Figure 2.1 shows Brazil’s PPF. The production possibilities frontier indicates scarcity because it shows the limits to what can be produced. In particular, production combinations of ethanol and food crops that lie outside the production possibilities frontier are not attainable.
b. If Brazil produces 40 barrels of ethanol a day, how much food must it produce to achieve production efficiency?
If Brazil produces 40 barrels of ethanol per day, it achieves production efficiency if it also produces 3 tons of food per day.
c. Why does Brazil face a tradeoff on its PPF ?
Brazil faces a tradeoff on its PPF because Brazil’s resources and technology are limited. For Brazil to produce more of one good, it must shift factors of production away from the other good. Therefore to increase production of one good requires decreasing production of the other, which reflects a tradeoff.
Ethanol (barrels per day)
Food crops (tons per day)
70 and 0
64 and 1
54 and 2
40 and 3
22 and 4
0 and 5
2. a. If Brazil increases ethanol production from 40 barrels per day to 54 barrels per day, what is the opportunity cost of the additional ethanol?
When Brazil is production efficient and increases its production of ethanol from 40 barrels per day to 54 barrels per day, it must decrease its production of food crops from 3 tons per day to 2 tons per day. The opportunity cost of the additional ethanol is 1 ton of food per day for the entire 14 barrels of ethanol or 1/14 of a ton of food per barrel of ethanol.
b. If Brazil increases food production from 2 tons per day to 3 tons per day, what is the opportunity cost of the additional food?
When Brazil is production efficient and increases its production of food crops from 2 tons per day to 3 tons per day, it must decrease its production of ethanol from 54 barrels per day to 40 barrels per day. The opportunity cost of the additional 1 ton of food crops is 14 barrels of ethanol.
c. What is the relationship between your answers to parts (a) and (b)?
The opportunity costs of an additional barrel of ethanol and the opportunity cost of an additional ton of food crop are reciprocals of each other. That is, the opportunity cost of 1 ton of food crops is 14 barrels of ethanol and the opportunity cost of 1 barrel of ethanol is 1/14 of a ton of food crops.
3. Does Brazil face an increasing opportunity cost of ethanol? What feature of Brazil’s PPF illustrates increasing opportunity cost?
Brazil faces an increasing opportunity cost of ethanol production. For instance, when increasing ethanol production from 0 barrels per day to 22 barrels the opportunity cost of a barrel of ethanol is 1/22 of a ton
of food while increasing ethanol production another 18 barrels per day (to a total of 40 barrels per day) has an opportunity cost of 1/18 of a ton of food per barrel of ethanol. The PPF’s bowed outward shape reflects the increasing opportunity cost.
Use the above table (for Problems 1 to 3) to work Problems 4 and 5.
4. Define marginal cost and calculate Brazil’s marginal cost of producing a ton of food when the quantity produced is 2.5 tons per day.
The marginal cost of a good is the opportunity cost of producing one more unit of the good. When the quantity of food produced is 2.5 tons, the marginal cost of a ton of food is the opportunity cost of increasing the production of food from 2 tons per day to 3 tons per day. The production of ethanol falls from 54 barrels per day to 40 barrels per day, a decrease of 14 barrels per day. The opportunity cost of increasing food production is the decrease in ethanol product, so the opportunity cost of producing a ton of food when 2.5 tons of food per day are produced is 14 barrels of ethanol per day.
5. Define marginal benefit. Explain how it is measured and why the data in the table does not enable you to calculate Brazil’s marginal benefit from food.
The marginal benefit of a good is the benefit received from consuming one more unit of the good. The marginal benefit of a good or service is measured by the most people are willing to pay for one more unit of it. The data in the table do not provide information on how much people are willing to pay for an additional unit of food. The table has no information on the marginal benefit of food.
6. Distinguish between production efficiency and allocative efficiency Explain why many production possibilities achieve production efficiency but only one achieves allocative efficiency. Production efficiency occurs when goods and services are produced at the lowest cost. This definition means that production efficiency occurs at any point on the PPF. Therefore all of the production points on the PPF are production efficient. Allocative efficiency occurs when goods and services are produced at the lowest cost and in the quantities that provide the greatest possible benefit. The allocatively efficient production point is the single point on the PPF that has the greatest possible benefit.
7. In an hour, Sue can produce 40 caps or 4 jackets and Tessa can produce 80 caps or 4 jackets.
a. Calculate Sue’s opportunity cost of producing a cap.
Sue forgoes 4 jackets to produce 40 caps, so Sue’s opportunity cost of producing one cap is (4 jackets)/(40 caps) or 0.1 jacket per cap.
b. Calculate Tessa’s opportunity cost of producing a cap.
Tessa forgoes 4 jackets to produce 80 caps, so Tessa’s opportunity cost of producing one cap is (4 jackets)/(80 caps) or 0.05 jacket per cap.
c. Who has a comparative advantage in producing caps?
Tessa’s opportunity cost of a cap is lower than Sue’s opportunity cost, so Tessa has a comparative advantage in producing caps.
d. If Sue and Tessa specialize in producing the good in which they have a comparative advantage, and they trade 1 jacket for 15 caps, who gains from the specialization and trade?
Tessa specializes in caps and Sue specializes in jackets. Both Sue and Tessa gain from trade. Sue gains because she can obtain caps from Tessa at a cost of (1 jacket)/(15 caps), which is 0.067 jacket per cap, a cost that is lower than what it would cost her to produce caps herself. Tessa also gains from trade because she trades caps for jackets for 0.067 jacket per cap, which is higher than her cost of producing a cap.
8. Suppose that Tessa buys a new machine for making jackets that enables her to make 20 jackets an hour. (She can still make only 80 caps per hour.)
a. Who now has a comparative advantage in producing jackets?
Sue forgoes 40 caps to produce 4 jackets, so Sue’s opportunity cost of producing one jacket is (40 caps)/(4 jackets) or 10 caps per jacket. Tessa forgoes 80 caps to produce 20 jackets, so Tessa’s opportunity cost of
© 2018 Pearson Education, Inc.
producing one jacket is (80 caps)/(20 jackets) or 4 caps per jacket. Tessa has the comparative advantage in producing jackets because her opportunity cost of a jacket is lower than Sue’s opportunity cost.
b. Can Sue and Tessa still gain from trade?
Tessa and Sue can still gain from trade because Tessa (now) has a comparative advantage in producing jackets and Sue (now) has a comparative advantage in producing caps. Tessa will produce jackets and Sue will produce caps.
c. Would Sue and Tessa still be willing to trade 1 jacket for 15 caps? Explain your answer.
Sue and Tessa will not be willing to trade 1 jacket for 15 caps. In particular, Sue, whose comparative advantage lies in producing caps, can produce 1 jacket at an opportunity cost of only 10 caps. So Sue will be unwilling to pay any more than 10 caps per jacket.
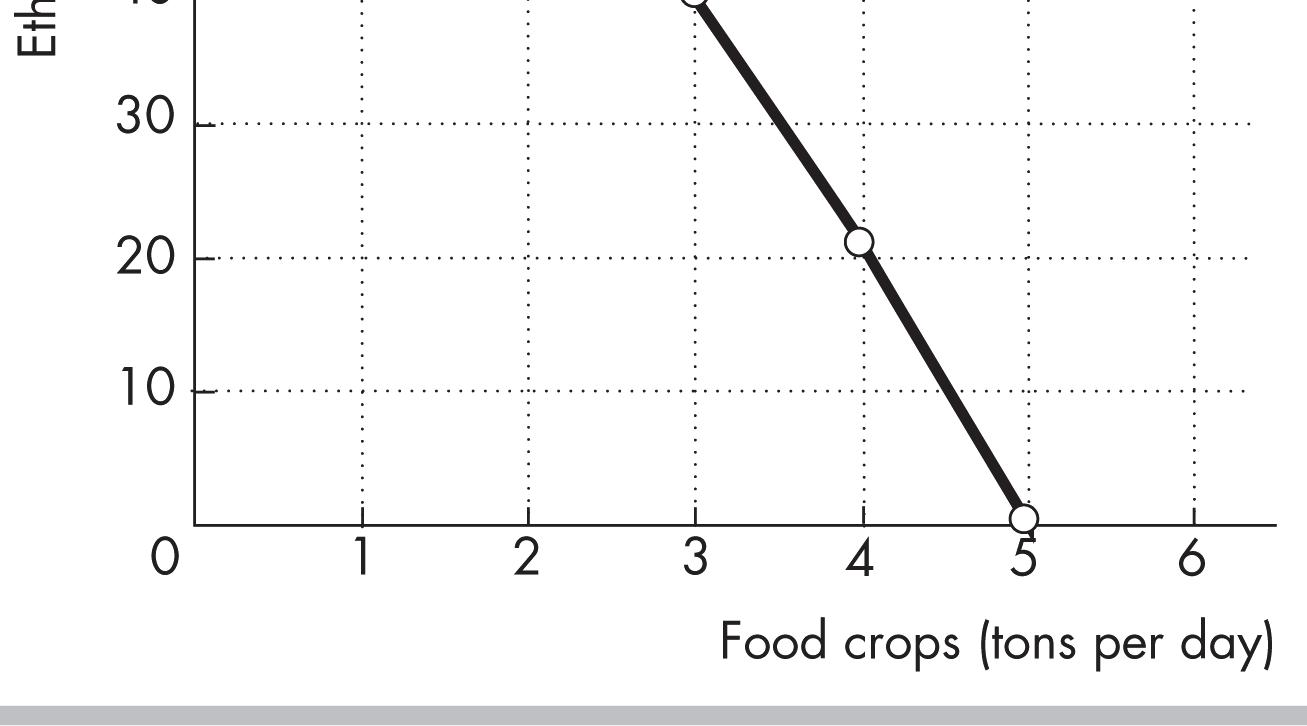
9. A farm grows wheat and produces pork. The marginal cost of producing each of these products increases as more of it is produced.
a. Make a graph that illustrates the farm’s PPF.
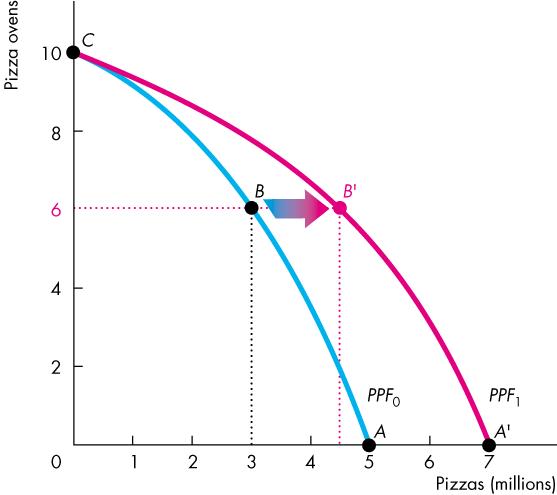
The PPF is illustrated in Figure 2.2 as PPF0
Because the marginal cost of both wheat and pork increase as more of the good is produced, the PPF displays increasing opportunity cost so it has the “conventional” bowed-outward shape.
b. The farm adopts a new technology that allows it to use fewer resources to fatten pigs. On your graph sketch the impact of the new technology on the farm’s PPF .
The new technology rotates the PPF outward from PPF0 to PPF1.
c. With the farm using the new technology in part (b), has the opportunity cost of producing a ton of wheat changed? Explain and illustrate your answer.
The opportunity cost of producing wheat has increased. The opportunity cost of a bushel of wheat is equal to the magnitude of 1/(slope of the PPF). As illustrated in Figure 2.2, for each quantity of wheat the slope of PPF1 has a smaller magnitude than the slope of PPF0 so the opportunity cost of a bushel of wheat is higher along PPF1. For a specific example, the opportunity cost of increasing wheat product from 600 bushels per week to 800 bushels per week along PPF1 is 6,000 pounds of pork but is only 3,000 pounds of pork along PPF0
d. Is the farm more efficient with the new technology than it was with the old one? Why?
The farm is able to produce more with the new technology than with the old, but it is not necessarily more efficient. If the farm was producing on its PPF before the new technology and after, the farm was production efficient both before the new technology and after.
10. For 50 years, Cuba has had a centrally planned economy in which the government makes the big decisions on how resources will be allocated.
a. Why would you expect Cuba’s production possibilities (per person) to be smaller than those of the United States?
Cuba’s economy is almost surely less efficient than the U.S. economy. The Cuban central planners do not know people’s production possibilities or their preferences. The plans that are created wind up wasting
resources and/or producing goods and services that no one wants. Because firms in Cuba are owned by the government rather than individuals, no one in Cuba has the self-interested incentive to operate the firm efficiently and produce goods and services that consumers desire. Additionally Cuba does not actively trade so Cuba produces most of its consumption goods rather than buying them from nations with a comparative advantage. Because Cuba uses its resources to produce consumption goods, it cannot produce many capital goods so its economic growth rate has been low.
b. What are the social institutions that Cuba might lack that help the United States to achieve allocative efficiency?
Of the four social institutions, firms, money, markets, and property rights, Cuba’s economy has firms and money. Markets, however, are less free of government intervention in Cuba. But the major difference is the property rights in the Cuban economy. In Cuba the government owns most of the firms; that is, the government has the property right to run the producers. Because the firms are not motivated to make a profit, the managers of these firms have little incentive to operate the firm efficiently or to produce the goods and services that consumers desire. In the United States, firms are owned by individuals; that is, people have the property right that allows them to run firms. These owners have the self-interested incentive to operate the firm efficiently and to produce the goods and services people want, an incentive sorely lacking in the Cuban economy.
Answers to Additional Problems and Applications
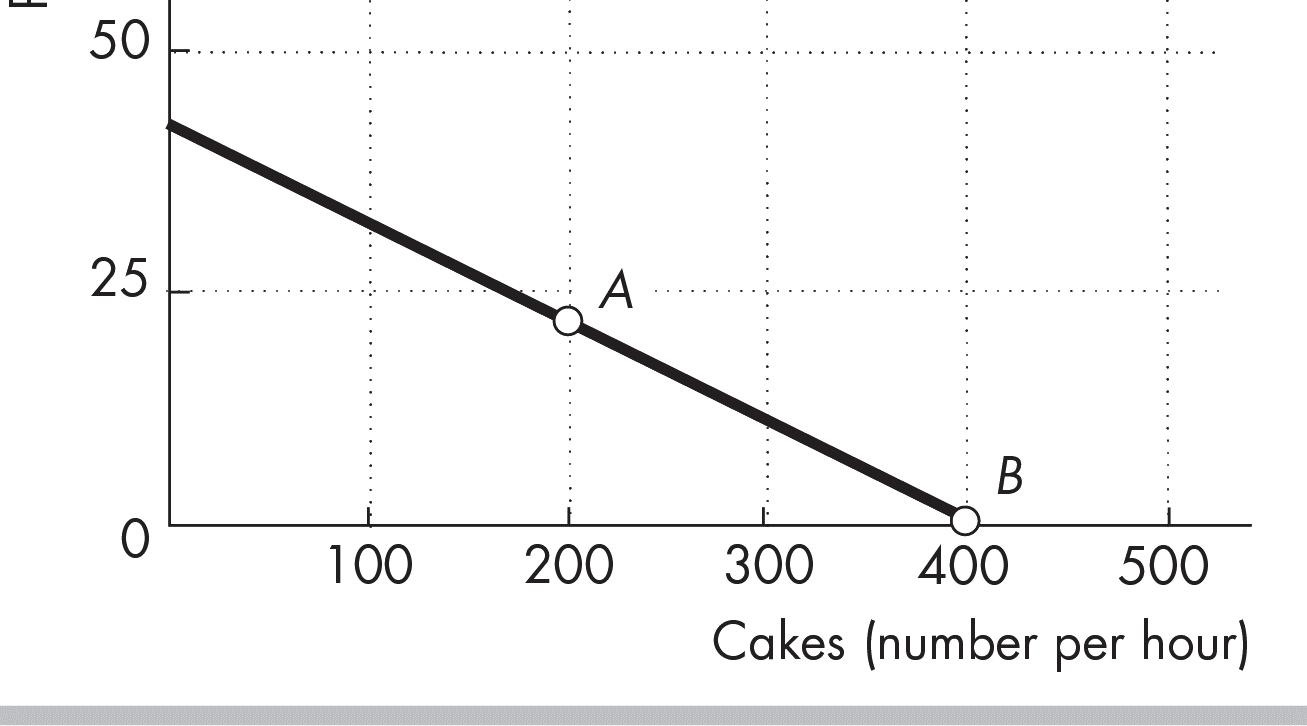
Use the table to work Problems 11 and 12. Suppose that Yucatan’s production possibilities are given in the table. 11. a. Draw a graph of Yucatan’s PPF and explain how your graph illustrates a tradeoff.
Yucatan’s PPF is illustrated in Figure 2.3. The figure illustrates a tradeoff because moving along Yucatan’s PPF producing more of one good requires producing less of the other good. Yucatan trades off more production of one good for less production of the other.
b. If Yucatan produces 150 pounds of food per month, how much sunscreen must it produce if it achieves production efficiency?
If Yucatan produces 150 pounds of food per month, then the point labeled A on the PPF in Figure 2.11 shows that Yucatan must produce 75 gallons of sunscreen per month to achieve production efficiency.
c. What is Yucatan’s opportunity cost of producing (i) 1 pound of food and (ii) 1 gallon of sunscreen?
Food (pounds per month)
Sunscreen (gallons per month)
300 and 0
200 and 50
100 and 100 0 and 150
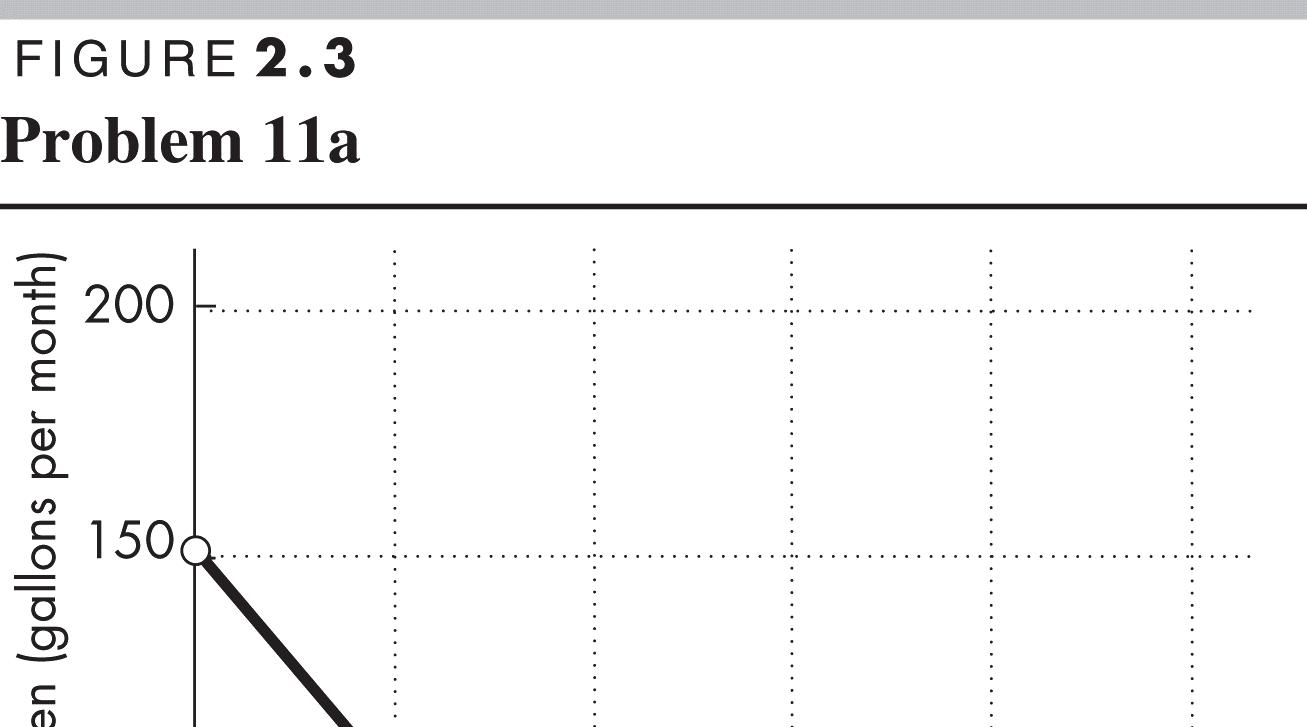
Yucatan’s PPF is linear so the opportunity cost of producing 1 pound of food is the same at all quantities. Calculate the opportunity cost of producing 1 pound of food when increasing the production of food from 0 to 100 pounds per month. Between these two ranges of production, the quantity of sunscreen produced falls from 150 gallons per month to 100 gallons per month, a decrease of 50 gallons. The opportunity cost is 50 gallons of sunscreen to gain 100 pounds of food. The opportunity cost per pound of food equals (50 gallons of sunscreen)/(100 pounds of food), or an opportunity cost of 0.5 gallon of sunscreen per pound of food. Yucatan’s PPF is linear so the opportunity cost of producing 1 gallon of sunscreen is the same at all quantities. Calculate the opportunity cost of producing 1 gallon of sunscreen when increasing the production of sunscreen from 0 to 50 gallons per month. Between these two ranges of production, the quantity of food produced falls from 300 pounds per month to 200 pounds per month, a decrease of 100 pounds. The opportunity cost is 100 pounds of food to gain 50 gallons of sunscreen, or (100 pounds of food)/(50 gallons of sunscreen) which yields an opportunity cost of 2.0 pounds of food per gallon of sunscreen.
e. What is the relationship between your answers to part (c)?
Answers (c) and (d) reflect the fact that opportunity cost is a ratio. The opportunity cost of gaining a unit of a good moving along the PPF equals the quantity of the other good or service forgone divided by the quantity of the good or service gained. The opportunity cost of one good, food, is equal to the inverse of the opportunity cost of the other good, sunscreen.
12. What feature of a PPF illustrates increasing opportunity cost? Explain why Yucatan’s opportunity cost does or does not increase. If opportunity costs increase, the PPF bows outward. Yucatan’s PPF is linear and along a linear PPF the opportunity cost is constant. Yucatan does not face an increasing opportunity cost of food because the
opportunity cost remains constant, equal to 0.5 gallons of sunscreen per pound of food. Yucatan’s resources must be equally productive in both activities.
13. In problem 11, what is the marginal cost of 1 pound of food in Yucatan when the quantity produced is 150 pounds per day? What is special about the marginal cost of food in Yucatan? The marginal cost of a pound of food in Yucatan is constant at all points along Yucatan’s PPF and is equal to 0.5 gallons of sunscreen per pound of food. The special point about Yucatan’s marginal cost is the fact that the marginal cost is constant. This result reflects Yucatan’s linear PPF
14. The table describes the preferences in Yucatan.
a. What is the marginal benefit from sunscreen and how is it measured?
The marginal benefit from sunscreen is the benefit enjoyed by the person who consumes one more gallon of sunscreen. It is equal to the willingness to pay for an additional gallon. For example, in the table when 75 gallons of sunscreen are produced, the marginal benefit of a gallon is 2 pounds of food per gallon.
b. Use the table in Problem 11. What does Yucatan produce to achieve allocative efficiency?
To achieve allocative efficiency, the marginal benefit of a gallon of sunscreen must equal the marginal cost of a gallon of sunscreen. Yucatan’s marginal cost of a gallon of sunscreen is 2 pounds of food per gallon. When Yucatan produces 75 gallons of sunscreen, the table shows that Yucatan’s marginal benefit is 2 pounds of food per gallon. Therefore allocative efficiency is achieved when 75 gallons of sunscreen and, from the PPF, 150 pounds of food are produced.
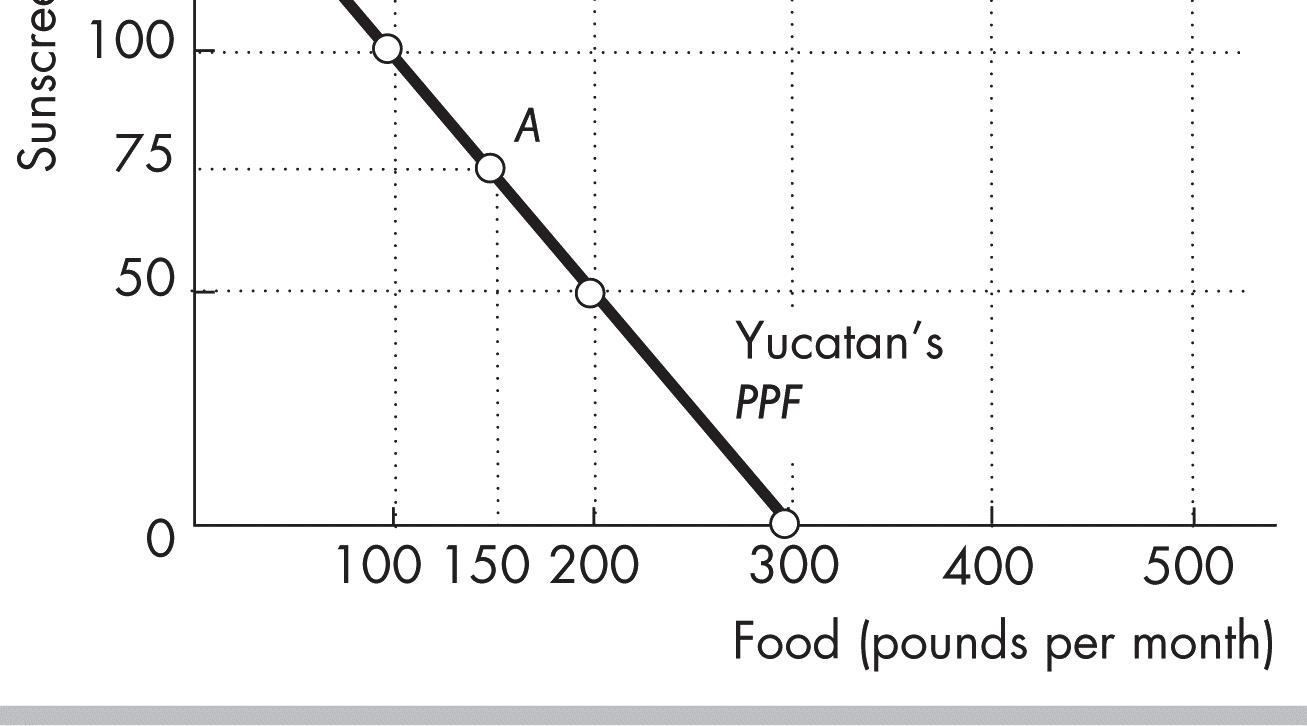
15. Macy’s, Kmart, JCPenney: More Retailers Closing Brick-and-Mortar Stores
As more people choose online shopping over brick-and-mortar stores, Macy’s, Kmart, JCPenney and others are closing stores.
Source: Springfield News-Sun, March 24, 2017
a. Draw the PPF curves for brick-and mortar retailers and online retailers before and after the Internet became available.
Before there was an Internet, there were no online retailers and the production possibilities frontier was PPF0 in Figure 2.4, the flat line along the xaxis. The only sales of retail goods were from brick-and-mortar retailers. After the Internet was developed, online retailers were created and started to sell goods and services. The Internet is a technological advance that changed the production possibilities frontier to PPF1 in Figure 2.4.
© 2018 Pearson Education, Inc.
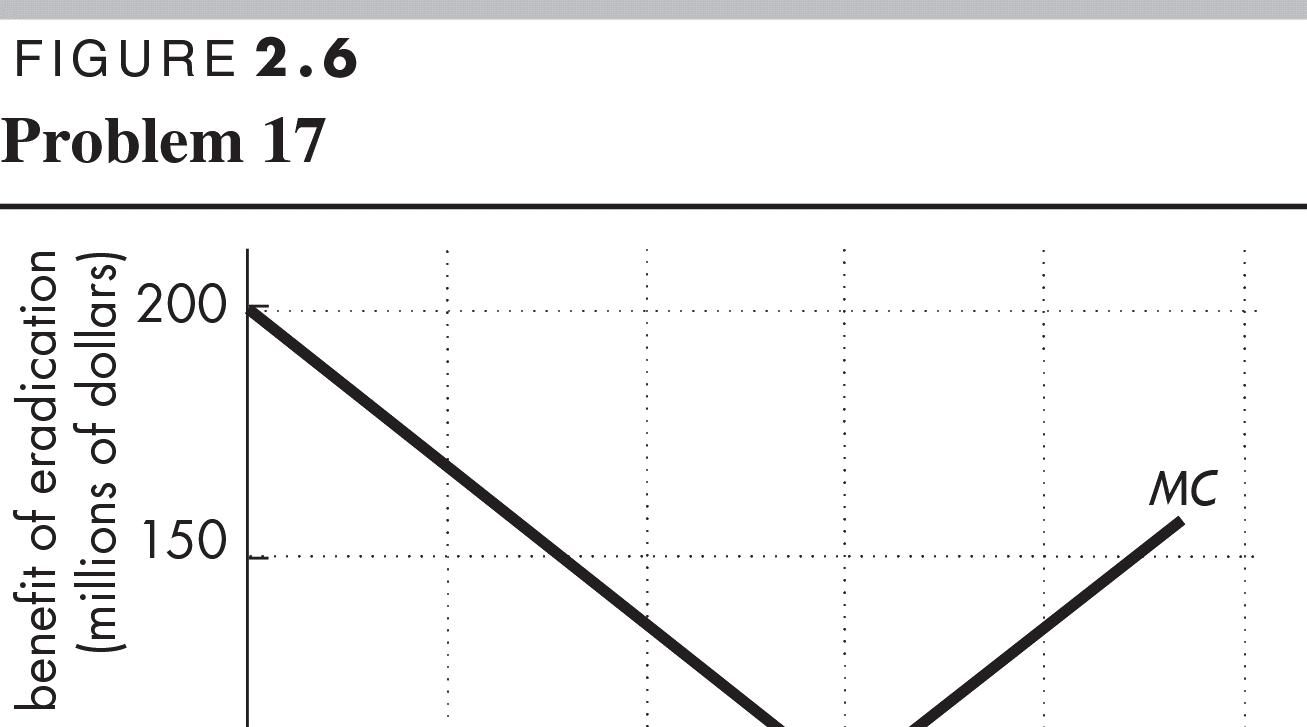
b. Draw the marginal cost and marginal benefit curves for brick-and-mortar retailers and online retailers before and after the Internet became available. The marginal benefit for the goods is the same regardless of whether they came from an online store or a brick-and-mortar store. Therefore in Figure 2.5 the marginal benefit curve for retail goods is MB. The marginal cost of brick-andmortar stores increases as the quantity increases, so both pre-and post-Internet, the brick-and-mortar marginal cost curve is MCB&M. Before the Internet, no online retailing could occur so the marginal cost curve is the vertical marginal cost curve MCPRE-INT running along the y-axis. After the Internet was developed online retailers have a lower marginal cost than do brick-and-mortar retailers, so the marginal cost curve of online retailers is MCPOST-INT.
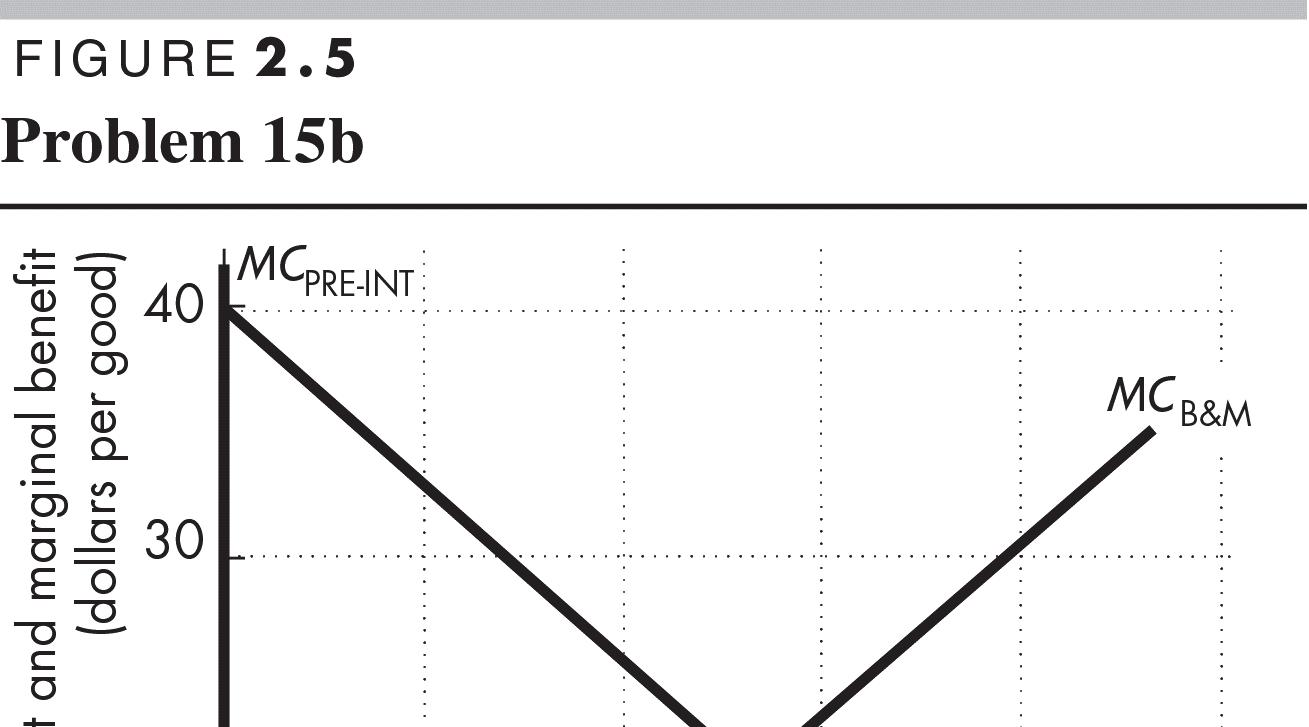
c. Explain how changes in production possibilities, preferences, or both have changed the way in which goods are retailed. The change in production possibilities, which created lower-cost online retailers, have changed the way retail goods are purchased. The expansion of the production possibilities did not change people’s preferences, so the marginal benefit does not change. But, with the lower cost of retailing, the quantity of retailing increases. Because the marginal cost of these goods is less using an online retailer, today consumers are purchasing increasingly larger amounts online. Consequently brick-and-mortar retailers are shrinking and disappearing as they go bankrupt.
Use the following news clip to work Problems 16 and 17.
Gates
Doubles Down on Malaria
Eradication
The End Malaria Council, convened by Bill Gates and Ray Chambers, seeks to mobilize resources to prevent and treat malaria. The current level of financing is too low to end malaria. Bruno Moonen, deputy director for malaria at the Gates Foundation, says that more resources, more leadership, and new technologies are needed to eradicate malaria in the current generation.
Source: Catherine Cheney, Devex, January 20, 2017, 16. Is Bruno Moonen talking about production efficiency or allocative efficiency or both?
Mr. Moonen is talking about allocative efficiency and production efficiency. The allocatively efficient quantity occurs when marginal cost equals marginal benefit. Mr. Moonen’s assessment is that from the current allocatively efficient quantity of malaria eradication more resources need to be devoted to malaria eradication if it is to be eliminated in the current generation. He suggests that production possibilities need to be increased by developing new technologies for fighting malaria. Once these technologies are developed, the production possibilities frontier and the production efficient points will shift outward. The new technologies will lower the cost of malaria eradication and thereby increase the allocatively efficient quantity of malaria eradication.
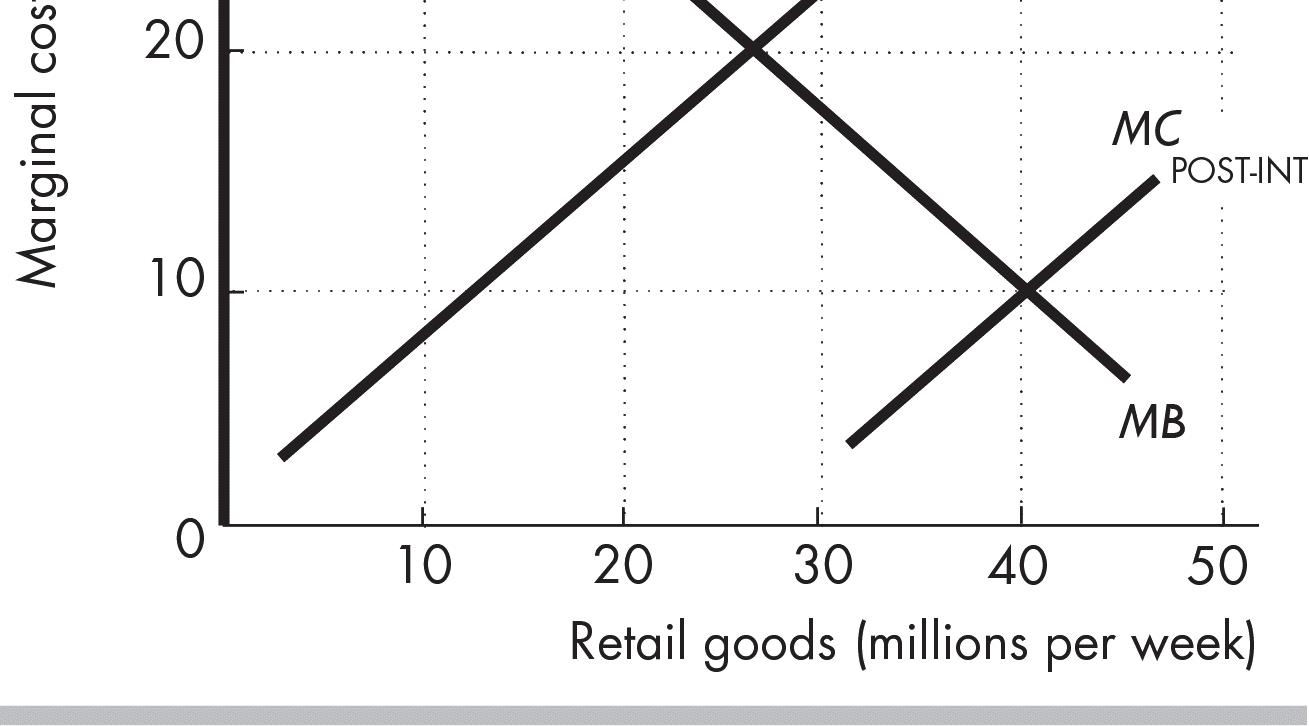
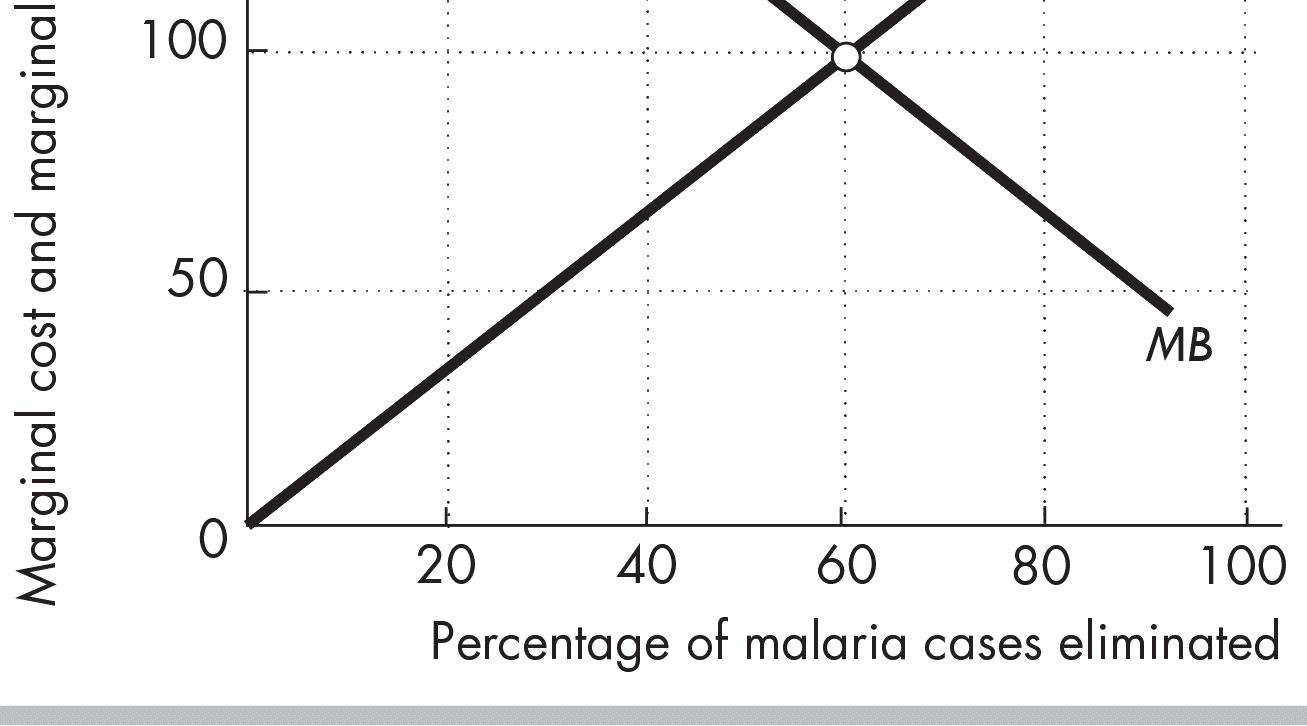
17. Make a graph with the percentage of malaria cases eliminated on the x-axis and the marginal cost and marginal benefit of driving down malaria cases on the y-axis. On your graph,
(i) Draw a marginal cost curve and marginal benefit curve that are consistent with Bruno Moonen’s opinion.
(ii) Identify the quantity of malaria eradicated that achieves allocative efficiency. Figure 2.6 shows a marginal cost curve and a marginal benefit curve that are consistent with Mr. Moonen’s views. According to Mr. Moonen, the current allocatively efficient quantity of malaria eradicated will not eliminate 100 percent of malaria in the current generation. In the figure, the allocatively efficient quantity is 60 percent of malaria cases eliminated because this is the quantity at which the marginal benefit equals the marginal cost.
Use the following data to work Problems 18 and 19.
Kim can produce 40 pies or 400 cakes an hour. Liam can produce 100 pies or 200 cakes an hour.
18. a. Calculate Kim’s opportunity cost of a pie and Liam’s opportunity cost of a pie. If Kim spends an hour baking pies, she gains 40 pies but forgoes 400 cakes. Kim’s opportunity cost of 1 pie is (400 cakes)/(40 pies), or 10 cakes per pie. If Liam spends an hour baking pies, he gains 100 pies but forgoes 200 cakes. Liam’s opportunity cost of 1 pie is (200 cakes)/(100 pies), or 2 cakes per pie.
b. If each spends 30 minutes of each hour producing pies and 30 minutes producing cakes, how many pies and cakes does each produce?
Kim produces 20 pies and 200 cakes. Liam produces 50 pies and 100 cakes. The total number produced is 70 pies and 300 cakes.
c. Who has a comparative advantage in producing (i) pies and (ii) cakes?
Liam has the comparative advantage in producing pies because his opportunity cost of a pie is less than Kim’s opportunity cost. Kim has the comparative advantage in producing cakes because her opportunity cost of a cake is less than Liam’s opportunity cost.
19. a Draw a graph of Kim’s PPF and Liam’s PPF and show the point at which each produces when they spend 30 minutes of each hour producing pies and 30 minutes producing cakes.
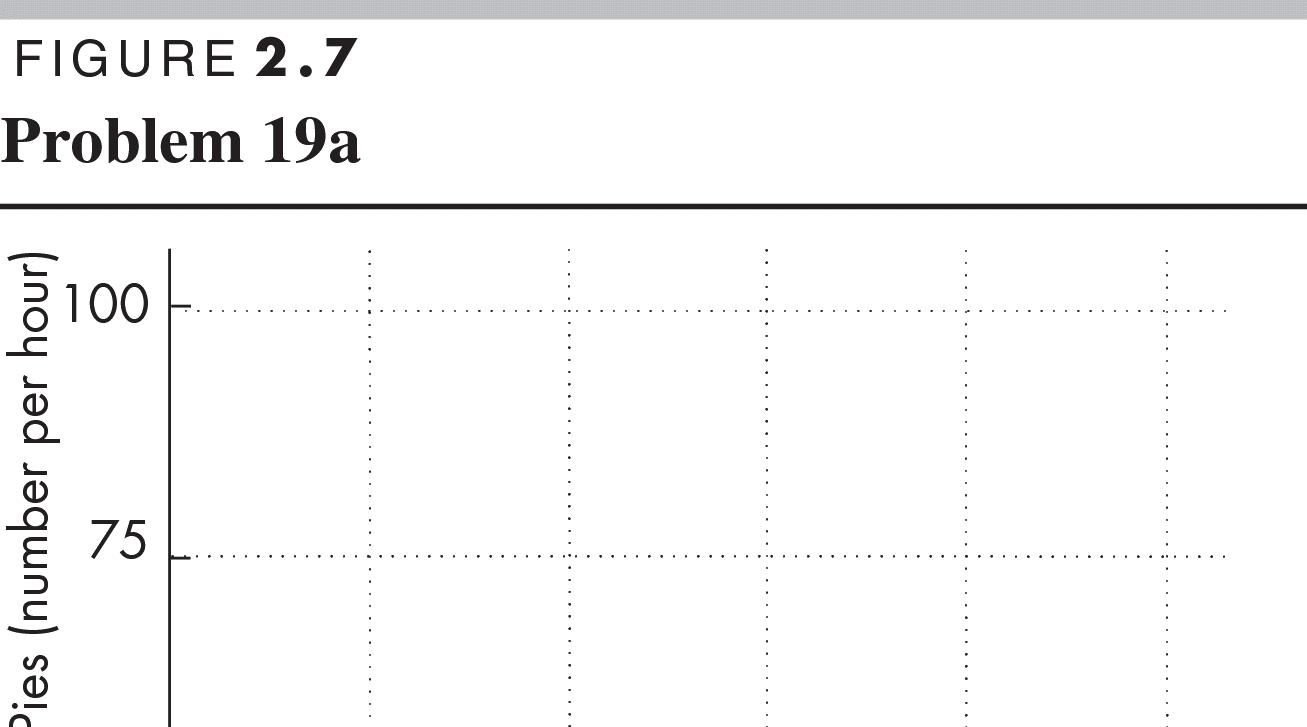
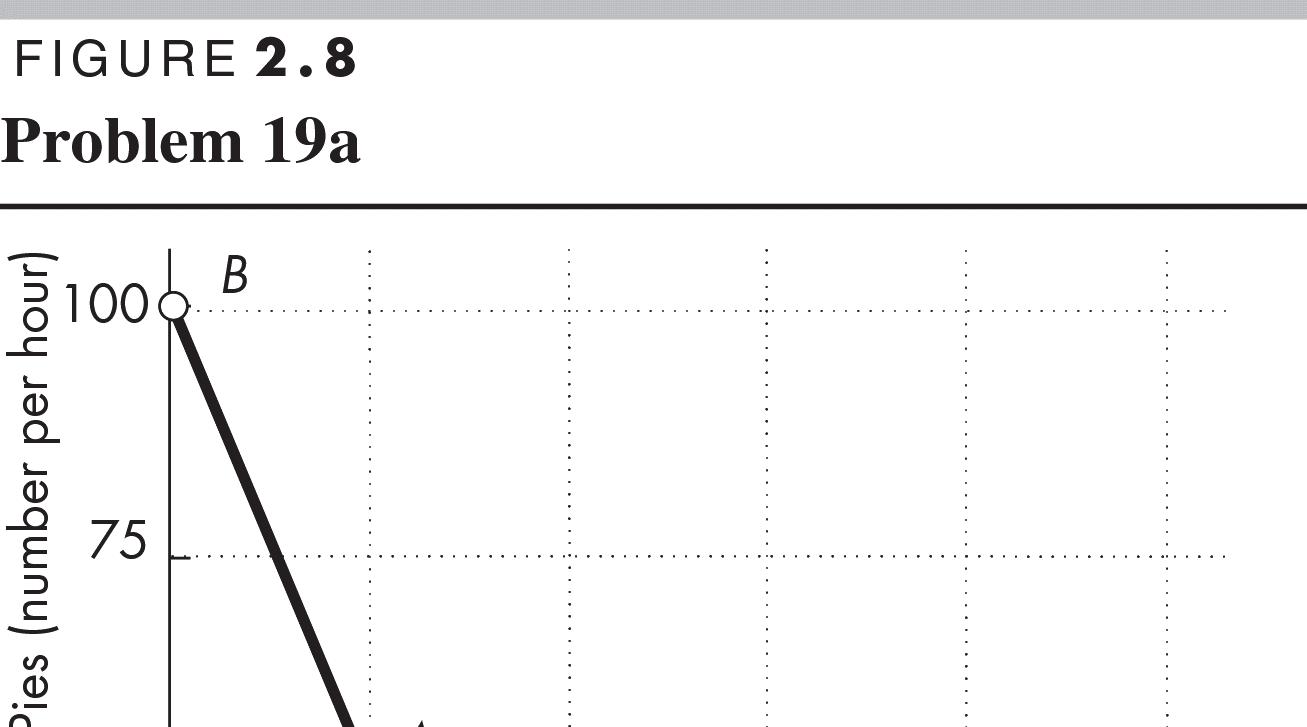
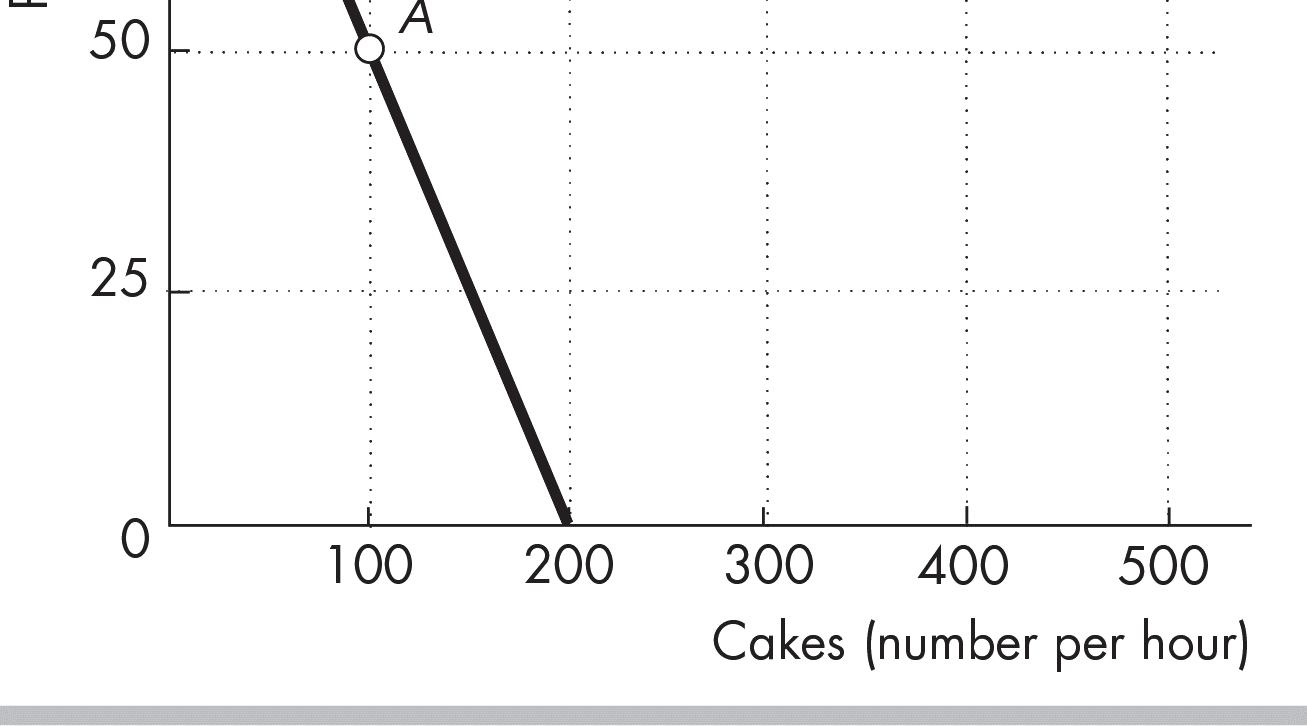
Kim’s PPF is illustrated in Figure 2.7; Liam’s PPF is illustrated in Figure 2.8.
Point A in both figures shows their production points when each spends 30 minutes making cakes and 30 minutes making pies.
b. On your graph, show what Kim produces and what Liam produces when they specialize.
Kim will specialize in cakes and Liam will specialize in pies. Point B in both figures shows the production points when each specializes.
c. When they specialize and trade, what are the total gains from trade?
Kim will specialize in cakes and Liam will specialize in pies. If they specialize and trade, the total production of both cakes and pies increase. When each spends 30 minutes making cakes and 30 minutes making pies, together they produce 300 cakes and 70 pies. When they specialize, together they produce 400 cakes and 100 pies. The 100 increase in cakes and the 30 increase pies is the gains from trade.
d. If Kim and Liam share the total gains equally, what trade takes place between them?
Kim will trade 50 cakes (half of the gain in cake production) to Liam in exchange for 15 pies (half of the increase in pie production).
Tony’s Production Possibilities Patty’s Production Possibilities
(units per week)
(units per week)
(units per week) 25 and 0 20 and 0 20 and 10 10 and 5 15 and 20 0 and 10
10 and 30
5 And 40
0 And 50
20. Tony and Patty produce skis and snowboards. The tables show their production possibilities.
Tony produces 5 snowboards and 40 skis a week; Patty produces 10 snowboards and 5 skis a week.
a. Who has a comparative advantage in producing (i) snowboards and (ii) skis?
(i) Tony’s opportunity cost of a snowboard is (10 skis)/(5 snowboards), or 2 skis per snowboard. Patty’s opportunity cost of a snowboard is (5 skis)/(10 snowboards), or 0.5 skis per snowboard. Patty’s opportunity cost of a snowboard is lower than Tony’s opportunity cost, so Patty has the comparative advantage.
(ii) Tony’s opportunity cost of a ski is (5 snowboards)/(10 skis), or 0.5 snowboards per ski. Patty’s opportunity cost of a ski is (10 snowboards)/(5 skis), or 2.0 snowboards per ski. Tony’s opportunity cost of a ski is lower than Patty’s opportunity cost, so Tony has the comparative advantage.
b. If Tony and Patty specialize and trade 1 snowboard for 1 ski, what are the gains from trade?
Tony has a comparative advantage in producing skis, so he specializes in producing skis. Patty has a comparative advantage in producing snowboards, so she specializes in snowboards. Tony now produces 50 skis and Patty produces 20 snowboards. Before specializing they produced a total of 45 skis (Tony’s 40 plus Patty’s 5) and 15 snowboards (Tony’s 5 plus Patty’s 10). By specializing, the total production of skis increases by 5 and the total production of snowboards increases by 5. This increase in total production is the gains from trade. By trading 1 ski for 1 snowboard, they can share these gains. Tony obtains snowboards from Patty for less than it costs him to produce them and Patty obtains skis from Tony for less than it costs her to produce them.
21. Capital accumulation and technological change bring economic growth: Production that was unattainable yesterday becomes attainable today; production that is unattainable today will become attainable tomorrow. Why doesn’t economic growth bring an end to scarcity one day? Scarcity is always being defeated yet will never suffer defeat. Scarcity reflects the existence of unmet wants. People’s wants are infinite—regardless of what a person already possesses, everyone can easily visualize something else he or she wants, if only more time in the day to enjoy their possessions. Because people’s wants are insatiable, scarcity will always exist regardless of economic growth.
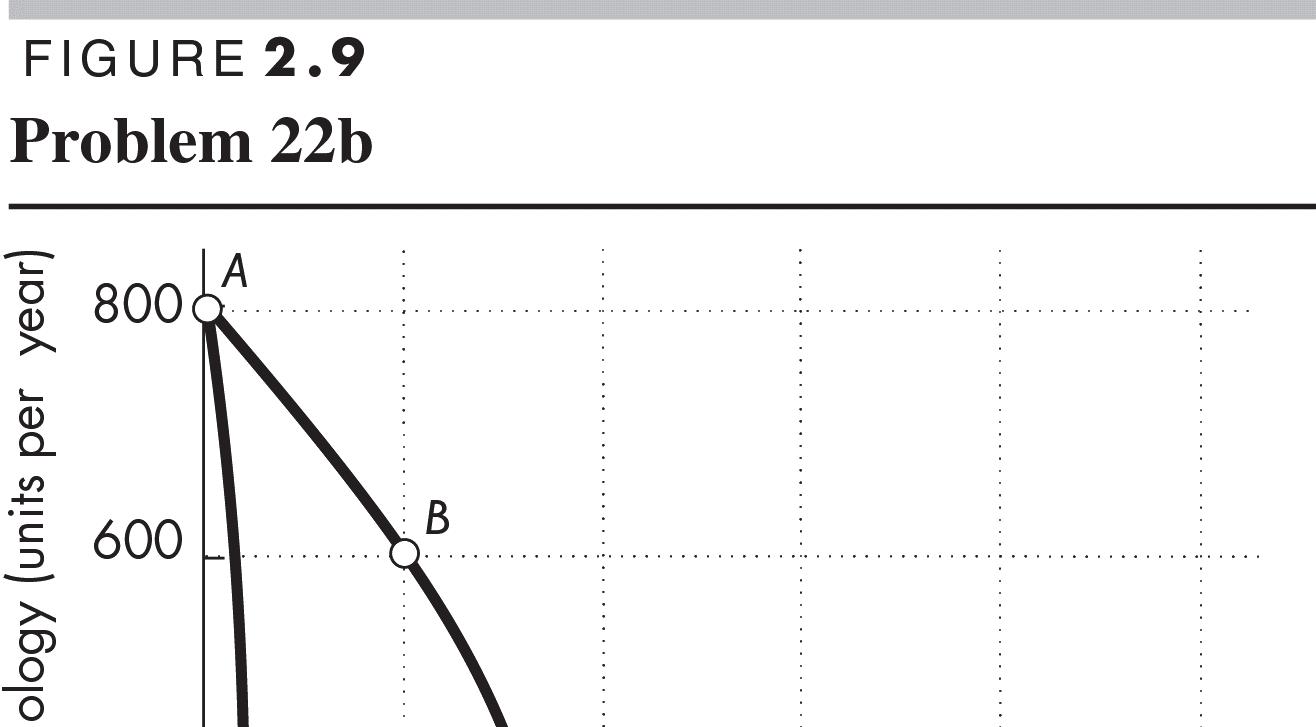
22.
SpaceX Plans to Send Two People Around the Moon
SpaceX CEO Elon Musk announced that SpaceX has plans to send two private citizens on a one week, 300,000- to 400,000-mile trip around the moon in 2018.
Source: The Verge, February 27, 2017
a. What is the opportunity cost of creating the technology for trips around the moon?
The opportunity cost of creating the technology is the next best alternative forgone by the resources used to develop this technology. For example, the engineers who are working to develop SpaceX’s technology might otherwise be assisting in the production of technology used to more powerful batteries, so the opportunity cost is the more powerful battery.
© 2018 Pearson Education, Inc.
b. Sketch SpaceX’s PPF and production point in 2017 and its PPF and planned production in 2018.
Figure 2.9 shows SpaceX’s PPF in 2017 and in 2018. The increase in SpaceX’s technology shifts its PPF outward so that its PPF in 2018 lies beyond its PPF in 2017. In 2017, a trip around the moon was beyond its PPF but with the technological advance it becomes possible. SpaceX’s production point in 2017 is labeled A, here it devotes all its resources to developing new technology. Its planned production in 2018 is labeled B, where it will produce 1 trip around the moon.
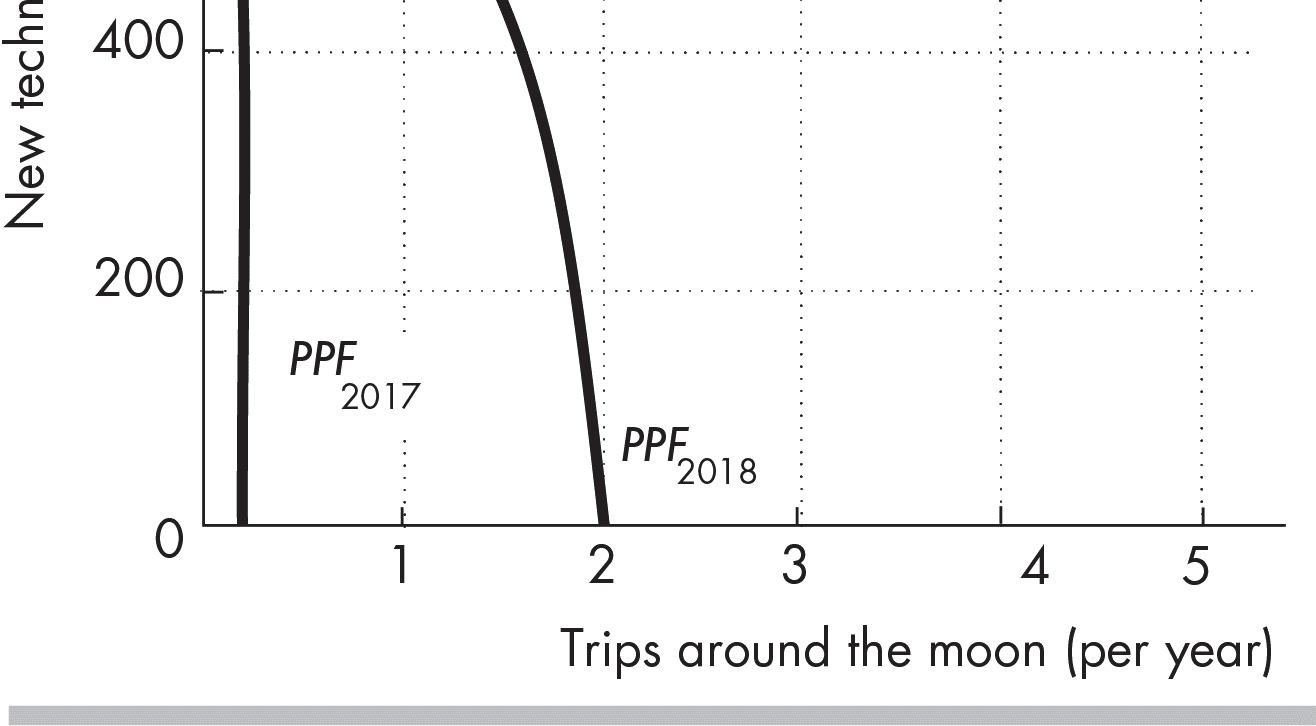
23. On a graph of the circular flows in the market economy, indicate the real and money flows in which the following items belong:
a. You buy an iPad from the Apple Store.
Figure 2.10 shows the circular flows in a market economy. Your purchase of an iPad from Apple is the purchase of a good from a firm. This flow is in the black arrow indicated by point a in the figure. When you pay for the iPad, the corresponding money flow is in the grey arrow in the opposite direction to the black arrow labeled a
b. Apple Inc. pays the designers of the iPad. Apple’s payment to the designers of the iPad is the payment of a wage to a factor of production. This flow is in the grey arrow indicated by point b in the figure. The flow of design services from the designer to Apple is in the black arrow in the opposite direction to the grey arrow labeled b
c. Apple Inc. decides to expand and rents an adjacent building.
Apple’s decision to expand by renting a building means that Apple is increasing the capital it uses. This flow is in the black arrow indicated by point c in the figure. The flow of the payment for the rental services of the building is in the grey arrow in the opposite direction to the black arrow labeled c.
d. You buy a new e-book from Amazon.
Your purchase of an e-book from Amazon is the purchase of a good from a firm. This flow is in the black arrow indicated by point d in the figure. When you pay for the e-book, the corresponding money flow is in the grey arrow in the opposite direction to the black arrow labeled d
e. Apple Inc. hires a student to work as an intern.
Apple’s decision to hire a student intern is Apple increasing the labor it uses. The flow of labor services is in the black arrow indicated by point e in the figure. The flow of the payment for the labor services is in the grey arrow in the opposite direction to the black arrow labeled c
Economics in the News
24. After you have studied Reading Between the Lines on pp. 50–51, answer the following questions.
a. How have robots changed the U.S. production possibilities?
Robots have increased the U.S. production possibilities and shifted the U.S PPF outward.
b. How have advances in technologies for producing services changed the U.S. production possibilities?
Advances in technologies for producing services have also increased U.S. production possibilities.
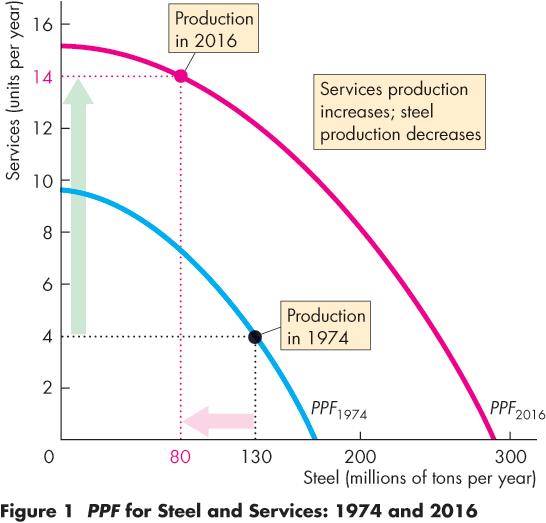
c. If robots had been the only technological advance, how would the PPF have changed? If robots had been the only technological advance, the PPF would have rotated outward. The maximum quantity of other goods and services would not have changed but the maximum quantity of goods produced using robots, such as steel, would have increased. For any quantity of other goods and services, more steel could be produced after the introduction of robots.
d. If robots had been the only technological advance, how would the opportunity cost of producing steel have changed? Would it have been lower or higher than it actually was?
If robots had been the only technological advance, the PPF would have rotated so that for any quantity of services the slope of the new PPF would be smaller than the slope of the initial PPF. Consequently, the opportunity cost of producing steel would have decreased. For any quantity of services the opportunity cost of producing steel would be lower after the introduction of robots.
25. YouTube Launches Live TV in the US
Google has launched YouTube TV, a $35-amonth service that carries live streaming from all the major broadcast and sports networks as well as some cable networks and local sports and news channels. Users will be able to record an unlimited amount of content and multiple shows simultaneously, without using up any data space on mobile devices.
Source: Mediatel, March 1, 2017
a. How has live streaming changed the production possibilities of video entertainment and other goods and services?
Live streaming has increased the production possibilities. For any quantity of other goods and services, now more video entertainment can be produced. The production possibilities frontier has changed so that the maximum quantity of video entertainment has increased but the maximum quantity of other goods and services has not changed.
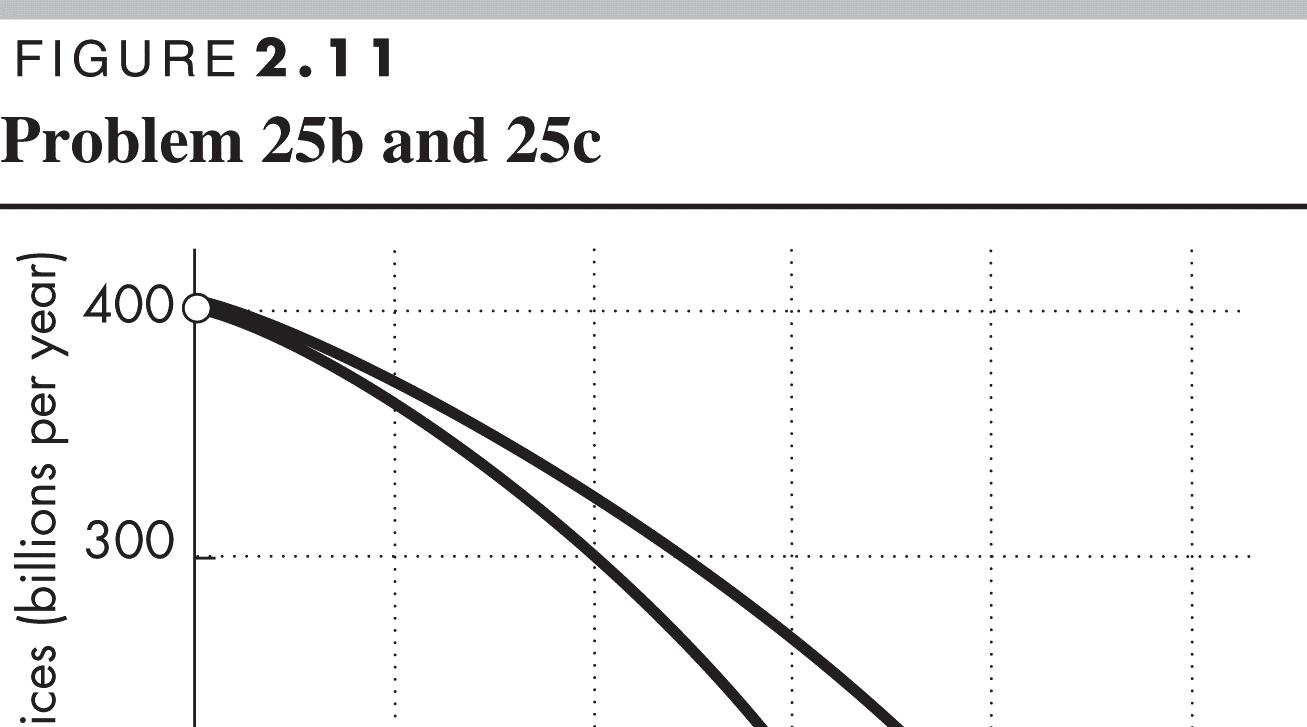
b. Sketch a PPF for video entertainment and other goods and services before live streaming. The PPF should have video entertainment on one axis and other goods and services on the other as illustrated in Figure 2.11. The PPF is bowed outward as a conventional PPF
c. Show how the arrival of inexpensive live streaming has changed the PPF. The arrival of inexpensive live streaming shifts the PPF outward as shown by the change from PPF0 to PPF1 in Figure 2.11. The intersection of the new PPF along the axis measuring video entertainment increases and the intersection of the new PPF along the axis measuring other goods and services does not change.
d. Sketch a marginal benefit curve and marginal cost curve for video entertainment before and after live streaming.
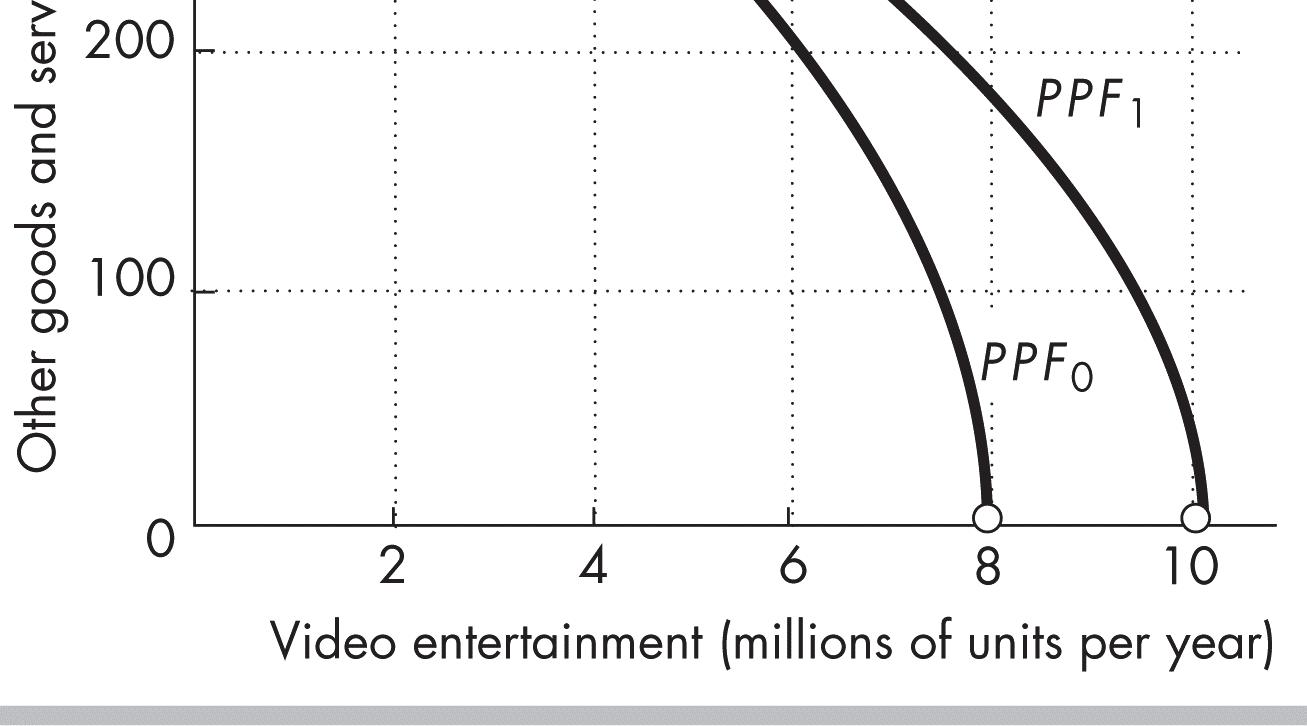
In Figure 2.12, the marginal benefit and marginal cost from video entertainment is measured along the vertical axis and the quantity of video entertainment is measured along the horizontal axis. As the figure shows, the marginal benefit curve is a conventional downward-sloping marginal benefit curve and the marginal cost curve is a conventional upward-sloping marginal cost curve. The introduction of low cost live streaming does not change the marginal benefit curve—it remains MB. But it lowers the marginal cost and shifts the marginal cost curve from MC0 to MC1.
e. Explain how the efficient quantity of video entertainment has changed.
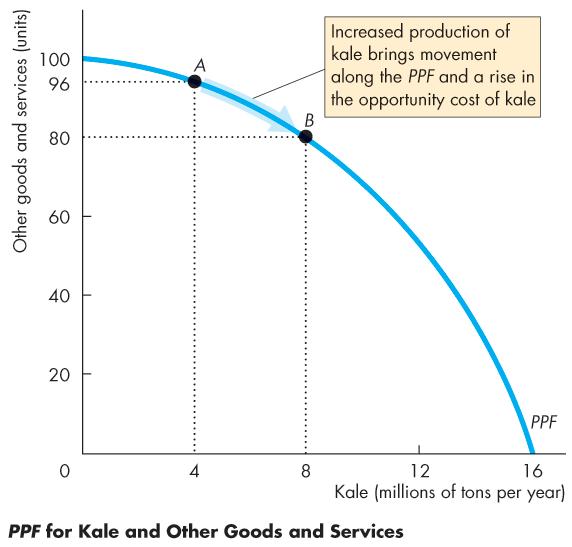
As Figure 2.12 shows, the allocatively efficient quantity of video entertainment increases. In Figure 2.12, the allocatively efficient quantity increases from 4 million units per year to 6 million units per year
The Big Picture
Where we have been:
2 THE ECONOMIC PROBLEM
Chapter 1 introduced the economic reality that wants exceed the resources available to satisfy them— we face scarcity. Chapter 2 reinforces these central themes by laying out the core economic model, the Production Possibilities Frontier, or PPF, and uses it to illustrate the concepts of tradeoff and opportunity cost. Chapter 2 further details the concepts of marginal cost and marginal benefit, presenting a first look at the concept of efficiency. The second half of the chapter begins with a model of exchange between two people that shows the “win-win” situation created through specialization and free trade. The next sections show how those individual gains scale up to economy wide gains. Lastly the traditional circular flow model highlights transformation of resources into final goods and services along with the money used in those markets
Where we are going:
The key concept of opportunity cost and the widespread tendency for the opportunity cost of a good to increase as the quantity produced of that good increases returns in Chapter 3 when we explain the supply curve. For Micro classes, we see it again in Chapters 10 and 11 when we study a firm’s costs and cost curves. Preferences return and are treated more rigorously when we explain marginal utility theory in Chapter 8 and indifference curves in Chapter 9. Efficiency returns in Chapter 5 when we study the efficiency of markets and first preview the impediments to efficiency. The gains from trade are explored more completely in the context of international trade in Chapter 7 in Microeconomics and Chapter 15 of Macroeconomics. Finally, the role of markets and prices in allocating resources and coordinating activity is an ongoing theme throughout most of the rest of the text. The next task, in Chapter 3, is to develop the central demand and supply model.
New in the Thirteenth Edition
Chapter 2 has been slightly reorganized and some new content has been added. The Worked Problem is now located before the Summary for all chapters in the book. The “Economics in the News” has a new article on President Trump’s potential help to Rust Belt manufacturing.
The introduction includes some teaser questions about President Trumps proposed trade policy changes. The first “Economics in the News” has new content regarding kale production. “Economics in Action” has been updated for Hong Kong being “caught up” rather than “catching up” to the United States.
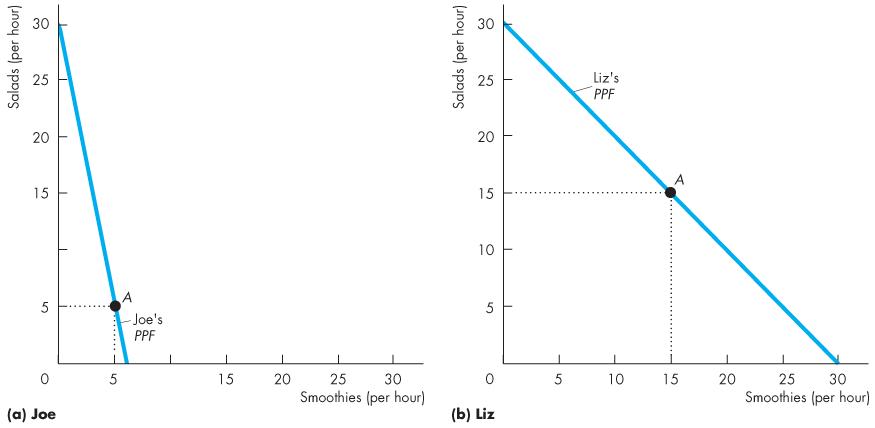
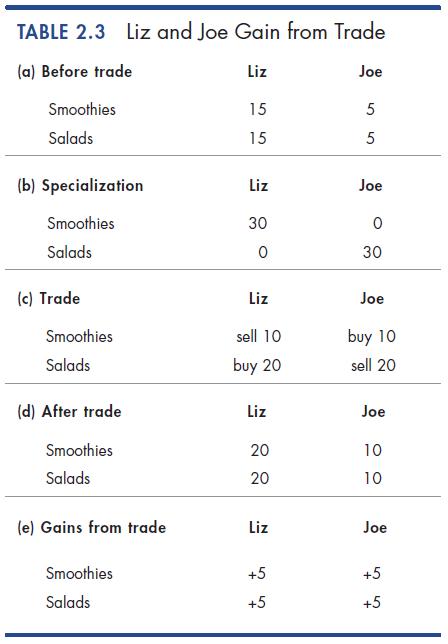
A major change to this chapter is that the Economic Growth section and Gains from Trade section have been switched so that Gains from Trade are explained first. This order is a more natural way to show the microeconomic foundations of macroeconomic concepts. As before, Gains from Trade illustrates Joe and Liz engaged in trade and the mutual benefits that result. The explanations have been refined along with an additional figure highlighting the “Liz-Joe Economy.” The chapter then moves into Economic Growth and Economic Coordination. Here again, Parkin has enhanced the discussion by adding a figure “How Economic Growth Changes What We Produce” along with text narrative to accompany it.
© 2018 Pearson Education, Inc.
Lecture Notes
The Economic Problem
• Scarcity creates the need to make choices.
• Economic choices can be evaluated in terms of their efficiency.
• We can expand possible choices through capital accumulation and specialization and trade.
I. Production Possibilities and Opportunity Cost
• The production possibilities frontier (PPF) is the boundary between those combinations of goods and services that can be produced and those that cannot given available resources and technology.
• Consider the production choices for two goods: books and movies. The table with the data for the PPF is below and a figure showing the PPF is to the right.
Books Movies
A 0 600
B 200 500
C 400 300
D 600 0
• Production points beyond the PPF are not attainable without increases in resources or technology (these factors shift the PPF);
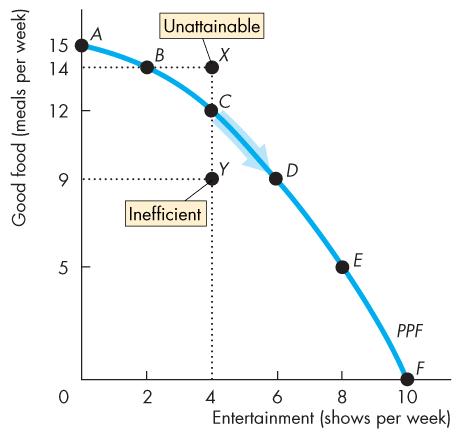
• Production points on and within the PPF are attainable, but production points within the PPF, such as point Z, are inefficient. It is possible to get more of one good without giving up any of the other.
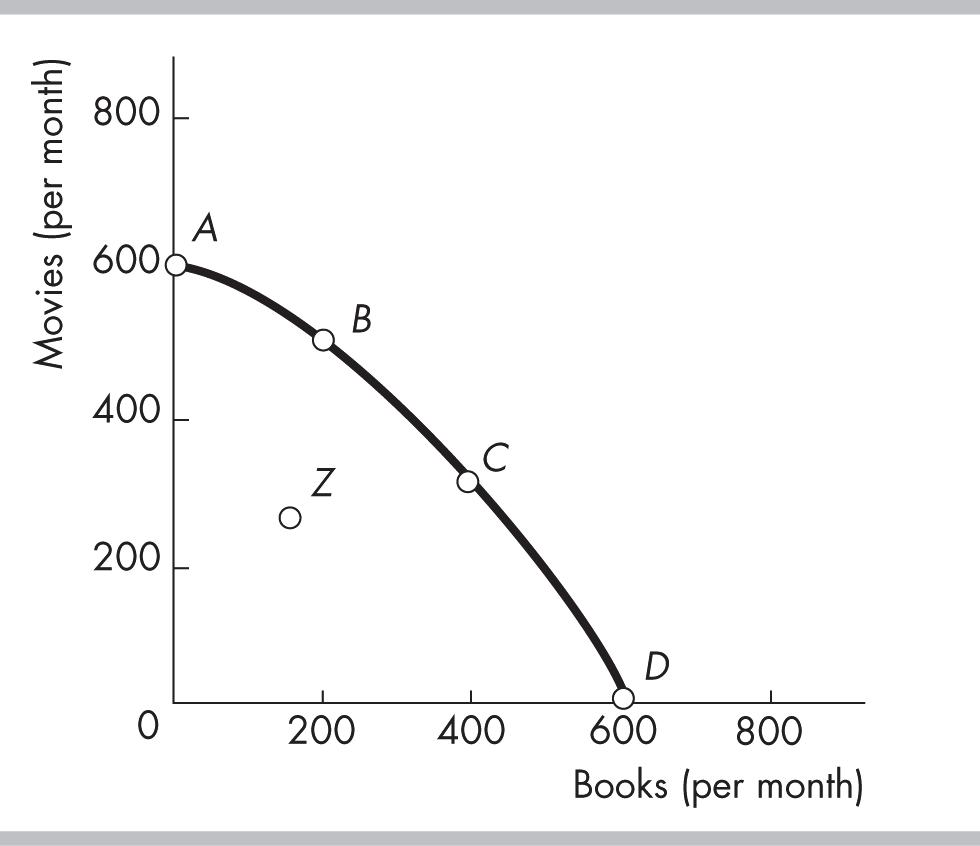
• The PPF illustrates how scarcity creates the need to make choices. Producing more books (moving from point A to point B) means producing fewer movies, and producing more movies (moving from point C to point B) means producing fewer books.
Using the PPF above, make a point outside the PPF and ask the students about it. Once they state it is not possible, ask them how we could get there. After they highlight a few shifters, summarize for them that the resources and technology we held constant when we drew the PPF now relocate it when they change. Now give them an example of a new movie camera invention and ask them if this will help us get more books? You will likely get an immediate round of “NO.” Reply, “Are you sure?” and you should be able to find a student who sees that the new resource frees up other resources that can now be used for more books. Show them graphically a shift that is pinned at the book axis and it will open their eyes to how technology and resource growth in any sector can make more of all goods!
Production Efficiency
Production is efficient only on the frontier.
• We achieve production efficiency if we cannot produce more of one good without producing less of some other good.
• Inside the frontier (point Z), production is inefficient. Resources could be better employed to increase production of both books and movies.
Tradeoff Along the PPF
• Moving along the PPF, there is always a tradeoff involved in diverting resources from the production of one thing to another. We gain one thing but at the opportunity cost of losing something else.
The key here is to make sure the student understands that given scarcity, because we produce one thing, we cannot produce something else. Some students will see the tradeoff immediately as a cost (giving up something), but they will incorrectly interpret that cost as only that valued in money units. To eliminate this ambiguity (better now than later), ask them to think about a meal they purchased recently. Now ask them what the money cost was as well as what else they might have picked for a meal? Most students pick up on this concept quickly with one or two more examples. And since this is a consumption example, tell them to put themselves in the place of an office manager, who must produce a service but can do so only given tradeoffs. While money costs are measurable and useful, propose to the students that opportunity costs are indeed even more useful in identifying the tradeoffs made in production.
Opportunity Cost
• The opportunity cost of an action is the highest valued alternative forgone.
• Opportunity cost is a ratio; it is the cost of an additional unit of a good measured in terms of what was given up to obtain that additional unit. The formula to calculate opportunity cost is decrease in the quantity produced of one good divided by the increase in the quantity produced of a another good.
• Efficiency means that the opportunity cost of producing more books or movies is the tradeoff along the frontier.
Increasing Opportunity Costs
• The “bowed-out” shape of the PPF reflects the principle of increasing opportunity cost.
• Not all resources are the same, which is why the PPF bows out. Publishers are better at producing books and Hollywood studios are better at producing movies. Moving along the frontier and producing more movies inevitably means that more and more publishers must produce movies. As this happens, the increase in movies becomes smaller and the decrease in books becomes larger.
• Emphasize the intercepts where the PPF crosses the axes. Take the vertical intercept in the figure. At this point all resources are used to produce movies. Basically to get to that point the economy has crammed and slammed every resource into movie production. Now when the economy moves down the PPF to produce the first book, that book is really inexpensive—has very low opportunity cost—because the economy uses resources better suited for book production first rather than movies.
• As more and more resources are diverted from production of one good to another, the smaller the additional increase in the production of the one good will be and the larger the decrease in the production of the other good.
You can bring in the relationship of slope and opportunity cost here if you want. OPTION 1: A soft way to bring in slope is to offer it as a double check on calculating marginal cost: “The opportunity cost of whatever is being measured on the horizontal axis is equal to the magnitude of the slope of the PPF.” OPTION 2: You can also introduce the slope of a curve as the slope of a tangent line to the curve, that is, the slope of the line that is “just kissing” the curve at a single point.
The bowed-out shape is a key feature of typical PPFs, often overlooked by the student (and too often not accentuated by the instructor). The key here is to link the ever increasing opportunity cost exhibited by the shape of a bowed out PPF with that of the marginal cost curve, which is upward sloping. Simply stated, some resources are better suited for the production of one good or the other.
To make the PPF model useful, it was necessary to simplify. By considering the case where production of all goods other than two remain fixed, we can use a relatively simple picture to see how concepts apply to the real world. With three goods, we would have a 3-D frontier surface. With more than 3 goods, it would be impossible to represent the frontier using a graph. The cool thing is that all relevant results of the 2-D model are true in the N-good model.
II. Using Resources Efficiently
Which point on the PPF best serves the public interest? To answer this question, we must measure and compare costs and benefits of different points.
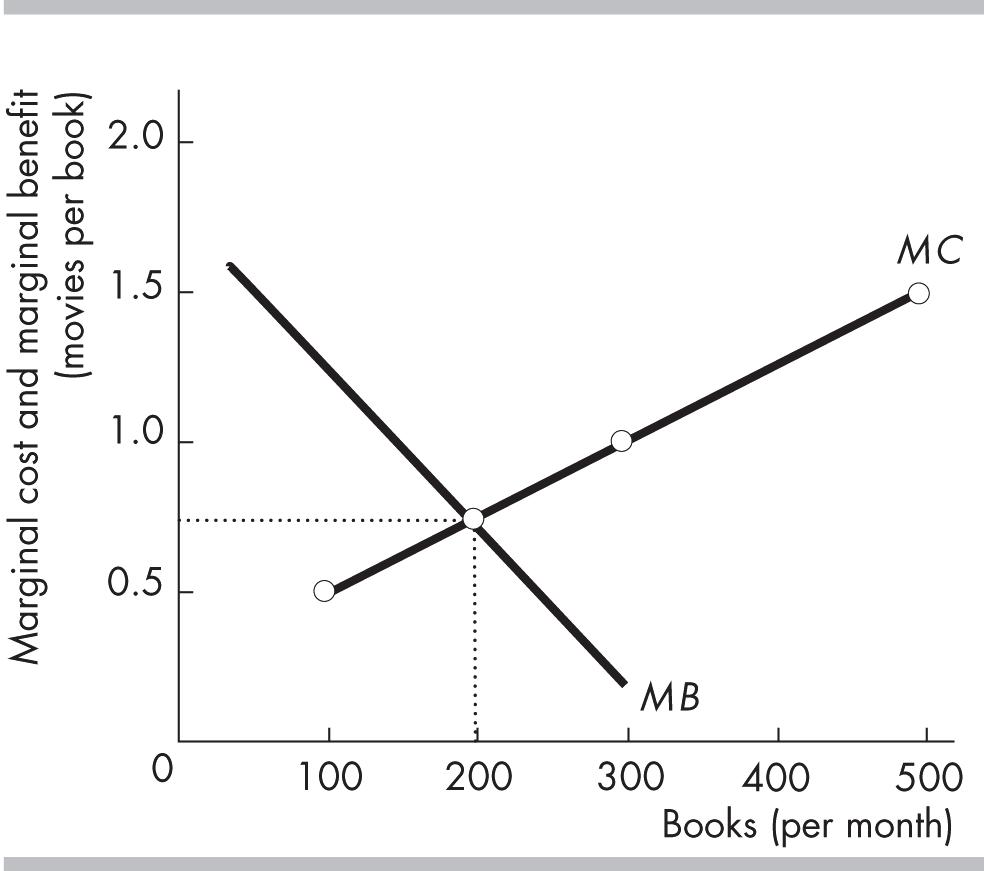
The PPF and Marginal Cost
• Marginal cost is the opportunity cost of producing one more unit of a good.
• As more books are produced, the marginal cost of a book increases. The table shows the marginal cost of producing books from the PPF data presented before and the figure shows the upward sloping marginal cost curve.
Books
Preferences and Marginal Benefit
• Preferences are a description of a person’s likes and dislikes.
• The marginal benefit of a good or services is the benefit received from consuming one more unit of it.
• The principle of decreasing marginal benefits is why the marginal benefit curve in the figure above slopes downward.
You might have some students that have had a microeconomics course in their past, and have already been introduced to the concept of marginal cost and marginal benefit. And, they might inquire if the marginal benefit curve is linked to the Law of Diminishing Marginal Utility. While this might be adequate discussion for an advanced undergraduate course, and certainly a graduate micro seminar, pass it up in your principles course. Let the student know that the goal is to employ demand side concepts, in a marginal sense. As such, key in on the fact that the marginal benefit curve can be characterized as a willingness to pay curve.
Keep the discussion of marginal cost and marginal benefit separate and distinct, making sure that the student realizes these are in essence the foundation of market forces (supply and demand, respectively). While the PPF can tell us the opportunity costs in production, and the tradeoffs therein, it is the market that allows us to determine the allocatively efficient point. Allocative efficiency only occurs with a balance between benefits and costs, at the margin.
Allocative Efficiency
Allocative efficiency occurs only when marginal benefit equals marginal cost.
• In the figure, when 100 books per month are produced, the marginal benefit from another book exceeds its marginal cost, which means that people prefer another book more than the movies they must give up.
• When the allocatively efficient number of books, 200 per month, is produced, the PPF in the previous figure shows that the allocatively efficient number of movies is 500 movies per month.
• When marginal cost equals marginal benefit it is impossible to make people better off by reallocating resources.
III. Gains from Trade
Specialization and trade expand consumption possibilities
Comparative Advantage and Absolute Advantage
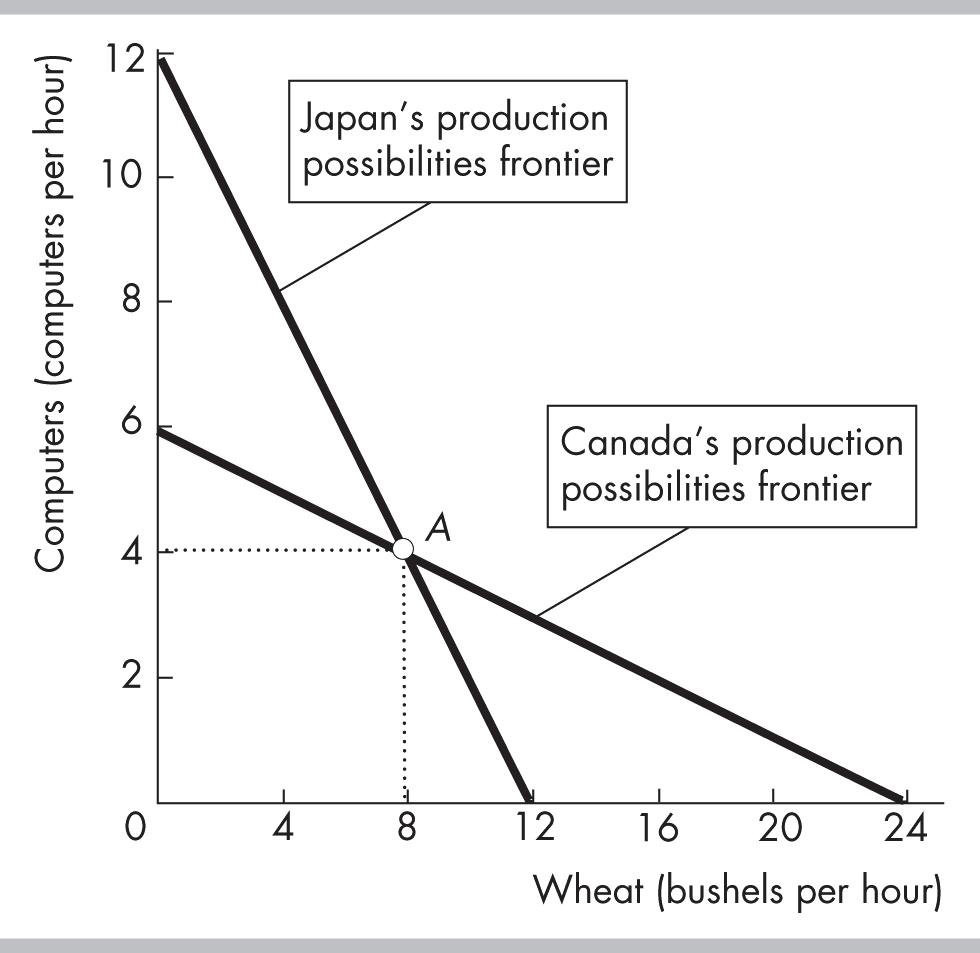
• A person has a comparative advantage in an activity if that person can perform the activity at a lower opportunity cost than anyone else.
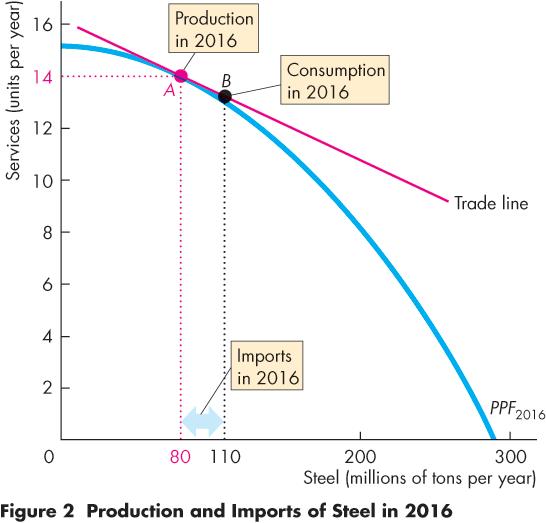
• The PPF shows opportunity cost. In the figure the opportunity cost of a bushel of wheat in Canada is 1/4 of a computer and in Japan it is 1 computer. In Canada the opportunity cost of a computer is 4 bushels of wheat and in Japan it is 1 bushel of wheat. Canada has a comparative advantage in producing wheat and Japan has a comparative advantage in producing computers.
• A person has an absolute advantage if that person is more productive than others in that activity or activities. A person (or country) can have an absolute advantage in all activities but that person (or country) will not have a comparative advantage in all activities.
An easy way for students to remember the difference between comparative and absolute advantages is that with comparative advantage, the opportunity costs comparison matters. If one has a comparative advantage in producing something, they should specialize in production of that good or service. An absolute advantage can be characterized by being able to “absolutely out-produce” the other economic agent. Even though a country might have absolute advantages, it should not produce everything, and should focus on identifying its comparative advantages.
Achieving the Gains from Trade
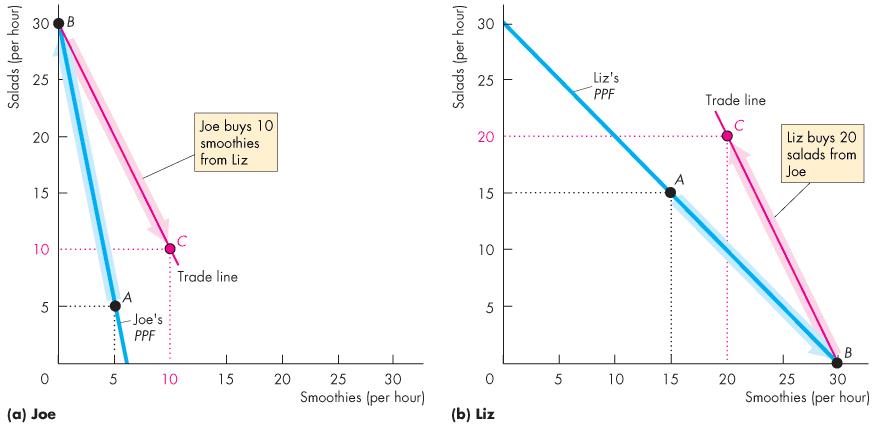
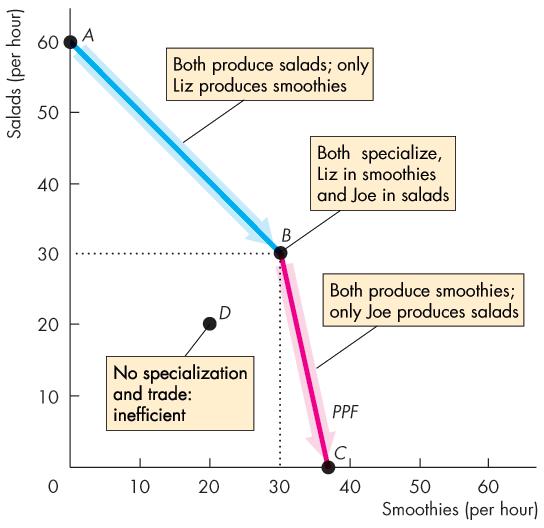
• When countries specialize by producing the good in which each country has a comparative advantage more goods in total can be produced. If without trade Canada and Japan each produce at point A, a total of 8 computers and 16 bushels of wheat are produced. If they specialize according to comparative advantage, Japan produces at point B* and Canada produces at point B for a combined total of 12 computers and 24 bushels of wheat.
• Trade allows consumption to be different than production for each nation, so Canada can trade wheat for computers and Japan can trade computers for wheat. Because more computers and more wheat are produced, both nations can consume more than they can produce on their own. For example, suppose that the market price of wheat is ½ computer per 1 bushel of wheat. As illustrated, each country can now be consuming at point C along the trade line. Note that each country’s consumption point lies beyond its own PPF.
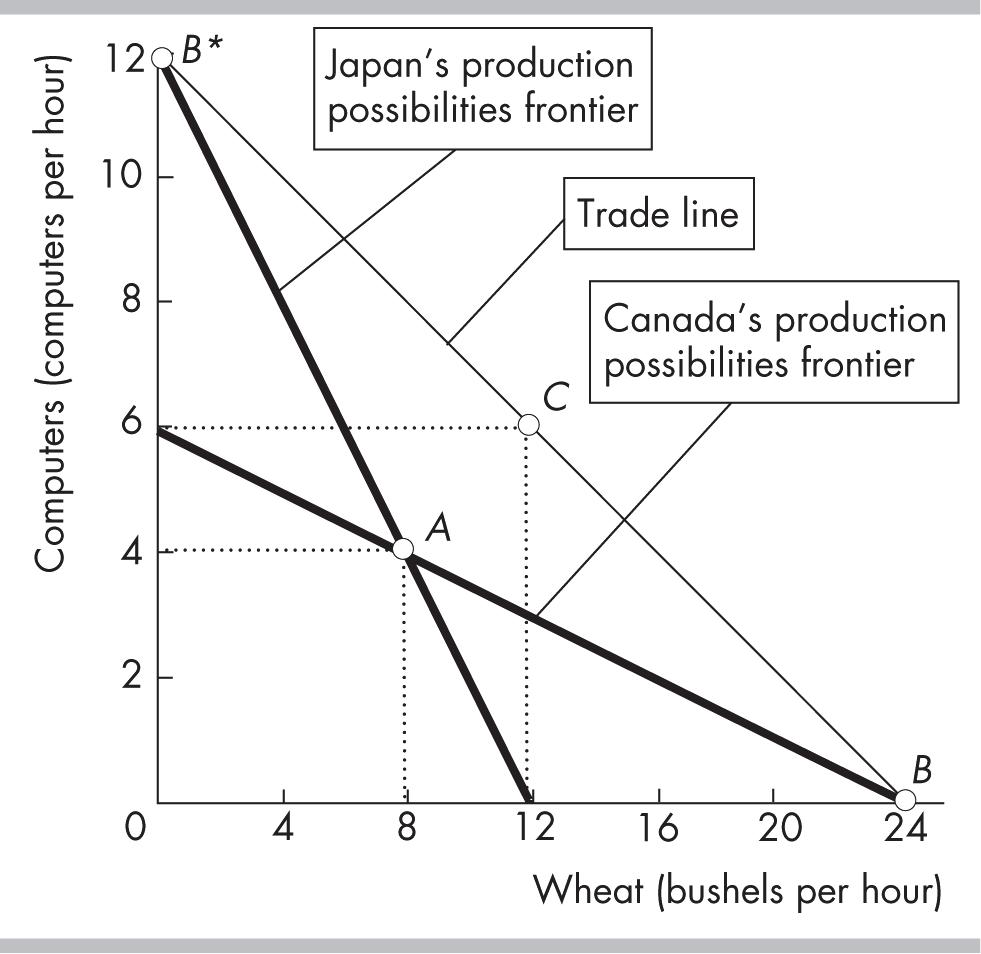
• The gains from trade can now be easily seen in terms of Japan and Canada each gaining 2 computers and 4 bushels of wheat compared to their initial, no-trade consumption points. Note that it is more likely that point C for each country will be on a different point on the trade line according to preferences. In the end,
© 2018 Pearson Education, Inc.
the sum of consumption among the two countries must equal the sum of production (imports=exports). For simplicity, this example has points A and C equal for both countries.
You may want to motivate the gains from trade using an example loosely based on Tom Hanks in the movie Castaway. Ask the students, “Was Tom by himself on the island an economy?” Use a couple goods like fish and coconuts and show Tom’s production possibilities. Discuss what are the essential elements needed to have an economy. Tom produces food and then he consumes it but is this sufficient for us to call him an economy? It is an open-ended question that I end with Tom needing somebody to trade with. Once a new person washes up on shore, the two can specialize in the good for which he or she has a comparative advantage and trade for the other. Give one of them an absolute advantage and then show how consumption possibilities lie outside each person’s production possibilities. This shows the power of specialization and trade in a way that personalizes it for the student.
To show the gains from trade you can use candy or any kind of small trinkets. Make sure that each person initially gets Then:
1. Create several countries with approximately even student populations. Give each country at least 3 or 4 items such as different types of candy. You can have some fun and add in a few entertaining items. For example: a can of spam, sticks of beef jerky, bubbles, etc.
2. Students record individual happiness value from 1-10 on initial allocation (I use an Excel spreadsheet to easily aggregate data at the end but keeping track on paper is fine).
3. Allow the countries to trade with each other
4. Have the students record their new happiness level after trade.
5. Compare the “happiness” level after trade with that before trade. Here are the key points that come from the experiment:
• Both parties become better off when they engage in voluntary trade.
• Even without production, trade creates value.
IV. Economic Growth
Economic growth expands production possibilities and shifts the PPF outward.
• Technological change (the development of new goods and of better ways of producing goods and services) and capital accumulation (the growth of capital resources, which includes human capital) lead to economic growth.
You can have some fun and generate some discussion by getting the students to think about what life might be like after another 200 years of economic growth. Provide some numbers: In 2017, income per person in the United States was about $133 a day. In 1808 it was about 70¢ a day, and if the past growth rate prevails for another 200 years, in 2208 it will be $14,000 a day. Emphasize the magic of compound growth. If they think that $14,000 a day is a big income, get them to do a ballpark estimate of the daily income of Bill Gates (about $10 million!). Encourage a discussion of why scarcity is still present even at these large incomes.
The Cost of Economic Growth
• Economic growth requires that resources must be devoted to developing technology or accumulating capital, which means that current consumption decreases. The decrease in current consumption is the opportunity cost of economic growth.
A Nation’s Economic Growth
• Countries that devote a higher share of resources to developing technology or accumulating capital are more likely to grow faster.
• Some nations, such as Hong Kong, have chosen faster capital accumulation at the expense of current consumption and so have experienced faster economic growth.
Running through the above example can really help students catch on to how economic growth is linked to choices (less consumption now for more later). You may wish to demonstrate more consumption or more capital biased shifts of the PPF, to demonstrate changes in opportunity costs.
Changes in What We Produce
• In a low-income country, just producing enough food is a high priority, and the marginal benefit from food is high. So in Ethiopia, agriculture accounts for a large 36 percent of total production.
• In China, where production per person is 7 times that of Ethiopia, agriculture shrinks to 9 percent of total production and industry expands to 41 percent.
• Further investment in capital and in advanced robot technologies expand production possibilities to the level in the United States, which today is 4 times (per person) its level in China.
V. Economic Coordination
Firms and Markets
• A firm is an economic unit that hires factors of production and organizes those factors to produce and sell goods and services.
• A market is any arrangement that enables buyers and sellers to get information and to do business with each other.
Property Rights and Money
• The social arrangements that govern the ownership, use, and disposal of resources, goods, and services are called property rights. Types of property include real (buildings and land), financial (stocks and bonds) and intellectual (ideas and technology).
• Money is anything generally accepted as a means of payment. Money’s main purpose is to facilitate trade.
Students are usually fixated on money, but ask them to dig deeper. It is what we can do or buy with money that brings us happiness not the actual bills themselves. Our focus on money creates a “veil” that hides the real economic engine of capitalism.
Circular Flows Through Markets
• Firms and households interact in markets and it is this interaction that determines what will be produced, how it will be produced, and who will get it.
Coordinating
Decisions
• Prices within markets coordinate firms’ and households’ decisions.
Everyone knows what prices are. But not everyone knows why prices rise or fall. The point is that no one needs to know why a price has changed when making the choice to buy or sell. All that someone needs to know is what the price is relative to what he or she believes the item to be worth.
• Enforced property rights ensure that exchange is voluntary (not theft). Property rights and prices help insure that production takes place efficiently without waste because the owner of a firm has the property right to any profit the firm can earn.
Willingness to pay affects production and production affects willingness to pay. It would appear that we have the classic “which came first, the chicken or the egg” conundrum. However, in the next chapter, we will discuss the most powerful model in economics, Demand and Supply, which allows us to think clearly about the behavior of markets.
© 2018 Pearson Education, Inc.
Additional Problems
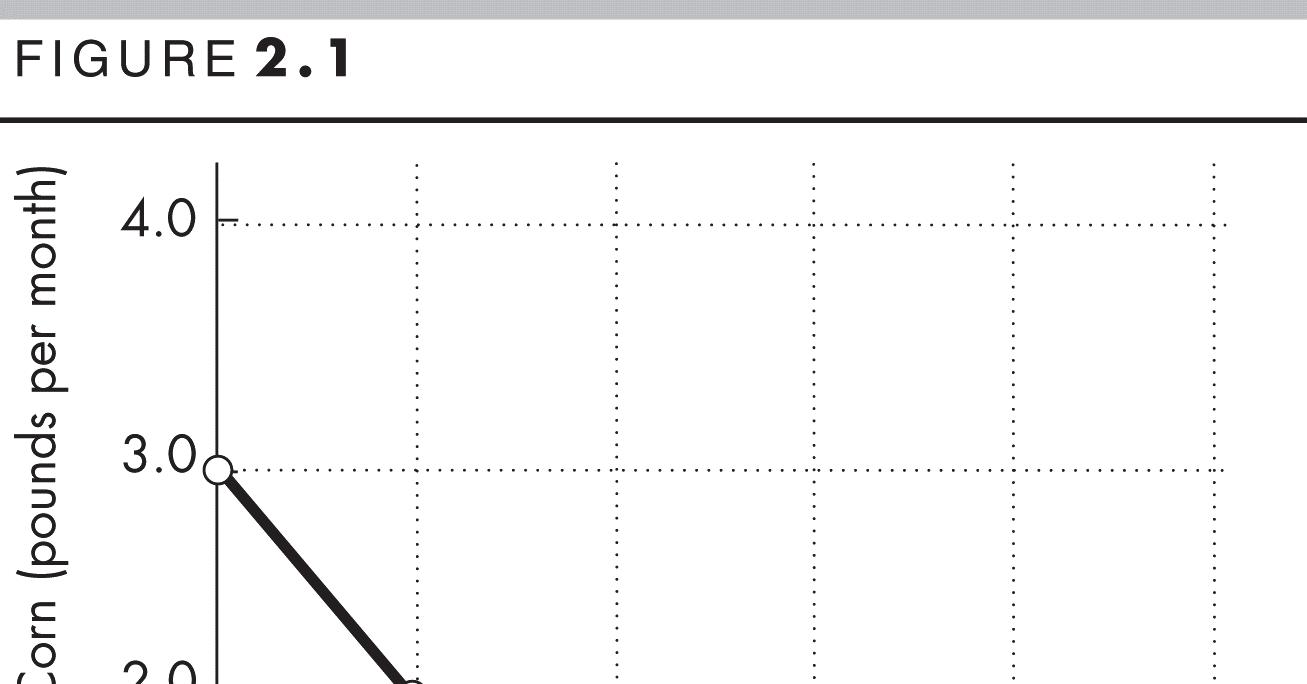
1. Jane’s Island’s production possibilities are given in the table to the right.
a. Draw a graph of the production possibility possibilities frontier on Jane’s Island.
b. What are Jane’s opportunity costs of producing corn and cloth at each output in the table?
Corn (pounds per month)
Cloth (yards per month)
3.0 and 0 2.0 and 2 1.0 and 4 0 and 6
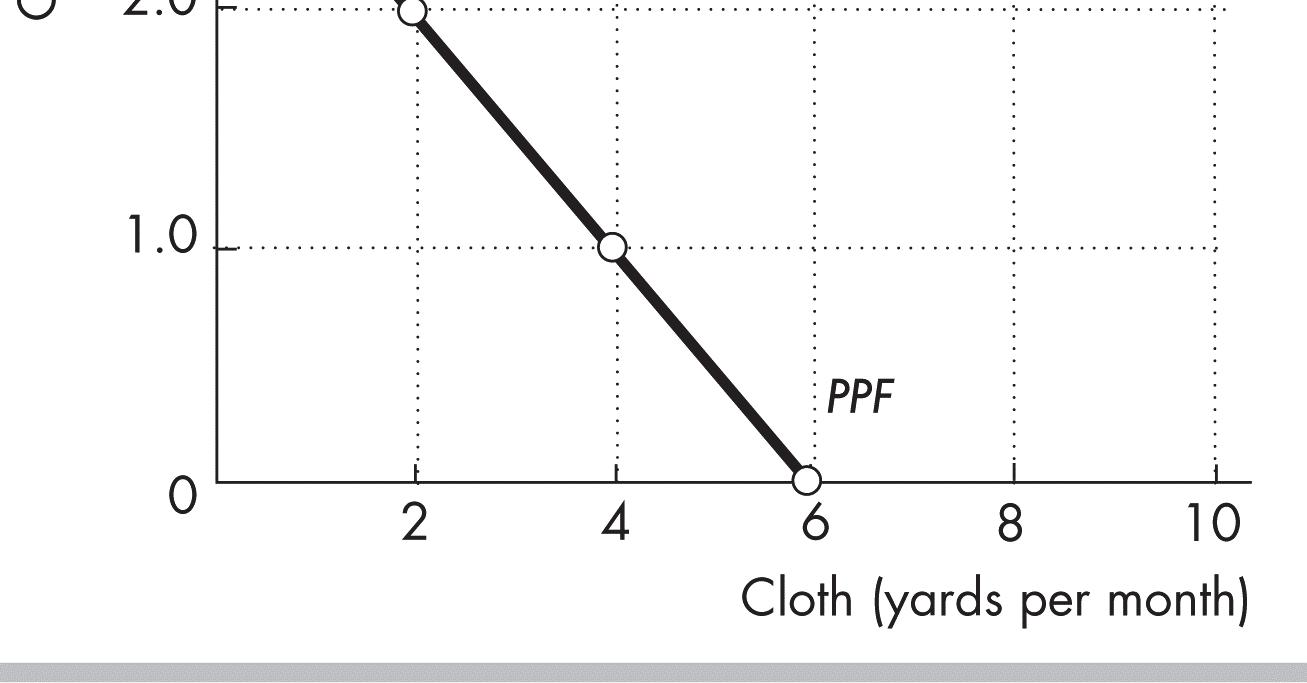
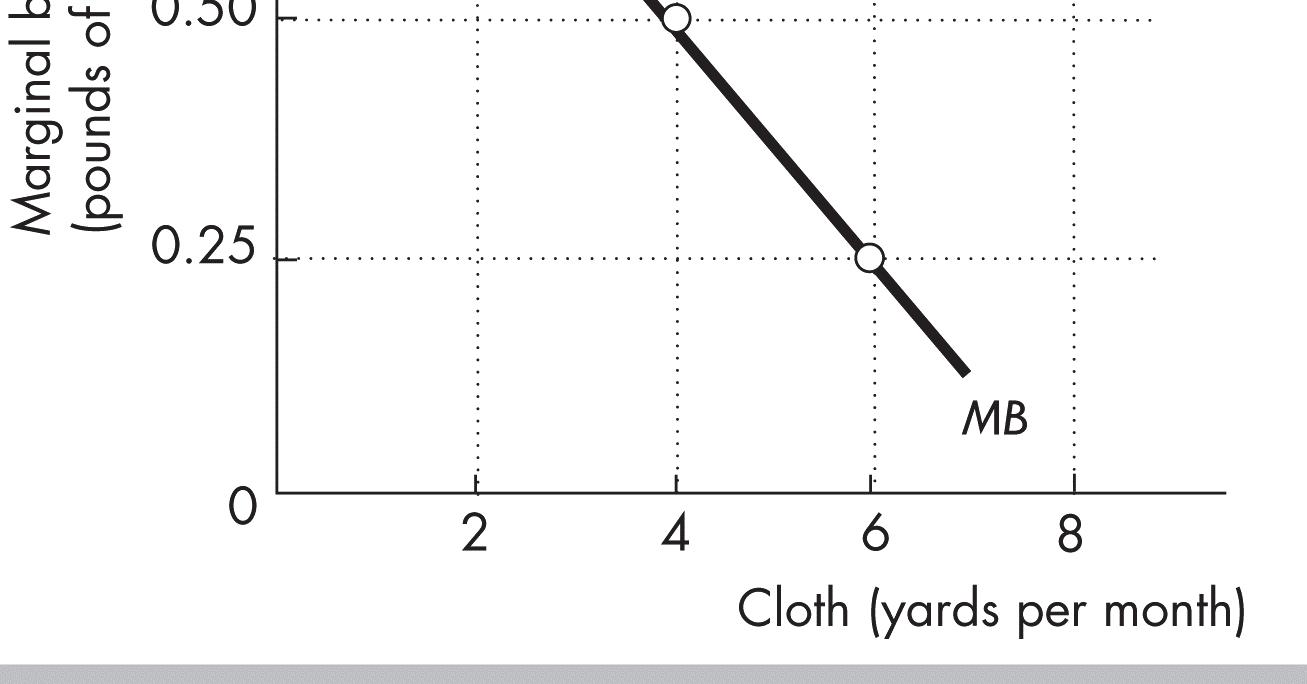
2. In problem 1, Jane is willing to give up 0.75 pounds of corn per yard of cloth if she has 2 yards of cloth; 0.50 pounds of corn per yard of cloth if she has 4 yards of cloth; and 0.25 pound of corn per yard of cloth if she has 6 yards of cloth.
a. Draw a graph of Jane’s marginal benefit from corn.
b. What is Jane’s efficient quantity of corn?
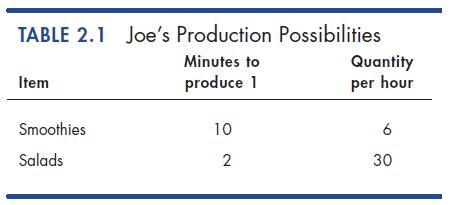
3. Joe’s production possibilities are given in the table to the right. What are Joe’s opportunity costs of producing corn and cloth at each output in the table?
4. In problems 1 and 2, Jane’s Island produces and consumes 2 pounds of corn and 2 yards of cloth. Joe’s Island produces and consumes 2 pounds of corn and 2 yard of cloth. Now the islands begin to trade.
a. What good does Jane sell to Joe and what good does Jane buy from Joe?
Corn (pounds per month)
Cloth (yards per month)
6 and 0 4 and 1.0 2 and 2.0 0 and 3.0
b. If Jane and Joe divide the total output of corn and cloth equally, what are the gains from trade?
Solutions to Additional Problems
1. a. Jane’s Island’s PPF is a straight line. To make a graph of Jane’s Island’s PPF measure the quantity of one good on the x-axis and the quantity of the other good on the yaxis. Plot the quantities in each row of the table. Figure 2.1 illustrates Jane’s Island’s PPF.
b. The opportunity cost of 1 pound of corn is 2 yards of cloth. The opportunity cost of the first pound of corn is 2 yards of cloth. To find the opportunity cost of the first pound of corn, increase the quantity of corn from 0 pounds to 1 pound. In doing so, Jane’s Island’s production of cloth decreases from 6 yards to 4 yards. The opportunity cost of the first pound of corn is 2 yards of cloth. Similarly, the opportunity costs of producing the second pound and the third pound of corn are 2 yards of cloth.
The opportunity cost of 1 yard of cloth is 0.5 pound of corn. The opportunity cost of producing the first 2 yards
of cloth is 1 pound of corn. To calculate this opportunity cost, increase the quantity of cloth from 0 yards to 2 yards. Jane’s Island’s production of corn decreases from 3 pounds to 2 pounds. Similarly, the opportunity cost of producing the second 2 yards and the third 2 yards of cloth are 1 pound of corn.
2. a. The marginal benefit curve slopes downward. To draw the marginal benefit curve from cloth, plot the quantity of cloth on the x-axis and the willingness to pay for cloth (that is, the number of pounds of corn that Jane is willing to give up to get a yard of cloth) on the y-axis, as illustrated in Figure 2.2.
b. The efficient quantity is 4 yards a month. The efficient quantity to produce is such that the marginal benefit from the last yard equals the opportunity cost of producing it. The opportunity cost of a yard of cloth is 0.5 pound of corn. The marginal benefit of the fourth yard of cloth is 0.5 pound of corn. And the marginal cost of the fourth yard of cloth is 0.5 pound of corn.
3. Joe’s Island’s opportunity cost of a pound of corn is 1/2 yard of cloth, and its opportunity cost of a yard of cloth is 2 pounds of corn. When Joe’s Island increases the corn it produces by 2 pounds a month, it produces 1 yard of cloth less. The opportunity cost of 1 pound of corn is 1/2 yard of cloth. Similarly, when Joe’s Island increases the cloth it produces by 1 yard a month, it produces 2 pounds of corn less. The opportunity cost of 1 yard of cloth is 2 pound of corn.
4. a. Jane’s Island sells cloth and buys corn. Jane’s Island sells the good in which it has a comparative advantage and buys the other good from Joe’s Island. Jane’s Island’s opportunity cost of 1 yard of cloth is 1/2 pound of corn, while Joe’s Island’s opportunity cost of 1 yard of cloth is 2 pounds of corn. Jane’s Island’s opportunity cost of cloth is less than Joe’s Island’s, so Jane’s Island has a comparative advantage in producing cloth. Jane’s Island’s opportunity cost of 1 pound of corn is 2 yards of cloth, while Joe’s Island’s opportunity cost of 1 pound of corn is 1/2 yard of cloth. Joe’s Island’s opportunity cost of corn is less than Jane’s Island’s, so Joe’s Island has a comparative advantage in producing corn.
b. With specialization and trade, together they can produce 6 pounds of corn and 6 yards of cloth and each will get 3 pounds of corn and 3 yards of cloth—an additional 1 pound of corn each and an additional 1 yard of cloth each. Hence the total gains from trade are 2 yards of cloth and 2 pounds of corn.
Additional Discussion Questions
1. Use the PPF model to analyze an “Arms Race” between nations. You might like to get the students to realize how useful even a simple economic model (such as the PPF model) is for helping us understand and interpret important political events in history. Draw a PPF for military goods and civilian goods production (or, simply, the traditional example of “guns versus butter”). Then draw another PPF for a country that is about twice the size of the first, but with the same degree of concavity as the PPF for the first country. Now assume that each country considers the other as a mortal “enemy,” and that they engage in a costly “arms race.” Each country picks a point on the PPF that produces an equal level of military output (in absolute terms).
© 2018 Pearson Education, Inc.
What would happen if the larger country decided to increase military production? Emphasize that while the distance on the military output axis at the point of production is equal for both countries, the resulting distance on the civilian output axis is (by definition) a smaller quantity for the smaller country. The large country can create significant economic and political pressures on the government of the small country by forcing the small country to match the increase in military production. The PPF reveals how much more additional civilian output is forgone by the citizens of the small economy relative to the citizens of the larger economy. Emphasize also that the opportunity cost of civilian goods is higher for the smaller country.
What were the economic repercussions of the Cold War? History and political science majors quickly perceive that these two PPF models reflect the Cold War relationship between the United States and the U.S.S.R. during the early 1980s. The Reagan administration increased U.S. military expenditures during the early 1980s to a post–Viet Nam War peak of 6.6 percent of GDP (as compared to about 3.5 percent of GDP in the late 1990s). Many experts agree that this strategy contributed to the many political and economic pressures that ultimately lead to the dissolution of the U.S.S.R.
What are the implications for the next 50 years? China is currently the world’s second largest economy. It could become the biggest by mid-century. How does this development influence the strategic balance and the position of the United States?
12. Using the PPF model to analyze global environmental agreements between nations. This application of the PPF is a more “green” perspective that uses the same logic as the “Arms Race” on a timely international policy issue. Compare a rich economy PPF to a poor economy PPF, each with the same degree of concavity. (Production levels are now measured as output per person.) The goods are now “cleaner air” and “other goods and services.”
What if the citizens of each country were required to make equal reductions in per-person greenhouse gas emissions? Show an equal quantity increase in per person output on the clean air axis for both countries’ PPF curves. Show how the opportunity cost of requiring additional pollution reduction (cleaner air) of equal amounts per person is much greater for the citizens of a poorer country than for the citizens of the richer country. This fact has been used to persuade developed countries (like the United States) to accept larger pollution reduction targets than developing countries (like China, India, and African nations).
3. Why do some of the brightest students not get a 4.0 GPA? The answer—because it doesn’t achieve allocative efficiency—can now be approached. The first conceptual step is to derive the marginal cost curve from the PPF. The table provides eight points on the MC curve. Tell the students that this table is from a PPF between hours spent at recreation and GPA. Use this opportunity to explain why we plot marginal values at the midpoints of changes because the marginal cost at the midpoint approximately equals the average of the opportunity costs across the interval. The students must now think about preferences for recreation and study. You’ll be surprised how many students want to derive preferences from the PPF! Explain that the PPF provides the constraint—what is feasible—and preferences provide the objective—what is desirable in the opinion of the chooser.
Each additional hour of recreation likely yields a smaller marginal benefit to the student. Translate this to the proposition that the student’s willingness to give up GPA points for additional hours of recreation decreases and provide a table similar to that in Figure 2.3 that captures this observation. The table has a preference schedule. Stress once again that this table did not come from the PPF
To determine the efficient amount of recreation and hence study time, the student must ask “Do I study a little bit longer?” That is the question. Walk the student through the thought experiment:
1. If I study for 8 hours a day I get a 4.0, but I am willing to pay much more than I will pay if a take a bit of time off studying and have some fun. So I will be better off if study less and take more recreation time.
2. If I don’t study at all I get a 0.4, and I am paying much more in lost GPA than I am willing to pay for the last bit of fun. So I will be better off if I study more and take less recreation time.
3. The only allocation at which I can’t become better off by studying a little bit more or a little bit less is where I am just willing to pay what the last bit of recreation costs—where marginal cost equals marginal benefit.
In this example, the student studies for 4.5 hours and takes 3.5 hours a week of recreation time. Explain that there is nothing strange or wrong with the fact that the student gets no net benefit from the last seconds-worth of recreation time. He or she is just willing to pay what it costs him or her.
4. Gains from Trade The gain from trade is a real eye-opener for students. Their first reaction is one of skepticism. Convincing students of the power of trade to raise living standards and the costs of trade restriction is one of the most productive things we will ever do. Here are some questions to drive home the idea of comparative advantage:
Why didn’t Billy Sunday do his own typing? Billy Sunday, an evangelist in the 1930s, was reputed to be the world’s fastest typist. Nonetheless, he employed a secretary who was a slower typist than he. Why? Because in one hour of preaching, Billy could raise several times the revenue that he could raise by typing for an hour. So Billy plays to his comparative advantage.
Why doesn’t Martha Stewart bake her own bread? Martha Stewart is probably a better cook than most people, but she is an even better writer and TV performer on the subject of food. So Martha plays to her comparative advantage and writes about baking bread but buys her bread.
Why doesn’t Vinnie Jones play soccer? Vinnie Jones was one of the world’s best soccer players. But he stopped playing soccer and started making movies some years ago. Why? Because, as he once said, “You go to the bank more often when you’re in movies.” Vinnie’s comparative advantage turned out to be in acting.
THE ECONOMIC PROBLEM

Click on button to go to figure
Click on button to go to figure
Figure 2.1 Production Possibilities Frontier with table
Figure 2.2(a)
Figure 2.2(b) The PPF and Marginal Cost: Marginal Cost
Figure 2.1 Production Possibilities Frontier The PPF and Marginal Cost: PPF and Opportunity Cost Preferences and Marginal Benefit Curve
Figure 2.3
Figure 2.3 Preferences and Marginal Benefit Curve with table
Click on button to go to figure
Click on button to go to figure
Figure 2.9(a)
Click on button to go to figure
Click on button to go to figure
Figure 2.9(a)
How Economic Growth Changes What We Produce:
From Low to Middle Income
How Economic Growth Changes What We Produce:
From Middle to High Income
Figure 2.10 Circular Flows in the Market Economy
Table 2.1
Joe’s Production Possibilities
Table 2.2 Liz’s Production Possibilities
Table 2.3 Liz and Joe Gain from Trade
Click on button to go to figure
Click on button to go to figure
Economics in the News
PPF for Kale and Other Goods and Services
Economics in Action
Economics in the News Figure 1
Economic Growth in the United States and Hong Kong
Economics in the News Figure 2
PPF for Steel and Other Goods and Services in 1974 and 2016
Production and Imports of Steel in 2016