Introduction to Financial Statement Analysis
2-1. In a firm’s annual report, five financial statements can be found: the balance sheet, the income statement, the statement of cash flows, the statement of stockholders’ equity, and the statement of comprehensive income. Financial statements in the annual report are required to be audited by a neutral third party, who checks and ensures that the financial statements are prepared according to GAAP (or IFRS) and that the information contained is reliable.
2-2. Users of financial statements include present and potential investors, financial analysts, and other interested outside parties (such as lenders, suppliers and other trade creditors, and customers). Financial managers within the firm also use the financial statements when making financial decisions.
Investors. Investors are concerned with the risk inherent in, and return provided by, their investments. Bondholders use the firm’s financial statements to assess the ability of the company to make its debt payments. Stockholders use the statements to assess the firm’s profitability and ability to make future dividend payments.
Financial analysts. Financial analysts gather financial information, analyze it, and make recommendations. They read financial statements to determine a firm’s value and project future earnings, so that they can provide guidance to businesses and individuals to help them with their investment decisions.
Managers. Managers use financial statements to look at trends in their own business, and to compare their own results with that of competitors.
2-3. Each method will help find the same SEC filings or annual reports. Yahoo! Finance also provides some analysis through charts and key statistics.
2-4.
a. Long-term liabilities would decrease by $20 million, and cash would decrease by the same amount. The book value of equity would be unchanged.
b. Inventory would decrease by $5 million, as would the book value of equity.
c. Long-term assets would increase by $10 million, cash would decrease by $5 million, and long-term liabilities would increase by $5 million. There would be no change to the book value of equity.
d. Accounts receivable would decrease by $3 million, as would the book value of equity.
e. This event would not affect the balance sheet.
f. This event would not affect the balance sheet.
2-5. Global Conglomerate’s book value of equity increased by $1 million from 2017 to 2018. An increase in book value does not necessarily indicate an increase in Global’s share price. The market value of a stock does not depend on the historical cost of the firm’s assets, but on investors’ expectation of the firm’s future performance. There are many events that may affect Global’s future profitability, and hence its share price, that do not show up on the balance sheet.
2-6.
2-7.
a. Qualcomm had $7560 million in cash and $9761 million in short-term investments/marketable securities, leading to a total of $17,321 million.
b. Qualcomm’s total accounts receivable were $1964 million.
c. Qualcomm’s total assets were $50,796 million.
d. Qualcomm’s total liabilities were $19,382 million, of which $9969 million was long-term debt.
e. The book value of Qualcomm’s equity was $31,414 million.
a. At the end of the fiscal year, Costco had cash and cash equivalents of $4801 million.
b. Costco’s total assets were $33,440 million.
c. Costco’s total liabilities were $22,597 million, and it had $6157 million in debt.
d. The book value of Costco’s equity was $10,843 million.
2-8.
a. 2012 Market Capitalization = 10.6 billion shares $17/share = $180.2 billion.
2015 Market Capitalization = 10.0 billion shares $25/share = $250 billion.
The change over the period is: $250 – $180.2 = $69.8 billion.
b. 2012 Market-to-Book = 180.2 / 116 = 1.55.
2015 Market-to-Book = 250 / 128 = 1.95.
The change over the period is: 1.95 – 1.55 = 0.40.
c. 2012 Enterprise Value = $180.2 – 84 + 410 = $506.2 billion.
2015 Enterprise Value = $250 – 85 + 302 = $467 billion.
The change over the period is: $467 – $506.2 = –$39.2 billion.
2-9.
2-10.

a. ANF’s market-to-book ratio = (25.52 × 69.35) / 1390 = 1.27.
GPS’s market-to-book ratio = (41.19 × 421) / 2983 = 5.81.
b. For the market, the outlook of Abercrombie & Fitch is less favourable than that of The Gap. For every dollar of equity invested in ANF, the market values that dollar today at $1.27 versus $5.81 for a dollar invested in GPS. Equity investors are willing to pay relatively less today for shares of ANF than for shares of GPS because they expect GPS to produce superior performance in the future.
a. b.
2-11.
2-12.
a. Revenues in 2019 = 1.15 × 186.7 = $214.705 million. EBIT = 4.50% × 214.705 = $9.66 million (there is no other income).
b. Net Income = EBIT – Interest Expenses – Taxes = (9.66 – 7.7) × (1 – 26%) = $1.45 million.
c. Share price = (P/E Ratio in 2015) × (EPS in 2016) = 25.2 × (1.45 / 3.6) = $10.15.
Note: Differences from spreadsheet solutions due to rounding.
a. Revenues = $116,199 million. Revenue growth = (116,199 / 112,640) – 1 = 3.16%.
b. Operating Income = $3624 million.
c. Average tax rate = 1195 / 3604 = 33.16%.
d. The diluted earnings per share in 2015 was $5.37. The number of shares used in this calculation of diluted EPS was 442.72 million.
2-13.
c. Net Income growth rate differs from revenue growth rate because cost of goods sold and other expenses can move at different rates than revenues. For example, revenues declined in 2013 by 10%, but cost of goods sold only declined by 7%.
2-14. A repurchase does not impact earnings directly, so any change to EPS will come from a reduction in shares outstanding. 2016 shares outstanding = 55 – 4 × 2 = 47 million, EPS .
2.15. The equipment purchase does not impact net income directly. However, the increased depreciation expense and tax savings change net income.
2-16. If Mydeco’s costs and expenses had been the same fraction of revenues in 2013–2016 as they were in 2012, then their net profit margins would have been equal.
2012 net profit margin.
2.17
2-18.
a. A $10 million operating expense would be immediately expensed, increasing operating expenses by $10 million. This would lead to a reduction in taxes of 35% × $10 million = $3.5 million. Thus, earnings would decline by 10 – 3.5 = $6.5 million. There would be no effect on next year’s earnings.
b. Capital expenses do not affect earnings directly. However, the depreciation of $2 million would appear each year as an operating expense. With a reduction in taxes of 2 × 35% = $0.7 million, earnings would be lowered by 2 – 0.7 = $1.3 million for each of the next five years.
a. If Quisco develops the product in-house, its earnings would fall by $500 × (1 – 35%) = $325 million. With no change to the number of shares outstanding, its EPS would decrease by to $0.75. (Assume the new product would not change this year’s revenues.)
b. If Quisco acquires the technology for $900 million worth of its stock, it will issue $900 / 18 = 50 million new shares. Since earnings without this transaction are $0.80 × 6.5 billion = $5.2 billion, its EPS with the purchase is.
c. Acquiring the technology would have a smaller impact on earnings, but this method is not cheaper. Developing it in-house is less costly and provides an immediate tax benefit. The earnings impact is not a good measure of the expense. In addition, note that because the acquisition permanently increases the number of shares outstanding, it will reduce Quisco’s earnings per share in future years as well.
2-19.
2-20.
a. Net cash provided by operating activities was $4285 million in fiscal year 2015.
b. Costco’s depreciation and amortization expenses were $1127 million.
c. Net cash used in capital expenditures for property and equipment was $2393 million.
d. Costco raised nothing from the sale of shares of its stock, while it spent $481 million on the purchase of common stock. Thus, Costco raised –$481 million from the sale of its shares of stock (net of any purchases).
a. Total cash flow from operations = 48.5 + 50.5 + 47.8 + 46.6 + 54 = $247.4 million.
b. Fraction of total cash flow spent on capital expenditures = (25 + 25 + 100 + 75 + 40) / 247.4 = 107.1%.
c. Fraction of total cash flow spent on dividends = (5.4 × 4 + 6.5) / 247.4 = 11.4%.
d. Retained earnings = Net Income – Dividends = (18 + 3 + 6.3 + 12.7 +
million.
2-21.
2-22.
a. Mydeco’s net income was lowest in 2013 (net income was $3 million).
b. Mydeco reduced its cash reserves in 2015 (cash was reduced from $86.3 million to $77.5 million).
c. Mydeco needed to reduce cash (and also issue debt) to pay for large capital expenditures incurred in 2014 and 2015. In addition, even though net income was reasonably high, cash from operations was at the lowest amount in the five-year period due to a reduction in accounts receivable and inventories.
a. 2011 Cash = 2012 Cash – 2012 Change in Cash = 48.8 – 18.1 = $30.7 million.
b. 2011 Accounts Receivable = 88.6 + 3.9 = $92.5 million. 2011 Inventory = 33.7 – 2.9 = 30.8 million
c. 2011 Total Liabilities = 525.4 – 2.2 = $523.2 million.
d. 2011 property, plant, and equipment = 2012 property, plant, and equipment – 2012 capital expenditures + 2012 depreciation = 245.3 – 25 + 27.3 = $247.6 million
2-23. A firm can have positive net income but still run out of cash. For example, to expand its current production, a profitable company may spend more on investment activities than it generates from operating activities and financing activities. Net cash flow for that period would be negative, although its net income is positive. It could also run out of cash if it spends a lot on financing activities, perhaps by paying off other maturing long-term debt, repurchasing shares, or paying dividends.
2-24.
2-25.
a. Revenues: increase by $5 million
b. Earnings: increase by $3 million
c. Receivables: increase by $4 million
d. Inventory: decrease by $2 million
e. Cash: increase by $3 million (earnings) – $4 million (receivables) + $2 million (inventory) = $1 million (cash).
a. The depreciation expense would have to be deducted from the earnings for each of the next four years. After taxes, this would lead to a decline of 10 × (1 – 40%) = $6 million each year for the next four years.
b. Cash flow for the next four years will be computed by subtracting $36 million (–6 + 10 – 40) this year, and adding $4 million (–6 +10) for the three following years.
2-26.
a. Retained earnings = Net Income – Dividends Paid
b. 2011 stockholders’ equity = 2012 stockholders’ equity – 2012 retained earnings = 252.7 – 12.6 = $240.1 million.
2-27.
a. Costco opened 11 stores outside of the U.S. in 2015.
b. Costco leases land and/or buildings at warehouses and certain other office and distribution facilities. The minimum lease payments due in 2016 are $211 million.
c. Costco had a worldwide member renewal rate of 88% for 2015. 34,000 / 81,300 = 42% of Costco cardholders had Gold Star memberships in 2015.
d. 16% of Costco’s 2015 sales came from gas stations, pharmacy, food court, and optical. 11% of Costco’s 2015 sales came from apparel and small appliances.
2-28.
2-29.
a.
2-30.
b. None of the margins improved from 2012 to 2016.
2-31.
a. Walmart’s gross margin = 120.57 / 485.65 = 24.83%. Costco’s gross margin = 15.13 / 116.20 = 13.02%.
b. Walmart’s net margin = 16.36 / 485.65 = 3.37%. Costco’s net margin = 2.38 / 116.20 = 2.05%.
c. Walmart was more profitable in 2015.
a. Apple’s current ratio = 89.38 / 80.61 = 1.11.
b. Apple’s quick ratio = (41.60 + 35.89) / 80.61 = 0.96.
c. Apple’s cash ratio = 41.60 / 80.61 = 0.52.
d. Apple generally has more liquid assets than HPQ relative to current liabilities, with the exception of a slightly lower current ratio due to a lower proportion of inventory.
a. 2012 accounts receivable days. 2016 accounts
2-32
b. 2012 inventory days.
2016 inventory days.
c. Between 2012 and 2016, Mydeco improved its working capital management by reducing both accounts receivable days and inventory days.
2-33.
a. 2012 accounts payable days .
2016 accounts payable days .
b. Accounts payable days increased from 2012 to 2016, which improved the cash position of Mydeco.
a. Mydeco increased its debt from $500 million in 2012 to $600 million in 2016 (by $100 million).
b. 2012 EBITDA/Interest coverage ratio .
2016 EBITDA/Interest coverage ratio .
Mydeco’s coverage ratio fell below 2 in 2013, when it was 1.96.
c. Overall, Mydeco’s ability to meet its interest payments improved over this period, although it experienced a slight dip in 2013.
2-34.
a.
b.
c.
2-35.
2-36.
a. 2012 book debt-equity ratio = 410 / 116 = 3.53.
2015 book debt-equity ratio = 302 / 128 = 2.36
b. 2012 market debt-equity ratio = 410 / (17 × 10.6) = 2.28.
2015 market debt-equity ratio = 302 / (25 × 10) = 1.21.
a. Firm A:
Firm B: .
b. Firm A:
Firm B:
c. Firm A: .
Firm B:
d. Firm B has a lower coverage ratio and will have slightly more difficulty meeting its debt obligations than Firm A.
2-37.
a.
The PE ratio was highest in 2013.
b.
The Enterprise Value to EBITDA ratio was the highest in 2015.
c. The different time patterns are caused by the rise in debt in 2015 and 2016 that increased the enterprise value of Mydeco and reduced the earnings per share due to increased interest expense. In addition, the very small value of earnings per share in 2013 increased the PE ratio despite the decrease in price.
2-38.
a. Market capitalization-to-revenue ratio:
= 24.8 / 38.9 = 0.64 for United Airlines.
= 28.8 / 18.6 = 1.55 for Southwest Airlines.
b. Enterprise value-to-revenue ratio:
= (24.8 – 5.5 + 12.8) / 38.9 = 0.83 for United Airlines.
= (28.8 – 2.9 + 2.7) / 18.6 = 1.54 for Southwest Airlines.
c. The market capitalization-to-revenue ratios cannot be meaningfully compared when the firms have different amounts of leverage, as market capitalization measures only the value of the firm’s equity. The enterprise value-to-revenue ratio is, therefore, more useful when the firms’ leverage values are quite different, as it is here.
2-39. a. b.
2-40.
2-41.
c. ROE is more volatile. Mydeco’s debt level causes a large portion of EBIT to go to interest expense. This magnifies the volatility of earnings left over for shareholders through net income. ROA adjusts net income by the interest expense, and thus is less sensitive to leverage.
Here we have calculated ROA using Net Income + Interest Expense, to reflect the total earnings of both equity and debt investors in the firm. ROA is sometimes calculated using only Net Income, or Net Income + After-tax Interest Expense. See fn. 14 in Chapter 2.
Mydeco was able to improve its ROIC in 2016 relative to 2012.
a. Costco’s ROE (DuPont) = 2.05% × 3.48 × 3.15 = 22.47%.
b. Costco’s new asset turnover = 23.47% / (2.05% × 3.15) = 3.63 or an increase of 3.63 – 3.48 = 0.15.
c. Costco’s new asset turnover = 22.47% / (1.05% × 3.15) = 6.79 or an increase of 6.79 – 3.48 = 3.31. Year20122013201420152016
2-42.
2-43.
a. Walmart’s ROE = 16.36 / 81.39 = 20.10%.
Walmart’s net profit margin = 16.36 / 484.65 = 3.38%.
Walmart’s asset turnover = 484.65 / 203.49 = 2.38.
Walmart’s equity multiplier = 203.49 / 81.39 = 2.50.
Walmart’s ROE (DuPont) = 3.38% × 2.38 × 2.50 = 20.11% (difference due to rounding).
b. Compared to Costco, Walmart has a superior profit margin, but a lower asset turnover and a lower equity multiplier (which could represent less leverage). Despite the higher profit margin, Walmart has a smaller ROE that is driven by its lower asset turnover and leverage.
a. Current ROE = 3.5 × 1.8 × 44 / 18 = 15.4%.
b. New ROE after increase in profit margin = 4 × 1.8 × 44 / 18 = 17.6%.
c. New ROE after increase in revenues = 4 × (1.8 × 1.2) × 44 / 18 = 21.1%.
2-44.
a. KPMG LLP certified Costco’s financial statements.
b. W. Craig Jelinek, President and CEO, and Richard A. Galanti, Executive Vice-President and CFO, certified Costco’s financial statements.
2-45. By reclassifying $3.85 billion operating expenses as capital expenditures, WorldCom increased its net income but lowered its cash flow for that period. If a firm could legitimately choose how to classify an expense, expensing as much as possible in a profitable period rather than capitalizing will save more on taxes, which results in higher cash flows, and thus is better for the firm’s investors.
Chapter 2 Introduction to Financial Statement Analysis
I. Learning Objectives
2-1 Define the periodic reports required by the provincial securities commissions and the SEC; describe where they can be found (SEDAR); briefly describe GAAP and the auditor’s role along with listing the major financial statements required under IFRS for publicly traded firms; compare IFRS to US GAAP.
2-2 Describe the balance sheet and define depreciation, book value, and goodwill. Discuss the difference between book value of shareholders’ equity and market value of shareholders’ equity; explain why the two numbers are almost never the same Compute market-to-book and enterprise value.
2-3 Describe the components of the Income Statement and compute the following measures: gross profit, operating expenses, operating income, EBIT and EPS
2-4 Distinguish between cash flow, as reported on the statement of cash flows, and accrual-based income, as reported on the income statement. Describe the three sections of the statement of cash flows: Operating, Investment and Financing activities.
2-5 Explain the importance of the notes to the financial statements.
2-6 Perform ratio analysis and describe each ratio’s usefulness in assessing firm performance: gross margin, operating margin, net profit margin, current and cash ratios, accounts receivable and payable days, inventory turnover, asset turnover and working capital days, EBITDA, debtequity, debt-to-capital, net debt, debt-to-enterprise, P/E, return on equity, return on assets, return on invested capital and the DuPont ROE
2-7 List and describe the financial scandals described in the text, along with the new legislation designed to reduce that type of fraud.
II. Chapter Overview
This chapter reviews the five main financial statements and discusses some useful financial ratios. The chapter closes with a look at some recent financial scandals.
2.1 The Disclosure of Financial Information
This section briefly describes the interim financial reports required by provincial securities commissions and the SEC. It provides the SEDAR web address to access these reports. It defines GAAP, the role of an auditor and the five statements IFRS requires public companies to produce: a balance sheet, statement of comprehensive income (income statement), statement of cash flows, the statement of changes in equity and notes including accounting policy. It includes a summary of steps taken toward standardizing financial statements across countries via International Financial Reporting Standards (IFRS) while comparing US GAAP to IFRS.
2.2 The Balance Sheet
The balance sheet, or statement of financial position, lists the firm’s assets and liabilities. This section describes current assets, long-term assets, current liabilities and long-term liabilities, and shareholders’ equity and provides the major account names within each component. The authors emphasize the difference
between book value of equity and market capitalization and use Example 2.1 to demonstrate. Next, they introduce us to enterprise value and show us how to compute it in Example 2.2.
2.3 The Income Statement
The income statement lists the firm’s revenues and expenses over a period of time. The earnings calculations can be broken apart as we move down the income statement into: gross profit, operating expenses, earnings before interest and taxes (EBIT), and earnings before taxes and net income. Earnings per share (and diluted earnings per share) are often calculated to assess the size of net income relative to that of similar firms.
2.4 The Statement of Cash Flows
The statement of cash flows converts accrual-based income into cash flow by utilizing the income statement and balance sheet. Cash flows are separated into operating activities, investment activities, and financing activities. Example 2.3 shows the impact of depreciation on cash flows.
2.5 Other Financial Statement Information
The management discussion and analysis (MD&A) section of the financial statements provides management’s interpretation of the planned activities of the firm. The statement of shareholders’ equity provides detailed information about additions to or reductions in the shareholders’ equity accounts. The statement of comprehensive income combines the income statement information with other pertinent information not reported there. Notes to the financial statements are an integral part of the statements as they provide details on subsidiaries and product line, stock-based compensation plans, types of debt including leases and principal payments, acquisitions, taxes and risk management, all of which are necessary for correct interpret of the statements. Example 2.4 uses the sales by business segment note to report sales by product category and find the sales unit with the highest growth.
2.6 Financial Statement Analysis
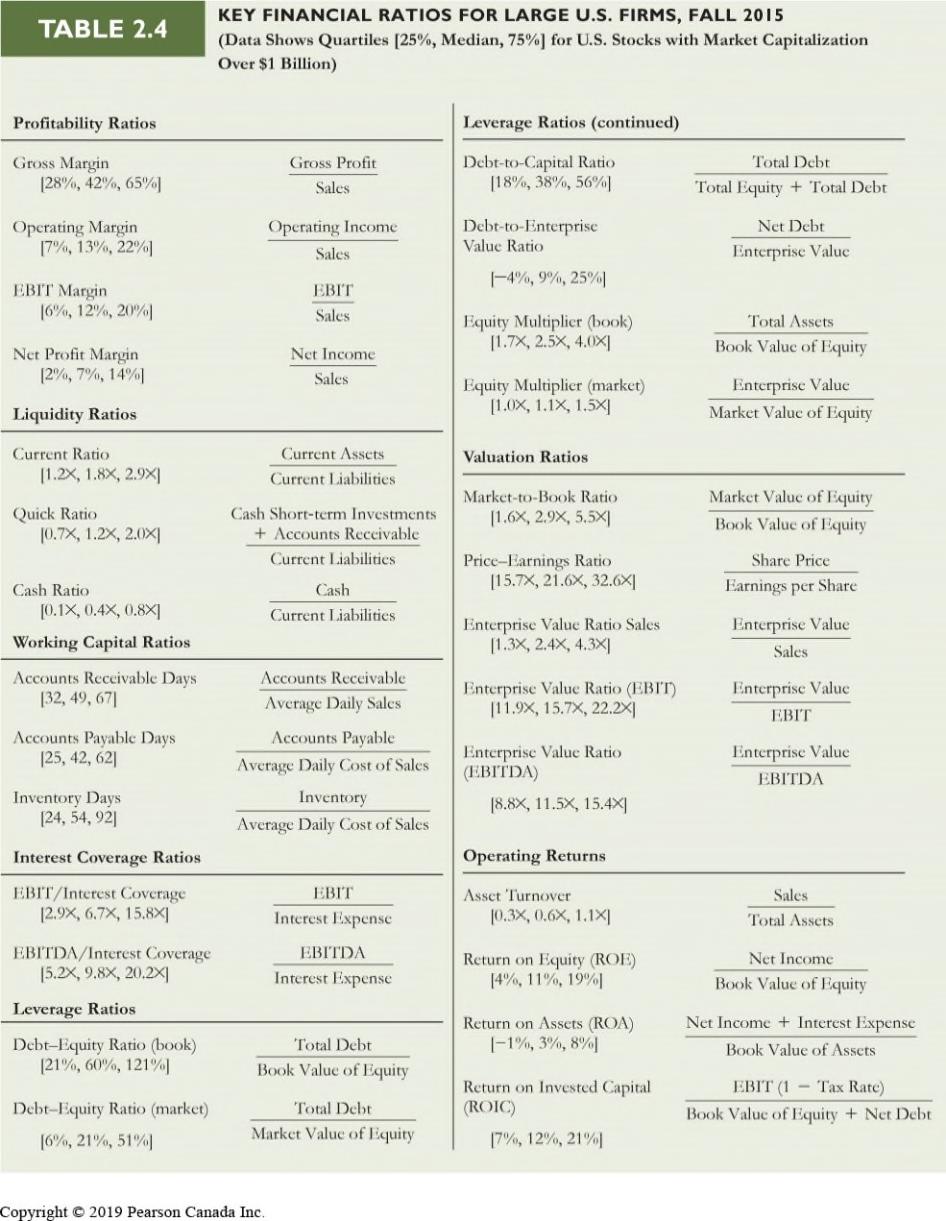
Investors use financial statements to find out how a company has changed over time or how it compares with others in its industry. Ratios, segmented into categories of Profitability, Liquidity, Working Capital, Interest Coverage, Leverage, Valuation and Operating Returns help investors reveal the state of the company.
Profitability ratios, such as gross margin, operating margin and net profit margin, are often used to measure the fraction of revenue available to common shareholders. Examples of ratios that use both income statement and balance sheet items are asset turnover and working capital ratios, such as accounts receivable days (or average collection period) and accounts payable days. EBITDA is often used to express how much cash a firm generates from operations while leverage ratios such as interest coverage, which is also a mixed ratio, are used to reflect the relationship between earnings and interest payments. Investment returns are measured by return on equity (ROE) or return on assets, although both these measures are flawed because of their reliance on book value measures. The Dupont identity expresses ROE in terms of the firm’s profitability, efficiency and leverage. It can be restated as the return on assets times the equity multiplier. Example 2.5 and 2.6 examine liquidity and interest coverage, respectively while Example 2.7 computes profitability and valuation ratios, including the price-earnings ratio and Example 2.9 uses the Dupont identity to compare the ROE of Wal-Mart to Target.
2.7 Accounting Manipulation
Abuse of financial reporting rules does occur, Enron and WorldCom being two of the most notorious examples from the past decade. Enron sold assets at inflated prices to other firms, together with a promise to buy back assets at an even higher future price. Worldcom reclassified $3.85 billion in expenses as longterm investment. The U.S. Sarbanes-Oxley Act, passed in 2002, holds CFOs and CEOs accountable for the firm’s financial statements. Canadian regulators adopted similar measures in 2005.
III. MyLab Finance Activities
IV. Spreadsheet Solutions in Excel
The following problems for Chapter 2 have spreadsheet versions of the problem solutions available: 2-10, 2-11, 2-13, 2-15, 2-16, 2-17 and 2-20. An excel suggested solution can also be found for the Data Case, but of course these solutions are time dependent on the time of publication. These values are not likely to match the real time prices students will use when they perform their Data Case projects.
The excel solution spreadsheets can be downloaded from the Pearson online catalogue at http://catalogue.pearsoned.ca/. If you do not have a login and password for this website, contact your Pearson sales representative.
Corporate Finance

Chapter 2 Introduction to Financial Statement Analysis
Learning Objectives (1 of 4)
1. Define the periodic reports required by the provincial securities commissions and the SEC; briefly describe GAAP and the auditor’s role along with listing the five major financial statements required under IFRS for publicly traded firms; compare IFRS to US GAAP.
2. Define depreciation, book value, and goodwill.
3. Discuss the difference between book value of shareholders’ equity and market value of shareholders’ equity; explain why the two numbers are almost never the same.
Learning Objectives
(2 of 4)
4. Compute the following measures, and describe their usefulness in assessing firm performance: the market-to-book ratio, debt-equity ratio, the enterprise value, earnings per share, operating margin, EBIT, net profit margin, accounts receivable days, accounts payable days, EBITDA, interest coverage ratio, return on equity, return on assets and price-earnings ratio.
Learning
Objectives (3 of 4)
5. Describe the importance of ensuring that valuation ratios are consistent with one another in terms of the inclusion of debt in the numerator and the denominator.
6. Distinguish between cash flow, as reported on the statement of cash flows, and accrual-based income, as reported on the income statement; discuss the importance of cash flows to investors, relative to accrual-based income.
7. Explain the importance of the notes to the financial statements.
Learning Objectives
(4 of 4)
8. List and describe the financial scandals described in the text, along with the new legislation designed to reduce that type of fraud.
2.1 The Disclosure of Financial Information
(1 of 3)
• Financial Statements
– Firm-issued accounting reports with past performance information
– The reporting process is centralized nationally through the System for Electronic Document Analysis and Retrieval (SEDAR)
– Filed with their provincial securities commission Interim financial statements
Quarterly
Annual reports
Annual
2.1 The Disclosure of Financial Information
(2 of 3)
• Preparation of Financial Statements
– Generally Accepted Accounting Principles (GAAP)
– Auditor
Neutral third party that checks a firm’s financial statements
• Types of Financial Statements under IFRS
– Every publically traded company is required to produce 5 types of financial statements
(3 of 3) • Types of Financial Statements – Balance Sheet – Statement of Comprehensive Income (includes Income Statement) – Statement of Cash Flows – Statement of Changes in Equity – Notes Including Accounting Policies
2.2 The Balance Sheet (1 of 8)
• In IFRS it is referred to as the Statement of Financial Position
• A snapshot in time of the firm’s financial position
• The Balance Sheet Identity: Assets = Liabilities + Shareholders
2.2 The Balance Sheet (2 of 8)
• Assets – How the firm uses its capital
– What the company owns
• Liabilities
– What the company owes
• Shareholders’ Equity
– The difference between the value of the firm’s assets and liabilities
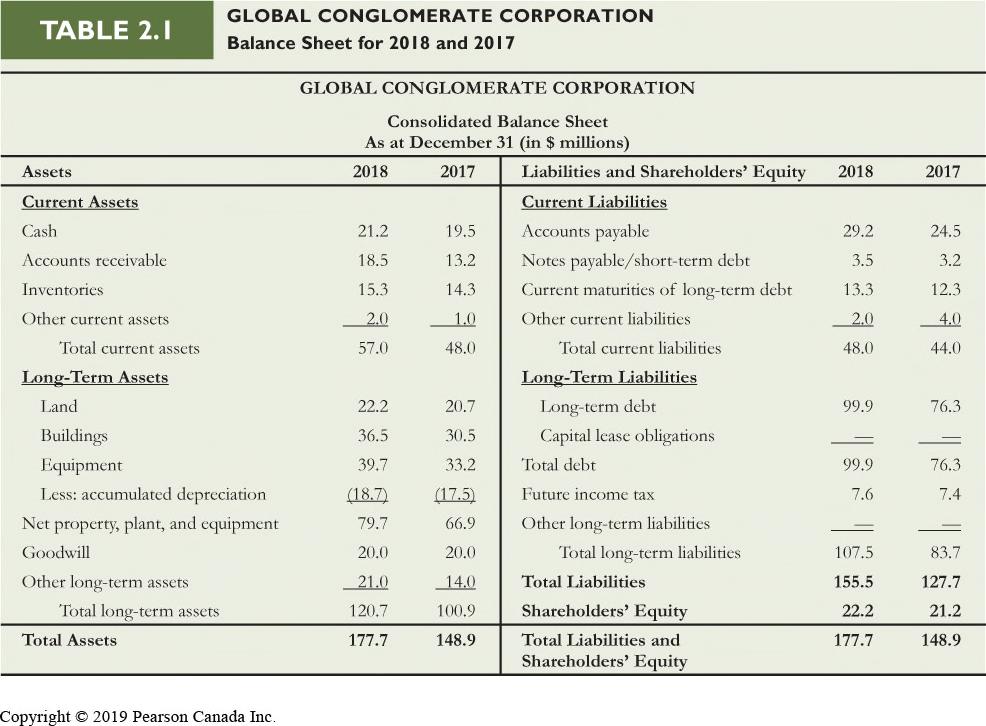
Table 2.1 Global Conglomerate Corporation
2.2 The Balance Sheet (3 of 8)
• Assets
– Current Assets: Cash or could be converted into cash within one year
Cash
Marketable securities
Accounts receivable
Inventories
Other current Assets – Pre-paid expenses
2.2 The Balance Sheet (4 of 8) • Assets – Long-Term Assets
Net property, plant, & equipment – Book Value – Depreciation Goodwill – Write-down Other long-term assets
2.2 The Balance Sheet (5 of 8)
• Liabilities – Current Liabilities: Due to be paid within the next year
Accounts payable
Notes payable
Short-term debt
Current maturities of long-term debt
Other current liabilities
Taxes payable
Wages payable
2.2 The Balance Sheet (6 of 8)
• Liabilities – Long-term liabilities Long-term debt
Capital leases
Future income tax
2.2 The Balance Sheet (7 of 8)
• Net Working Capital – Current assets –Current liabilities
2.2 The Balance Sheet (8 of 8)
• Shareholders’ Equity
– Book Value of Equity
Book Value of Assets –Book Value of Liabilities
– Could possibly be negative
– Market Value of Equity (Market Capitalization)
Market price per share ×number of shares outstanding
– Cannot be negative
Example 2.1 Market Versus Book Value
Problem
If Global has 3.6 million shares outstanding, and these shares are trading for a price of $14 per share, what is Global’s market capitalization? How does the market capitalization compare to Global’s book value of equity in 2018?
Solution
Global’smarket capitalization is (3.6 million shares) ×($14/share) = $50.4 million. This market capitalization is significantly higher than Global’s book value of equity of $22.2 million. Thus, investors are willing to pay 50.4/22.2 = 2.27 times the amount Global’s shares are “worth” according to their book value.
Example 2.2 Computing Enterprise Value
Problem
On December 31, 2015, BCE Inc.’s stock price was $53.46, and it had 866 million shares outstanding, a market-to-book ratio of 2.67, total debt of $30,664 million, and cash of $613 million. What was BCE’s market capitalization? How does that compare to its book value of equity? What was BCE’s enterprise value?
Solution
BCE had a market capitalization of $53.46/share ×866 million shares = $46,296.36 million. We divide the market value of equity by BCE’s market-to-book ratio to calculate BCE’s book value of equity as $46,296.36 million/2.67 = $17,339.46 million; it is significantly lower than the market value. BCE’s enterprise value was $46,296.36 million + $30,664 million − $613 million = $76,347.36 million.
2.3 The Income Statement
• In IFRS it is referred to as the Statement of Financial Performance
• Lists the firm’s revenues and expenses over a period of time
• The income statement is also called a statement of earnings, a statement of operations, or a profit and loss statement
• Net income or earnings is the “bottom”line of the income statement
Table 2.2 Global Conglomerate Corporation
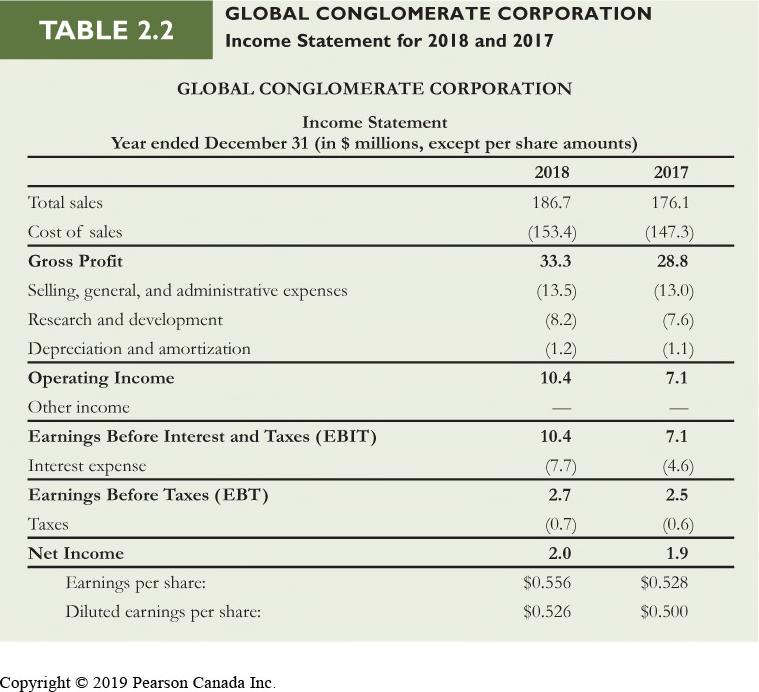
2.3 The Income Statement (1 of 2) • Earnings Calculations: – Gross Profit – Operating Expenses – Earnings Before Interest and Taxes – Earnings Before Taxes and Net Income
2.3 The Income Statement (2 of 2) • Earnings per Share
Diluted EPS
2.4 The Statement of Cash Flows (1 of 4)
• Net Income typically does NOT equal the amount of Cash the firm has earned
– Non-Cash Expenses
Depreciation and amortization
– Uses of Cash not on the Income Statement
Investment in Property, plant, and equipment
The Statement of
Flows (2 of 4) • Three Sections – Operating activity – Investment activity – Financing activity
Table 2.3 Global Conglomerate Corporation
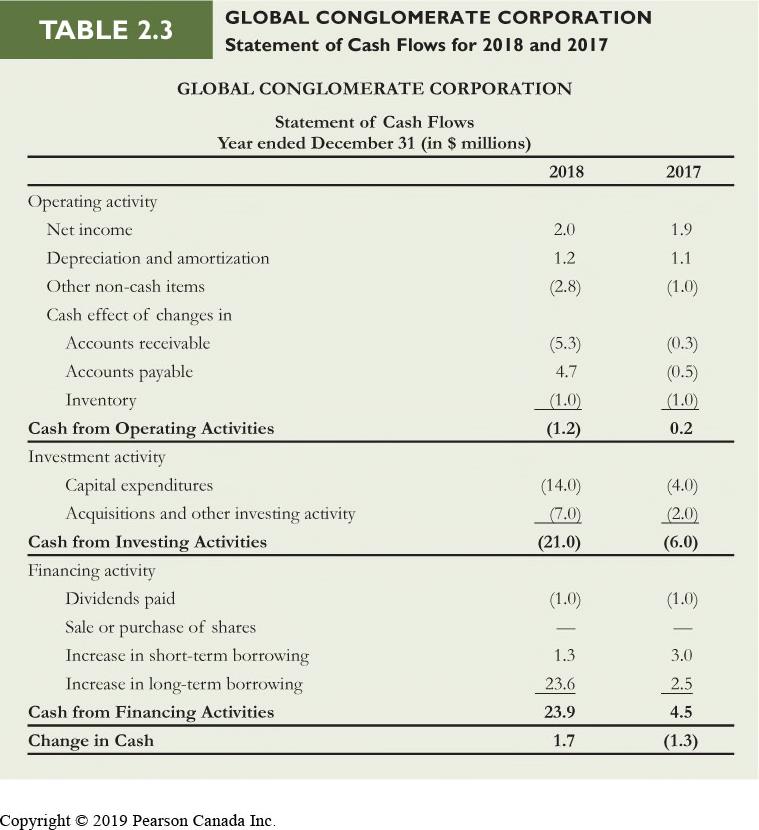
2.4 The Statement of Cash Flows (3 of 4) • Operating Activity – Adjusts net income by all non-cash items related to operating activities and changes in net working capital
The Statement of Cash Flows (4 of 4)
Investing Activity – Capital expenditures – Buying or selling marketable securities
Financing Activity – Changes in borrowings – Payment of dividends
Retained Earnings for the period
Example 2.3 The Impact of Depreciation on Cash Flow
(1 of 2)
Problem Suppose Global had an additional $1 million depreciation expense in 2018. If Global’s tax rate on pre-tax income is 26%, what would be the impact of this expense on Global’s earnings? How would it impact Global’s cash at the end of the year?
Solution
Depreciation is an operating expense, so Global’s operating income, EBIT, and pre-tax income would fall by $1 million. This decrease in pre-tax income would reduce Global’s tax bill by 26% ×$1 million = $0.26 million.Therefore, net income would fall by $1 million − $0.26 million = $0.74 million.
Example 2.3 The Impact of Depreciation on Cash Flow
(2 of 2)
Solution
On the statement of cash flows, net income would fall by $0.74 million, but we would add back the additional depreciation of $1 million because it is not a cash expense. Thus, cash from operating activities would rise by −$0.74 million + $1 million = $0.26 million.
Thus, Global’s cash balance at the end of the year would increase by $0.26 million, the amount of the tax savings that resulted from the additional depreciation deduction.
Example 2.4 Sales by Business Segment
Problem
In the notes to its financial statements, BCE Inc. (BCE) reported the following sales revenues by business segments and in total ($ millions):
Example 2.4 Sales by Business Segment (2
of 3)
Consider the three segments: Bell Wireless, Bell Wireline, and Bell Media. Which of these segments showed the highest percentage growth, and how does this compare to the overall growth of BCE? If BCE had the same percentage growth by segment in 2016 as occurred in 2015, what would each of these three segments’ revenues have been in 2016? Would you expect BCE’s overall growth to have been the same in 2016 as it was in 2015?
Solution
The percentage growth in sales in Bell Wireless was (6,876 − 6,327) /6,327=8.68%. The growth in sales in Bell Wireline was −0.54% and in Bell Media was 1.26%. Bell Wireless was the segment that showed the highest growth, significantly higher than the 2.24% overall growth of BCE.
Example 2.4 Sales by Business Segment (3 of 3)
If the growth rates in the three segments continued for another year, 2016 operating revenues in Bell Wireless would have been 6,876 million ×[1 + (0.0868)] = $7,473 million. The other segments would have been $12,192 million and $3,011 million, respectively. We would not expect BCE’s overall growth to still be 2.24% for 2016 since Bell Wireless operating revenue would become a larger proportion of BCE total operating revenue and thus drive up the weighted average growth rate for BCE as a firm. We can compare BCE’s total 2015 operating revenues, $21,514 million, to the sum of the projected 2016 segment amounts, $7,473 million + $12,192 million + $3,011 million = $22,676 million. If the segments continued to grow as they did in 2015, as in our projections, then BCE’s total operating revenues would actually have grown by (22,676 − 21,514) /21,514 = 5.4%.
2.6 Financial
Statement Analysis (1 of 8) – Profitability Ratios
Gross Margin Gross Profit
Gross Margin= Sales
Operating Margin
Operating Income
Operating Margin = Sales
Net Profit Margin Net Income
Net Profit Margin = Sales
2.6 Financial Statement Analysis (2
of 8)
– Liquidity Ratios
Current Ratio
Current Assets
Current Ratio = Current Liabilities
Cash Ratio Cash Cash Ratio = Current Liabilities
Example 2.5 Computing Liquidity Ratios
Problem
Calculate Global’s quick ratio and cash ratio. Based on these measures, how did its liquidity change between 2017 and 2018?
Solution
In 2017, Global’s quick ratio was (19.5 + 13.2)/44 = 0.74 and its cash ratio was 19.5/44 = 0.44. In 2018, these ratios were 0.83 and 21.2/48 = 0.44, respectively. Thus, Global’s cash ratio remained stable over this period, while its quick ratio improved slightly. But although these liquidity measures have not deteriorated, a more worrisome indicator for investors regarding Global’s liquidity might be its ongoing negative cash flows from operating and investing activities, shown in the statement of cash flows.
2.6 Financial
Statement Analysis (3 of 8)
– Working Capital Ratios
Account Receivable days
Accounts Receivable
Accounts Receivable Days= Average Daily Sales
Account Payable days
Accounts Payable
Accounts Payable Days = Average Daily Cost of Sales
Inventory Turnover
Annual Cost of Sales
Inventory Turnover = Inventory
Financial Statement Analysis (4 of 8)
– Interest Coverage Ratios
EBITDA
EBITDA = EBIT + Depreciation and Amortization
Example 2.6 Computing Interest Coverage Ratios
Problem
Assess Global’s ability to meet its interest obligations by calculating interest coverage ratios using both EBIT and EBITDA.
Solution
– Leverage Ratios
Debt-Equity ratio
Total Debt
Debt-EquityRatio =Total Equity
Debt-to-Capital ratio
Total Debt
Debt-to-Capital Ratio =Total Equity+ Total Debt
Net Debt Net DebtTotal DebtExcess Cash & Short-term Investments
Debt-to-Enterprise Value Ratio Net Debt
Debt-to-Enterprise Value Ratio = Market Value of Equity + Net Debt Net Debt = EnterpriseValue
Example 2.7 Computing Profitability and
Valuation Ratios (1 of 3)
Problem Consider the following data from December 31, 2015, for CP and CN Rail ($ millions):
Compare CP’s and CN’s operating margins, net profit margins, P/E
and the ratio of enterprise value to operating income and sales.
Example 2.7 Computing Profitability and Valuation Ratios (2 of 3)
Solution
CP had an operating margin of 2,688/6,712 = 40.05%, a net profit margin of 1,352/6,712 = 20.14%, and a P/E ratio of 27,040/1,352 = 20. Its enterprise value was $27,040 million + $8,927 million − $650 million = $35,317 million, which has a ratio of 35,317/2,688 = 13.14 to operating income and 35,317/6,712 = 5.26 to revenues.
CN had an operating margin of 5,266/12,611 = 41.76%, a net profit margin of 3,538/12,611 = 28.05%, and a P/E ratio of 60,890/3,538 = 17.21. Its enterprise value was $60,890 million + $8,985 million − $153 million = $69,722 million, which has a ratio of 69,722/5,266 = 13.24 to operating income and 69,722/12,611 = 5.53 to sales.
Example 2.7 Computing Profitability and Valuation Ratios
(3 of 3)
CP’s net profit margin was somewhat lower than CN’s, explaining the difference in the ratio of enterprise value to sales.
CP’s P/E ratio is higher than CN’s; this may indicate that CP is relatively overvalued or that market participants expect that CP has more room for improvement in earnings than does CN.
Statement Analysis (7 of 8) – Operating Returns
ROE
Net Income
Return on Equity = Book Value of Equity
ROA
Net Income + Interest Expense
Return on Assets = Book Value of Assets
Return on Invested Capital
EBIT(1tax rate)
Return on Invested Capital Book Value of EquityNet Debt
2.6 Financial Statement Analysis (8
Example 2.9 Determinants of Roe (1 of 3)
Problem
For the year ended January 2015, Walmart (WMT) had sales of $485.7 billion, net income of $16.2 billion, assets of $203.7 billion, and a book value of equity of $85.9 billion. For the same period, Target (TGT) had sales of $73.1 billion, net income of $2.5 billion, total assets of $41.4 billion, and a book value of equity of $14 billion. Compare the profitability, asset turnover, equity multipliers, and return on equity of these firms during this period. If Target had been able to match Walmart’s asset turnover during this period, what would its ROE have been?
Solution Walmart’s net profit margin was 16.2/485.7 = 3.34%, which was just below Target’s net profit margin of 2.5/73.1 = 3.42%.
Example 2.9 Determinants of Roe (2 of 3)
On the other hand, Walmart used its assets more efficiently, with an asset turnover of 485.7/203.7 = 2.38, compared to only 73.1/41.4 = 1.77 for Target. Finally, Target had greater leverage (in terms of book value), with an equity multiplier of 41.4/14 = 2.96, relative to Walmart’s equity multiplier of 203.7/85.9 = 2.37. Next, let’s compute the ROE of each firm directly, and using the DuPont Identity:
Example 2.9 Determinants of Roe (3 of 3)
Note that due to its lower asset turnover, Target had a lower ROE than Walmart despite its higher net profit margin and leverage. If Target had been able to match Walmart’s asset turnover, its ROE would have been significantly higher: 3.42% ×2.38 ×2.96 = 24.1%.
2.7 Financial Reporting in Practice
• Enron • WorldCom
• Sarbanes-Oxley Act (SOX)
• Canadian regulators adopted similar measurement that came into effect in 2005
• Bernard Madoff’s Ponzi Scheme
Questions?