
SHORT ANSWER. Write the word or phrase that best completes each statement or answers the question.
Provide an appropriate response. Round relative frequencies to thousandths.
1) Scott Tarnowski owns a pet grooming shop. His prices for grooming dogs are based on the size of the dog. His records from last year are summarized below. Construct a frequency distribution and a relative frequency distribution. Show the percentage represented by each relative frequency.
2) The results of a survey about a recent judicial appointment are given in the table below. Construct a relative frequency distribution.
3) The preschool children at Elmwood Elementary School were asked to name their favorite color. The results are listed below. Construct a frequency distribution and a relative frequency distribution.
MULTIPLE CHOICE. Choose the one alternative that best completes the statement or answers the question.
4) True or False: The sum of all the relative frequencies of a distribution will always add up to 1.
A) True B) False Answer: B
5) True or False: Relative frequency is the proportion (or percent) of observations within a category and is found using the formula: relative frequency = sum of all frequencies frequency .
A) False B) True Answer: A
The bar graph shows the number of tickets sold each week by the garden club for their annual flower show.
6) During which week was the most number of tickets sold? A) week 1 B) week 4 C) week 5 D) week 2 Answer: B
7) During which week was the fewest number of tickets sold?
A) week 6 B) week 2 C) week 5 D) week 4 Answer: B
8) Approximately how many tickets were sold during week 6 ? A) 11 tickets B) 19 tickets C) 30 tickets D) 46 tickets Answer: B
Provide an appropriate response.
9) The payroll amounts for 26 major- league baseball teams are shown below. Aprroximately what percentage of the payrolls were in the $30 - $40 million range? Round to the nearest whole percent.
Answer: A
10) Retailers are always interested in determining why a customer selected their store to make a purchase. A sporting goods retailer conducted a customer survey to determine why its customers shopped at the store. The results are shown below. What percentage of the customers responded that the merchandise was the reason they shopped at the store? Round to the nearest whole percent
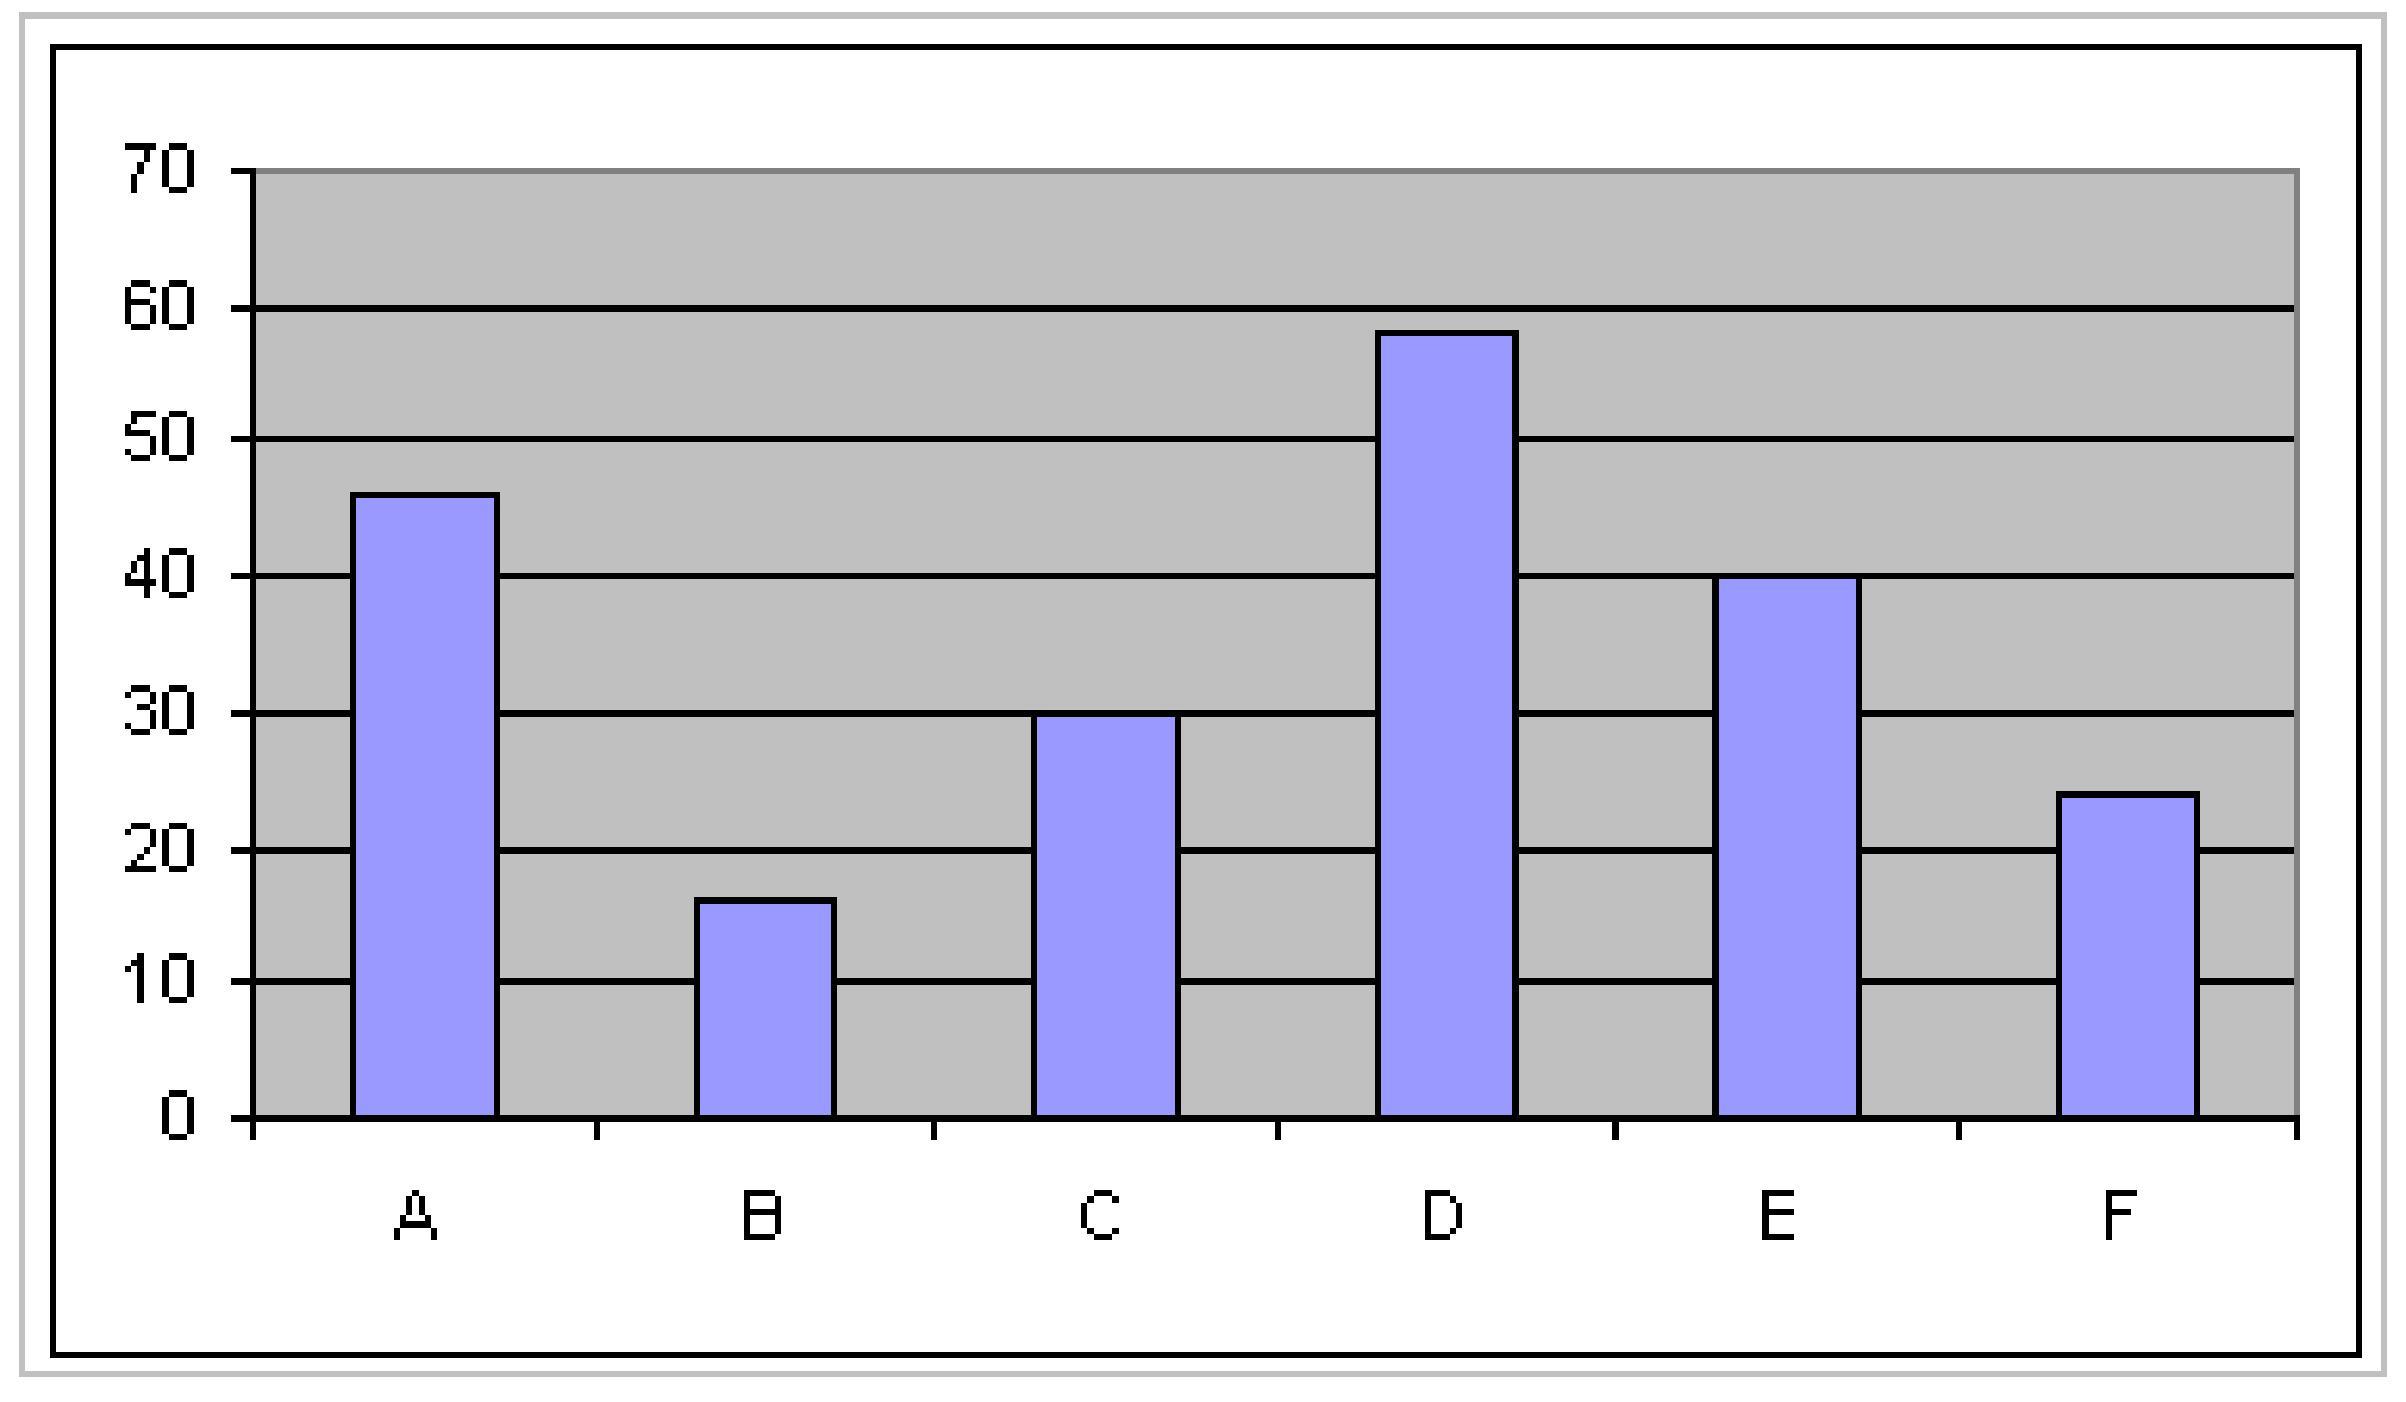
11) The bar graph below shows the political party affiliation of 1000 registered U.S. voters. What percentage of the 1000 registered U.S. voters belonged to one of the traditional two parties (Democratic and Republican)?
A) 40%
Answer: D
B) 25% C) 35% D) 75%
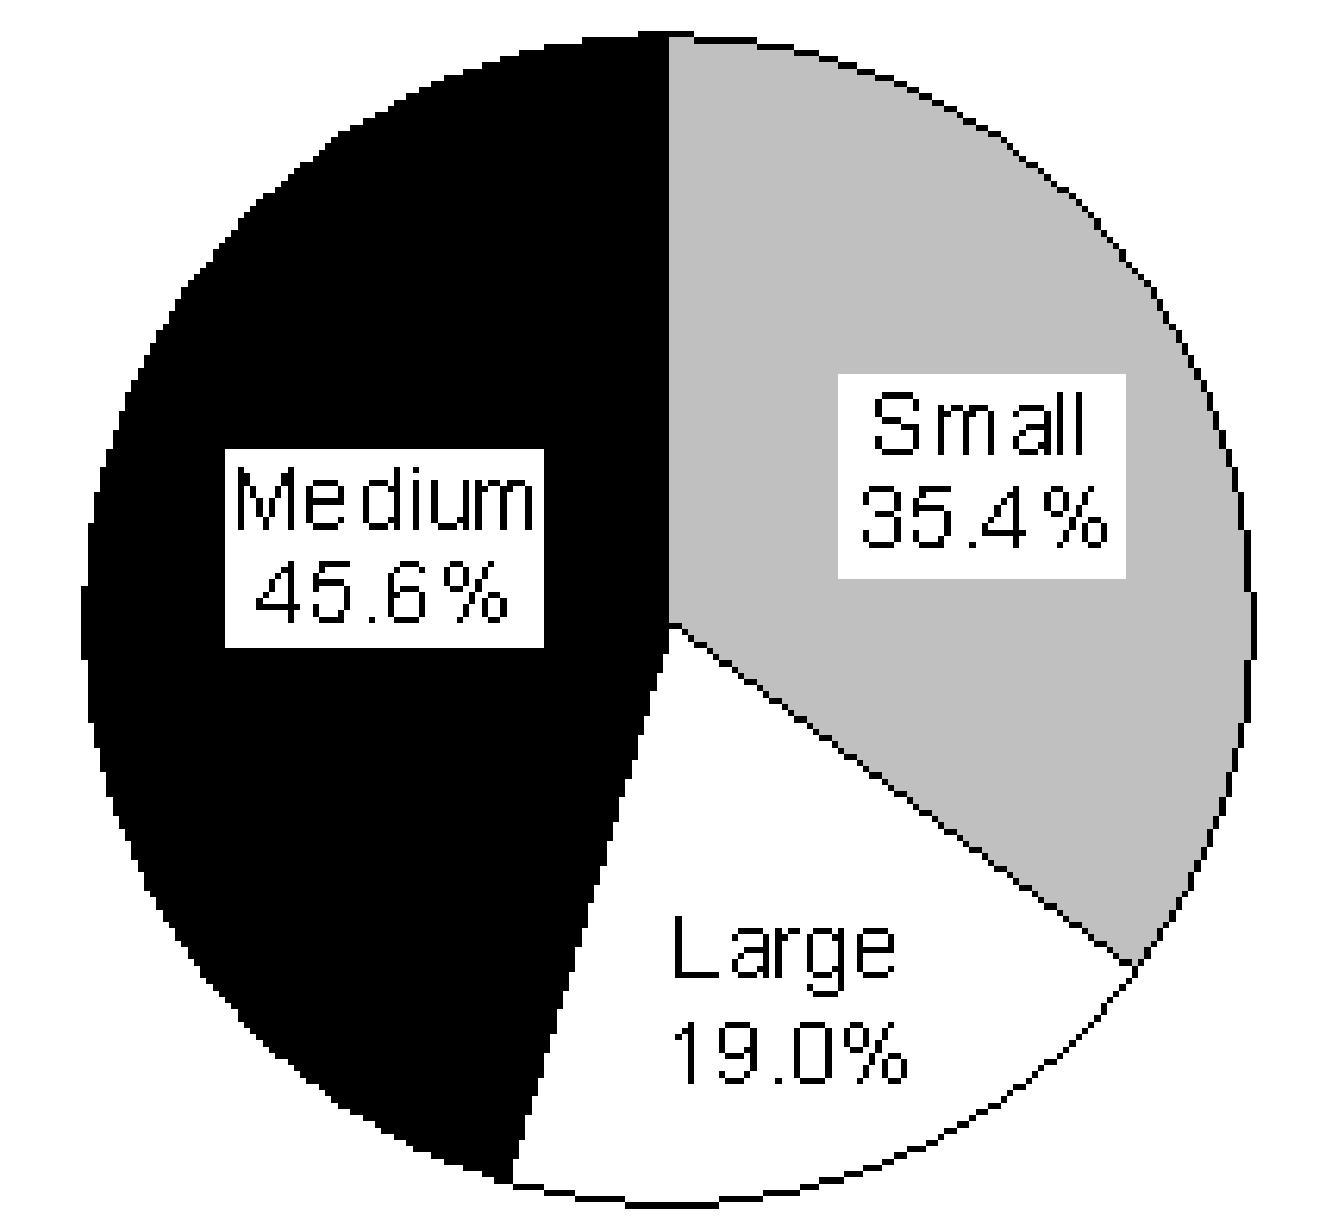
12) The Excel frequency bar graph below describes the employment status of a random sample of U.S. adults. What is the percentage of those having no job?
A) 40% B) 20% C) 15%
Answer: C
cannot determine
The following double-bar graph illustrates the revenue for a company for the four quarters of the year for two different years. Use the graph to answer the question.
13) In what quarter was the revenue the greatest for Year 1?
A) second quarter B) fourth quarter C) first quarter D) third quarter Answer: B
14) In what quarter was the revenue the least for Year 1?
A) fourth quarter B) third quarter C) second quarter D) first quarter Answer: C
15) What was the revenue for the second quarter of Year 2?
A) $25 million B) $5 million C) $4 million D) $20 million
Answer: D
SHORT ANSWER. Write the word or phrase that best completes each statement or answers the question.
Provide an appropriate response.
16) The grade point averages for 40 evening students are listed below. Construct a frequency bar graph and a relative frequency bar graph.
Grade Point Average Frequency
0.5- 0.9 4
1.0- 1.4 2 1.5- 1.9 7
-
Answer:
17) The local police, using radar, checked the speeds (in mph) of 30 motorists in a construction area. The results are listed below. Construct a frequency bar graph and a relative frequency bar graph.
Speed Frequency
33- 35 3
36- 38 6
39- 41 6
42- 44 6
45- 47 3
48- 50 6
Answer:
18) Listed below are the ACT scores of 40 randomly selected students at a major university.
18 22 13 15 24 24 20 19 19 12
16 25 14 19 21 23 25 18 18 13
26 26 25 25 19 17 18 15 13 21
19 19 14 24 20 21 23 22 19 17
a) Construct a relative frequency bar graph of the data, using eight classes.
b) If the university wants to accept the top 90% of the applicants, what should the minimum score be?
c) If the university sets the minimum score at 17, what percent of the applicants will be accepted?
Answer: a) See graph below
b) The minimum score = 14
c) The university will accept 76.57% of the applicants.
MULTIPLE CHOICE. Choose the one alternative that best completes the statement or answers the question.
19) Given the bar graph shown below, the Pareto chart that would best represent the data should have the bars in the following order.
The pie chart shows the percentage of votes received by each candidate in the student council presidential election. Use the pie chart to answer the question.
20)
Student
700 total votes
Who got the most votes? A) Gina B) Ted C) Ann D) Matt Answer: B
500 total votes
Who got the fewest votes? A) Jim B) Ming
Ann D) Ted Answer: B
Student Council President
500 total votes
What percent of the votes did Ted and Gina receive together?
59%
Answer: C
19%
41%
22%
SHORT ANSWER. Write the word or phrase that best completes each statement or answers the question.
Construct a pie chart for the data. Label each category with its percentage. 23) A study was conducted to determine how people get jobs. Four hundred subjects were randomly selected and the results are listed below. Round percents to whole numbers.
Answer:
24) Scott Tarnowski owns a pet grooming shop. His prices for grooming dogs are based on the size of the dog. His records from last year are summarized below. Round percents to whole numbers. Class Frequency
645
Answer:
MULTIPLE CHOICE. Choose the one alternative that best completes the statement or answers the question.
Provide an appropriate response.
25) A two- pound bag of assorted candy contained 100 caramels, 83 mint patties, 93 chocolate squares, 80 nut clusters, and 79 peanut butter taffy pieces. To create a pie chart of this data, the angle for the slice representing each candy type must be computed. What is the degree measure of the slice representing the mint patties rounded to the nearest degree?
A) 19° B) 69°
Answer: B
C) 52° D) 5 °
SHORT ANSWER. Write the word or phrase that best completes each statement or answers the question.
Construct a frequency distribution for the data.
26) A random sample of 30 high school students is selected. Each student is asked how much time he or she spent on the Internet during the previous week. The following times (in hours) are obtained: 14 22 16 19 16 14 16 15 13 19 17 15 15 14 17 16 13 13 18 15 13 15 22 17 14 18 14 17 16 15
Construct a frequency distribution for the data.
Answer: Hours On Net Number of HS Students 13 4 14 5 15 6 16 5 17 4 18 2 19 2 22 2
27) A sample of 25 service project scores is taken and is recorded below. Construct a frequency distribution for this data.
97
Construct the specified histogram.
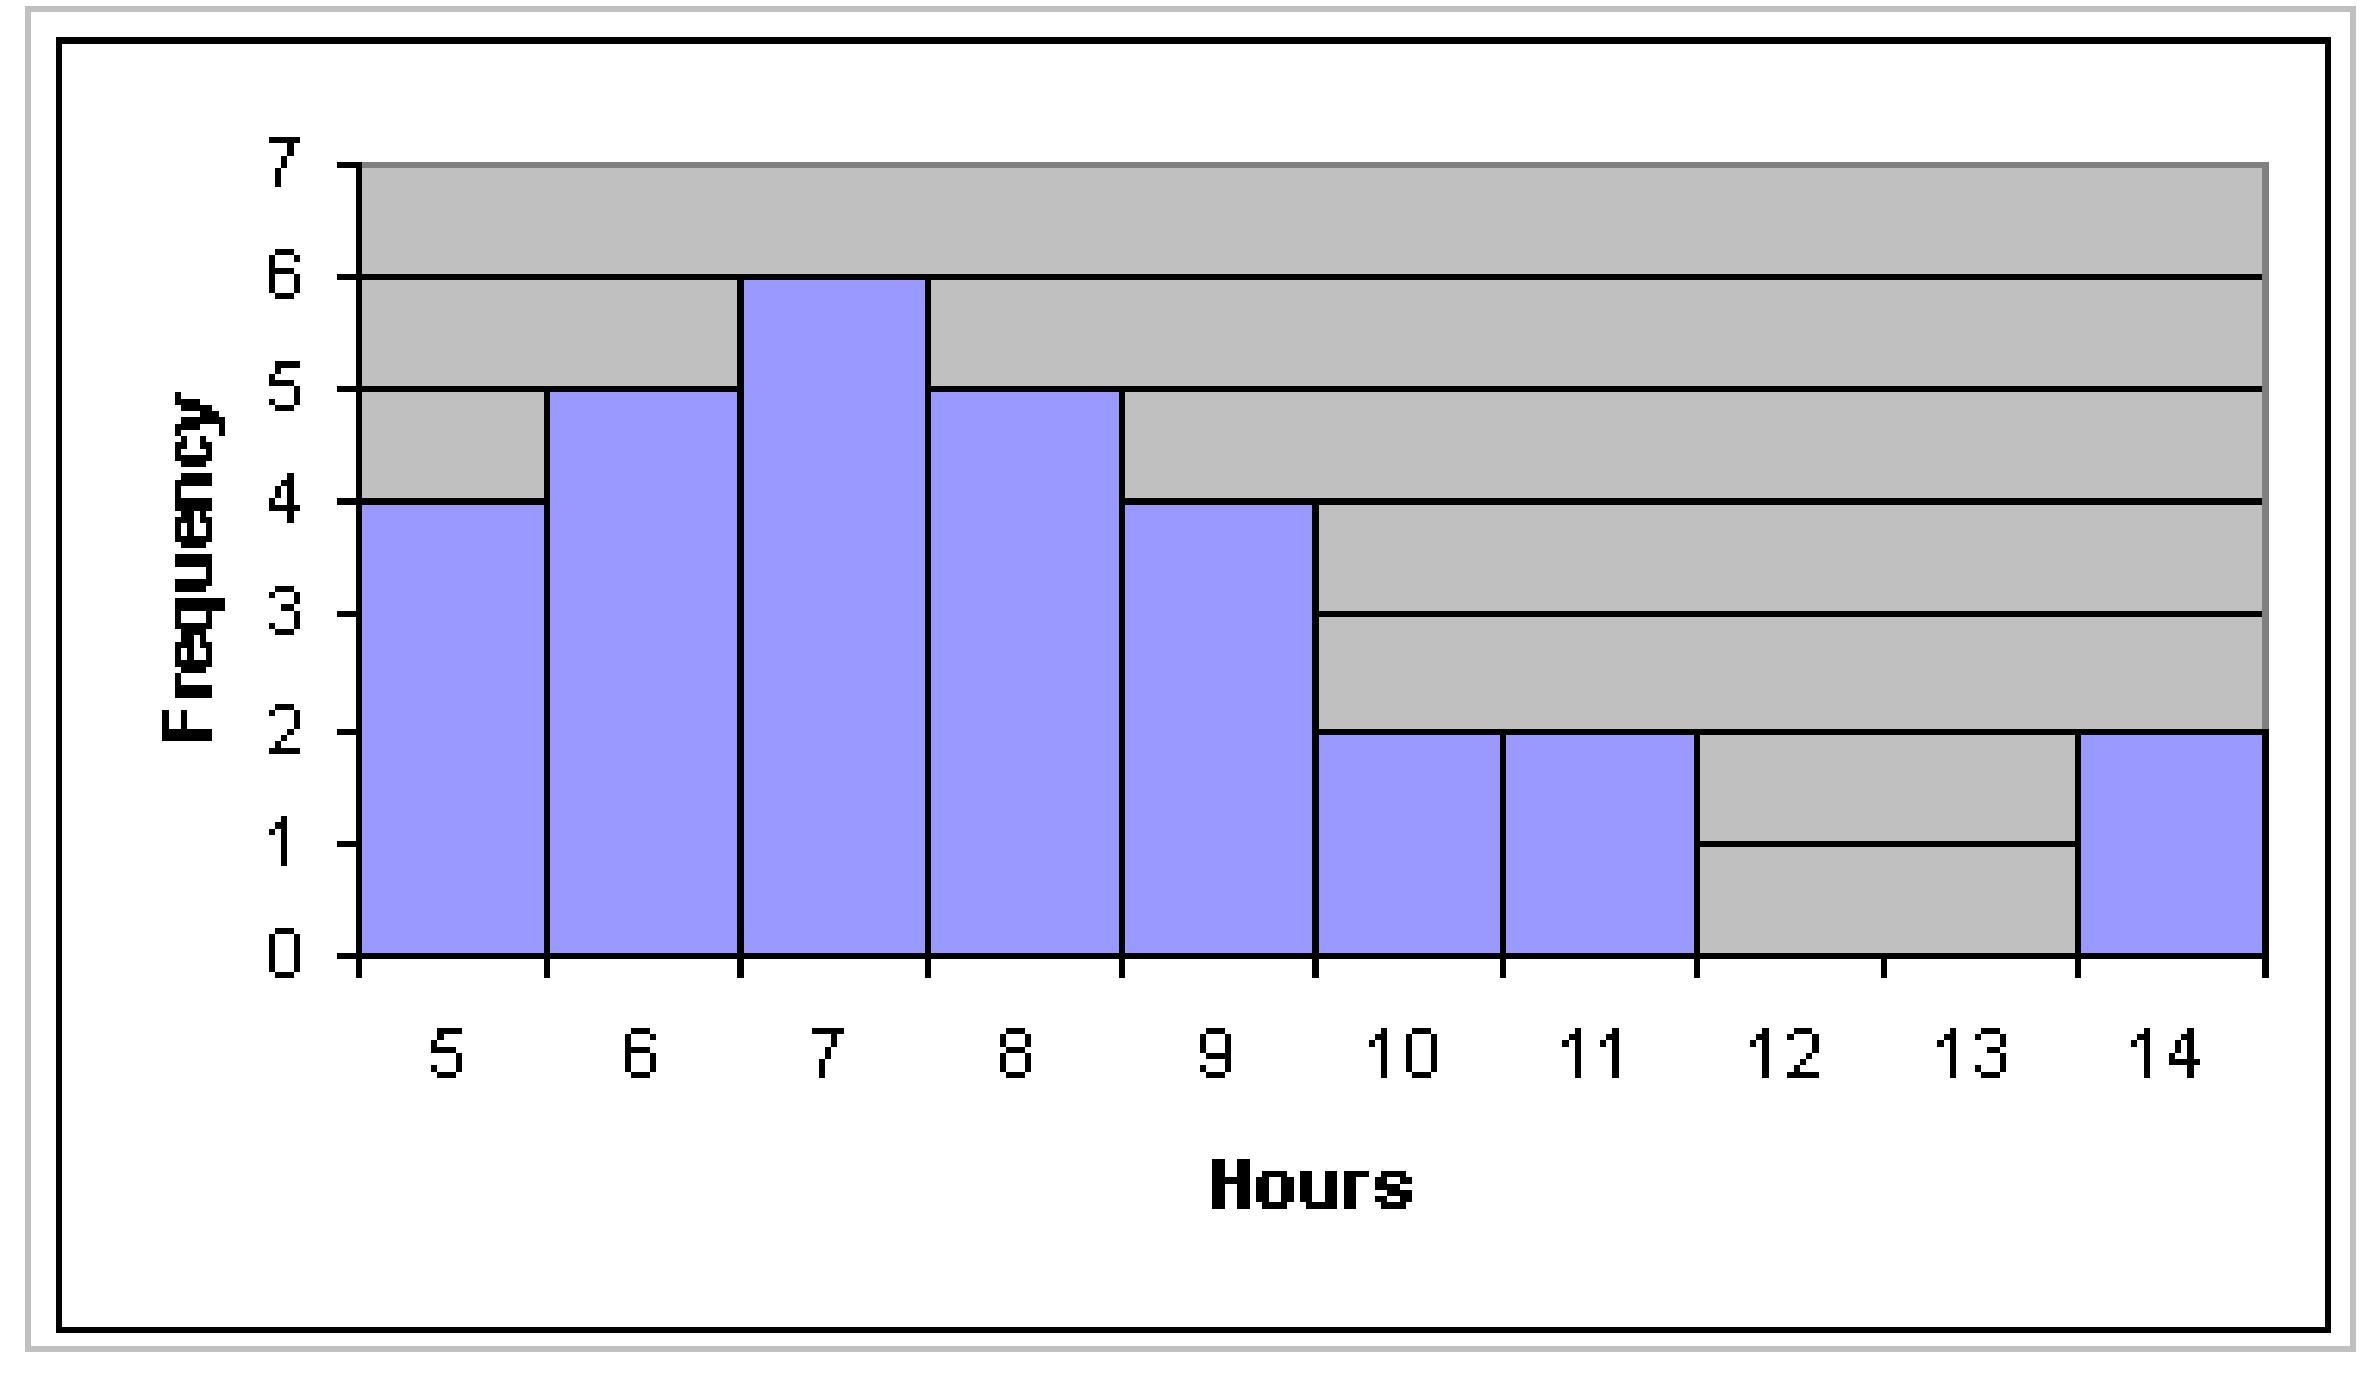
28) A random sample of 30 high school students is selected. Each student is asked how much time he or she spent on the Internet during the previous week. The following times (in hours) are recorded: 6 14 8 11 8
Construct a frequency histogram for this data.
Answer:
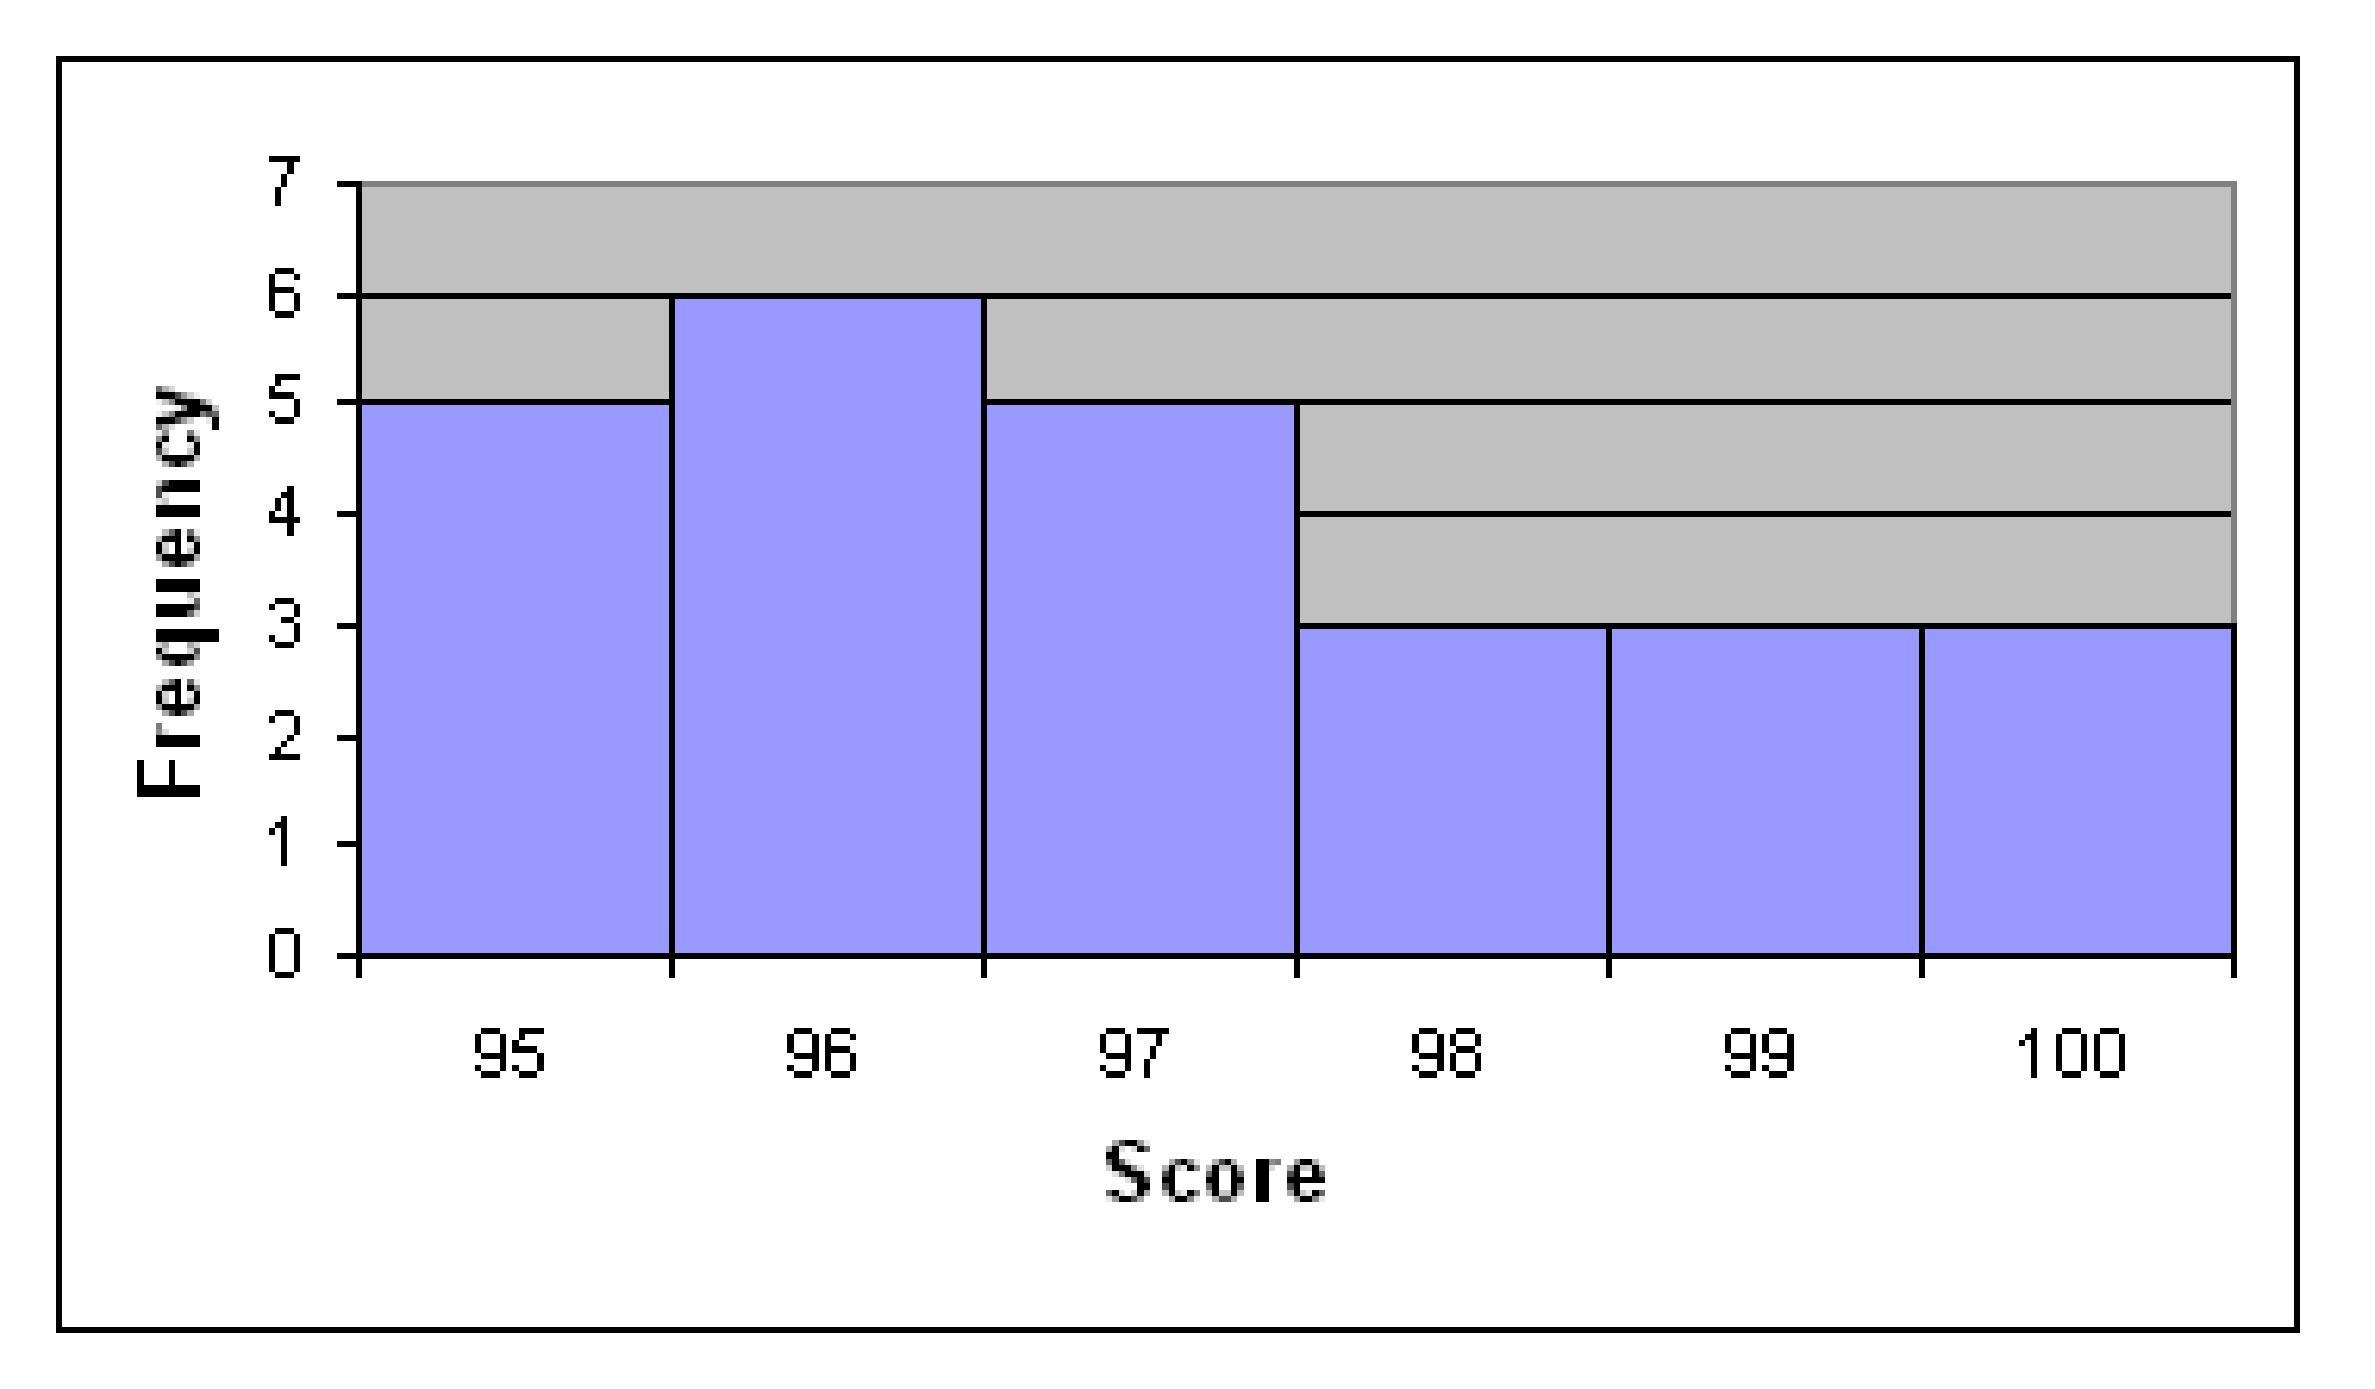
29) A sample of 25 community service projects is obtained and the scores are recorded. The results are shown below.
Construct a frequency histogram for this data.
97 96 96 95 96
99 97 97 100 99
95 98 95 96 100
95 98 96 96 100
95 97 99 97 98
Answer:
MULTIPLE CHOICE. Choose the one alternative that best completes the statement or answers the question.
Provide an appropriate response.
30) The class width is the difference between
A) The upper class limit and the lower class limit of a class
B) The largest frequency and the smallest frequency
C) Two successive lower class limits
D) The high and the low data values
Answer: C
31) Determine the number of classes in the frequency table below.
Class Frequency
23- 24 7
25- 26 2
27- 28 6
29- 30 4
31- 32 1
A) 2
Answer: B
B) 5
C) 20
D) 6
32) Find the class width for the frequency table below.
Class Frequency
22- 23 3
24- 25 1
26- 27 3
28- 29 6
30- 31 2
1
Answer: B
2
1.5
33) Use the following frequency distribution to determine the class limits of the third class.
Class Frequency
9 - 15 5
16- 22 9
23- 29 6
30- 36 3
37- 43 7
44- 50 4
A) lower limit: 22; upper limit: 30
2.5
lower limit: 23; upper limit: 30 C) lower limit: 23; upper limit: 29
lower limit: 22.5; upper limit: 29.5
Answer: C
34) A researcher records the number of employees of each of the IT companies in the town of Westmoore. The results are summarized in the table.
Answer: B
35) A researcher records the number of employees of each of the IT companies in the town of Westmoore. The results are summarized in the table.
Find the class limits of the third class.
A) lower limit: 799 ; upper limit: 1200 B) lower limit: 800 ; upper limit: 1199
C) lower limit: 800 ; upper limit: 1200 D) lower limit: 799.5; upper limit: 1199.5
Answer: B
36) The weights (in pounds) of babies born at St Mary's hospital last month are summarized in the table.
Weight (lb) Number of Babies
5.0 - 5.8 8
5.9 - 6.7 18
6.8 - 7.6 20
7.7 - 8.5 9
8.6 - 9.4 4
Find the class width.
0.9 lb
Answer: A
37) The weights (in pounds) of babies born at St Mary's hospital last month are summarized in the table.
Weight (lb) Number of Babies
5.0 - 5.8 8
5.9 - 6.7 20
6.8 - 7.6 18
7.7 - 8.5 10
8.6 - 9.4 4
Find the class limits for the second class.
A) lower limit: 5.85 ; upper limit:6.75 B) lower limit: 5.9; upper limit: 6.7
C) lower limit: 5.8; upper limit: 6.8 D) lower limit: 5.9; upper limit: 6.8
Answer: B
38) The table below summarizes the weights of the almonds (in grams) in a one- pound bag. What is the class width?
Weight (g) Frequency
0.7585 - 0.8184 1
0.8185 - 0.8784 1
0.8785 - 0.9384 1
0.9385 - 0.9984 3
0.9985 - 1.0584 157
1.0585 - 1.1184 171
1.1185 - 1.1784 8 A) 0.4
Answer: D
SHORT ANSWER. Write the word or phrase that best completes each statement or answers the question.
Construct the requested frequency distribution.
39) The June precipitation amounts (in inches) for 40 cites are listed below. Construct a frequency distribution and a relative frequency distribution using eight classes.
2.0 3.2
Answer:
40) The commute times (in minutes) of 30 executives are listed below. Construct a frequency distribution and a relative frequency distribution using five classes. Round relative frequency values to three decimal places.
Answer:
41) The March utility bills (in dollars) of 30 homeowners are listed below. Construct a frequency distribution and a relative frequency distribution using six classes.
44 38 41 50 36 36 43 42 49 48
35 40 37 41 43 50 45 45 39 38
50 41 47 36 35 40 42 43 48 33
Answer:
Provide an appropriate response.
42) A sample of 15 Boy Scouts was selected and their weights (in pounds) were recorded as follows:
97 120 137 124 117
108 134 126 123 106
130 110 100 120 140
a. Using a class width of 10, give the upper and lower limits for five classes, starting with a lower limit of 95 for the first class.
b. Construct a frequency distribution for the data
Answer: a. 95- 104, 105 - 114, 115 - 124, 125 - 134, 135 - 144
b.
Construct the specified histogram.
43) For the data below, construct a frequency distribution and a relative frequency distribution.
Height (in inches) Frequency
50 - 52 5
53 - 55 8
56 - 58 12
59 - 61 13
62 - 64 11
Answer:
44) For the data below, construct a frequency histogram and a relative frequency histogram.
Weight (in pounds) Frequency
135 - 139 6
140 - 144 4
145 - 149 11
150 - 154 15
155 - 159 8
Answer: Frequency Histogram:
Relative Frequency Histogram:
45) The 30 students in Mrs Harrison's literature class were asked how many cousins they had. The results are shown below. Create a frequency histogram for the data using a class width of 2.
10 1 3 5 4 7
5 1 0 9 11 1
5 4 1 7 7 11
0 6 6 1 5 7
10 1 1 5 6 0
Answer:
of Cousins
46) The 30 students in Mrs Harrison's literature class were asked how many cousins they had. The results are shown below. Construct a relative - frequency histogram using a class width of 2.
10 1 3 5 4 7
5 1 0 9 11 1
5 4 1 7 7 11
0 6 6 1 5 7
10 1 1 5 6 0
Answer:
47) A sample of 15 Girl Scouts was selected and their weights (in pounds) were recorded. The results are listed below. Construct a frequency histogram for the data using a class width of 10 and using 95 as the lower limit of the first class.
97 120 137 124 117
108 134 126 123 106
130 110 100 120 140
Answer:
Weight (pounds)
MULTIPLE CHOICE. Choose the one alternative that best completes the statement or answers the question.
Provide an appropriate response.
48) What is the difference between a bar chart and a histogram?
A) There is no difference between these two graphical displays.
B) The bars in a bar chart are all the same width while the bars of a histogram may be of various widths.
C) The bars on a bar chart do not touch while the bars of a histogram do touch.
D) The bars in a bar chart may be of various widths while the bars of a histogram are all the same width.
Answer: C
49) For the stem- and- leaf plot below, what are the maximum and minimum entries?
4 1 3 A) max: 41 ; min: 13 B) max: 38; min: 7 C) max: 47; min: 1 4 D) max: 4 3 ; min: 13
Answer: D
SHORT ANSWER. Write the word or phrase that best completes each statement or answers the question.
Determine the original set of data.
50)
Stem Leaves
7 1
8 7
9 0 9
10 2
11 0 1
12 6 9
13 6 7 9
14 2 3 8 9
15 0 9
Legend: 5 1 represents 51
Answer: 7 1 , 87 , 90, 99 , 10 2 , 11 0 , 11 1 , 126, 129, 136, 137, 139, 142, 143, 148, 149, 150 , 159
51)
Stem Leaves
5 5
6 4
7 0 1
8 5
9 2 4
10 6 9
11 6 7 9
12 2 3 8 9
13 7 9
Legend: 5 5 represents 5. 5
Answer: 5.5 , 6.4 , 7.0, 7.1 , 8.5 , 9.2 , 9.4 , 10.6, 10.9, 11.6, 11.7, 11.9, 12.2, 12.3, 12.8, 12.9, 13.7 , 13.9
Construct a stem -and-leaf plot for the data.
52) The number of home runs that Mark McGwire hit in the first 13 years of his major league baseball career are listed below. (Source: Major League Handbook) Construct a stem- and- leaf plot for this data.
3 49 32 33 39 22 42 9 9 39 52 58 70
Answer: 0 3 9 9 1 2 2 3 2 3 9 9 4 2 9 5 2 8 6 7 0
53) The numbers of runs batted in by Mark McLemore in the first 13 years of his major league baseball career are listed below. (Source: Major League Handbook) Construct a stem- and- leaf plot for this data.
Answer:
54) The heights (in inches) of 30 mechanics are listed below. Construct a stem - and- leaf plot for the data.
55) The March utility bills (in dollars) of 30 homeowners are listed below. Construct a stem- and- leaf plot for the data.
Answer:
56) The scores for an economics test are listed below. Create a stem- and- leaf plot for the data.
87 76 9 1 77 9 0 9 6 88 85 66 89
79 9 5 5 1 9 4 83 88 82 5 9 1 3 69
Answer: The stem will consist of the tens digit and range from 1 to 9. The leaves will be drawn in the appropriate stems based on the data values.
Construct a dot plot for the data.
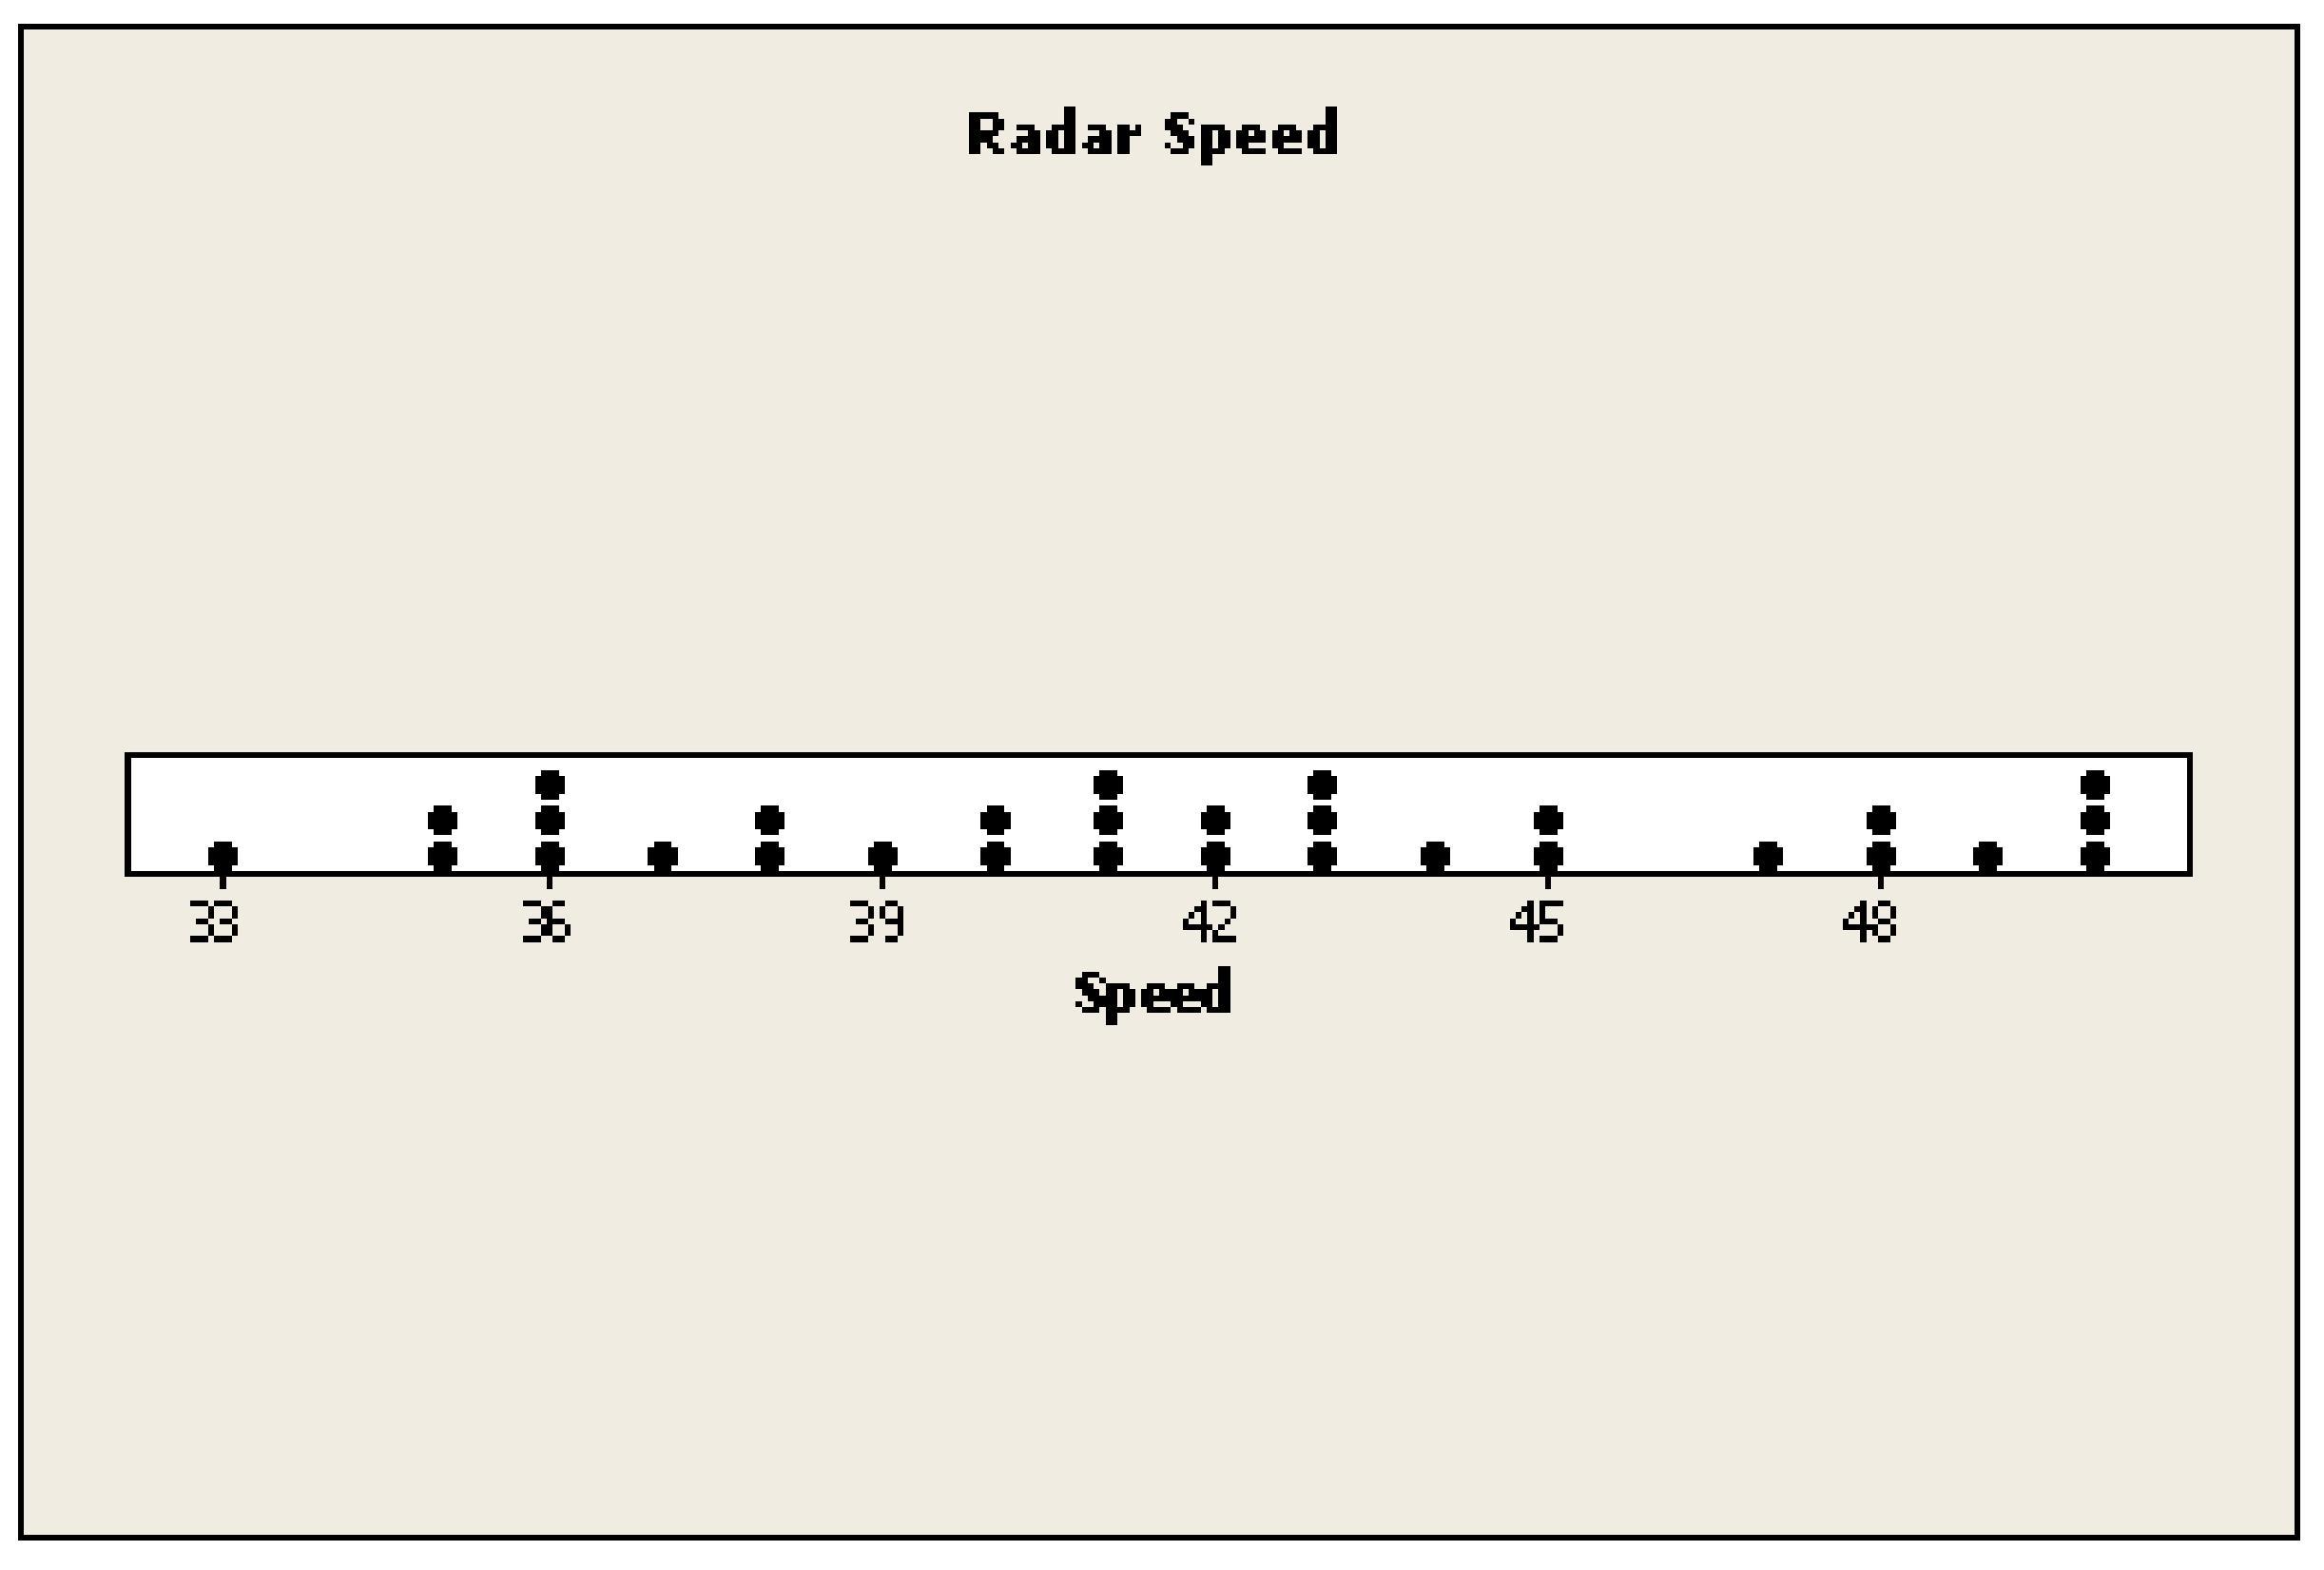
57) The local police, using radar, checked the speeds (in mph) of 30 motorists at a busy intersection. The results are listed below. Construct a dot plot for the data.
44 38 41 50 36 36 43 42 49 48
35 40 37 41 43 50 45 45 39 38
50 41 47 36 35 40 42 43 48 33
Answer:
58) The heights (in inches) of 30 mechanics are listed below. Construct a dot plot for the data.
70 72 71 70 69 73 69 68 70 71
67 71 70 74 69 68 71 71 71 72
69 71 68 67 73 74 70 71 69 68
Answer:

MULTIPLE CHOICE. Choose the one alternative that best completes the statement or answers the question.
Construct a frequency distribution for the data using five classes. Describe the shape of the distribution.
59) The data set: Pick Three Lottery Outcomes for 10 Consecutive Weeks
3 6 7 6 0 6 1 7 8 4
1 5 7 5 9 1 5 3 9 9
2 2 3 0 8 8 4 0 2 4
A) bell shaped B) skewed to the left C) skewed to the right D) uniform
Answer: D
60) The data set: ages of dishwashers (in years) in 20 randomly selected households
12 6 4 9 11 1 7 8 9 8
9 13 5 15 7 6 8 8 2 1
A) bell shaped B) skewed to the left C) skewed to the right D) uniform
Answer: A
61) The data set: weekly grocery bills (in dollars) for 20 randomly selected households
135 120 115 132 136 124 119 145 98 110
125 120 115 130 140 105 116 121 125 108
A) skewed to the right
B) bell shaped C) uniform D) skewed to the left
Answer: B
Describe the shape of the distribution.
62)
A) bell shaped
C) skewed to the right
Answer: C
63)
B) skewed to the left
D) uniform
A) bell shaped
B) uniform C) skewed to the left
Answer: C
Use the histograms shown to answer the question. 64)
D) skewed to the right
Is either histogram symmetric?
A) Neither is symmetric.
B) The first is symmetric, but the second is not symmetric.
C) Both are symmetric.
D) The second is symmetric, but the first is not symmetric.
Answer: A
SHORT ANSWER. Write the word or phrase that best completes each statement or answers the question.
Describe the shape of the distribution.
65) A sample of 15 Little League players was selected and their weights (in pounds) were recorded as follows:
97 120 137 124 117
108 134 126 123 106
130 110 100 120 140
Answer: symmetric
MULTIPLE CHOICE. Choose the one alternative that best completes the statement or answers the question.
Explain what is misleading about the graphic.
66)
The volume of our sales has doubled!!!
A) The length of a side has doubled, but the area has been unchanged.
B) The length of a side has doubled, but the area has been multiplied by 8.
C) The length of a side has doubled, but the area has been multiplied by 4.
D) The graphic is not misleading.
Answer: C
67)
2004 2006 2008 2010 2012
A) The vertical scale does not begin at zero. B) The trend is depicted in the wrong direction. C) The horizontal label is incomplete. D) The graphic is not misleading.
Answer: A
68) 2012 DUI Figures for State County
A) The graphic may give the impression that drivers over age 65 had no DUI's in 2012.
B) The graphic is not misleading.
C) The horizontal scale does not begin at zero.
D) The graphic only includes information for one year.
Answer: A
SHORT ANSWER. Write the word or phrase that best completes each statement or answers the question.
Provide an appropriate response.
69) The following graph shows the number of car accidents occurring in one city in each of the years 2006 through 2011 (Year 1 = 2006, Year 2 = 2007 etc). The number of accidents dropped in 2008 after a new speed limit was imposed. How is the bar graph misleading? How would you redesign the graph to be less misleading?
Answer: The bar graph is misleading because the vertical axis starts at 60 instead of 0. This tends to indicate that the number of accidents decreased at a faster rate than they actually did. The graph would be less misleading if the vertical scale began at 0 or if a symbol were used to clearly indicate that the vertical scale is truncated and has a gap.
70) A parcel delivery store finds that their delivery rates increased over the past year. Last year it delivered 3402 parcels. This year it delivered 8942 parcels.
How many times larger should the graphic for this year be than the graphic for last year?
Answer: roughly 3 times larger