
The U.S. and Global Economies
ANSWERS TO CHAPTER CHECKPOINT
Study Plan Problems and Applications
1. Which of the following items are not consumption goods and services? Explain why not.
A chocolate bar
A chocolate bar is a consumption good.
A ski lift
A ski lift is not a consumption good. It is capital that produces a service for skiers.
A golf ball
A golf ball is a consumption good.
2. Which of the following items are not capital goods? Explain why not.
An auto assembly line
An auto assembly line is a capital good.
A shopping mall
A shopping mall is a capital good.
A golf ball
A golf ball is not a capital good. It is a consumption good.
3. Which of the following items are not factors of production? Explain why not.
Vans used by a baker to deliver bread
Vans used to deliver bread are capital, so they are factors of production.
1,000 shares of Amazon.com stock
1,000 shares of Amazon.com stock are not a factor of production. The shares represent partial ownership of Amazon.com and therefore are financial capital.
Undiscovered oil in the Arctic Ocean
Undiscovered oil is not a factor of production because it is not used to
produce goods or services. Once it is discovered, it will become a factor of production.
4. Which factor of production earns the highest percentage of total U.S. income? Define that factor of production. What is the income earned by this factor of production called?
Labor earns by far the largest percentage of total U.S. income, 63 percent of total income in 2014. Labor consists of the work time and the work effort that people devote to producing goods and services. The income earned by labor is a wage.
5. With more job training and more scholarships to poor American students, which special factor of production is likely to grow faster than in the past?
As more people go to school and/or receive job training, the nation’s human capital will grow more rapidly. Human capital is the knowledge and skills people obtain from education, on-the-job training, and work experience. With more job training and more scholarships, human capital will grow more rapidly.
6. Define the factor of production called capital. Give three examples of capital, different from those in the chapter. Distinguish between the factor of production capital and financial capital.
Capital is the tools, instruments, machines, buildings, and other items that have been produced in the past and that businesses now use to produce goods and services. Capital includes railroad engines and cars, servers, and ATMs. The factor of production “capital” is the actual good itself; “financial capital,” such as stocks and bonds, are the funds that provide businesses with their financial resources which can be used to acquire capital goods.
7. The pace at which new businesses are created in the U.S. economy and the percentage of U.S. jobs in young firms has fallen.
Ryan Decker and others, “The Role of Entrepreneurship in U.S. Job Creation and Economic Dynamism.” Journal of Economic Perspectives, 2014. Explain how you would expect these facts to influence what, how, and for whom goods and services are produced in the United States
The answer to the what question changes if, as is probably the case, new and young business produce different goods and services than more established business. For example, new and young firms are more likely to create apps than older and more established firms. If these groups of producers produced their goods and services using different technologies than the rest of the producers, then the question of how goods and services would change. For whom goods and services are produced would
© 2018 Pearson Education, Inc.
change if some groups of consumers prefer the goods and services produced by the new and young firms while other groups do not.
8. In the circular flow model, explain the real flow and/or the money flow in which each item below belongs. Illustrate your answers on a circular flow diagram.
You buy a coffee at Starbucks.
In Figure 2.1 the dark arrows represent money flows and the grey arrows represent flows of goods and services and factors of production. If you buy a coffee at Starbucks, your expenditure is a money flow from households to the goods market, labeled a in the figure.
The government buys some Dell computers.
The purchase of computers by the government represents a flow of computers from the goods market to the government, labeled b in the figure.


A student works at a FedEx office.
The student working at FedEx is a factor of production, so the flow is a flow of the services of factor of production from households to the factor markets, labeled c in the figure.
Donald Trump rents a Manhattan building to a hotel.
Donald Trump’s building in Manhattan is a factor of production, so the flow is the services from this factor of production from households to the factor markets, labeled d in the figure.
You pay your income tax.
Your income tax payment is a money flow from households to the government and is labeled e in the figure.
9. Why you can get a free college education in Germany but not in California Even American students can get a free college degree in Germany, where high taxes pay for colleges. Despite college being free, fewer students in Germany earn college degrees than in the United States and more enter vocational apprenticeships.
Source: Los Angeles Times, October 29, 2015 If California adopted the German model of higher education, how would that change for whom goods and services are produced?
The students in California who otherwise would not have gone to college but who take advantage of the “free” college education will have higher incomes than otherwise. Consequently, more goods and services will be produced for them. The taxpayers who must pay the taxes necessary to fund these college educations will have less income to spend on goods and services, so fewer goods and services will be produced for them.
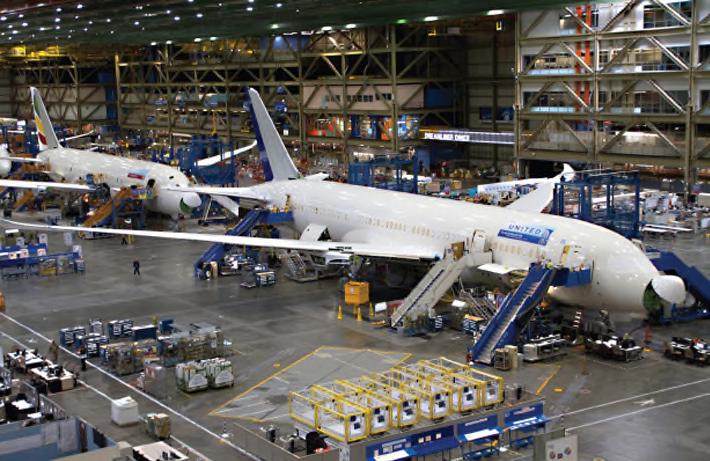
10. Read Eye on the Dreamliner on p. 43 and then answer the following questions:
How many firms are involved in the production of the Dreamliner and how many are identified in the figure on p. 43?
Over 400 firms are involved in the production of the Dreamliner. Only 15 of them are identified in the figure.
Is the Dreamliner a capital good or a consumption good? Explain why?
The Dreamliner is a capital good because it will be used to produce services (airline travel) throughout many future years.
State the factors of production that make the Dreamliner and provide an example of each.
All the factors of production—land, labor, capital, and entrepreneurship—are used to make the Dreamliner. The copper used for wiring is an example of the land used; the engineer who helped design the landing gear is an example of labor; the huge cranes that lift the various pieces of the Dreamliner to assemble them is an example of capital; and the creative and imaginative input of Boeing’s top managers who organize the resources used to produce the Dreamliner exemplify entrepreneurship.
Explain how the production of the Dreamliner influences what, how, and for whom, goods and services are produced.
Dreamliner influences “what” goods and services are produced by creating a demand for components manufactured around the world. It influences “how: goods are produced because Boeing and the other 400 firms all determine the best way to produce each particular part
© 2018 Pearson Education, Inc.
of the Dreamliner. It influences “for whom” because factors of production employed to make the Dreamliner receive income from this production, thereby increasing the quantity of goods and services they can purchase.
Use a graph to show where in the circular flow model of the global economy the flows of the components listed on p. 43 appear and where the sales of Dreamliners appear. Except for the components built in the United States, spending on the other components appear in the flow of expenditure on U.S. imports. Sales of Dreamliners appear in the flow of expenditure on U.S. exports.


Instructor Assignable Problems and Applications
1. Boeing’s Dreamliner has had a rocky start.
Why doesn’t Boeing manufacture all the components of the Dreamliner at its own factory in the United States?
Boeing wants to manufacture the Dreamliner at the lowest possible cost. It would be more expensive for Boeing to manufacture Dreamliners at its own factory in the United States because Boeing does not have the expertise possessed by its subcontractors and because the wages Boeing pays U.S. workers exceed the wages its subcontractors pays their workers.
Describe some of the changes in what, how, and for whom, that would occur if Boeing manufactured all the components of the Dreamliner at its own factories in the United States.
If Boeing manufactured all the components of the Dreamliner at its own factories in the United States, more components would be produced in the United States and more capital would have been used in their production.
U.S. workers and investors would have received higher incomes but the Dreamliner would cost more to produce so Boeing would have earned a lower profit.
State some of the tradeoffs that Boeing faces in making the Dreamliner.
Boeing faced a huge number of tradeoffs. For example, when designing the plane, Boeing’s engineers had to make decisions about fuel economy and passenger load. Increasing the passenger load decreased fuel economy, so the engineers traded passenger load for fuel economy. Another example revolves around the construction of the Dreamliner. Boeing could have constructed the plane using just a few companies but instead it used over 400. Boeing was trading off the simplicity of dealing with just a handful of companies for the increased specialization by dealing with many specialized companies.
Why might Boeing’s decisions in making the Dreamliner be in the social interest?
Building the Dreamliner itself advances the social interest because it increases the quantity of comfortable, rapid transportation. The amount of high-quality transportation available in the economy increases, which benefits society. The decisions in making the Dreamliner advance the social interest because they were designed to make the Dreamliner at low cost and thereby avoid wasting resources.
2. The global economy has seen a fall in the number of landlines and rapid growth in the number of smartphones. In the United States, 41 percent of
© 2018 Pearson Education, Inc.
households have no landline and 90 percent have a smartphone. In Africa, 33 percent have a smartphone. Describe the changes in what, how, and for whom telecommunication services are produced in the global economy.
What: As the number of cell phone users increases, the global economy has been producing more cell phone telecommunication services. More cell phones are produced, fewer land phones are produced, and presumably more cell phone frequencies are used.
How: More telecommunication services are being produced using cell phones rather than fixed-line phones.
For whom: While the amount of telecommunication services has been rising throughout the world, it has been increasing most rapidly in Africa. So more telecommunication services are being produced for residents of Africa as well as for residents in the rest of the world.
3. Which of the entries in the list are consumption goods and services? Explain your choice.
A pack of bubble gum and a movie are consumption goods. They are purchased by consumers.
4. Which of the entries in the list are capital goods? Explain your choice.
List
An interstate highway
An airplane
A school teacher
A stealth bomber
A garbage truck
A pack of bubble gum
President of the United States
A strawberry field
A movie
An ATM
An airplane, a garbage truck, and an ATM are capital goods. All provide services to produce other goods and services. The interstate highway and the stealth bomber also are capital goods. They also provide services (transportation and defense) that help produce other goods and services.
5. Which of the entries in the list are factors of production? Explain your choice.
An interstate highway, an airplane, a school teacher, a stealth bomber, a garbage truck, the President of the United States, a strawberry field, and an ATM are factors of production. A school teacher and the President are labor; an interstate highway, an airplane, a stealth bomber, a garbage truck, and an ATM are capital; and, a strawberry field is land.
6. In the African nation of Senegal, to enroll in school a child needs a Birth Certificate that costs $25. This price is several weeks’ income for many families. Explain how this requirement is likely to affect the growth of human capital in Senegal.
Human capital growth depends, in part, on the extent of schooling: More schooling means more human capital. Because of Senegal’s hefty fee for a
© 2018 Pearson Education, Inc.
required Birth Certificate, fewer children will enroll in school, thereby decreasing Senegal’s human capital growth.
7. China’s income gap widens
The income gap has widened in China. In 2014, the pay of workers in the coastal regions increased by 9.7 percent while that of workers in the inland regions grew by 9 percent.
Source: South China Morning Post, May 28, 2015
Explain how the distribution of personal income in China can be getting more unequal even though the poorest are getting richer.
The distribution of income in China can be getting more unequal even when the poorest are getting richer if the richest are getting richer even faster. If the rich are getting richer faster, the fraction of the nation’s total income received by the poorest 20 percent falls, which makes the personal distribution of income more unequal.
8. Compare the scale of agricultural production in the advanced and developing economies. In which is the percentage higher? In which is the total amount produced greater?
Agricultural is a small part of total production in advanced economies. It is a much larger part in developing economies. Even though advanced economies devote only a small part of their total production to agriculture, they still produce about one third of the world’s total production of food. The remaining two thirds is produced in the developing nations.
© 2018 Pearson Education, Inc.
9. On a diagram of the circular flow model, indicate in which real or money flow each entry in the list belongs.
General Motors’ pays its workers wages.
General Motors wage payment is a money flow that is a payment for use of the services of a factor of production and so flows out of the factor market to households (it flowed into the factor market from General Motors, a firm).


In Figure 2.3 the dark arrows represent money flows and the grey arrows represent flows of goods and services and factors. The flow of wage payments to households is labeled a in the figure in Figure 2.3.

IBM pays a dividend to its stockholders.
IBM’s dividend payment is a money flow that is a payment for use of the services of a factor of production and so flows out of the factor market to households (it flowed into the factor market from IBM, a firm). The flow to households is labeled b in the figure.
You buy your groceries.
Your purchase of groceries represents a money flow from households to the goods market, labeled c in the figure.
Southwest rents some aircraft.
The aircraft are factors of production, so the flow is the services from these factors of production from the factor markets to firms, labeled d in the figure.
Nike pays Serena Williams for promoting its sports shoes. Serena Williams is a factor of production, so the flow is a money flow
from the factor markets to households in exchange for Ms. Williams’ services of promoting the sports shoes. The flow is labeled e in the figure.
Use the following information to work Problems 10 and 11.
Poor India makes millionaires at fastest pace
India, with the world’s largest population of poor people, also paradoxically created millionaires at the fastest pace in the world. Millionaires increased by 22.7 percent to 123,000. In contrast, the number of Indians living on less than a dollar a day is 350 million and those living on less than $2 a day is 700 million. In other words, there are 7,000 very poor Indians for every millionaire.
Source: The Times of India, June 25, 2008
10. How is the personal distribution of income in India changing?
If the number of millionaires is growing more rapidly than the number of other income groups, it will be the case that the personal distribution of income in India is becoming less equally distributed.
11. Why might incomes of $1 a day and $2 a day underestimate the value of the goods and services that these households actually consume?
The people living on $1 and $2 a day probably grow a lot of their food and produce a lot of their clothing and shelter. If these goods and services are not taken into account, their share of goods and services is understated. Including them raises the value of the goods and services these households actually consume.
© 2018 Pearson Education, Inc.
Multiple Choice Quiz
1. Which of the following classifications is correct?
A. City streets are consumption goods because they wear out with use.
B. Stocks are capital goods because when people buy and sell them they make a profit.
C. The coffee maker in the coffee shop at an airport is a consumption good because people buy the coffee it produces.
D. White House security is a government service because it is paid for by the government.
Answer: D Answer D is correct.
2. Which of the following statements about U.S. production is correct?
A. Construction accounts for a larger percentage of total production than does manufacturing.
B. Real estate services account for 14.5 percent of the value of total production, larger than any other item of services or goods.
C. Consumption goods and services represent 78.5 percent of U.S. production by value and that percentage doesn’t fluctuate much.
D. The manufacture of goods represents more than 50 percent of total production.
Answer: C Answer C is correct as the data on page 34 show.
3. Which of the following items is not a factor of production?
A. An oil rig in the Gulf of Mexico
B. A ski jump in Utah
C. A bank loan to a farmer
D. An orange grove in Florida
Answer: C Answer C is not a factor of production because it is financial capital; see page 37.
4. What is human capital?
A. A fruit picker
B. Unskilled labor
C. Your professor’s knowledge of the economy
D. An auto assembly line robot
Answer: C Answer C uses the definition of human capital on page 37.
5. Which of the following statements is correct?
A. Labor earns wages and entrepreneurship earns bonuses.
B. Land earns interest and capital earns rent.
C. Entrepreneurship earns interest and capital earns profit.
D. Capital earns interest and labor earns wages.
Answer: D Page 39 shows that answer D is correct.
6. How are goods and services produced in the global economy?
A. Developing countries use less human capital but just as much physical capital as advanced economies.
B. Emerging economies use more capital-intensive technology than do developing economies.
C. Human capital in all economies is similar.
D. Advanced economies use less capital than developing economies.
Answer: B Developing countries have less capital than emerging economies.
7. In the circular flow model, which of the following items is a real flow?
A. The flow of government expenditures to firms for the goods bought
B. The flow of income from firms to households for the services of the factors of production hired
C. The flow of U.S. borrowing from the rest of the world
D. The flow of labor services from households to firms
Answer: D Answer D is a real flow because it is a labor service.
CHAPTER OUTLINE
The U.S. and Global Economies
1. Describe what, how, and for whom goods and services are produced in the United States.
A. What Do We Produce?
1. Consumption Goods and Services
2. Capital Goods
B. How Do We Produce?
1. Land
2. Labor
3. Capital
4. Entrepreneurship
C. For Whom Do We Produce?
1. Rent
2. Wages
3. Interest
4. Profit (or Loss)
2. Describe what, how, and for whom goods and services are produced in the global economy.
A. The People
B. The Countries
1. Advanced Economies
2. Emerging Market and Developing Economies
C. What in the Global Economy?
1. Where Is the Global Pie Baked?
2. Some Differences In What Is Produced
3. Some Similarities In What is Produced
D. How in the Global Economy?
1. Human Capital Differences
2. Physical Capital Differences
E. For Whom in the Global Economy?
1. Personal Distribution of Income
2. International Distribution
3. A Happy Paradox and a Huge Challenge
3. Explain the circular flow model of the U.S. economy and the global economy.
A. Households and Firms
B. Markets
C. Real Flows and Money Flows
D. Governments
1. Federal Government
2. State and Local Government
E. Governments in the Circular Flow
G. Circular Flows in the Global Economy
1. International Trade
2. International Finance
What’s New in this Edition?
Chapter 2 contains updated data, a reworked “Eye on the U.S. Economy: What We Produce,” and a few sections with minor revisions, but no major content changes.
Where We Are
In Chapter 2, we describe what, how, and for whom goods and services are produced in the United States. Then we examine these same three questions in the global economy. Finally we use the circular flow model to provide a picture of how households and firms interact. We also describe the economic activities of governments in the United States.
Where We’ve Been
In the previous chapter, we covered the definition of economics and distinguished between microeconomics and macroeconomics. We described what economists do and some of the problems they encounter. In addition, we explored the four core ideas that define the way economists think about macroeconomic questions. Finally, we explained why economics is worth studying.
Where We’re Going
In the next chapter, we develop our first economic model, the production possibilities frontier. We use the model to illustrate some of the concepts that have been developed in
Chapters 1 and 2, such as the “what” question, the “how” question, and opportunity cost.
IN THE CLASSROOM
Class Time Needed
The material in this chapter should be covered in no more than one class session.
An estimate of the time per checklist topic is:
2.1 What, How, and for Whom?—15 to 20 minutes
2.2 The Global Economy—15 to 20minutes
2.3 The Circular Flows—20 minutes
Classroom Activity: Part of this chapter focuses on the standard of living that we enjoy. As an icebreaker you might want to poll students by asking them what they believe are some of the most important achievements since 1900 that have helped raise the standard of living of Americans and people around the world. You could give students two minutes in class to compose a list of about ten items. Make sure to tell them that there really are no right or wrong answers. The only requirements are that the items were introduced (not necessarily invented) in the twentieth century and had some impact on our standard of living. When time is up, have students share with you their items and merge them with a list of your own. As an aid, here is a short list that might prove useful: Electricity, Automobile, Airplane, Radio, Television, Telephone, Air conditioning, Computer, Highways, Spacecraft, Internet, Refrigeration, Laser and fiber optics, Nuclear power
Discussion of this list could center around a number of issues. First, it will allow you the opportunity to get students to question the mainstream view that an increase in the standard of living depends only on the quantities of goods and services produced and the number of people among whom those goods and services are shared. Point out that official measurements of standard of living around the world focus on average income earned per day. As a standard benchmark, these data are extremely useful, but they do hide some very important information, namely the quality of goods and services. You could pick any number of items on this list and ask students what kinds of advancements have occurred that make the good or service better. The automobile will likely be a favorite. Here is a short list of some of the advancements of the modern automobile: airbags, 5 m.p.h. bumpers, fuel injection (instead of carburetors), cameras, window defrosters, global positioning systems, radio, television, Bluetooth, climate control systems, four-wheel drive, anti-lock braking systems, power steering, power brakes, power seats, power locks, daytime running lights, side crash severity sensors, and cruise control. Students will probably have a ball talking about all that has changed with the personal computer.
Classroom Activity: You can generate some discussion by getting the students to think about what life might be like after another 200 years of economic growth. Provide some numbers: In 2015, income per person in the United States was about $100 a day. In 1815 it was about 70¢ a day, and if the past growth rate prevails for another 200 years, in 2215 it will be $14,000 a day. Emphasize the magic of compound growth. If they think that $14,000 a day is a big income, get them to do a ballpark estimate of the daily income of Bill Gates (about $14 million!) Encourage a discussion of why scarcity is still present even at these large incomes.
Classroom Activity: After introducing the factors of production, break students into small groups and ask them to select a specific good. Then ask them to brainstorm a detailed list of every factor of production they can identify that was used to produce that good and break this list into the 4 categories. This should help students apply their new understanding of the factors of production and become capable of distinguishing between the 4 categories of factors of production. Moreover, this exercise should also give students a better appreciation of the complexity of the factors of production for each good to which they are exposed. No matter how thorough they believe they are in identifying the factors of production for the good they chose, they will have undoubtedly left off various inputs that you can help them identify. But don’t fool yourself – even given a few minutes, you will likely just be scratching the surface of the factors of production for even the most “simple” of goods.
CHAPTER LECTURE
2.1 What, How, and For Whom?
What Do We Produce?
Goods and services produced are divided into two categories:
Consumption goods and services are items that are bought by individuals and governments and are used up in the current period. Consumption goods and services account for about 78.5 percent of total production.
Capital goods are goods that are bought by businesses and governments to increase their productive resources to use over future periods to produce other goods and services. Capital goods account for about 21.5 percent of total production.
How Do We Produce?
Goods and services are produced using four factors of production: land, labor, capital, and entrepreneurship.
Land is the “gifts of nature” or natural resources, which includes not only land in the everyday sense but also minerals, energy, water, air, wild plants, animals, birds and fish.
Labor is the work time and work effort that people devote to producing goods and services. Human capital is the knowledge and skills that people obtain from education, onthe-job training, and work experience.
Capital consists of the tools, instruments, machines, buildings, and other items that have been produced in the past and that businesses now use to produce goods and services. Capital does not include financial capital like money, stocks, or bonds.
Entrepreneurship is the human resource that organizes labor, land, and capital to produce goods and services. Entrepreneurs make business decisions and bear the risks that arise from these decisions.
Lecture Launcher: To help make the idea of “factors of production” more tangible, ask the students to think about what home-based business they could start right now (baking, web site creation, cleaning houses, catering, babysitting, mowing lawns…). They should make a list of the factors of production they currently possess and classify them according to land, labor, capital, and entrepreneurship. For example, one student might suggest that “I could be a caterer.” This student could then list for the factors of production:
1. Land: I own the land my house is on, I could grow food products on it.
2. Labor: I own my own labor power
3. Capital: I own a kitchen, sink, refrigerator, phone, etc. I know how to cook (human capital)
4. Entrepreneurship: I know how to organize my efforts and promote them.
Land Mine: When you write the four productive resources on the board (land, labor, capital, and entrepreneurship) the greatest challenge is to get students to think “out of the box.” Students often take each of the terms too literally. For instance, when economists use the term land, it is important to
emphasize that this term encapsulates all natural resources, not just the obvious area of land in terms of acres or plots. “Land” also includes water, oil, and other important and strategic minerals.
Labor refers to human labor. There is a natural tendency for students to think of the entire population and the labor force as synonymous. Take care to mention that the labor force includes not only people who are working but also people who are unemployed and actively seeking work. In addition, it is worth mentioning that the size of the labor force can change from increases in population and also from changes in demographics.
Capital is usually not a concept that is difficult for students to grasp. However, it is sometimes confused with financial capital. Point out that unless economists specifically say “financial capital,” they are invariably referring to physical capital such as factories, machines, and equipment. Inform them that financial capital is a term that is used in business to refer to cash, loans, stocks, and bonds.
Lastly is the term entrepreneurship. While the obvious icon here is that of a business person who is responsible for bringing together all the other factors of production, it is worth noting that the most important characteristic of an entrepreneur is that of being a risk taker. Explain that risk taking is a trait that is quite scarce in supply. If students ask for proof, merely ask them what most people do for a living. The answer is that they work for someone else. The very act of being an employee involves a certain implicit preference of risk aversion.
For Whom Do We Produce?
Rent is paid for the use of land, wages are paid for the services of labor, interest is paid for the use of capital, and entrepreneurs receive a profit or incur a loss
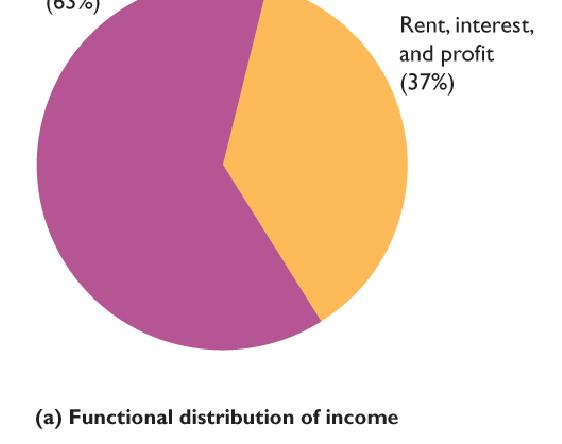
The functional distribution of income is the distribution of income among the factors of production. In the United States in 2014 labor received 63 percent of total income.
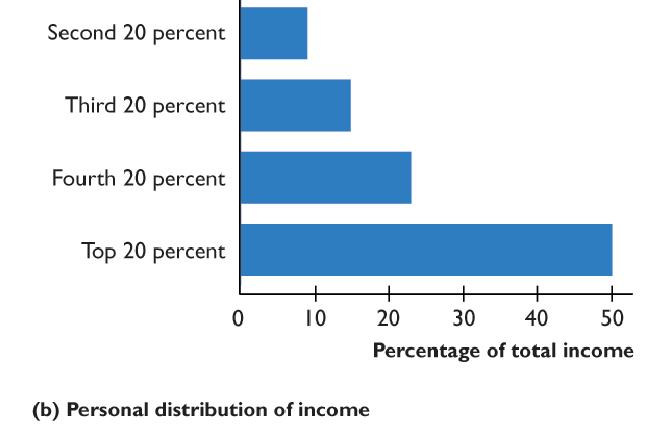
The personal distribution of income is the distribution of income among household. In the United States in 2014 the richest 20 percent of households earned 50 percent of total income and the poorest 20 percent of households earned only 3 percent of total income.
The distribution of income is constantly changing and is becoming increasingly unequal.
2.2 The Global Economy
People: The world population was approximately 7.3 billion (approximately 322 million in the United States) as of November 8, 2015.
Countries: The International Monetary Fund classifies the 176 economies into two broad categories:
Advanced economies. These are the 29 countries (or areas) that have the highest standard of living. Included in this list are the United States, Japan, Germany, France, Italy, the United Kingdom, and Canada. Also included are the newly industrialized Asian
© 2018 Pearson Education, Inc.
economies. Almost 1 billion people live in advanced economies.
Emerging market and developing economies. The emerging market economies are the 28 countries in Europe and Asia that were, until the early 1990s, part of the Soviet Union or its satellites and today are moving toward market-based economies. The developing economies are the 119 countries in Africa, Asia, the Middle East, Europe, and Central and South America that have not achieved a high standard of living. Approximately 500 million people living in emerging market economies and more than 5.5 billion people live in developing economies. The BRICS (Brazil, Russia, India, China, and South Africa) comprise 42% of the global population and hold regular meetings to advance the issues of these nations and draw attention to development problems.
What in the Global Economy?
Where is the global pie baked?: The advanced economies produce 43 percent of the world’s total production, including 16 percent in the United States. The BRICS account for 31 percent, including 17 percent in China.
Some differences in what is produced: Developing economies have large and growing manufacturing industries. Agriculture accounts for a small percentage of total production within advanced economies and a large percentage of total production within developing economies. Even so, advanced economies produce about 33 percent of the world’s total agricultural output. The contrast between the share of production of agriculture and the total production results because total production is much larger in advanced economies.
Some similarities in what is produced: Other advanced economies often have similar stores and brands as those in the United States. Services are the most rapidly growing sector in advanced economies, while agriculture and manufacturing are declining as a share of total production.
How in the Global Economy?
Goods and services are produced using land, labor, capital, and entrepreneurship, and the combination of these resources used are chosen to produce at the lowest possible cost.
Human capital differences: Levels of education, training, and experience are higher in advanced economies than in developing economies, meaning human capital will play a more important role in production in advanced economies.
Physical capital differences: The more advanced the economy, the greater are the amount and the level of sophistication of the capital equipment used in production. While select regions and industries in developing economies may have advanced technology and capital, it is not nearly as widespread as in advanced economies.
For Whom in the Global Economy?
Personal distribution: The distribution of income in the global economy is even more unequal than in the U.S.—the lowest-paid 20 percent of the world’s population receives 2 percent of world income and the highest-paid 20 percent receives 70 percent of world income.
International distribution: The United States has an average income of $153 a day and the Euro area is $104 a day. Average incomes in China, India, and Africa are $39, $17, and $11 a day, respectively.
A happy paradox and a huge challenge: Despite rising inequality within most countries, inequality in the world income has decreased during the past 20 years because incomes in China and India, both heavily populated and poor nations, have grown rapidly. Lifting Africa from poverty remains one of today’s biggest challenges.
Lecture Launcher: Students tend to think in terms of individuals when they think about standards of living. I recommend that you start there and then try to develop a kind of “national average” by making a list. Have students suggest things that they think are considered basic necessities to the “average” American family: air conditioning? Automobile? Electric refrigerator? Hot and cold running water? Indoor plumbing? Smart phone? High-speed Internet? From there, you can ask if these goods and services would be necessities in a developing economy.
2.3 The Circular Flows
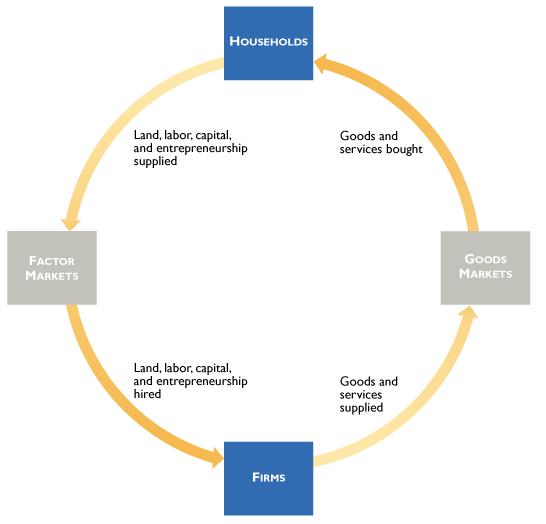
The circular flow model is a model of the economy that shows the circular flow of expenditures and incomes that result from decision makers’ choices, and the way those choices interact to determine what, how, and for whom goods and services are produced.
Lecture Launcher: Just as “no man is an island” neither is any economic actor. We are all touched by the actions of another. That’s the idea behind the circular flow model. So start by asking them what they’ve bought today—coffee, gasoline, breakfast sandwich, etc. How did they obtain them? Where did those things come from? How did the vendor get them? How does the vendor pay for them? For his employees?
Another approach is to discuss how students pay their tuition. For example, in Georgia, state income taxes support the system of higher education, in addition to lottery profits which pay for scholarships and grants. Even if a student does not have a scholarship or grant, his or her education is being heavily subsidized. An otherwise unfunded college student in Georgia would have to pay approximately four times more in tuition without state support. That funding comes from all our taxes—so that I, the teacher, am being paid for out of their taxes as well as their tuition and expenses.
Households and Firms
A household is an individual or a group of people living together. A firm is an economic unit that organizes the production of goods and services.
Markets
A market is any arrangement that enables buyers and sellers to get information and to do business with each other. Goods markets are the markets in which goods and services are bought and sold; factor markets are the markets in which the services of factors of production are bought and sold.
Real Flows and Money Flows
Firms and households interact in markets and it is this interaction that determines what will be produced, how it will be produced, and who will get it. The real flows are the goods and services and the factors of production. The money flows go in the opposite direction to the real flows
Prices within markets coordinate firms’ and households’ decisions.
Willingness to pay affects production and production affects willingness to pay. It would appear that we have the classic “which came first, the chicken or the egg” conundrum. However, in the next chapter, we will discuss the most powerful model in economics, Demand and Supply, which allows us to think clearly about the behavior of markets.
Governments in the Circular Flow
The federal government has three major expenditure categories: public goods and services, social security and welfare payments, and transfers to state and local governments. It collects three main taxes: personal income taxes, corporate (business) income taxes, and social security taxes.
The state and local governments have two major expenditure categories: goods and services, and welfare benefits. They collect three main taxes: sales taxes, property taxes, and state income taxes.
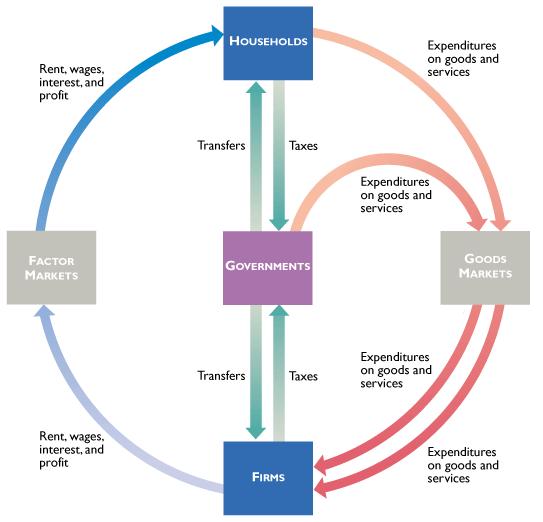
In the circular flow, governments buy goods and services from firms. Households and firms pay taxes to, and receive transfers from, governments.
Circular Flows in the Global Economy
International Trade
Imports are the good and services that we buy from households and firms in other countries. Exports are the goods and services that we sell to households and firms in other countries.
International Finance
When firms, households, or governments want to borrow or lend money, they can compare interest rates in their economy to interest rates in other economies. They look for the lowest interest rate at which to borrow and the highest at which to lend
When the value of our imports exceeds the value of our exports, we must borrow from the rest of the world. When the value of our exports exceeds the value of our imports, we lend to the rest of the world.
It is international trade and international finance flows that tie nations together in the global economy and through which global booms and slumps are transmitted.
USING EYE ON THE U.S. ECONOMY
What We Produce
This Eye provides an overview of production in the U.S. according to the largest areas of production in terms of goods and services. This set of results sets the stage for discussing the U.S. economy as very consumption driven (because consumption goods and services account for nearly 79 percent of all domestic production) and very service oriented (as most of the largest areas of production are services, not goods). Students often lose sight of the fact that because they don’t see “Made in the U.S.A.” on everything they purchase, it doesn’t mean everything they buy was imported – it’s just that the domestically produced services they consume (such as health care or education) don’t have labels printed on them like the imported electronics, clothing, and toys they purchase!
USING EYE ON THE PAST
Changes in What We Produce
This Eye provides an interesting example highlighting the transition of the U.S. economy from manufacturing to services. Point out to your students that we always hear of job losses in the manufacturing sector and these losses are always presented as “new” and “bad.” While the losses may or may not be “bad,” your students need to know that they are certainly not new: Manufacturing has shrunk in importance since at least 1950. Despite the framing of manufacturing job losses that is done by presidential candidates such as Donald Trump or Bernie Sanders, these job losses are not a recent phenomenon that can be easily placed at the feet of the previous president or simply blamed on trade agreements such as NAFTA. Mention to your students that most likely they are going to be employed in the service sector—that is where the jobs are because that is what we produce. Indeed, over 80 percent of employment nowadays is in services! Moreover, service-oriented employment typically requires higher levels of education, so that is likely the career path they are heading down (if they aren’t already in a service-oriented job). If you ask how many of your students are going to college in order to get into shoe manufacturing, not many hands (if any) will go up.
USING EYE ON THE U.S. ECONOMY
Changes in How We Produce in the Information Economy
After presenting students with the example of declining shoe manufacturing, you might want to ask them what fundamental changes in the economy have been underway in the United States. The likely response is that the goods and services that we produce today and will produce tomorrow are different than in decades past. This answer is basically correct. In the 1970s, manufacturing was a more dominant part of the economy.
Technology has advanced tremendously over the last 50 years. Challenge your students to ask their parents or grandparents if they used a computer at any point in their high school or college education. Many of your students’ folks will never have seen, much less used, a computer when they were in high school or college. Today, of course, virtually all students have computers. It has been estimated that in 1965 there were 20,000 computers in the world. Today, if your college has more than 20,000 students, it is likely the case there are more than 20,000 computers associated with your college alone! This amazing fact really makes clear that how we produce goods and services has undergone massive changes.
USING EYE ON THE DREAMLINER
Who Makes the Dreamliner?
Ask your students why Boeing chooses to have the components for the Dreamliner manufactured by more than 400 companies around the world, as opposed to producing everything themselves. For U.S. consumers and producers, what are the pros and cons associated with Boeing’s decisions to outsource production? It is important to identify here that the specialization of factors of production results in lower production costs, even after factoring in transaction and transportation costs. Also point out that often the least expensive way for domestic production to take place is not to rely solely on domestic producers, but to take advantage of factors of production in the global economy. Through this process, domestic producers become dependent upon foreign producers, just as foreign producers become dependent upon domestic producers. What are the advantages and disadvantages of this interdependence?
USING EYE ON THE GLOBAL ECONOMY
Differences in How We Produce
This Eye can be used to draw parallels between production in current developing economies and the United States a century or two ago. While laundry is now done in the United States using machinery, clothing would have been hand washed a hundred years ago. While transportation is now heavily done using personal automobiles and commercial trucks on relatively well maintained highways, it might have been done on horseback or by covered wagon on open land or dirt trails two hundred years ago. Drawing the parallels between the current state of developing economies and the past conditions in the United States can allow you to have students picture global economic development like a long race that all countries are running in. Economies have perhaps started the race at different times, are moving at different speeds (and sometimes are even moving backwards or not moving at all) and are currently at different places in the race. Even the same economy might have these differences, such as the huge discrepancies seen in development between urban and rural China. While rural China might be where the United States was in the race a century or two ago, urban China might only be a few decades behind.
USING EYE ON YOUR LIFE
The U.S. and Global Economies in Your Life
This Eye discusses how your students will interact with international trade in their careers and as voters. Though not directly related to this topic, you can— and probably should—take the opportunity to explain to students what they can do with an economics major. Many students are interested in economics as a major but hesitate because they do not know about the careers they can follow with economics as their major. Point out to your students that economics is an excellent major for anyone considering advanced degrees in law or in the different public policy arenas. It also is a great background for anyone considering a career in politics.
Additionally, economics is a wonderful major for students who plan to enter the workforce after obtaining their bachelor’s degrees. I contrast economics with degrees in finance and in marketing. I point out that all three degrees essentially prepare students for entry level management jobs. But they differ in their emphasis. A marketing degree will teach students what factors help sell products and about distribution networks. Marketing majors tend to find jobs in retail, in PR, and in similar areas. Finance majors learn a lot about a very important sector of the economy and very important part of running a firm. Finance majors tend
to find jobs with banks, insurance companies, and other similar firms. Economics majors differ insofar as they do not learn so much about important sectors of the economy or important aspects of running firms. Instead they learn how to think quantitatively and logically about issues. In particular, they really learn how to use marginal analysis, introduced in Chapter 1, in all decision making processes. This method of thought is extremely powerful and so businesses are willing to pay a lot for students who have acquired it, which is why economics majors are, on the average, paid more than marketing majors and often more than finance majors. The average starting salary for a 2010 college graduate with an economics major was $51,698, which has the highest starting salary for a non-engineering major (business was $46,672 and the liberal arts majors was $35,508). The jobs economics majors take tend not to be as concentrated as with marketing and finance. For instance, it is uncommon, but still possible, for a marketing major to take a job with a bank and a finance major to take a job with a retail company. Economics majors, however, will take jobs with banks and retailing companies with about equal frequency. So you should reassure your students that if they are thinking of majoring in economics, that decision can be a wise choice.
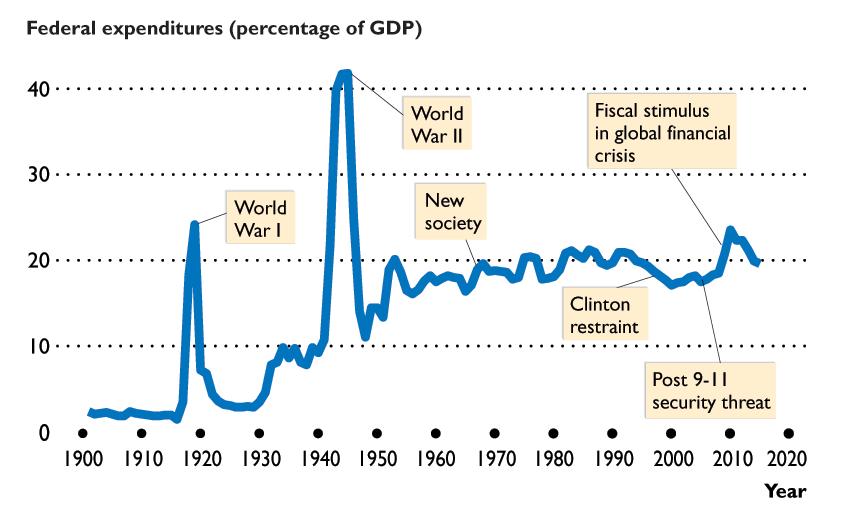
USING EYE ON THE PAST
Growing Government
The fact that the U.S. government buys roughly 20 percent of total production is commonplace for our students. They have likely never lived in an era when the government took much less than 20 percent…or much more than 20 percent. The figure in this “Eye” can be used to good effect to point out to the students that until 1940, the federal government took much less than 20 percent of total production (other than during World War I) and in World War II, the fraction shot up to over 40 percent. You can point out to your students the trend from about 1930 to about 1984 for higher federal outlays as a percentage of total output. Ask them why this trend occurred. Was it good or bad? If the trend had not occurred, what would be different today? You can also use the huge spikes in World War I and World War II to point out that today’s War on Terror (as well as the war in Vietnam) had nowhere near the effects on the economy as did the two world wars. Ask your students what they think would be different if the War on Terror escalated so that the federal government was spending 40 percent of GDP. What trend do they predict for the next 10, 20, and 30 years? Students with a basic understanding of the looming Social Security and Medicare crisis’ may recognize that 20 percent number may end up seeming quite low in the coming decades.
USING EYE ON THE GLOBAL ECONOMY
The Ups and Downs in International Trade
Ask your students why international trade has expanded so rapidly over the past few decades. How do changes in international trade patterns create winners and losers both in the U.S. and abroad? Do they personally feel like a winner or loser as a result of these changes in international trade? Students often believe that the U.S. is adversely impacted by trade, though they can quickly identify how they benefit tremendously from lower prices and a larger variety of imported goods. In fact, it is likely that they are draped (figuratively and literally) in the gains from international trade – with the clothes they are wearing, with the smart phone in their pocket, with the purse at their side, and with the automobile (and fuel for that automobile) that got them to class. In fact, without a global economy, they would likely not have the privilege of learning economics from this Foundations textbook written by Bade & Parkin (who live in Canada).
Why does international trade slow down during a recession? Does this help an economy during a recession or magnify the problems an economy is experiencing? Does global economic interdependence provide more or less stability for an economy? Will international stay around its average growth rate of around 7 percent a year over the next few decades, or has the level of international trade reached a plateau for the foreseeable future? All of these questions are worthy of discussion!
ADDITIONAL EXERCISES FOR ASSIGNMENT
Questions
Checkpoint 2.1 What, How, and For Whom?
1. Identify each of the goods and services below as either capital goods or consumption goods and services.
1a. Restaurant meals
1b. Oven in a restaurant
1c. Oil rig
1d. Haircut
1e. Factory
1f. Dining room table in a house
1g. Table in a restaurant
1h. Golf course
1i. A round of golf
2. Identify the payments that are made to each of the four factors of production.
3. Comment on the following assertion: “If the trends in schooling continue, at some point in the future, everyone will have a college degree and no one will be available to work as a janitor or garbage collector.” Critically evaluate this statement.
Checkpoint 2.2 The Global Economy
4. Classify the following countries as advanced or developing countries: Australia, Chile, China, France, India, Indonesia, Hong Kong, Mexico, Nigeria, and Peru.
5. Think about the trends in what and how goods and services are produced in the U.S. and global economies. Do you think that at some future time, there will be no jobs in the United States and all the jobs will be in developing economies? Explain your answers
Checkpoint 2.3 The Circular Flows
6. In the goods market, households and firms both have a role to play. In the factor markets these roles are reversed. Why does the reversal occur?
Answers
Checkpoint 2.1 What, How, and For Whom?
1a. consumption good
1b. capital good
1c. capital good
1d. consumption service
1e. capital good
1f. consumption good
1g. capital good
1h. capital good
1i. consumption service
2. Wages are paid to labor, rent to land, interest to capital, and entrepreneurs receive a profit or incur a loss.
3. This statement exaggerates and is untrue. If the trend toward higher education continued unabated at the current rate, it would be well into 2100 before 100 percent of the population had college degrees. But the trend will not continue because many individuals do not have the necessary talents to graduate from college. And even if everyone possessed a college degree, if the pay offered as a janitor or garbage collector is sufficiently high, college graduates will accept these jobs.
Checkpoint 2.2 The Global Economy
4. The advanced economies include Australia, France, and Hong Kong. The developing economies include Chile, China, India, Indonesia, Mexico, Nigeria, and Peru.
5. We would not expect all jobs to move from the United States to other nations. Relative to the rest of the world, workers in the United States will remain highly skilled, and likely will increase their average skills even more. These highly skilled workers will be needed to produce goods and services that must be produced using skilled rather than unskilled labor.
Checkpoint 2.3 The Circular Flows
6. Households are the buyers in the goods market and firms are the sellers. In this market, households pay firms money in exchange for goods and services. In the factor markets, the roles are reversed. Households are the sellers of labor, land, capital, and entrepreneurship and firms are the buyers. In this market, firms pay households money in exchange for the factors of production.

The U.S. and
Global Economies

When you have completed your study of this chapter, you will be able to
1 Describe what, how, and for whom goods and services are produced in the United States.
2 Describe what, how, and for whom goods and services are produced in the global economy.
3 Use the circular flow model of the U.S. economy and of the global economy. CHAPTER CHECKLIST
2.1 WHAT, HOW, AND FOR WHOM?
What Do We Produce?
We divide the vast array of goods and services produced into:
• Consumption goods and services
• Capital goods
2.1 WHAT, HOW, AND FOR WHOM?
Consumption goods and services are goods and servicesthat are bought by individuals and used to provide personal enjoyment and contribute to a person’s standard of living.
Examplesare movies and laundromat services.
Capital goods are goods that are bought by businesses to increase their productive resources.
Examplesare cranes and trucks.
2.1 WHAT,
HOW, AND FOR WHOM?
How Do We Produce?
Factors of production are the productive resources used to produce goods and services.
Factors of production are grouped into four categories:
• Land • Labor
• Capital • Entrepreneurship
2.1 WHAT, HOW, AND FOR WHOM?
Land
Land includes all the “gifts of nature” that we use to produce goods and services.
Land includes all the things we call natural resources.
Land includes minerals, water, air, wild plants, animals, birds, and fish as well as farmland and forests.
2.1 WHAT, HOW, AND FOR WHOM?
Labor
Labor is the work time and work effort that people devote to producing goods and services.
The quality of labor depends on how skilled people are— what economists call human capital.
Human capital is the knowledge and skill that people obtain from education, on-the-job training, and work experience.
2.1 WHAT, HOW, AND FOR WHOM?
Capital
Capital consists of tools, instruments, machines, buildings, and other items that have been produced in the past and that businesses now use to produce goods and services.
Capital includes semifinishedgoods, office buildings, and computers.
Capital does not include money, stocks, and bonds. They are financial resources.
2.1 WHAT, HOW, AND FOR WHOM?
Entrepreneurship
Entrepreneurship is the human resource that organizes labor, land, and capital.
Entrepreneurscome up with new ideas about what and how to produce, make business decisions, and bear the risks that arise from these decisions.
2.1 WHAT, HOW, AND FOR WHOM?
For Whom Do We Produce?
Factors of production are paid incomes:
Rent Income paid for the use of land.
Wages Income paid for the services of labor.
Interest Income paid for the use of capital.
Profit (or loss) Income earned by an entrepreneur for running a business.
2.1 WHAT, HOW, AND FOR WHOM?
Functional distribution of income is the distribution of income among the factors of production.
Personal distribution of income is the distribution of income among households.
2.1 WHAT, HOW, AND FOR WHOM?
Figure 2.1(a) shows the functional distribution of income in 2014:
Wages 63%
Rent, interest, and profit 37%


2.1 WHAT, HOW, AND FOR WHOM?
Figure 2.1(b) shows the personal distribution of income in 2014: The poorest 20% earned only 3% of total income. The richest 20% earned 50% of total income.


2.2 THE GLOBAL ECONOMY
The People
U.S. population: 322,115,000 ( November 8, 2015)
World population: 7, 284, 290,000
The U.S. clock ticks along showing a population increase of one person every 12 seconds.
The world clock spins faster, adding 30 people in the same 12 seconds.
2.2 THE GLOBAL ECONOMY
The Economies
Advanced Economies
The richest 29 countries (or areas). Almost 1 billion people (15 percent of the world’s population) live in advanced economies.
2.2 THE GLOBAL ECONOMY
Emerging Market and Developing Economies
Emerging market economies are the 28 countries of Central and Eastern Europe and Asia.
Almost 500 million people live in these countries.
Developing economies are the 119 countries in Africa, Asia, the Middle East, Europe, and Central and South America that have not yet achieved high average incomes for their people.
More than 5.5 billion people live in these countries.
2.2 THE GLOBAL ECONOMY
What in the Global Economy?
In 2015, global production was worth about $113 trillion.
Where Is the Global Pie Baked?
Figure 2.2 gives the answer.

2.2 THE GLOBAL ECONOMY
Some Differences in What Is Produced
Developing economies have large and growing manufacturing industries, which produce textiles, footwear, sports gear, toys, electronic goods, furniture, steel, and even automobiles and airplanes.
Food production is a small part of the U.S. and other advanced economies and a large part of the developing economies such as Brazil, China, and India.
But the advanced economies produce about one third of the world’s food.
2.2 THE GLOBAL ECONOMY
Some Similarities in What Is Produced
Retail industries in advanced economies are similar, but so are the structure of what they produce.
Agriculture and manufacturing are smaller percentages of total production and are shrinking whereas services are a larger percentage and growing.
2.2 THE GLOBAL ECONOMY
How in the Global Economy?
Human Capital Differences
The quality of labor depends on human capital. The differences in human capital between the advanced economies and the developing economies is enormous and it arises from:
• Education, on-the-job training, and experience
• Physical ability and state of health.
2.2 THE GLOBAL ECONOMY
Physical Capital Differences
The physical capital available for producing goods and services differentiates an advanced economy from a developing economy:
• Transportation system—advanced economies are more developed.
• Technologies used on farms and in factories— advanced economies use more capital-intensive technologies.
2.2 THE GLOBAL ECONOMY
For Whom in the Global Economy?
Who gets the world’s goods and services depends on the incomes that people earn.
Figure 2.3 (on the next slide) shows the distribution of incomes around the world.
2.2 THE GLOBAL ECONOMY
In 2015, U.S. average income was $153 a day. In the European Union it was $104 a day and in Russia $65 a day. In China it was $39 a day; in India $17, and in Africa $11.

2.3 THE CIRCULAR FLOWS
Circular flow model is a model of the economy that shows: The circular flow of expenditures and incomes that result from decision makers’ choices and … the way those choices interact in markets to determine what, how, and for whom goods and services are produced.
2.3 THE CIRCULAR FLOWS
Households and Firms
Households are individuals or people living together as decision-making units.
Firms are institutions that organize production of goods and services.
2.3 THE CIRCULAR FLOWS
Markets
A market is any arrangement that brings buyers and sellers together and enables them to get information and do business with each other.
Goods markets are markets in which goods and services are bought and sold.
Factor markets are markets in which factors of production are bought and sold.
2.3 THE CIRCULAR FLOWS
Real Flows and Money Flows
In factor markets:
• Households supply factors of production
• Firms hire factors of production.
In goods markets:
• Firms supply goods and services produced.
• Households buy goods and services.
2.3 THE CIRCULAR FLOWS
Real Flows
These are the real flows in the economy.
Money flows run in the opposite direction to the real flows.
2.3 THE CIRCULAR FLOWS
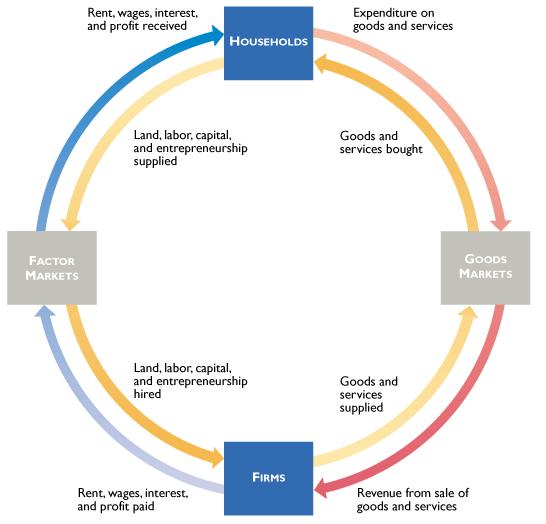
Money Flows
Firms pay households incomes for the services of factors of production.
Households pay firms for the goods and services they buy. These are the money flows.
• Blue flows are incomes.
• Red flows are expenditures.
2.3 THE CIRCULAR FLOWS
Governments
We divide governments into two broad levels:
• Federal government
• State and local government
Federal Government
The federal government’s major expenditures are to provide
1.Goods and services
2.Social Security and welfare benefits
3.Transfers to state and local governments
2.3 THE CIRCULAR FLOWS
The federal government finances its expenditures by collecting taxes.
The main taxes are
1.Personal income taxes
2.Corporate (business) taxes
3.Social Security taxes
In 2015, the federal government spent $4 trillion—about 23 percent of the total value of all the goods and services produced in the United States in that year.
Taxes raised less than $4 trillion—the government had a budget deficit.
2.3 THE CIRCULAR FLOWS
State and Local Governments
State and local governments expenditures provide
1.Goods and services
2.Welfare benefits
State and local governments finance these expenditures by collecting taxes.
The main taxes levied are
1.Sales taxes
2.Property taxes
3.State income taxes
2.3 THE CIRCULAR FLOWS
Governments in the Circular Flow
Households and firms pay taxes and receive transfers. Governments buy goods and services from firms.
2.3 THE CIRCULAR FLOWS
Circular Flows in the Global Economy
Households and firms in the U.S. economy interact with households and firms in other economies in two main ways: They buy and sell goods and services and they borrow and lend. We call these two activities:
• International trade
• International finance
2.3 THE CIRCULAR FLOWS
International Trade
Many of the goods that you buy were not made in the United States―your iPod, Wii games, and Nike shoes. The goods and services that we buy from firms in other countries are U.S. imports.
Much of what is produced in the United States doesn’t end up being sold here―Boeing sells most of the airplanes it makes to foreign airlines. The goods and services that we sell to households and firms in other countries are U.S. exports.
2.3 THE CIRCULAR FLOWS
International Finance
When firms or governments want to borrow, they look for the lowest interest rate available. Sometimes, that interest rate is outside the United States.
Also, when the value of U.S. imports exceeds the value of U.S. exports, the United States must borrow from the rest of the world.
2.3 THE CIRCULAR FLOWS
Households and firms in the U.S. economy interact with those in the rest of the world in goods markets and financial markets.

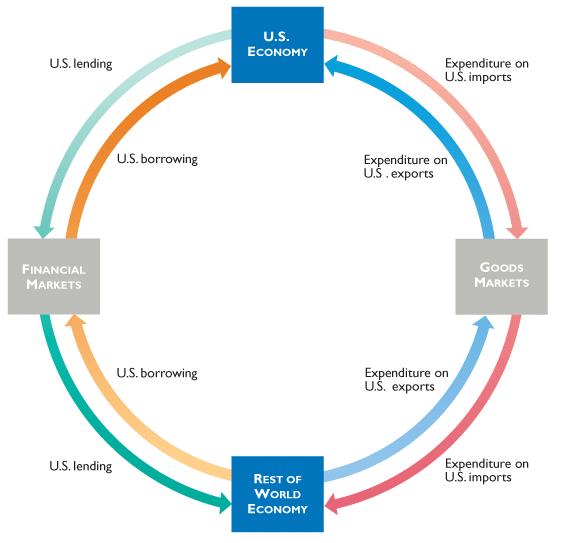
2.3 THE CIRCULAR FLOWS
The red flow shows the expenditure by Americans on imports of goods and services. The blue flow shows the expenditure by the rest of the world on U.S. exports (other countries’ imports).
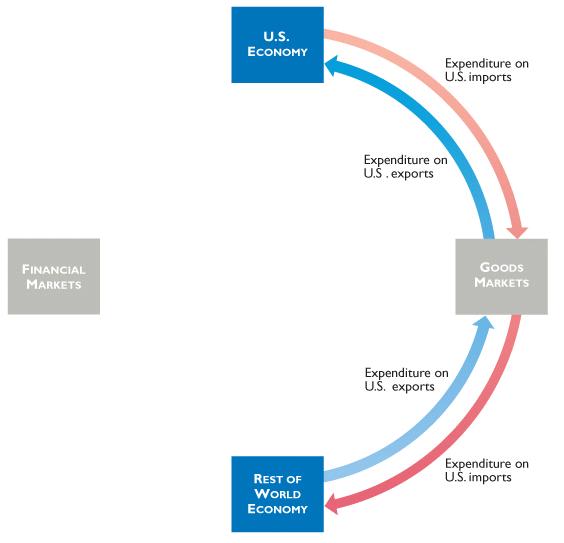
2.3 THE CIRCULAR FLOWS
The green flow shows U.S. lending to the rest of the world.
The orange flow shows U.S. borrowing from the rest of the world.
2.3 THE CIRCULAR FLOWS
These international trade and international finance flows tie nations together. Global booms and slumps are transmitted through these flows.

Boeing wants to manufacture the Dreamliner at the lowest possible cost.
Boeing achieves this goal by having more than 400 firms on 4 continents make its components.
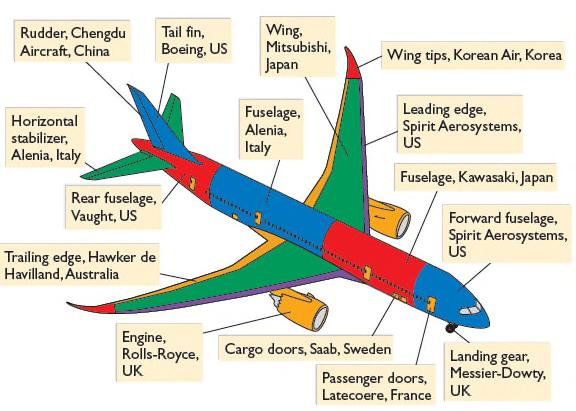
Boeing and the 400-plus firms make decisions and pay their workers, investors, and raw material suppliers to play their parts in influencing what, how, and for whom goods and services are produced.
All these decisions are made in selfinterest and the Dreamliner is produced at the lowest possible cost.
Boeing wants to manufacture the Dreamliner at the lowest possible cost.
Boeing achieves this goal by having more than 400 firms on 4 continents make its components.
Boeing and the 400-plus firms make decisions and pay their workers, investors, and raw material suppliers to play their parts in influencing what, how, and for whom goods and services are produced.
All these decisions are made in selfinterest and the Dreamliner is produced at the lowest possible cost.

In the United States:
Consumption goods and services are 85 percent of the value of total U.S. production.
Capital goods are 15 percent of the value of total U.S. production.
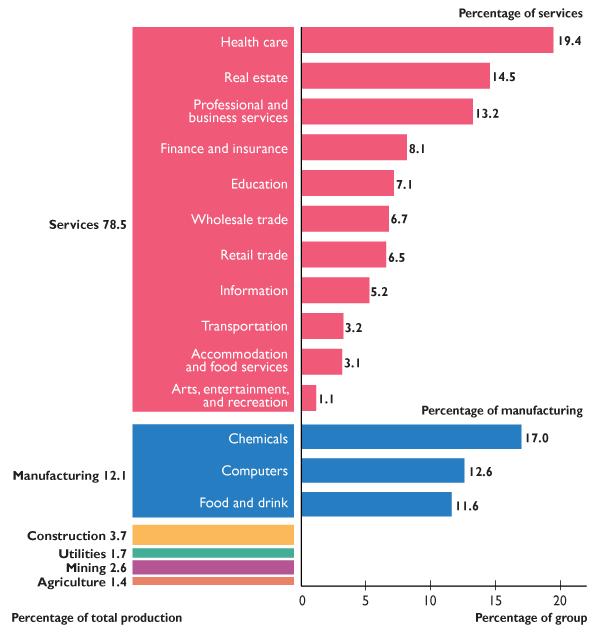
The figure on the next slide shows the relative magnitudes of the goods and services produced in 2015 and shows the major categories of each.
Services are 78.5 percent of total production.
Health services, real estate, and professional and business services are the largest categories.

Manufactured goods are only 12.1 percent of total production.
Chemical, computers, and food and drink are the largest categories.
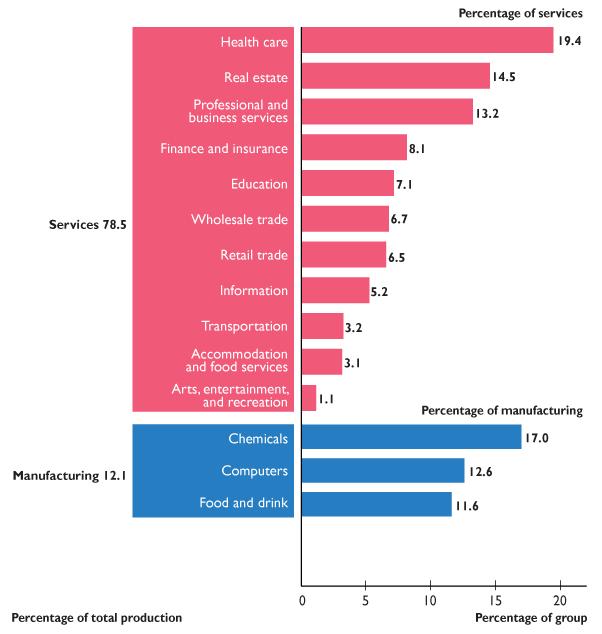
Construction, transportation, utilities, mining, and agriculture are small percentages of total production.

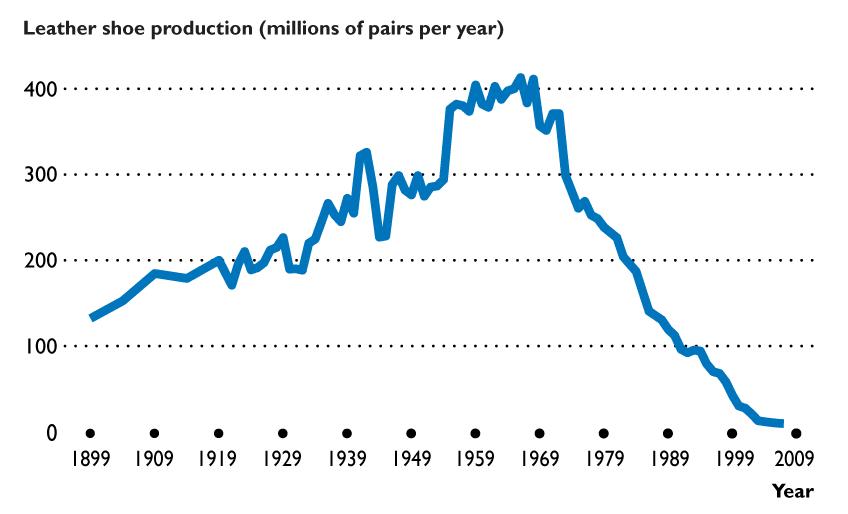
Freeport, Maine, became a shoemaking center in 1881 when the H.E. Davis Shoe Company opened its steampowered factory in the town.
Over the following years, many other shoemakers set up in Freeport and production steadily expanded.
The town’s shoe production peaked in 1968, then it shrank.
When the Freeport Shoe Company closed its factory in 1972─the fifteenth Freeport shoe factory to close in four years. Today, the Freeport economy is based on shopping, not shoes.
The graph tells the story of the U.S. shoe production.

The information economy consists of the jobs and businesses that produce and use computers and equipment powered by computer chips. In each pair of photos, the new technology enables capital to replace labor.


The top pair of images illustrates how the ATM (capital) has replaced many bank tellers (labor).
The bottom pair of images illustrates how a flight check-in machine (capital) has replaced many checkin clerks (labor).
The number of bank teller and airline check-in clerk jobs is shrinking. But new technologies are creating a range of new jobs for people who make, program, install, and repair these new machines.

Big differences exist in how goods and services are produced and the images illustrate three examples.
Laundry services (top), transportation services (center), and highway systems (bottom) can use a large amount of capital and almost no labor (left) or use almost no capital and a large amount of labor (right).
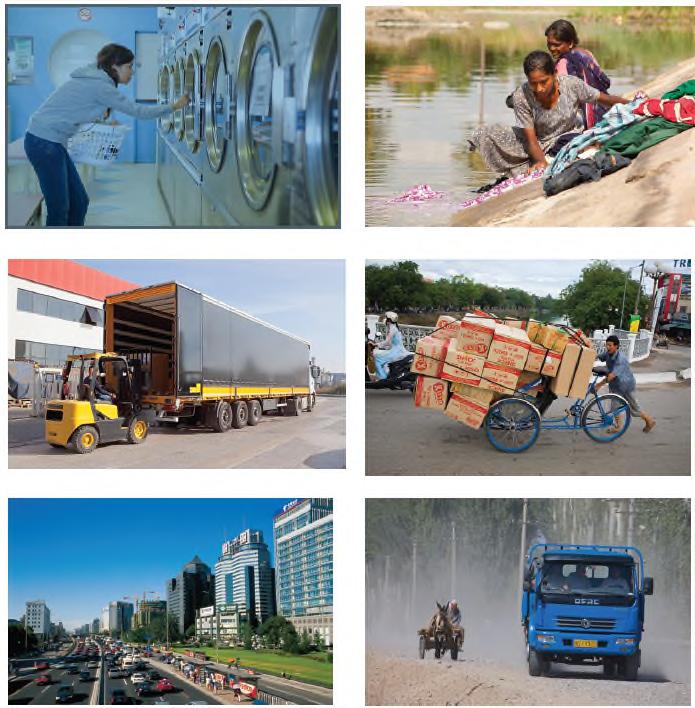
Capital-intensive automatic laundry equipment, big trucks, and multi-lane paved freeways are common in advanced economies but rare in poorer developing economies.
Riverside clothes washing, human pedal power, and unsealed dirt tracks are seen only in developing economies.
But we also see huge differences even within a developing economy.
The bottom pictures contrast Beijing’s capitalintensive highway system with the unpaved and sometimes hazardous roads of rural China.

How can you use the facts and trends about what, how, and for whom goods and services are produced in the U.S. and global economies?
As you think about your future career, you know that a job in manufacturing is likely to be tough. A job in services is more likely to lead to success.
What sort of job will you take?
As you think about the stand you will take on the political question of protecting U.S. jobs, you are better informed.
But how will you vote?

A 100 years ago, the federal government spent 2 cents out of each dollar earned.
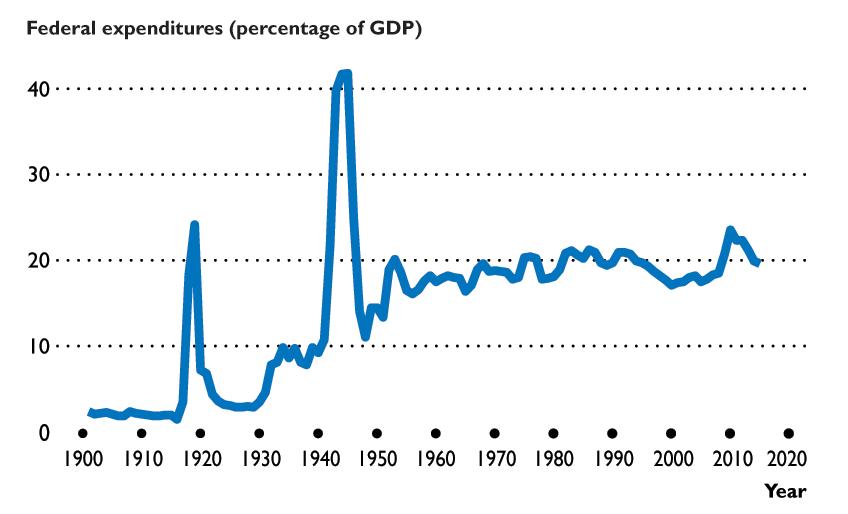
Government grew during two world wars and in the 1960s and 1970s social programs expanded.
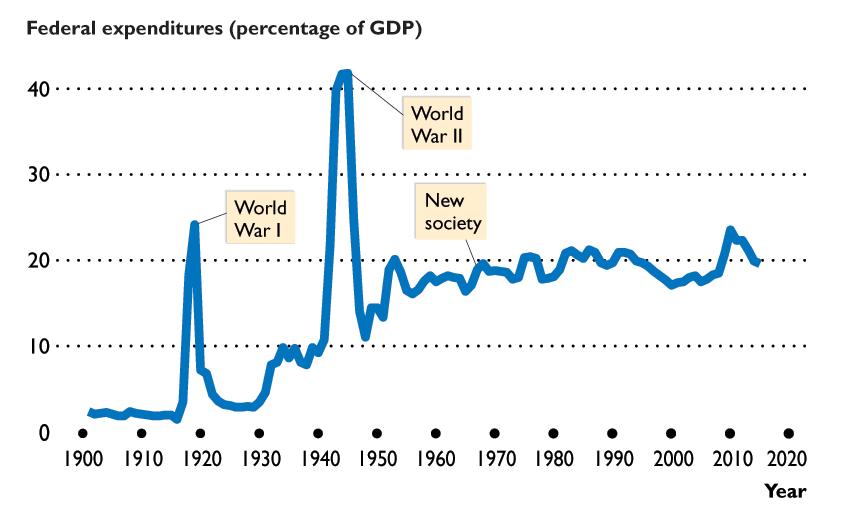
In the 1980s and 1990s, government shrunk.
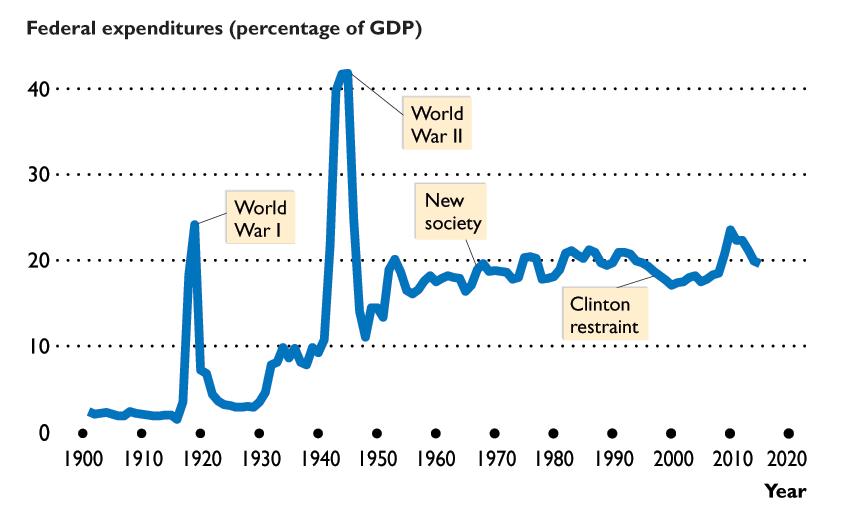
After 9/11, government started to grow again.
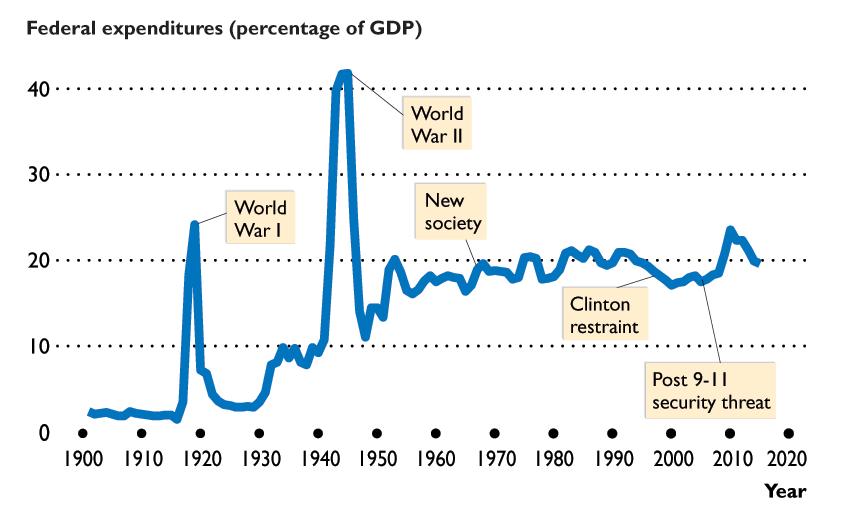
Fiscal stimulus and bailouts sent spending soaring.

International trade expanded rapidly after China became a powerful player in the global economy.
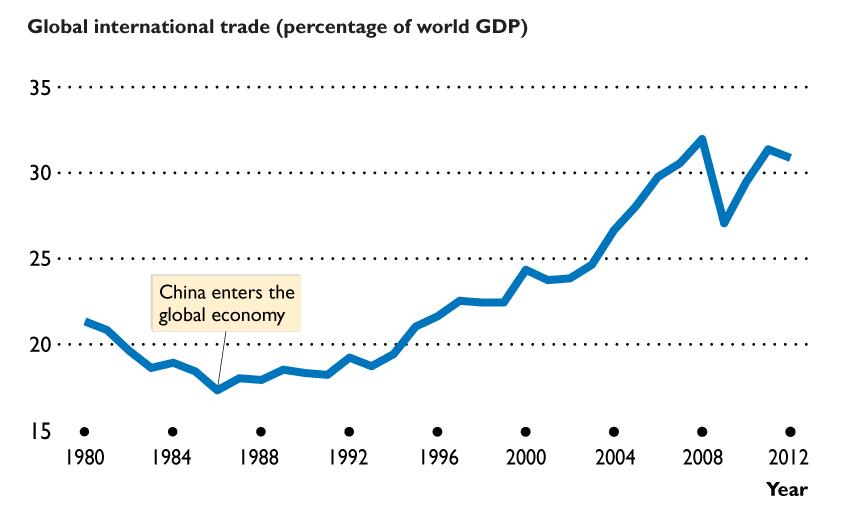
At an average growth rate of close to 7 percent a year, world trade has doubled every decade.
A mini-recession in 2001 slowed the growth in world trade and the 2009 global economic slump reduced world trade.

After the recession in 2009, world trade bounced back to 27 percent of global production, where it remained in 2015.