Chapter 2
GRAPHS AND FUNCTIONS
Section 2.1 Rectangular Coordinates and Graphs
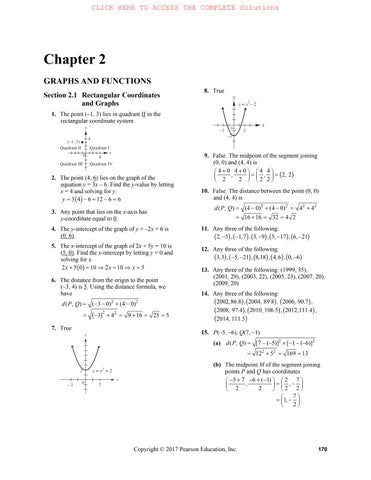
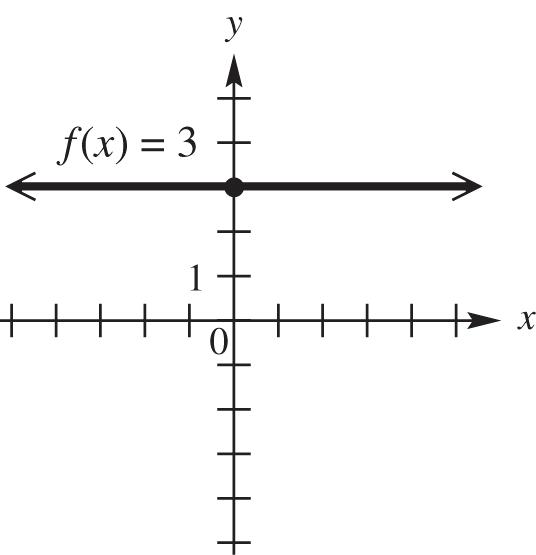
1. The point (–1, 3) lies in quadrant II in the rectangular coordinate system.
2. The point (4, 6) lies on the graph of the equation y = 3x – 6. Find the y-value by letting x = 4 and solving for y
3461266 y
3. Any point that lies on the x-axis has y-coordinate equal to 0.
4. The y-intercept of the graph of y = –2x + 6 is (0, 6).
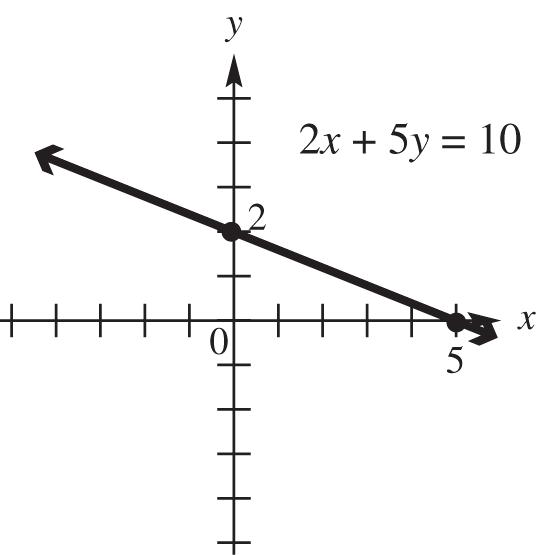
5. The x-intercept of the graph of 2x + 5y = 10 is (5, 0). Find the x-intercept by letting y = 0 and solving for x
250102105
6. The distance from the origin to the point (–3, 4) is 5. Using the distance formula, we have
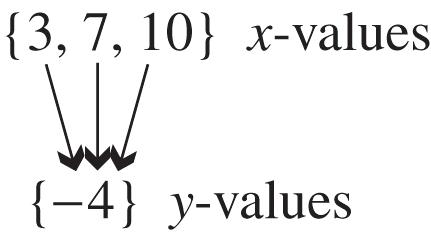
9. False. The midpoint of the segment joining (0, 0) and (4, 4) is
404044 , 2222,2,2.
10. False. The distance between the point (0, 0) and (4, 4) is 2222 (,)(40)(40)44 16163242
11. Any three of the following:
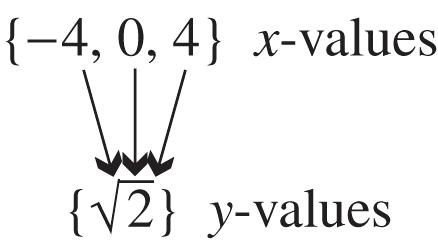
2,5,1,7,3,9,5,17,6,21
12. Any three of the following:
3,3,5,21,8,18,4,6,0,6
13. Any three of the following: (1999, 35), (2001, 29), (2003, 22), (2005, 23), (2007, 20), (2009, 20)
14. Any three of the following:
2002,86.8,2004,89.8,2006,90.7, 2008,97.4,2010,106.5,2012,111.4, 2014,111.5
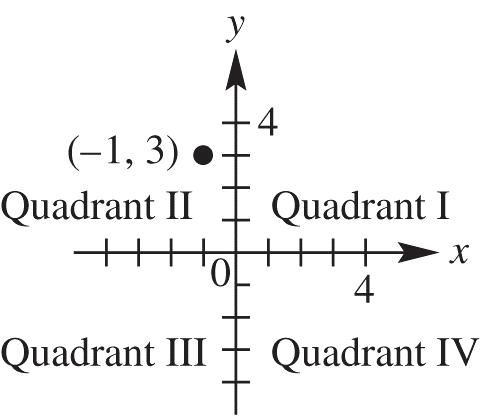
7. True
15. P(–5, –6), Q(7, –1)
(a) 22 22 (,)[7–(–5)][1–(–6)] 12516913 dPQ
(b) The midpoint M of the segment joining points P and Q has coordinates –576(1)27 , , 2222 7 1,. 2
16. P(–4, 3), Q(2, –5)
(a) 22 22 (,)[2–(–4)](–5–3) 6(–8)10010 dPQ
(b) The midpoint M of the segment joining points P and Q has coordinates – 423(–5)22 , , 2222 1,1.
17. (8,2), (3,5) PQ
(a) 22 2 2 (,)(3–8)(5–2) 53 25934 dPQ
(b) The midpoint M of the segment joining points P and Q has coordinates 8325117 , , 2222
18. P ( 8, 4), Q (3, 5)
(a) 2 2 22 (,)3–854 11(–9)12181 202 dPQ
(b) The midpoint M of the segment joining points P and Q has coordinates –834(–5)51 , 2222,.
19. P(–6, –5), Q(6, 10)
(a) 22 22 (,)[6–(–6)][10–(–5)] 1215144225 369341
(b) The midpoint M of the segment joining points P and Q has coordinates – 66–510055 ,,0,. 22222
20. P(6, –2), Q(4, 6)
(a) 22 22 (,)(4–6)[6–(–2)] (–2)8 46468217
(b) The midpoint M of the segment joining points P and Q has coordinates
21. 32, 45, P 2,–5 Q (a)
22 22 (,) 2–32–5–45 –22–55 8125133
(b) The midpoint M of the segment joining points P and Q has coordinates 32245(–5) , 22 423535 222,22,.
22. – 7, 83, 57, –3 PQ (a) 22 22 (,) [57–(–7)](–3–83) (67)(–93)252243 495355 dPQ
(b) The midpoint M of the segment joining points P and Q has coordinates –75783(–3) , 22 477373 , 27, . 222
23. Label the points A(–6, –4), B(0, –2), and C(–10, 8). Use the distance formula to find the length of each side of the triangle.
22 22 (,)[0–(–6)][–2–(–4)] 6236440 dAB 22 22 (,)(–10–0)[8–(–2)] (10)10100100
200 dBC
22 22 (,)[–10–(–6)][8–(–4)] (–4)1216144160 dAC
Because 222 40160200, triangle ABC is a right triangle.
24. Label the points A(–2, –8), B(0, –4), and C(–4, –7). Use the distance formula to find the length of each side of the triangle.
22 22 (,)[0–(–2)][–4–(–8)] 2441620 dAB
dBC
22 22 (,)(–4–0)[–7–(–4)] (–4)(–3)169 255
dAC
22 22 (,)[–4–(–2)][–7–(–8)] (–2)1415
Because 222 (5)(20)520255, triangle ABC is a right triangle.
25. Label the points A(–4, 1), B(1, 4), and C(–6, –1).
22 22 (,)[1–(–4)](4–1) 5325934 dAB
dBC
22 22 (,)(–6–1)(–1–4) (–7)(–5)492574
dAC
22 22 (,)[–6–(–4)](–1–1) (–2)(–2)448
Because 222 (8)(34)(74) because 8344274, triangle ABC is not a right triangle.
26. Label the points A(–2, –5), B(1, 7), and C(3, 15).
dAB
22 22 (,)[1(2)][7(5)] 3129144153
dBC
22 22 (,)(31)(157) 2846468
dAC
22 22 (,)[3(2)][15(5)] 52025400425
Because 2 22 (68)(153)425 because 68153221425 , triangle ABC is not a right triangle.
27. Label the points A(–4, 3), B(2, 5), and C(–1, –6).
dAB
2 2 22 (,)2––453 6236440
dBC
dAC
2 2 2 2 (,)–1––463 3998190
Because 222 4090130, triangle
ABC is a right triangle.
dAB
28. Label the points A(–7, 4), B(6, –2), and C(0, –15). 2 2 2 2 (,)6––724 136 16936205
dBC
2 2 22 (,)06–15––2 –6–13 36169205
dAC
2 2 2 2 (,)0––7154 71949361410
Because
222 205205410, triangle ABC is a right triangle.
29. Label the given points A(0, –7), B(–3, 5), and C(2, –15). Find the distance between each pair of points.
2 2 2 2 (,)305––7 –3129144 153317 dAB
dBC
2 2 2 2 (,)2–3–15–5 5–2025400 425517
2 2 2 2 (,)2015–7 2–868217 dAC
22 22 (,)1265 (–3)(–11) 9121130
Because (,)(,)(,) dABdACdBC or 317217517, the points are collinear.
30. Label the points A(–1, 4), B(–2, –1), and C(1, 14). Apply the distance formula to each pair of points.
2 2 22 (,)–2––1–1–4 –1–526
dBC
dAB 22 22 (,)1––214––1 315234326
dAC
2 2 22 (,)1––114–4 210104226
Because 26226326 , the points are collinear.
31. Label the points A(0, 9), B(–3, –7), and C(2, 19).
dAB
22 22 (,)(–3–0)(–7–9) (–3)(–16)9256 26516.279
dBC
22 22 (,)2––319––7 52625676 70126.476
dAC
22 22 (,)2–019–9 2104100 10410.198
Because (,)(,)(,) dABdACdBC or 265104701 16.27910.19826.476, 26.47726.476, the three given points are not collinear. (Note, however, that these points are very close to lying on a straight line and may appear to lie on a straight line when graphed.)
32. Label the points A(–1, –3), B(–5, 12), and C(1, –11).
22 2 2 (,)–5––112––3 – 41516225 24115.5242
Because d(A,B) + d(A,C) d(B,C) or 24168565 15.52428.246223.7697 23.770423.7697, the three given points are not collinear. (Note, however, that these points are very close to lying on a straight line and may appear to lie on a straight line when graphed.)
33. Label the points A(–7, 4), B(6,–2), and C(–1,1).
dAB
2 2 2 2 (,)6––724 13616936 20514.3178
2 2 2 2 (,)161–2 73499 587.6158 dBC
2 2 2 2 (,)1––714 6–3369 456.7082
Because d(B,C) + d(A,C) d(A,B) or 5845205
7.61586.708214.3178 14.324014.3178, the three given points are not collinear. (Note, however, that these points are very close to lying on a straight line and may appear to lie on a straight line when graphed.)
34. Label the given points A(–4, 3), B(2, 5), and C(–1, 4). Find the distance between each pair of points.
2 2 (,)2––4536222 36440210 dAB
dBC
22 2 2 (,)(12)(45) 3(–1)9110
2 2 22 (,)1–443 319110 dAC
Because (,)(,)(,) dBCdACdAB or 1010210, the points are collinear.
35. Midpoint (5, 8), endpoint (13, 10) 1310 5and8 22 1310and1016 –3and6. xy xy xy
The other endpoint has coordinates (–3, 6).
36. Midpoint (–7, 6), endpoint (–9, 9) –99 –7and6 22 –9–14and912 –5and3. xy
The other endpoint has coordinates (–5, 3).
37. Midpoint (12, 6), endpoint (19, 16) 1916 12and6 22 1924and1612 5and–4. xy xy xy
The other endpoint has coordinates (5, –4).
38. Midpoint (–9, 8), endpoint (–16, 9) –169 –9and8 22 –16–18and916 –2and7 xy xy xy
The other endpoint has coordinates (–2, 7).
39. Midpoint (a, b), endpoint (p, q) and 22 2and2 2and2 pxqyab pxaqyb xapybq
The other endpoint has coordinates (2,2) apbq
40. Midpoint
6,6ab , endpoint
3,5ab 35 6and6 22 312and512 9and7 axbyab axabyb xayb
The other endpoint has coordinates (9a, 7b
41. The endpoints of the segment are (1990, 21.3) and (2012, 30.1).
1990201221.330.9 , 22 2001,26.1 M
The estimate is 26.1%. This is very close to the actual figure of 26.2%.
42. The endpoints are (2006, 7505) and (2012, 3335)
2006201275053335 , 22 2009,5420
According to the model, the average national advertising revenue in 2009 was $5420 million. This is higher than the actual value of $4424 million.
43. The points to use are (2011, 23021) and (2013, 23834). Their midpoint is 2011201323,02123,834 , 22 (2012,23427.5).
In 2012, the poverty level cutoff was approximately $23,428.
44. (a) To estimate the enrollment for 2003, use the points (2000, 11,753) and (2006, 13,180)
2000200611,75313,180 , 22 2003,12466.5
The enrollment for 2003 was about 12,466.5 thousand.
(b) To estimate the enrollment for 2009, use the points (2006, 13,180) and (2012, 14,880)
2006201213,18014,880 , 22 2009,14030 M
The enrollment for 2009 was about 14,030 thousand.
45. The midpoint M has coordinates 1212 , .
(continued)
this shows (,)(,)(,) dPMdMQdPQ and (,)(,). dPMdMQ
46. The distance formula, 22 2121 (–)(–),dxxyy can be written as 221/2 2121 [(–)(–)].dxxyy
In exercises 47 58, other ordered pairs are possible.
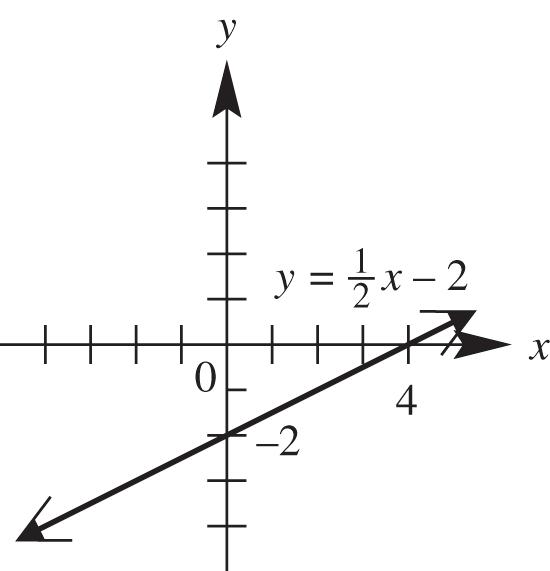
47. (a) x y 0 2 y-intercept: 1 2 0 022 x y
4 0 x-intercept: 1 2 1 2 0 02 24 y x xx
2 1 additional point
(b)
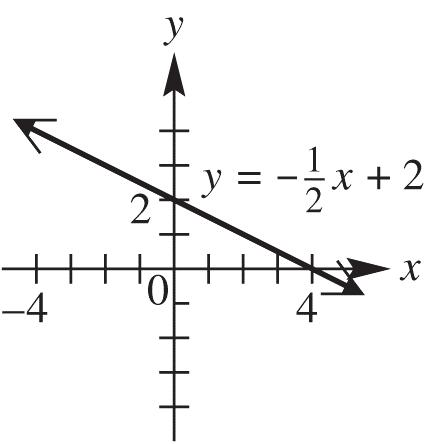
48. (a) x y 0 2 y-intercept: 0 1 022 2 x y
4 0 x-intercept: 0 1 02 2 1 24 2 y x xx
2 1 additional point
(b)
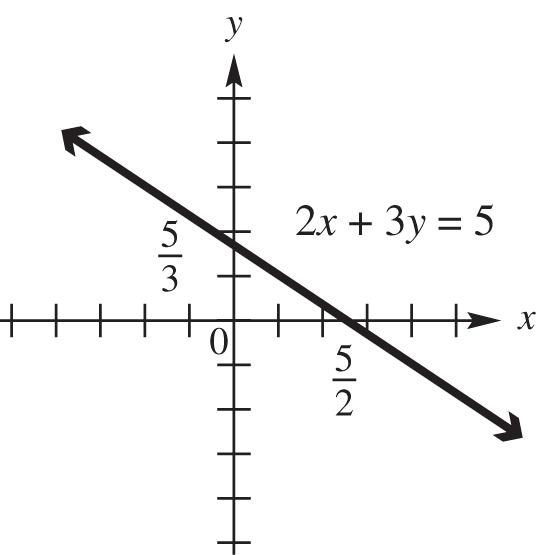
49. (a) x y 0 5 3 y-intercept: 5 3 0 2035 35 x y yy 5 2 0 x-intercept: 5 2 0 2305 25 y x xx 4 1 additional point
(b)
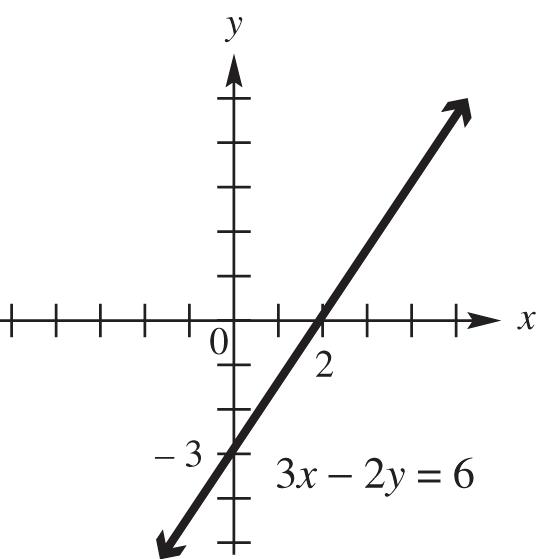
50. (a) x y
0 3 y-intercept: 0 3026 263 x y yy
2 0 x-intercept: 0 3206 362 y x xx
4 3 additional point
(b)
51. (a) x y 0 0 x- and y-intercept: 002
1 1 additional point
2 4 additional point (b)
52. (a) x y 0 2 y-intercept: 2 0 02 022 x y yy
1 3 additional point
2 6 additional point no x-intercept: 2 2 002 22 yx xx
53. (a) x y 3 0 x-intercept: 0 03 033 y x xx
4 1 additional point
7 2 additional point no y-intercept: 0033xyy
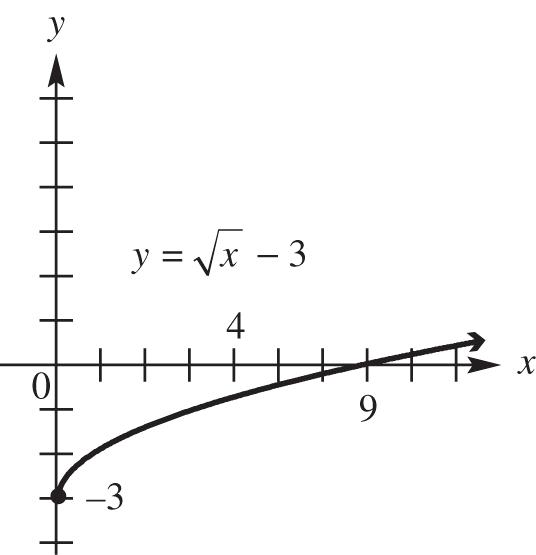
54. (a) x y 0 3 y-intercept: 0 03 033 x y yy
4 1 additional point
9 0 x-intercept: 0 03 39 y x xx (b)
Copyright © 2017 Pearson Education, Inc.
55. (a) x y
0 2 y-intercept: 0 02 22 x y yy
2 0 x-intercept: 0 02 022 y x xx
2 4 additional point
4 2 additional point
(b)
56. (a) x y 2 2 additional point
4 0 x-intercept: 0 04 04 044 y x x xx
0 4 y-intercept: 0 04 44 x y yy
(b)
57. (a) x y
0 0 x- and y-intercept: 003
1 1 additional point
2 8 additional point
(b)
58. (a) x y 0 0 x- and y-intercept: 003 1 1additional point 2 8additional point
(b)
59. Points on the x-axis have y-coordinates equal to 0. The point on the x-axis will have the same x-coordinate as point (4, 3). Therefore, the line will intersect the x-axis at (4, 0).
60. Points on the y-axis have x-coordinates equal to 0. The point on the y-axis will have the same y-coordinate as point (4, 3). Therefore, the line will intersect the y-axis at (0, 3).
61. Because (a, b) is in the second quadrant, a is negative and b is positive. Therefore, (a, – b) will have a negative x–coordinate and a negative y-coordinate and will lie in quadrant III.
(–a, b) will have a positive x-coordinate and a positive y-coordinateand will lie in quadrant I. (–a, – b) will have a positive x-coordinate and a negative y-coordinate and will lie in quadrant IV.
(b, a) will have a positive x-coordinate and a negative y-coordinate and will lie in quadrant IV.
62. Label the points (2,2),A (13,10), B (21,5), C and (6,13). D To determine which points form sides of the quadrilateral (as opposed to diagonals), plot the points.
Use the distance formula to find the length of each side.
dBC
dDA
2 2 2 2 (,)26213 815 6422528917
Because all sides have equal length, the four points form a rhombus.
63. To determine which points form sides of the quadrilateral (as opposed to diagonals), plot the points.
Use the distance formula to find the length of each side.
22 22 (,)5121 4116117
22 2 2 (,)3542 22448 dBC
dCD
22 22 (,)1334 41 16117
2 2 2 2 (,)1113 22448
Because d(A, B) = d(C, D) and d(B, C) = d(D, A), the points are the vertices of a parallelogram. Because d(A, B) ≠ d(B, C), the points are not the vertices of a rhombus.
64. For the points A(4, 5) and D(10, 14), the difference of the x-coordinates is 10 – 4 = 6 and the difference of the y-coordinates is 14 – 5 = 9. Dividing these differences by 3, we obtain 2 and 3, respectively. Adding 2 and 3 to the x and y coordinates of point A, respectively, we obtain B(4 + 2, 5 + 3) or B(6, 8).
Adding 2 and 3 to the x- and y- coordinates of point B, respectively, we obtain C(6 + 2, 8 + 3) or C(8, 11). The desired points are B(6, 8) and C(8, 11).
We check these by showing that d(A, B) = d(B, C) = d(C, D) and that d(A, D) = d(A, B) + d(B, C) + d(C, D).
dAB
dBC
22 22 22 22 (,)6485 234913 (,)86118 234913
dCD dAD
22 22 22 22 (,)1081411 234913 (,)104145 693681 1179(13)313
d(A, B), d(B, C), and d(C, D) all have the same measure and d(A, D) = d(A, B) + d(B, C) + d(C, D) Because 313131313.
Copyright © 2017 Pearson Education, Inc.
Section 2.2 Circles
1. The circle with equation 22 49 xy has center with coordinates (0, 0) and radius equal to 7.
2. The circle with center (3, 6) and radius 4 has equation 2 3616.xy
3. The graph of 22 479xy has center with coordinates (4, –7).
4. The graph of 2 2 59 xy has center with coordinates (0, 5).
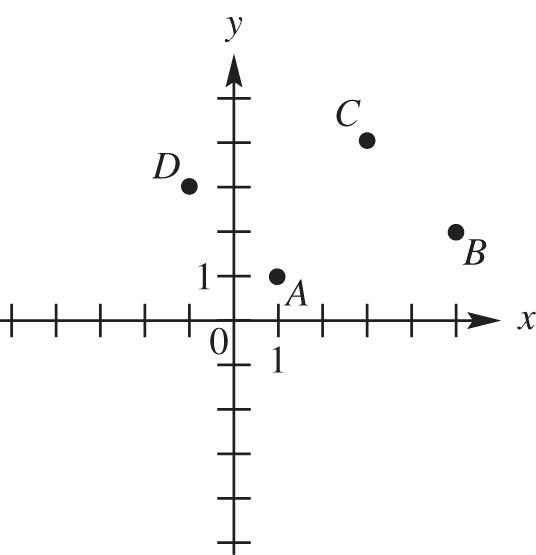
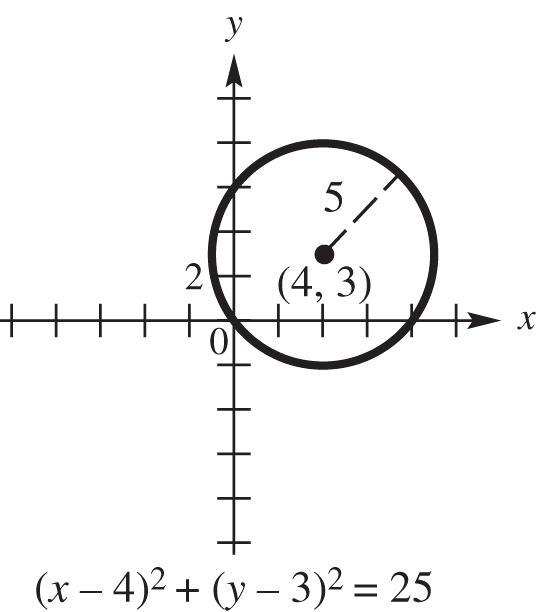
5. This circle has center (3, 2) and radius 5. This is graph B.
6. This circle has center (3, –2) and radius 5. This is graph C.
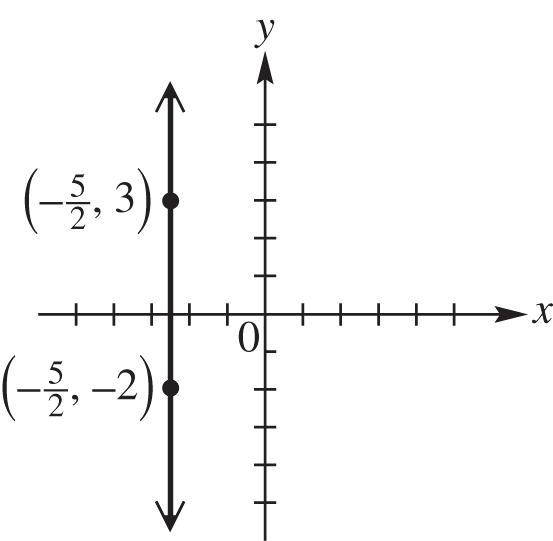
7. This circle has center (–3, 2) and radius 5. This is graph D.
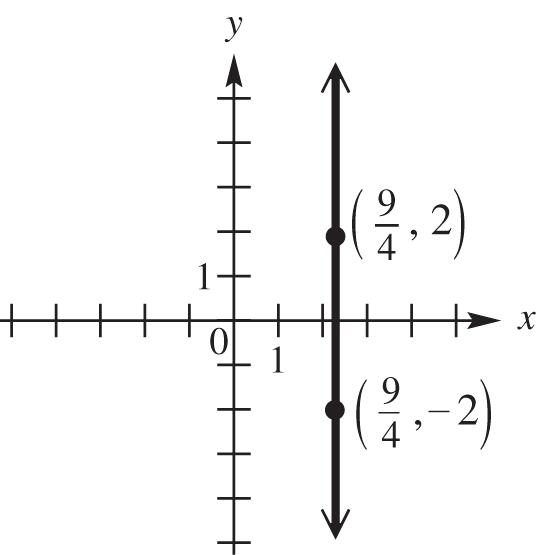
8. This circle has center (–3, –2) and radius 5. This is graph A.
9. The graph of 22 0 xy has center (0, 0) and radius 0. This is the point (0, 0). Therefore, there is one point on the graph.
10. 100 is not a real number, so there are no points on the graph of 22 100. xy
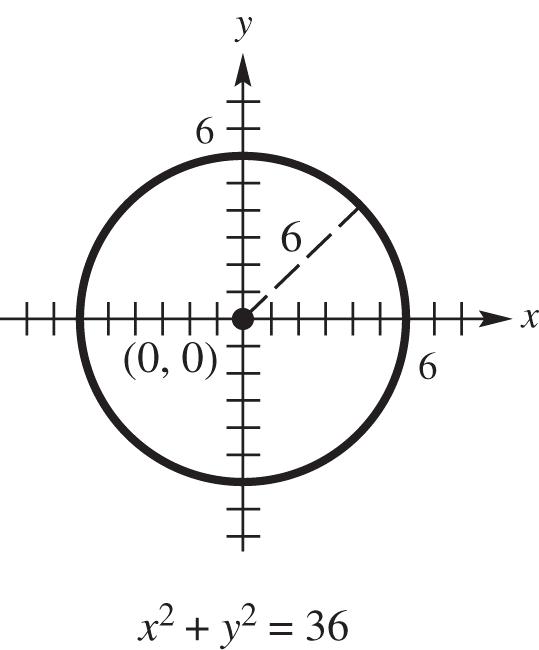
11. (a) Center (0, 0), radius 6
22 22 222 006 00636 xy xyxy (b)
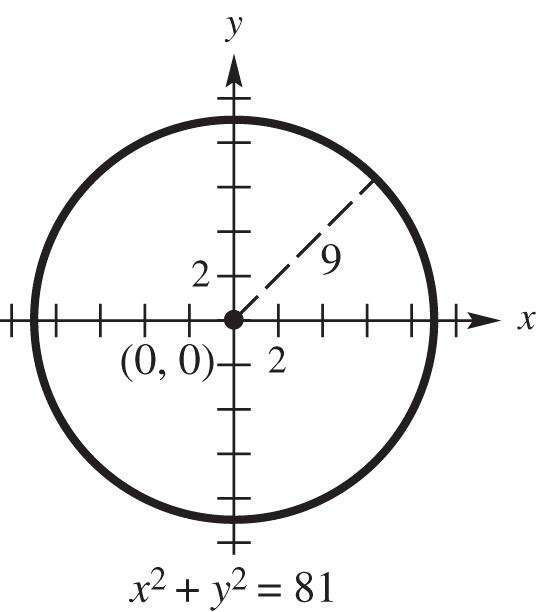
12. (a) Center (0, 0), radius 9
22 22 222 009 00981 xy
(b)
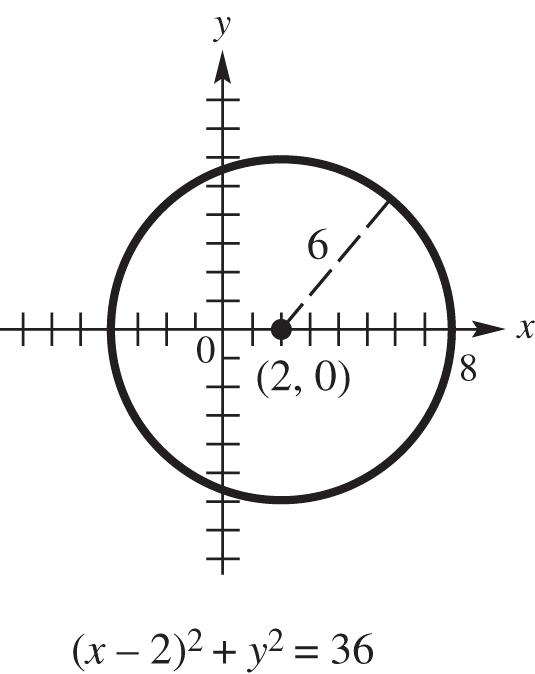
13. (a) Center (2, 0), radius 6
22 22 2 22 206 206 (–2)36 xy xy xy
14. (a) Center (3, 0), radius 3
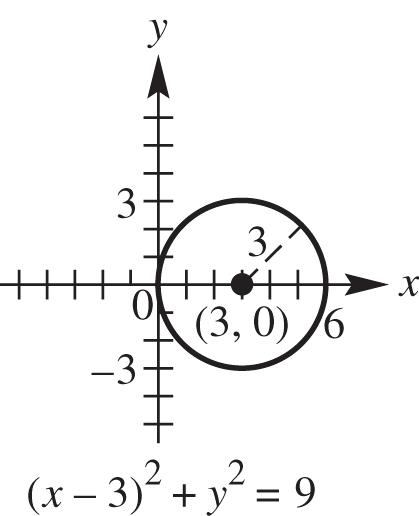
22 2 2 303 39 xy xy (b)
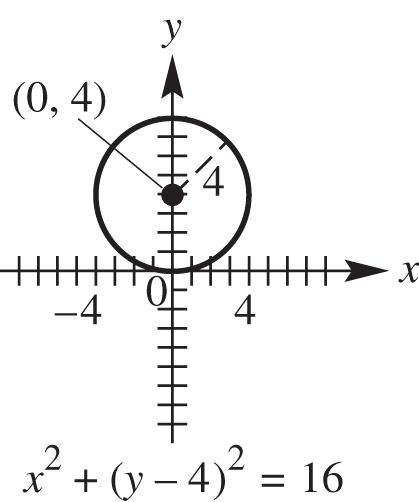
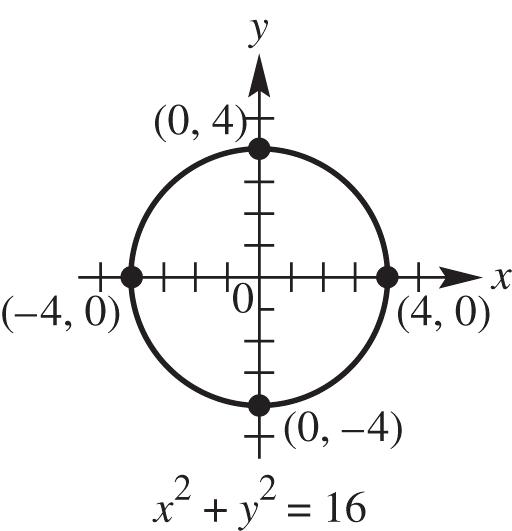
15. (a) Center (0, 4), radius 4 22 2 2 044 416 xy xy (b)
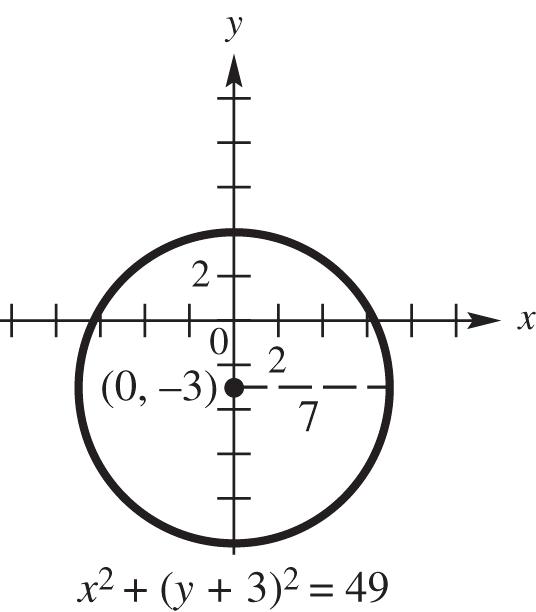
16. (a) Center (0, –3), radius 7
2 2 2 2 2 22 037 037 (3)49 xy xy xy
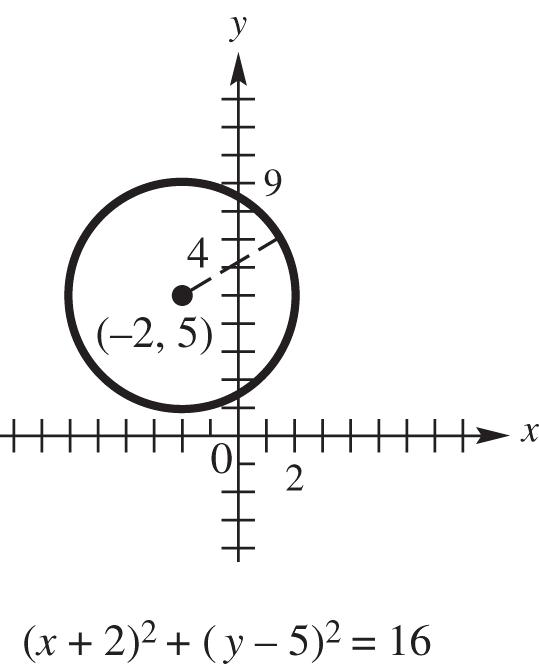
17. (a) Center (–2, 5), radius 4 2 2 222 22 254 [–(–2)](–5)4 (2)(–5)16 xy xy xy
18. (a) Center (4, 3), radius 5
22 22 2 22 435 435 4325 xy xy xy
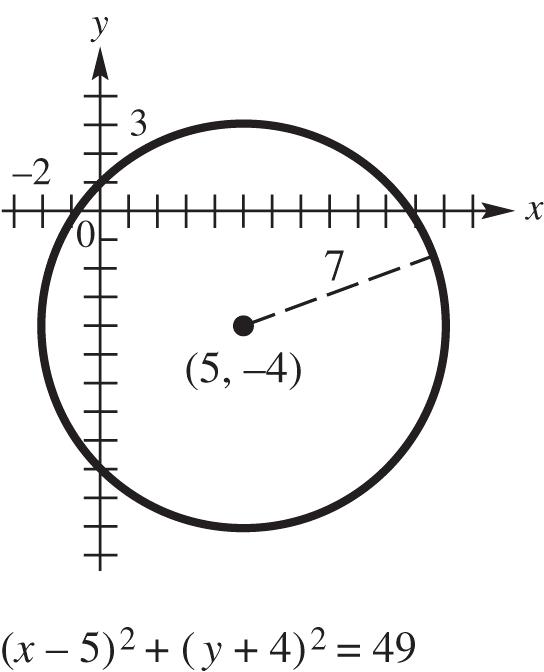
19. (a) Center (5, –4), radius 7
2 2 222 22 547 (–5)[–(–4)]7 (–5)(4)49 xy xy xy
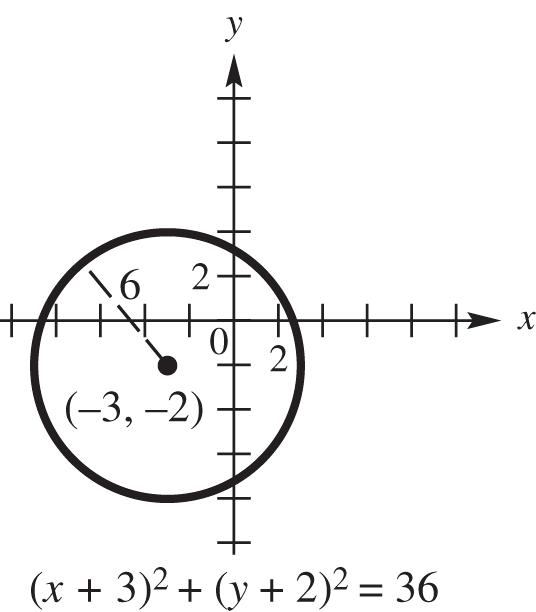
20. (a) Center (–3, –2), radius 6
22 22 2 22 326 326 (3)(2)36 xy xy xy
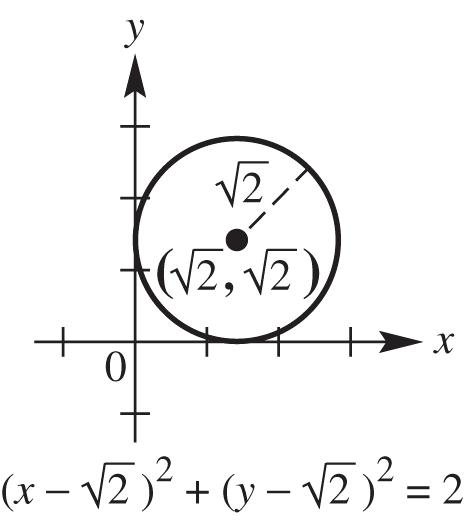
21. (a) Center 2,2 , radius 2
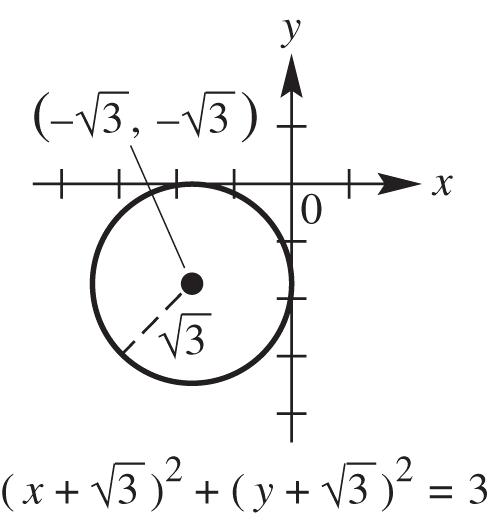
22. (a) Center 3,3 , radius 3
(b)
23. (a) The center of the circle is located at the midpoint of the diameter determined by the points (1, 1) and (5, 1). Using the midpoint formula, we have
1511 22,3,1 C
. The radius is one-half the length of the diameter:
The equation of the circle is 22 314xy
(b) Expand 22 314xy to find the equation of the circle in general form:
24. (a) The center of the circle is located at the midpoint of the diameter determined by the points ( 1, 1) and ( 1, 5). Using the midpoint formula, we have
1(1)1(5),1,2. 22 C
The radius is one-half the length of the diameter:
The equation of the circle is
22 129xy
(b) Expand
22 129xy to find the equation of the circle in general form:
25. (a) The center of the circle is located at the midpoint of the diameter determined by the points ( 2, 4) and ( 2, 0). Using the midpoint formula, we have 2(2)40,2,2. 22 C
The radius is one-half the length of the diameter:
2 2 1 22402 2 r
The equation of the circle is 22 224xy
(b) Expand 22 224xy to find the equation of the circle in general form:
22 22 22 224 44444 4440 xy xxyy xyxy
26. (a) The center of the circle is located at the midpoint of the diameter determined by the points (0, 3) and (6, 3). Using the midpoint formula, we have
063(3),3,3 22 C
.
The radius is one-half the length of the diameter:
2 2 1 60333 2 r
The equation of the circle is 22 339xy
(b) Expand 22 339xy to find the equation of the circle in general form: 22 22 22 339 69699 6690 xy xxyy xyxy
27. 22 6890xyxy
Complete the square on x and y separately.
22 22 22 68–9 69816–9916 3416 xxyy xxyy xy
Yes, it is a circle. The circle has its center at (–3, –4) and radius 4.
28. 22 8–6160xyxy
Complete the square on x and y separately.
22 22 22 8–616 816–69–16169 4–39 xxyy xxyy xy
Yes, it is a circle. The circle has its center at (–4, 3) and radius 3.
29. 22 4124xyxy
Complete the square on x and y separately.
22 22 22 –412–4 – 441236–4436 –2636 xxyy xxyy xy
Yes, it is a circle. The circle has its center at (2, –6) and radius 6.
30. 22 – 1210–25xyxy
Complete the square on x and y separately.
22 22 22 – 1210–25 –12361025 – 253625 –6536
Yes, it is a circle. The circle has its center at (6, –5) and radius 6.
31. 22 444–16–190 xyxy
Complete the square on x and y separately.
Yes, it is a circle with center
32. 22 9912–18–230
Complete the square on x and y separately.
Yes, it is a circle with center 2 3 ,1 and radius 2.
33. 22 2–6140xyxy
Complete the square on x and y separately.
22 22 22 2–6–14 21–69–1419 1–3–4 xxyy xxyy xy
The graph is nonexistent.
34. 22 4–8320xyxy
Complete the square on x and y separately.
22 22 22 4–8–32 44–816 – 32416 2–4–12 xxyy xxyy xy
The graph is nonexistent.
35. 22 66180xyxy
Complete the square on x and y separately.
22 22 22 6618 69691899 330 xxyy xxyy xy
The graph is the point (3, 3).
36. 22 4480xyxy
Complete the square on x and y separately.
22 22 22 448 4444844 220 xxyy xxyy xy
The graph is the point ( 2, 2).
37. 22 9966230 xyxy
Complete the square on x and y separately.
22 2222 33 2 22 23 212111 3939999 222 255 11 3393 969623 9923 xxyy xxyy xxyy xy
Yes, it is a circle with center 11 33 , and radius 5 3
38. 22 444470 xyxy
Complete the square on x and y separately.
Yes, it is a circle with center 11 22 , and radius 3 2
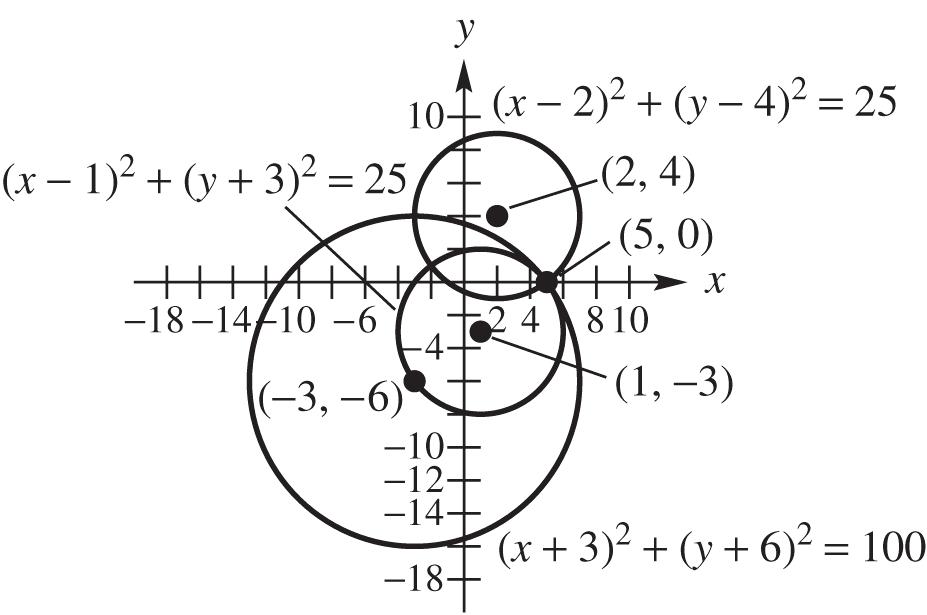
39. The equations of the three circles are 22 (7)(4)25 xy , 22 (9)(4)169 xy , and 22 (3)(9)100 xy . From the graph of the three circles, it appears that the epicenter is located at (3, 1).
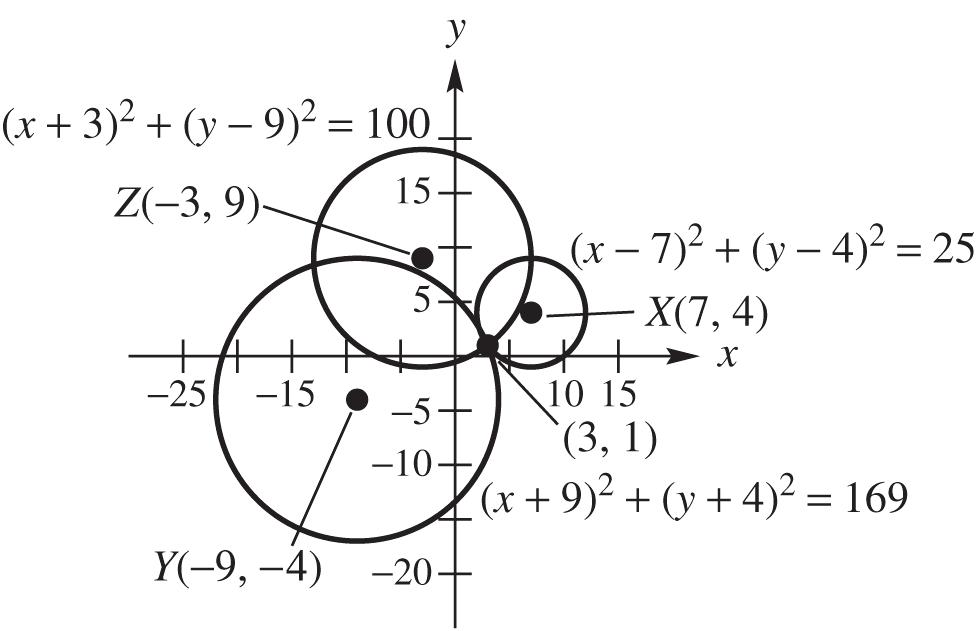
Check algebraically: 22 22 22 (7)(4)25 (37)(14)25 43252525
xy
22 22 22 (9)(4)169 (39)(14)169 125169169169
xy
22 22 22 (3)(9)100 (33)(19)100 6(8)100100100
xy
(3, 1) satisfies all three equations, so the epicenter is at (3, 1).
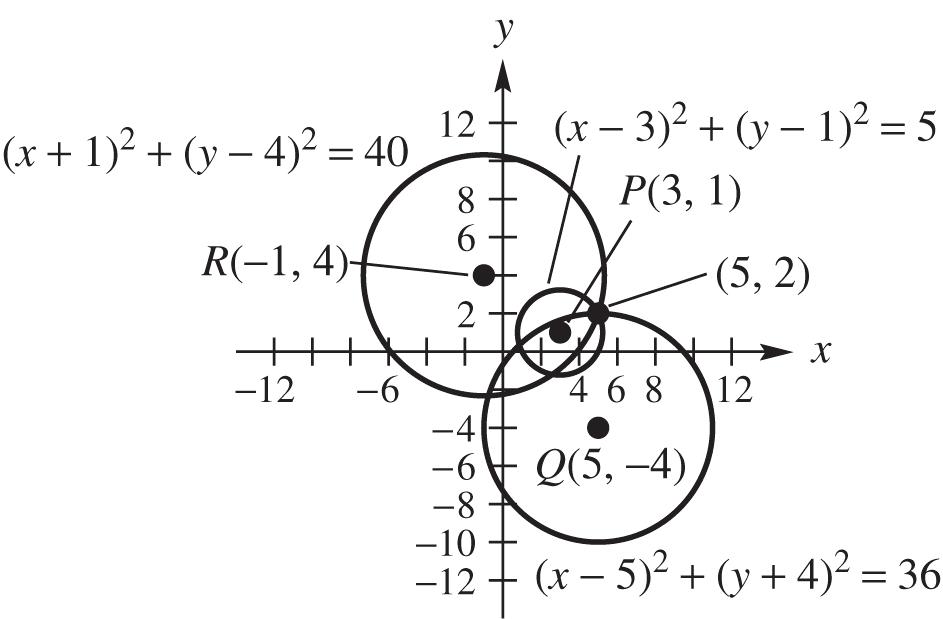
40. The three equations are 22 (3)(1)5 xy , 22 (5)(4)36 xy , and 22 (1)(4)40 xy . From the graph of the three circles, it appears that the epicenter is located at (5, 2).
Check algebraically: 22 22 22 (3)(1)5 (53)(21)5 21555
xy 22 22 2 (5)(4)36 (55)(24)36 6363636
xy
22 22 22 (1)(4)40 (51)(24)40 6(2)404040 xy
(5, 2) satisfies all three equations, so the epicenter is at (5, 2).
41. From the graph of the three circles, it appears that the epicenter is located at ( 2, 2).
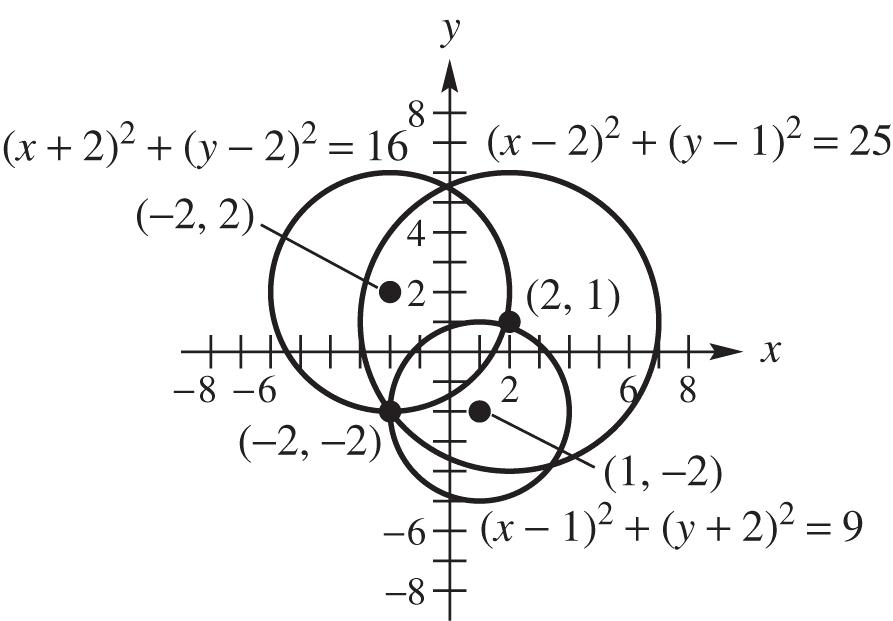
Check algebraically: 22 22 22 (2)(1)25 (22)(21)25 (4)(3)25 2525
xy 22 22 22 (2)(2)16 (22)(22)16 0(4)16 1616
xy
xy 22 22 22 (1)(2)9 (21)(22)9 (3)09 99
( 2, 2) satisfies all three equations, so the epicenter is at ( 2, 2).
42. From the graph of the three circles, it appears that the epicenter is located at (5, 0).
Check algebraically: 22
xy
22 22 (2)(4)25 (52)(04)25 3(4)25 2525
22 22 2 2 2 1316 129616 281016 2860 430 xx xxxx xx xx xx
To solve this equation, we can use the quadratic formula with a = 1, b = –4, and c = –3.
2 44413 21 41612428 22 427 27 2 x
xy
22 22 22 (1)(3)25 (51)(03)25 4325 2525
xy
22 22 22 (3)(6)100 (53)(06)100 86100 100100
(5, 0) satisfies all three equations, so the epicenter is at (5, 0).
43. The radius of this circle is the distance from the center C(3, 2) to the x-axis. This distance is 2, so r = 2.
222 22 (–3)(–2)2 (–3)(–2)4 xy xy
44. The radius is the distance from the center C(–4, 3) to the point P(5, 8).
22 22 [5–(–4)](8–3) 95106 r
The equation of the circle is 222 23 [–(–4)](–3)(106) (4)(–3)106 xy xy
45. Label the points P(x, y) and Q(1, 3).
If (, )4 dPQ , 22 134 xy
22 1316. xy
If x = y, then we can either substitute x for y or y for x. Substituting x for y we solve the following:
Because x = y, the points are
27, 27 and 2–7, 27.
46. Let P(–2, 3) be a point which is 8 units from Q(x, y). We have
22 (,)238 dPQxy 22 2364. xy
Because x + y = 0, x = –y. We can either substitute x for y or y for x. Substituting x for y we solve the following:
2 2 22 22 2 2 2364 2364 449664 2101364 210510 xx xx xxxx xx xx
To solve this equation, use the quadratic formula with a = 2, b = 10, and c = –51.
2 10104251 22 10100408 4 104127 10508 44 1021275127 42 x
Because yx the points are 51275127 , 22 and –51275127 , . 22
Copyright © 2017 Pearson Education, Inc.
47. Let P(x, y) be a point whose distance from A(1, 0) is 10 and whose distance from B(5, 4) is 10 . d(P, A) = 10 , so
22 (1)(0)10 xy
22 (1)10. xy (,)10, so dPB
22 (5)(4)10 xy
22 (5)(4)10. xy Thus, 2222 22 22 (1)(5)(4) 12 2510168 1241108 8408 5 xyxy xxy xxyy xxy yx yx
Substitute 5 – x for y in the equation 22 (1)10 xy and solve for x 22 22 22 2 (1)(5)10 12251010 2122610212160
680(2)(4)0 20or40 2or4 xx xxxx xxxx xxxx xx xx
To find the corresponding values of y use the equation y = 5 – x. If x = 2, then y = 5 – 2 = 3. If x = 4, then y = 5 – 4 = 1. The points satisfying the conditions are (2, 3) and (4, 1).
48. The circle of smallest radius that contains the points A(1, 4) and B(–3, 2) within or on its boundary will be the circle having points A and B as endpoints of a diameter. The center will be M, the midpoint:
13 4226 , , 2222
( 1, 3).
The radius will be the distance from M to either A or B:
The equation of the circle is
49. Label the points A(3, y) and B(–2, 9).
If d(A, B) = 12, then
22 22 22 2 2 2 23912 5912 5912 258118144 18380 y y y yy yy
Solve this equation by using the quadratic formula with a = 1, b = –18, and c = –38:
2 18184138 21 1832415218476 212 y
184119 182119 9119 22
The values of y are 9119 and 9119
50. Because the center is in the third quadrant, the radius is 2 , and the circle is tangent to both axes, the center must be at (2, 2).
Using the center-radius of the equation of a circle, we have
51. Let P(x, y) be the point on the circle whose distance from the origin is the shortest. Complete the square on x and y separately to write the equation in center-radius form: 22 22 22 1614880 16641449 886449 (8)(7)25 xxyy xxyy xy
So, the center is (8, 7) and the radius is 5.
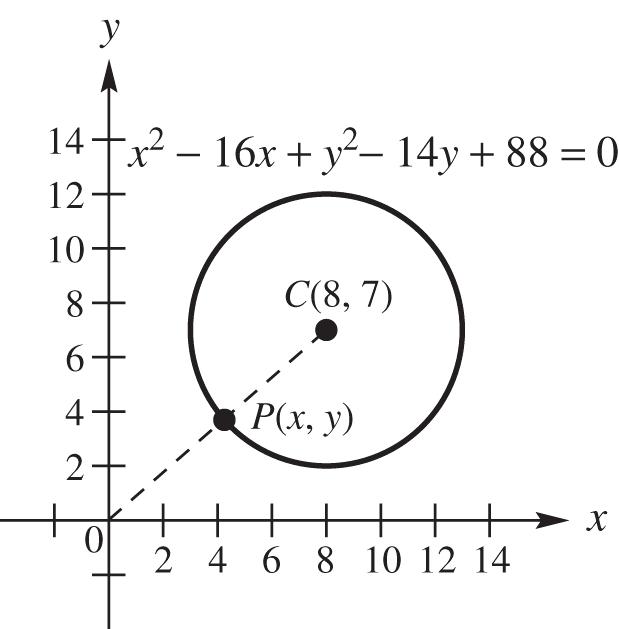
22 (,)87113dCO . Because the length of the radius is 5, (,)1135dPO
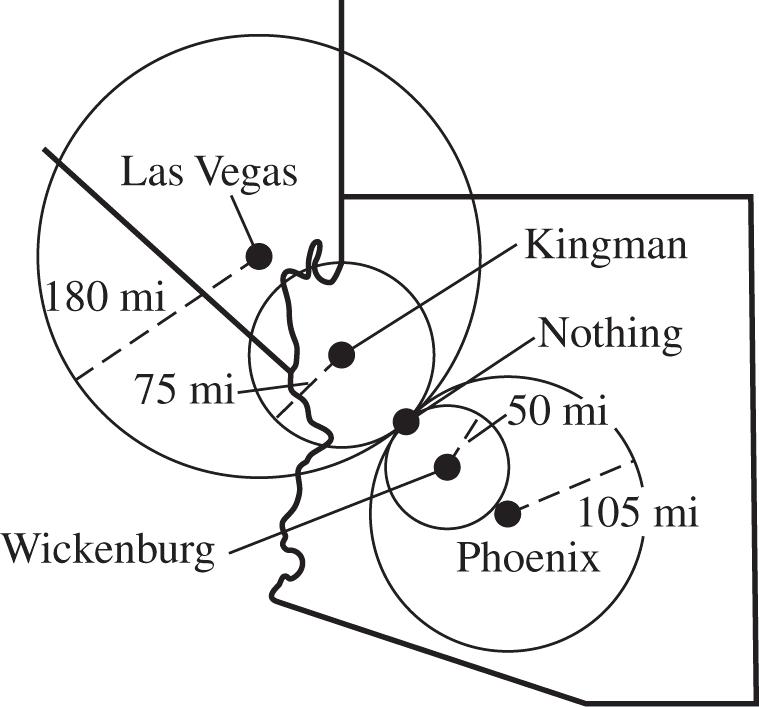
52. Using compasses, draw circles centered at Wickenburg, Kingman, Phoenix, and Las Vegas with scaled radii of 50, 75, 105, and 180 miles respectively. The four circles should intersect at the location of Nothing.
53. The midpoint M has coordinates
3–9 –1+546 , , (2, –3).
54. Use points C(2, –3) and P(–1, 3).
2 2 2 2 (,)–1–23––3 –36936 4535
The radius is 35.
55. Use points C(2, –3) and Q(5, –9).
2 2 2 2 (,)5–2–9––3 3–6936 4535
The radius is 35.
56. Use the points P(–1, 3) and Q(5, –9).
Because 2 2 (,)5––1–9–3dPQ
2 2 6–1236144180
65 ,the radius is 1 (,). 2 dPQ Thus
1 6535. 2 r
57. The center-radius form for this circle is 222 (–2)(3)(35) xy 22 (–2)(3)45. xy
58. Label the endpoints of the diameter P(3, –5) and Q(–7, 3). The midpoint M of the segment joining P and Q has coordinates 3(–7)–534–2,,(–2, –1). 2222
The center is C(–2, –1). To find the radius, we can use points C(–2, –1) and P(3, –5)
dCP
22 2 2 (,)3––2–5––1 5–4251641
We could also use points C(–2, –1).and Q(–7, 3). 22 2 2 (,)7––23––1 54251641 dCQ
We could also use points P(3, –5) and Q(–7, 3) to find the length of the diameter. The length of the radius is one-half the length of the diameter.
2 2 2 2 (,)7–33––5 10810064 164241 dPQ
11 22(,)24141 dPQ
The center-radius form of the equation of the circle is 222 22 [–(–2)][–(–1)](41) (2)(1)41 xy xy
59. Label the endpoints of the diameter P(–1, 2) and Q(11, 7). The midpoint M of the segment joining P and Q has coordinates 111279 222,5,.
The center is 9 2 5,. C To find the radius, we can use points 9 2 5, C and P( 1, 2).
2 2 9 2 2 2 516913 242 (,)5––12 6 dCP
We could also use points 9 2 5, C and Q(11, 7).
2 2 9 2 2 2 516913 242 (,)511–7 6 dCQ (continuedonnextpage)
Copyright © 2017 Pearson Education, Inc.
(continued)
Using the points P and Q to find the length of the diameter, we have
22 22 ,11127 125 16913
1113 ,13 222
The center-radius form of the equation of the circle is
22 2 913 22 2 2 9169 24 5 5 xy
60. Label the endpoints of the diameter P(5, 4) and Q( 3, 2). The midpoint M of the segment joining P and Q has coordinates
5(3)4(2),1,1. 22
The center is C(1, 1). To find the radius, we can use points C(1, 1) and P(5, 4).
43255 dCP
We could also use points C(1, 1) and Q( 3, 2).
22 22 (,)131–2 43255
Using the points P and Q to find the length of the diameter, we have
22 22 ,5342 8610010 dPQ
11 22(,)105 dPQ
The center-radius form of the equation of the circle is
22 2 22 115 1125 xy xy
61. Label the endpoints of the diameter P(1, 4) and Q(5, 1). The midpoint M of the segment joining P and Q has coordinates
5 2 1541 22,3,.
The center is 5 2 3,. C
The length of the diameter PQ is
222 2 154143255.
The length of the radius is 5 1 225.
The center-radius form of the equation of the circle is
62. Label the endpoints of the diameter P( 3, 10) and Q(5, 5). The midpoint M of the segment joining P and Q has coordinates
5 2 3510(5),1,. 22
The center is 5 2 1,. C
The length of the diameter PQ is
2 22 351058152 28917.
The length of the radius is 17 1 2217.
The center-radius form of the equation of the circle is
22 2 517 22 2 2 5289 24 1 1 xy xy
Section 2.3 Functions
1. The domain of the relation 3,5,4,9,10,13 is 3,4,10.
2. The range of the relation in Exercise 1 is 5,9,13.
3. The equation y = 4x – 6 defines a function with independent variable x and dependent variable y
4. The function in Exercise 3 includes the ordered pair (6, 18).
5. For the function 42,fxx 24228210. f
6. For the function , gxx 993. g
7. The function in Exercise 6, , gxx has domain 0,.
Copyright © 2017 Pearson Education, Inc.
8. The function in Exercise 6, , gxx has range 0,.
For exercises 9 and 10, use this graph.
9. The largest open interval over which the function graphed here increases is ,3.
10. The largest open interval over which the function graphed here decreases is 3,.
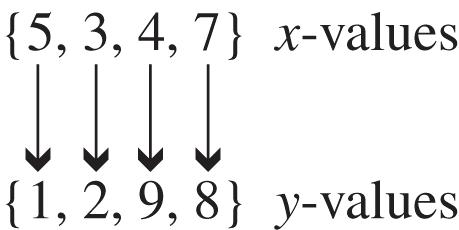
11. The relation is a function because for each different x-value there is exactly one y-value. This correspondence can be shown as follows.
12. The relation is a function because for each different x-value there is exactly one y-value. This correspondence can be shown as follows.
13. Two ordered pairs, namely (2, 4) and (2, 6), have the same x-value paired with different y-values, so the relation is not a function.
14. Two ordered pairs, namely (9, 2) and (9, 1), have the same x-value paired with different y-values, so the relation is not a function.
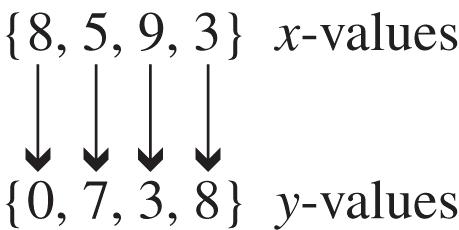
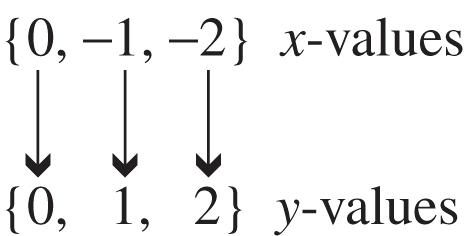
15. The relation is a function because for each different x-value there is exactly one y-value. This correspondence can be shown as follows.
16. The relation is a function because for each different x-value there is exactly one y-value. This correspondence can be shown as follows.
17. The relation is a function because for each different x-value there is exactly one y-value. This correspondence can be shown as follows.
18. The relation is a function because for each different x-value there is exactly one y-value. This correspondence can be shown as follows.
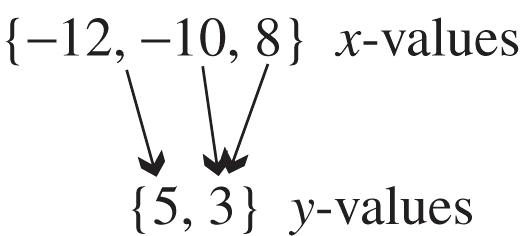
19. Two sets of ordered pairs, namely (1, 1) and (1, 1) as well as (2, 4) and (2, 4), have the same x-value paired with different y-values, so the relation is not a function.
domain: {0, 1, 2}; range: { 4, 1, 0, 1, 4}
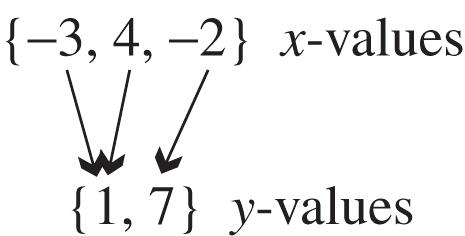
20. The relation is not a function because the x-value 3 corresponds to two y-values, 7 and 9. This correspondence can be shown as follows.
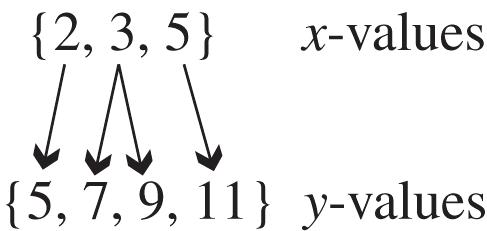
domain: {2, 3, 5}; range: {5, 7, 9, 11}
21. The relation is a function because for each different x-value there is exactly one y-value.
domain: {2, 3, 5, 11, 17}; range: {1, 7, 20}
22. The relation is a function because for each different x-value there is exactly one y-value.
domain: {1, 2, 3, 5}; range: {10, 15, 19, 27}
23. The relation is a function because for each different x-value there is exactly one y-value. This correspondence can be shown as follows.
Domain: {0, 1, 2}; range: {0, 1, 2}
24. The relation is a function because for each different x-value there is exactly one y-value. This correspondence can be shown as follows.
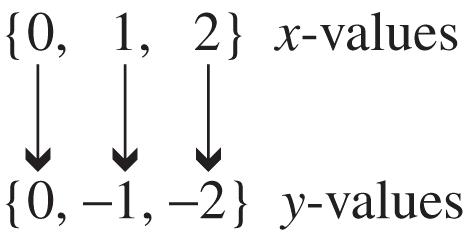
Domain: {0, 1, 2}; range: {0, 1, 2}
25. The relation is a function because for each different year, there is exactly one number for visitors.
domain: {2010, 2011, 2012, 2013} range: {64.9, 63.0, 65.1, 63.5}
26. The relation is a function because for each basketball season, there is only one number for attendance.
domain: {2011, 2012, 2013, 2014} range: {11,159,999, 11,210,832, 11,339,285, 11,181,735}
27. This graph represents a function. If you pass a vertical line through the graph, one x-value corresponds to only one y-value.
domain: ,; range: ,
28. This graph represents a function. If you pass a vertical line through the graph, one x-value corresponds to only one y-value.
domain:
,; range: ,4
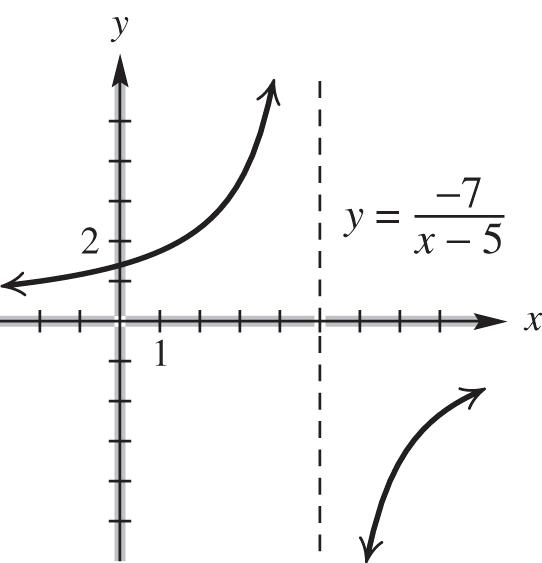
29. This graph does not represent a function. If you pass a vertical line through the graph, there are places where one value of x corresponds to two values of y domain: 3,; range: ,
30. This graph does not represent a function. If you pass a vertical line through the graph, there are places where one value of x corresponds to two values of y domain: [ 4, 4]; range: [ 3, 3]
31. This graph represents a function. If you pass a vertical line through the graph, one x-value corresponds to only one y-value.
domain: ,; range: ,
32. This graph represents a function. If you pass a vertical line through the graph, one x-value corresponds to only one y-value. domain: [ 2, 2]; range: [0, 4]
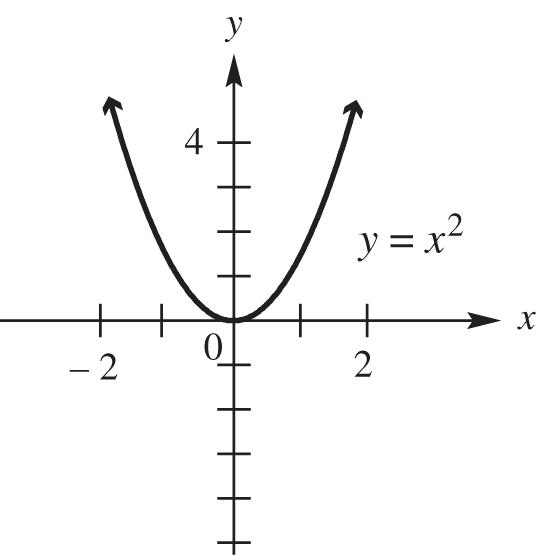
33. 2 yx represents a function because y is always found by squaring x. Thus, each value of x corresponds to just one value of yx can be any real number. Because the square of any real number is not negative, the range would be zero or greater.
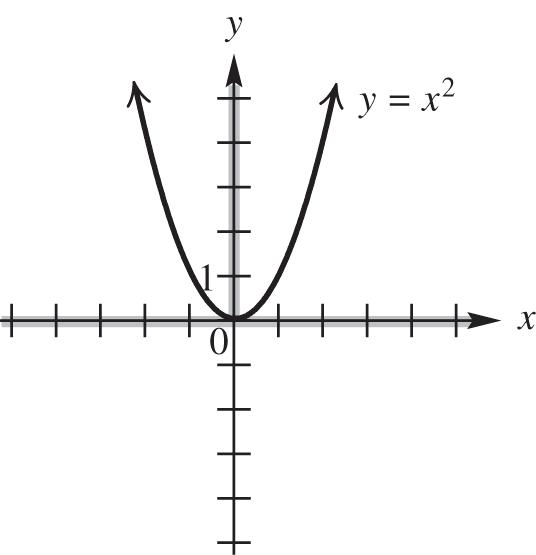
domain: ,; range: 0,
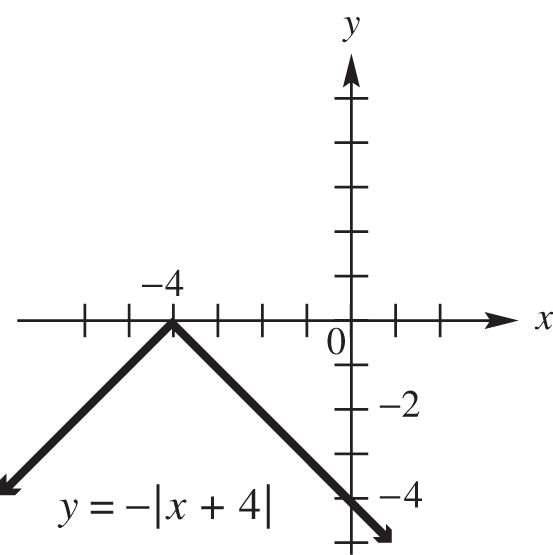
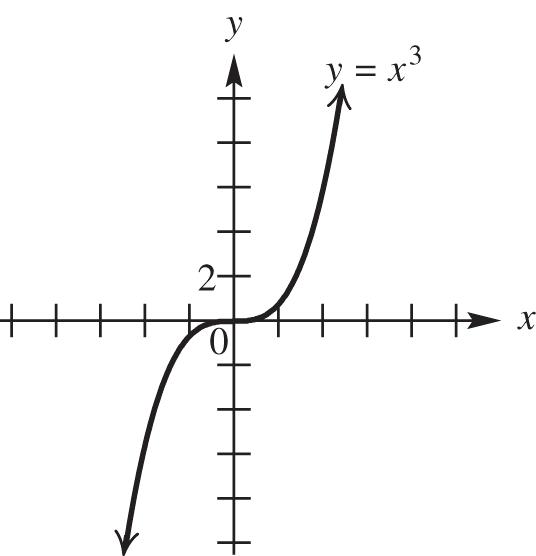
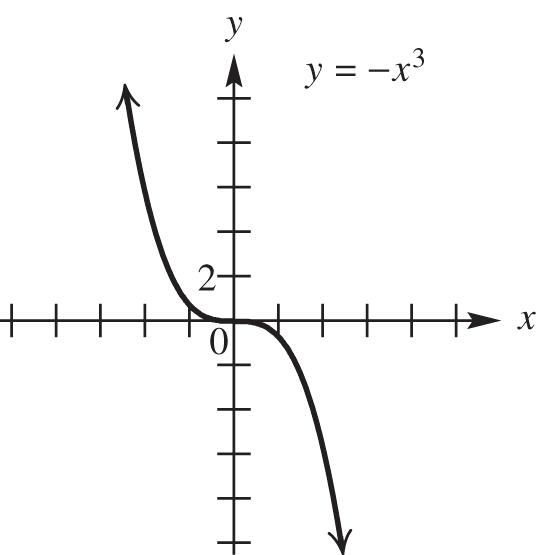
34. 3 yx represents a function because y is always found by cubing x. Thus, each value of x corresponds to just one value of y. x can be any real number. Because the cube of any real number could be negative, positive, or zero, the range would be any real number.
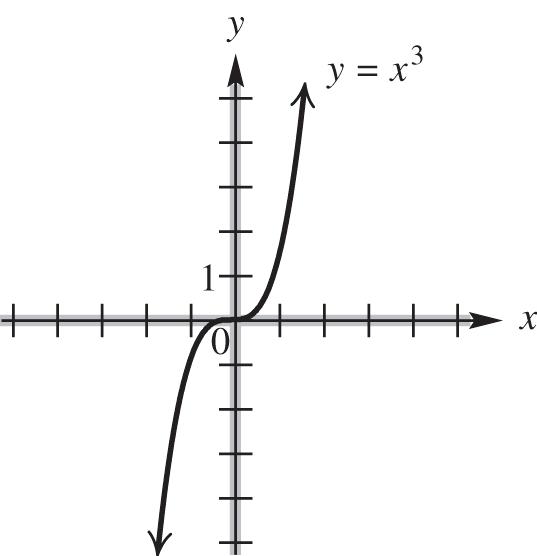
domain: ,; range: ,
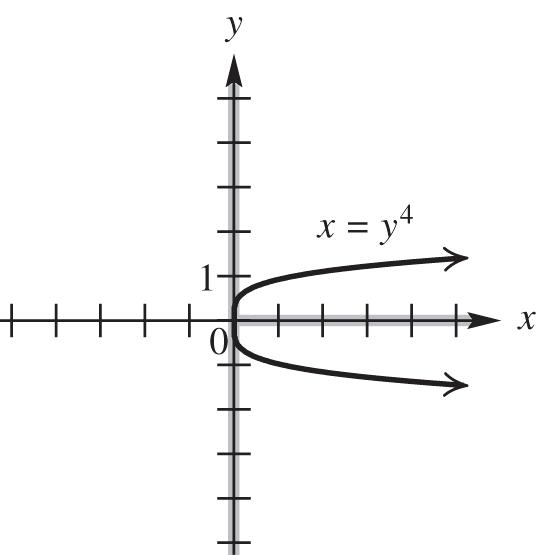
35. The ordered pairs (1, 1) and (1, 1) both satisfy 6 . xy This equation does not represent a function. Because x is equal to the sixth power of y, the values of x are nonnegative. Any real number can be raised to the sixth power, so the range of the relation is all real numbers.
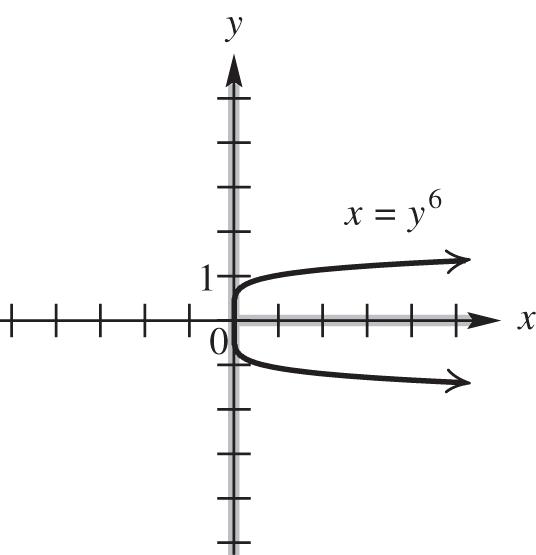
domain: 0, range: ,
36. The ordered pairs (1, 1) and (1, 1) both satisfy 4 . xy This equation does not represent a function. Because x is equal to the fourth power of y, the values of x are nonnegative. Any real number can be raised to the fourth power, so the range of the relation is all real numbers.
domain:
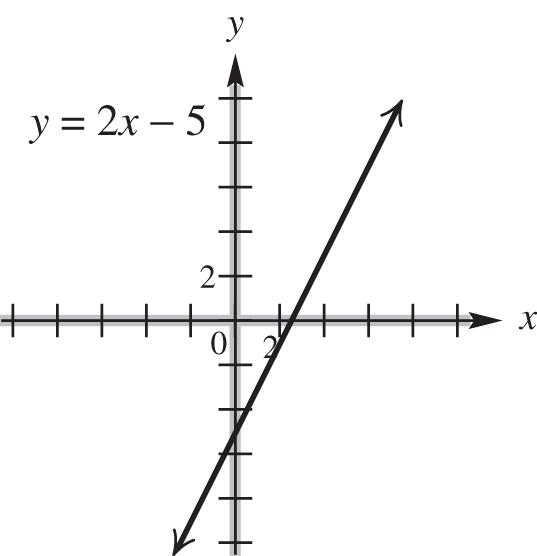
37. 25yx represents a function because y is found by multiplying x by 2 and subtracting 5. Each value of x corresponds to just one value of yx can be any real number, so the domain is all real numbers. Because y is twice x, less 5, y also may be any real number, and so the range is also all real numbers.
domain:
38. 64yx represents a function because y is found by multiplying x by 6 and adding 4. Each value of x corresponds to just one value of y. x can be any real number, so the domain is all real numbers. Because y is 6 times x, plus 4, y also may be any real number, and so the range is also all real numbers.
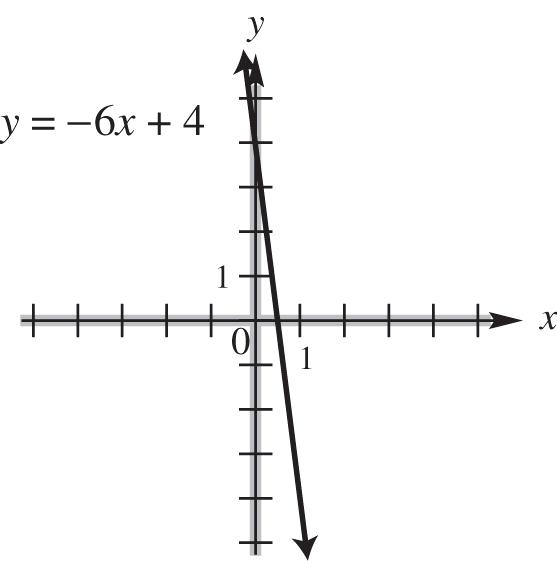
domain: ,; range:
39. By definition, y is a function of x if every value of x leads to exactly one value of y. Substituting a particular value of x, say 1, into x + y < 3 corresponds to many values of y. The ordered pairs (1, –2), (1, 1), (1, 0), (1, 1), and so on, all satisfy the inequality. Note that the points on the graphed line do not satisfy the inequality and only indicate the boundary of the solution set. This does not represent a function. Any number can be used for x or for y, so the domain and range of this relation are both all real numbers.
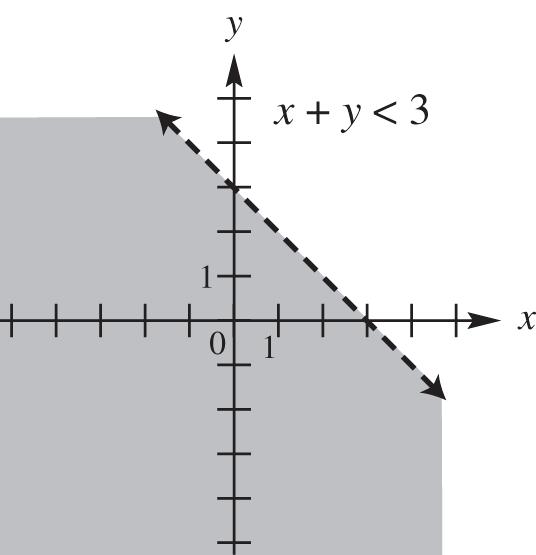
domain:
,; range:
40. By definition, y is a function of x if every value of x leads to exactly one value of y.
Substituting a particular value of x, say 1, into xy < 4 corresponds to many values of y. The ordered pairs (1, 1), (1, 0), (1, 1), (1, 2), and so on, all satisfy the inequality. Note that the points on the graphed line do not satisfy the inequality and only indicate the boundary of the solution set. This does not represent a function. Any number can be used for x or for y, so the domain and range of this relation are both all real numbers.
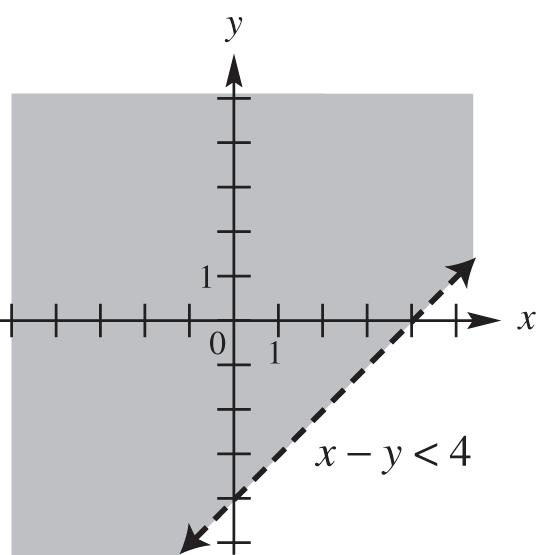
domain:
range:
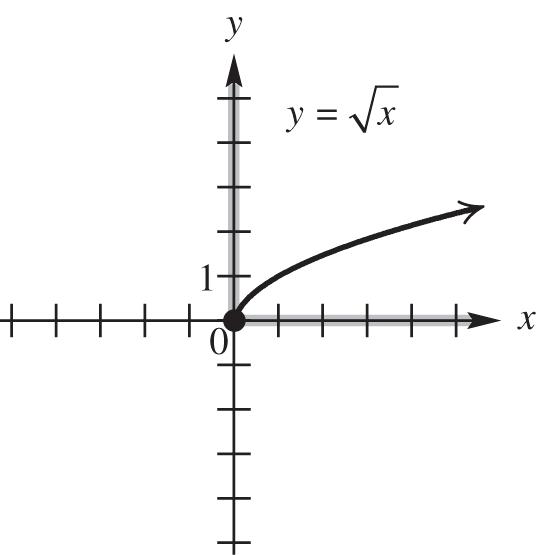
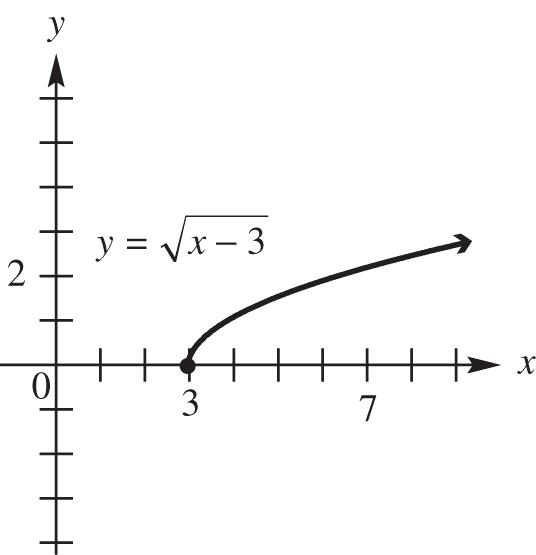
41. For any choice of x in the domain of , yx there is exactly one corresponding value of y, so this equation defines a function. Because the quantity under the square root cannot be negative, we have 0. x Because the radical is nonnegative, the range is also zero or greater. domain:
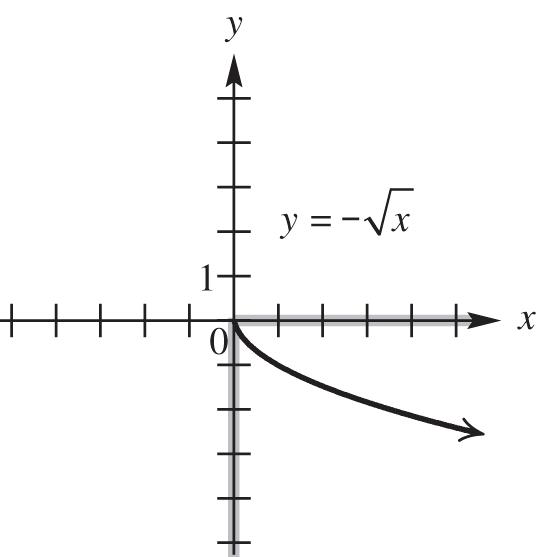
42. For any choice of x in the domain of , yx there is exactly one corresponding value of y, so this equation defines a function. Because the quantity under the square root cannot be negative, we have 0. x The outcome of the radical is nonnegative, when you change the sign (by multiplying by 1), the range becomes nonpositive. Thus the range is zero or less. domain:
43. Because 2 xy can be rewritten as 2 , yx we can see that y can be found by dividing x into 2. This process produces one value of y for each value of x in the domain, so this equation is a function. The domain includes all real numbers except those that make the denominator equal to zero, namely x = 0. Values of y can be negative or positive, but never zero. Therefore, the range will be all real numbers except zero.
domain: ,00,;
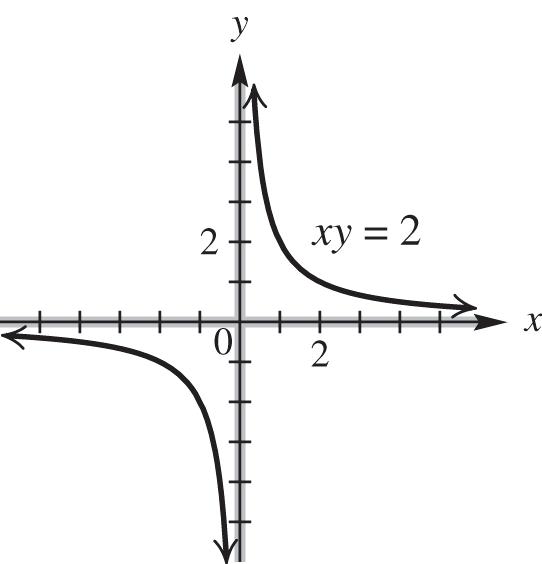
range: ,00,
44. Because xy = 6 can be rewritten as 6 , yx we can see that y can be found by dividing x into 6. This process produces one value of y for each value of x in the domain, so this equation is a function. The domain includes all real numbers except those that make the denominator equal to zero, namely x = 0. Values of y can be negative or positive, but never zero. Therefore, the range will be all real numbers except zero.
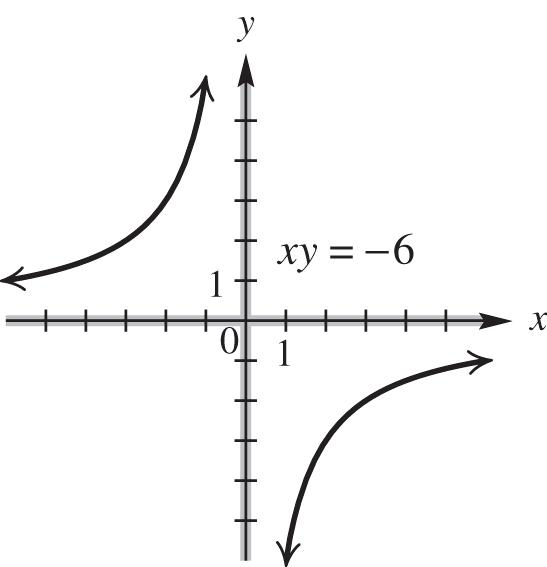
domain:
range:
,00,;
,00,
45. For any choice of x in the domain of 41yx there is exactly one corresponding value of y, so this equation defines a function. Because the quantity under the square root cannot be negative, we have 41041 xx 1 4 . x Because the radical is nonnegative, the range is also zero or greater.
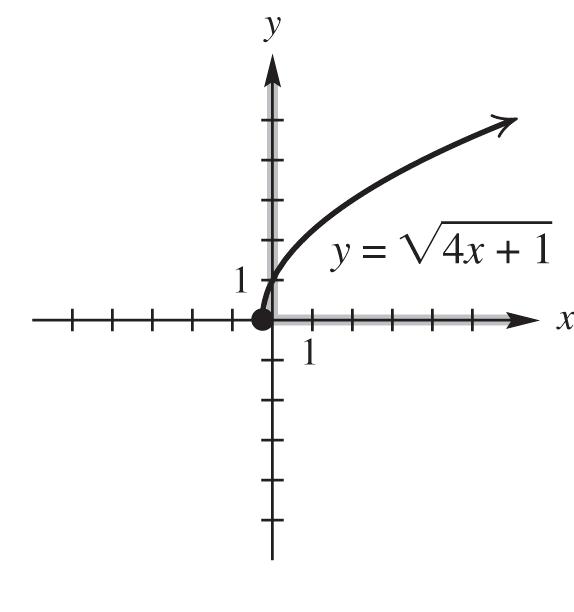
domain: 1 4 ,; range:
0,
46. For any choice of x in the domain of 72 yx there is exactly one corresponding value of y, so this equation defines a function. Because the quantity under the square root cannot be negative, we have 72027 xx 77 22 or . xx Because the radical is nonnegative, the range is also zero or greater.
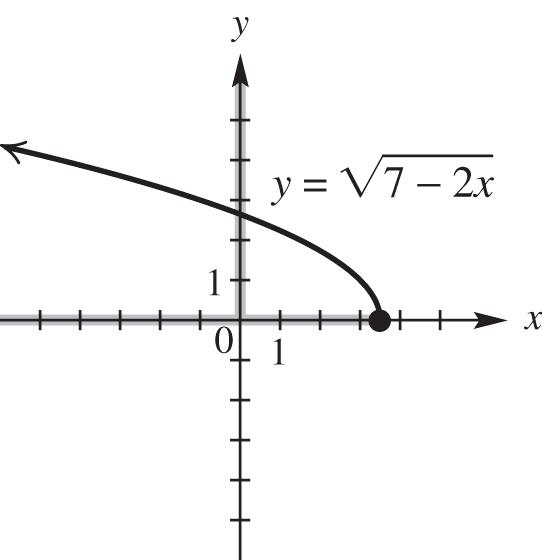
domain: 7 2 ,;
range:
47. Given any value in the domain of 2 3 , yx we find y by subtracting 3, then dividing into 2. This process produces one value of y for each value of x in the domain, so this equation is a function. The domain includes all real numbers except those that make the denominator equal to zero, namely x = 3. Values of y can be negative or positive, but never zero. Therefore, the range will be all real numbers except zero.
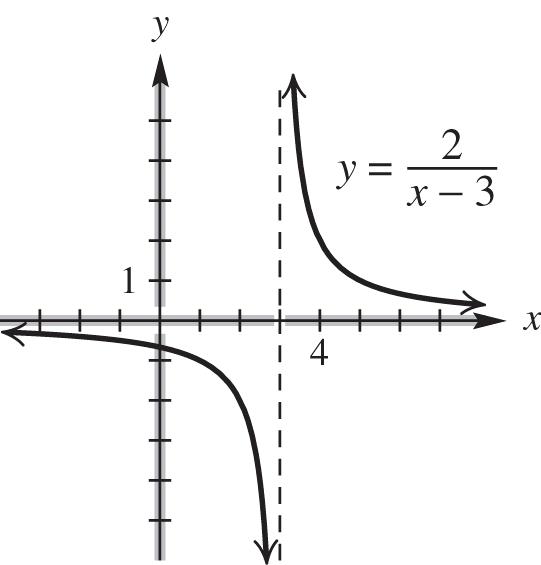
domain:
,33,; range:
,00,
48. Given any value in the domain of 7 5 , yx we find y by subtracting 5, then dividing into 7. This process produces one value of y for each value of x in the domain, so this equation is a function. The domain includes all real numbers except those that make the denominator equal to zero, namely x = 5. Values of y can be negative or positive, but never zero. Therefore, the range will be all real numbers except zero.
domain: ,55,;
range: ,00,
49. B. The notation f(3) means the value of the dependent variable when the independent variable is 3.
50. Answers will vary. An example is: The cost of gasoline depends on the number of gallons used; so cost is a function of number of gallons.
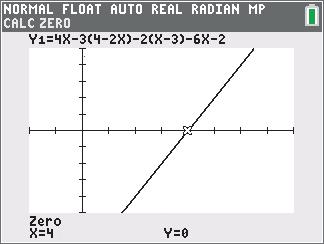
51. 34 0304044 fxx f
52.
34 33349413 fxx f
53.
54.
2 2 41 22421 48111
2 2 41 10104101 10040159 gxxx g
55. 11 33 34 34143 fxx f
56.
57.
58.
77 33 34 347411 fxx f
2 2 111 222 111 44 41 41 21 gxxx g
2 2 111 444 11 1616 41 41 11 gxxx g
59. 34 34 fxx fpp
Copyright © 2017 Pearson Education,
60.
61.
62.
2 2 41 41 gxxx gkkk
34 3434 fxx fxxx
2 2 2 41 41 41 gxxx gxxx xx
63.
34 2324 36432 fxx fxx xx
64.
65.
66.
34 4344 312438 fxx faa aa
34 233234 694613 fxx fmm mm
34 323324 964910 fxx ftt tt
67. (a)
68. (a)
22 f (b) 13 f
25 f (b)
111 f
69. (a) 215 f (b) 110 f
70. (a)
21 f (b)
17 f
71. (a) 23 f (b)
72. (a)
23 f (b)
13 f
12 f
73. (a) 20 f (b)
77. (a) 11 33 312 312 12 3 44 xy yx x y yxfxx
(b) 1 3 334143 f
78. (a) 11 44 48 84 84 8 4 22 xy xy xy x y yxfxx
(b) 3385 1 332244444 f
79. (a)
2 2 2 23 23 23 yxx yxx fxxx
(b) 2 32333 293318 f
80. (a)
2 2 2 32 32 32 yxx yxx fxxx
(b) 2 33332 393232 f
81. (a) 4488 3333 438 438 483 48 3 xy xy xy x y yxfxx
(b) 88 4124 3333333 f
12 f (d)
44 f
04 f (c)
74. (a) 25 f (b)
00 f (c)
12 f (d)
75. (a) 23 f
10 f
76. (a)
23 f
13 f
(b)
(d)
(b)
44 f
02 f
42 f
03 f
43 f
82. (a) 2299 5555 259 529 29 5 xy yx x y yxfxx
(b) 96915 2 55555 333 f
83. 34 f
84. Because 2 0.20.230.21 f
= 0.04 + 0.6 + 1 = 1.64, the height of the rectangle is 1.64 units. The base measures 0.3 0.2 = 0.1 unit. Because the area of a rectangle is base times height, the area of this rectangle is 0.1(1.64) = 0.164 square unit.
85. 3 f is the y-component of the coordinate, which is 4.
86. 2 f is the y-component of the coordinate, which is 3.
87. (a) 2,0 (b) ,2
(c)
0,
88. (a) 3,1 (b) 1,
(c)
,3
89. (a) ,2;2,
(b)
90. (a)
2,2 (c) none
3,3 (b)
(c) none
91. (a)
(b)
,3;3,
1,0;1,
,1;0,1
(c) none
92. (a)
,2;0,2
(b)
2,0;2,
(c) none
93. (a) Yes, it is the graph of a function.
(b) [0, 24]
(c) When t = 8, y = 1200 from the graph. At 8 A.M., approximately 1200 megawatts is being used.
(d) The most electricity was used at 17 hr or 5 P.M. The least electricity was used at 4 A.M.
(e) 121900 f At 12 noon, electricity use is about 1900 megawatts.
(f) increasing from 4 A.M. to 5 P.M.; decreasing from midnight to 4 A.M. and from 5 P.M. to midnight
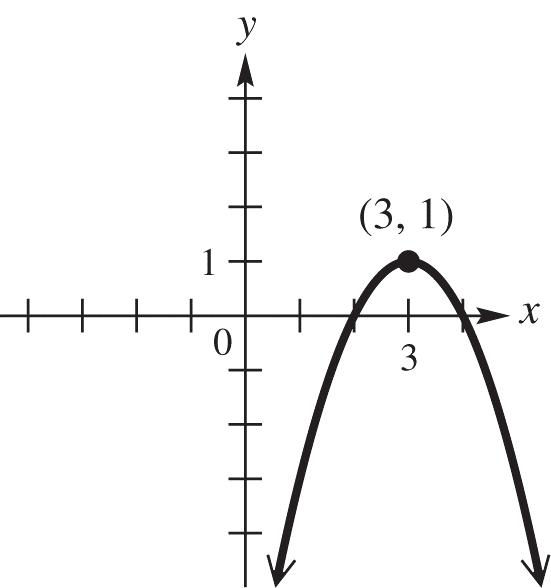
94. (a) At t = 2, y = 240 from the graph. Therefore, at 2 seconds, the ball is 240 feet high.
(b) At y = 192, x = 1 and x = 5 from the graph. Therefore, the height will be 192 feet at 1 second and at 5 seconds.
(c) The ball is going up from 0 to 3 seconds and down from 3 to 7 seconds.
(d) The coordinate of the highest point is (3, 256). Therefore, it reaches a maximum height of 256 feet at 3 seconds.
(e) At x = 7, y = 0. Therefore, at 7 seconds, the ball hits the ground.
95. (a) At t = 12 and t = 20, y = 55 from the graph. Therefore, after about 12 noon until about 8 P.M. the temperature was over 55º.
(b) At t = 6 and t = 22, y = 40 from the graph. Therefore, until about 6 A.M. and after 10 P.M. the temperature was below 40º.
(c) The temperature at noon in Bratenahl, Ohio was 55º. Because the temperature in Greenville is 7º higher, we are looking for the time at which Bratenahl, Ohio was at or above 48º. This occurred at approximately 10 A.M and 8:30 P.M.
(d) The temperature is just below 40° from midnight to 6 A.M., when it begins to rise until it reaches a maximum of just below 65° at 4 P.M. It then begins to fall util it reaches just under 40° again at midnight.
96. (a) At t = 8, y = 24 from the graph. Therefore, there are 24 units of the drug in the bloodstream at 8 hours.
(b) The level increases between 0 and 2 hours after the drug is taken and decreases between 2 and 12 hours after the drug is taken.
(c) The coordinates of the highest point are (2, 64). Therefore, at 2 hours, the level of the drug in the bloodstream reaches its greatest value of 64 units.
(d) After the peak, y = 16 at t = 10. 10 hours – 2 hours = 8 hours after the peak. 8 additional hours are required for the level to drop to 16 units.
Copyright © 2017 Pearson Education, Inc.
(e) When the drug is administered, the level is 0 units. The level begins to rise quickly for 2 hours until it reaches a maximum of 64 units. The level then begins to decrease gradually until it reaches a level of 12 units, 12 hours after it was administered.
Section 2.4 Linear Functions
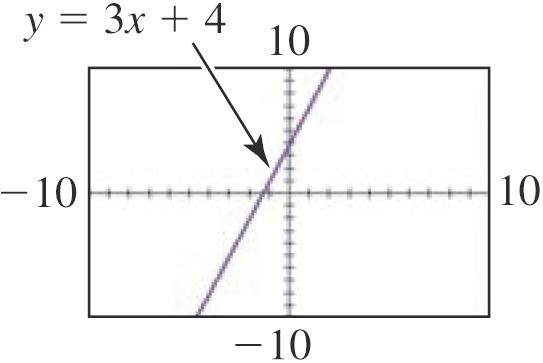
1. B; ()fx = 3x + 6 is a linear function with y-intercept (0, 6).
2. H; x = 9 is a vertical line.
3. C; ()fx = 8 is a constant function.
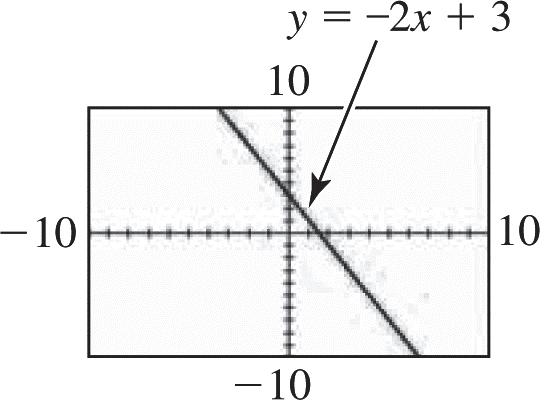
4. G; 2x – y = –4 or y = 2x + 4 is a linear equation with x-intercept (–2, 0) and y-intercept (0, 4).
5. A; ()fx = 5x is a linear function whose graph passes through the origin, (0, 0). f(0) = 5(0) = 0.
6. D; 2 () fxx is a function that is not linear.
7. –3 m matches graph C because the line falls rapidly as x increases.
8. m = 0 matches graph A because horizontal lines have slopes of 0.
9. m = 3 matches graph D because the line rises rapidly as x increases.
10. m is undefined for graph B because vertical lines have undefined slopes.
11. ()–4fxx
Use the intercepts.
(0)0–4–4: f y-intercept
0–44: xx x-intercept
Graph the line through (0, –4) and (4, 0).
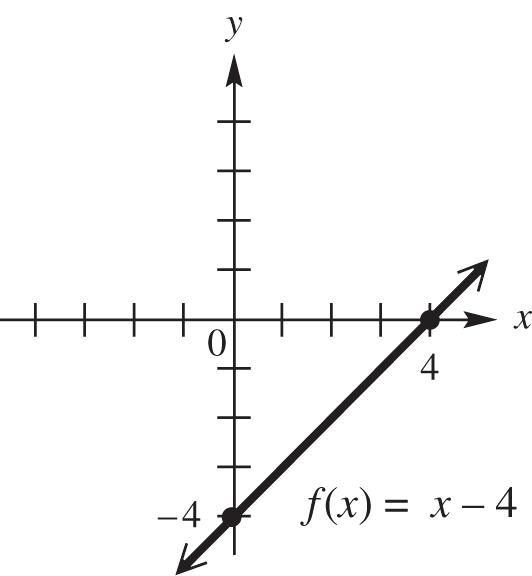
The domain and range are both
Section 2.4 Linear Functions
12. ()–4fxx
Use the intercepts.
(0)–044: f y-intercept
0–44: xx x-intercept
Graph the line through (0, 4) and (4, 0).
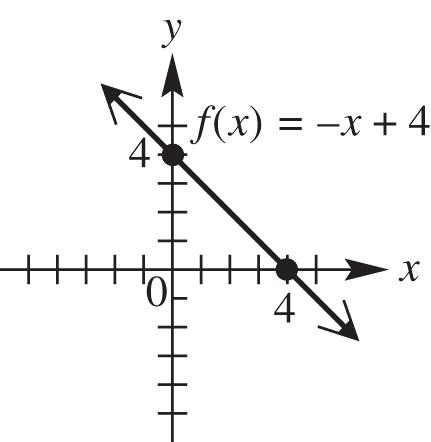
The domain and range are both ,.
13. 1 2 ()–6fxx
Use the intercepts.
1 2 (0)0–6–6: f y-intercept 11 22 0–6612: xxx x-intercept
Graph the line through (0, –6) and (12, 0).
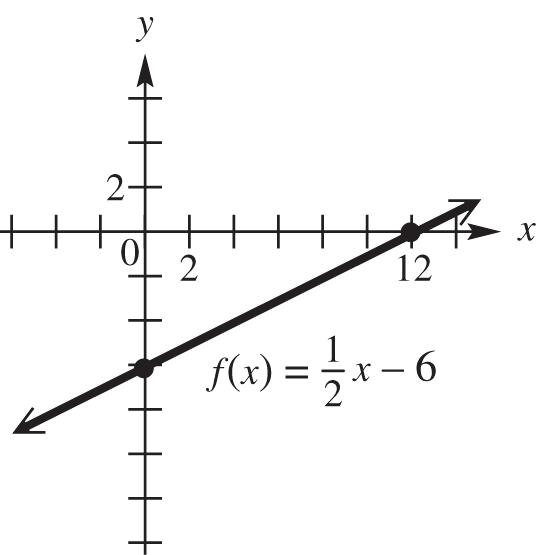
The domain and range are both
14. 2 3 ()2fxx
Use the intercepts.
2 3 (0)022: f y-intercept 22 33 02–23:-intercept xxxx
Graph the line through (0, 2) and (–3, 0).
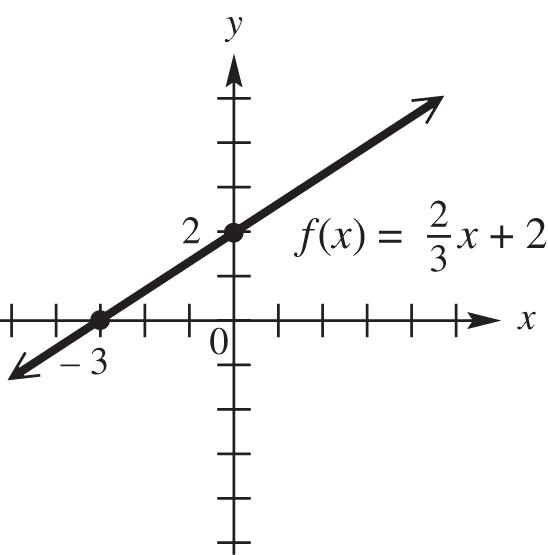
The domain and range are both ,.
Copyright © 2017 Pearson Education, Inc.
15. ()3 fxx
The x-intercept and the y-intercept are both zero. This gives us only one point, (0, 0). If x = 1, y = 3(1) = 3. Another point is (1, 3). Graph the line through (0, 0) and (1, 3).
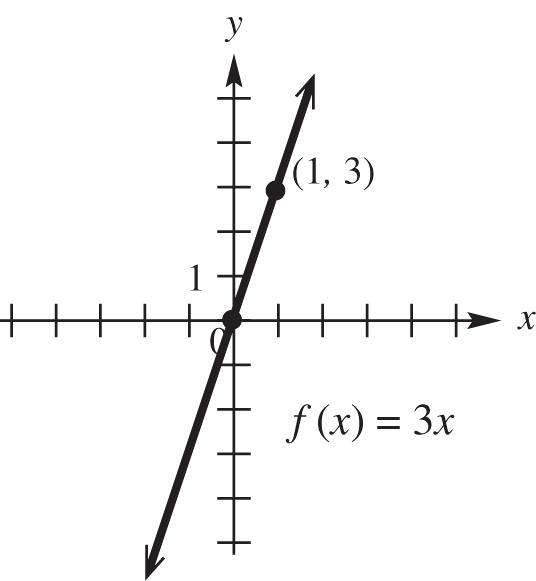
The domain and range are both
16. –2 fxx
,.
The x-intercept and the y-intercept are both zero. This gives us only one point, (0, 0). If x = 3, y = –2(3) = –6, so another point is (3, –6). Graph the line through (0, 0) and (3, –6).
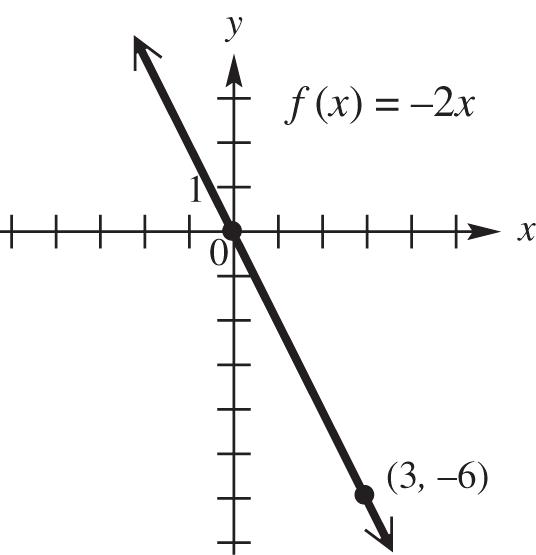
The domain and range are both
,.
17. ()–4fx is a constant function.
The graph of ()4fx is a horizontal line with a y-intercept of –4.
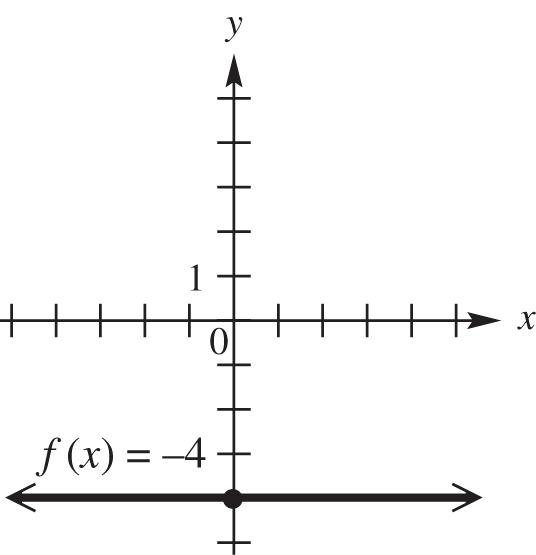
domain: ,; range: {–4}
18. ()3fx is a constant function whose graph is a horizontal line with y-intercept of 3.
domain: ,; range: {3}
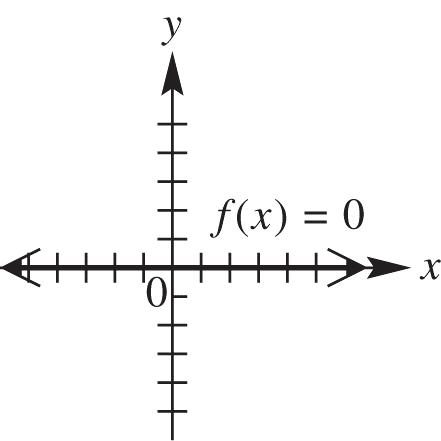
19. ()0fx is a constant function whose graph is the x-axis.
domain: ,; range: {0}
20. 9 fxx
The domain and range are both ,.
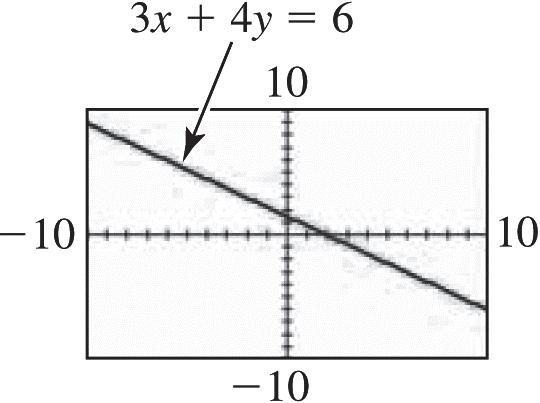
21. 4312 xy Use the intercepts.
40312312 4:-intercept yy yy
43012412 3:-intercept xx xx
Graph the line through (0, 4) and ( 3, 0).
The domain and range are both ,.
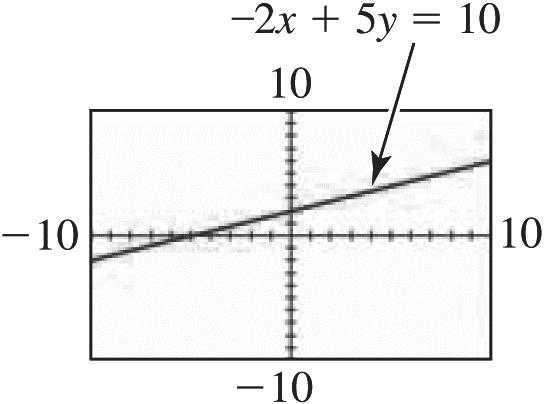
22. 2510; xy Use the intercepts.
20510510 2:-intercept yy yy 25010210 5:-intercept xx xx
Graph the line through (0, 2) and (5, 0):
The domain and range are both ,.
23. 340 yx
Use the intercepts.
3400300:-intercept yyyy
3040400:-intercept xxxx
The graph has just one intercept. Choose an additional value, say 3, for x
34303120 3124 yy yy
Graph the line through (0, 0) and (3, 4):
The domain and range are both ,.
24. 320 xy
Use the intercepts.
3020200:-intercept yyyy
3200300: xxx x-intercept
The graph has just one intercept. Choose an additional value, say 2, for x
3220620 263 yy yy
Graph the line through (0, 0) and (2, 3):
The domain and range are both
25. x = 3 is a vertical line, intersecting the x-axis at (3, 0).
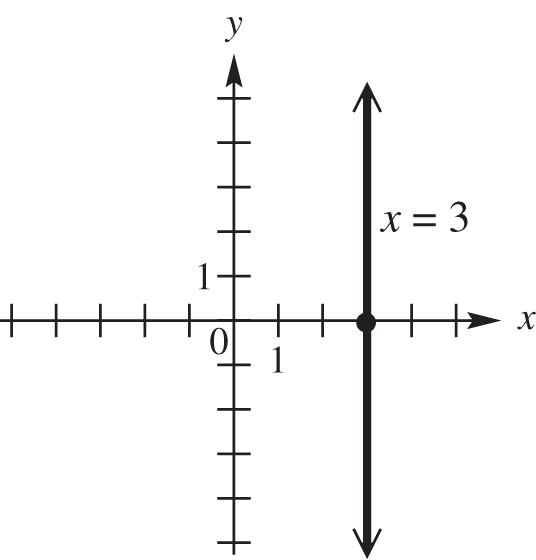
domain: {3}; range: ,
26. x = –4 is a vertical line intersecting the x-axis at (–4, 0).
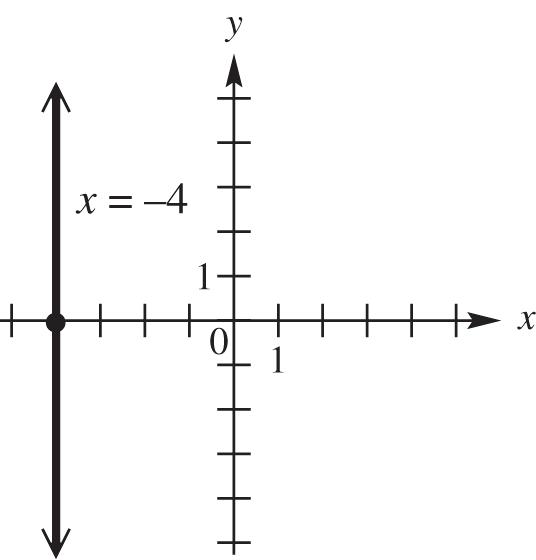
domain: { 4}; range: ,
27. 2x + 4 = 0 242 xx is a vertical line intersecting the x-axis at (–2, 0).
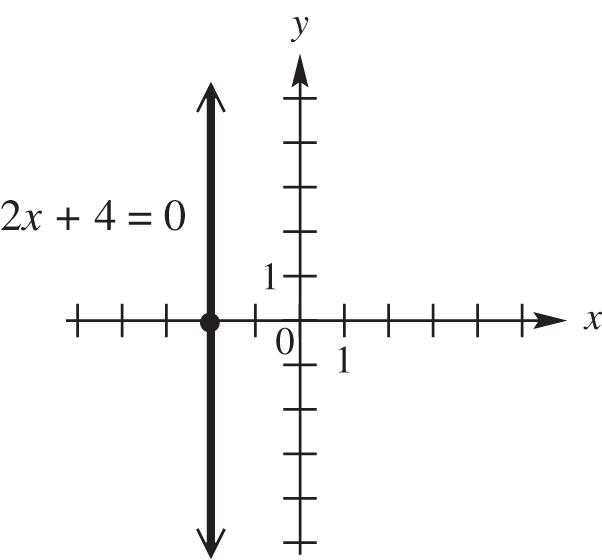
domain: { 2}; range: ,
28. 360–362 xxx is a vertical line intersecting the x-axis at (2, 0).
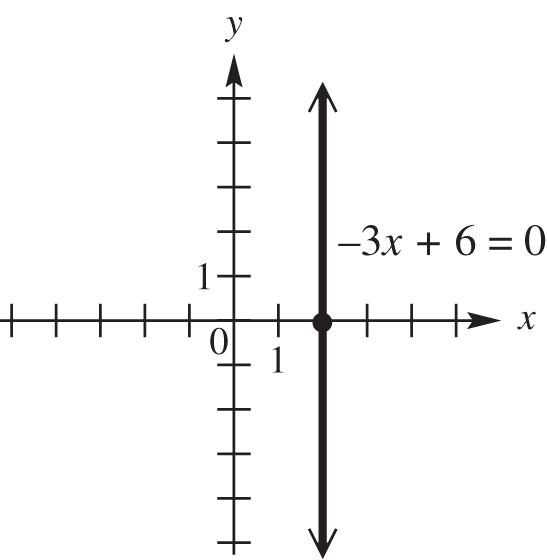
domain: {2}; range: ,
29. 505xx is a vertical line intersecting the x-axis at (5, 0).
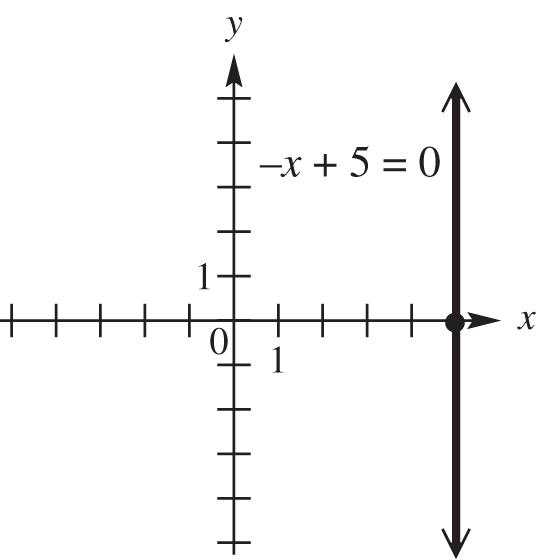
domain: {5}; range: ,
Copyright © 2017 Pearson Education, Inc.
30. 303 xx is a vertical line intersecting the x-axis at 3,0.
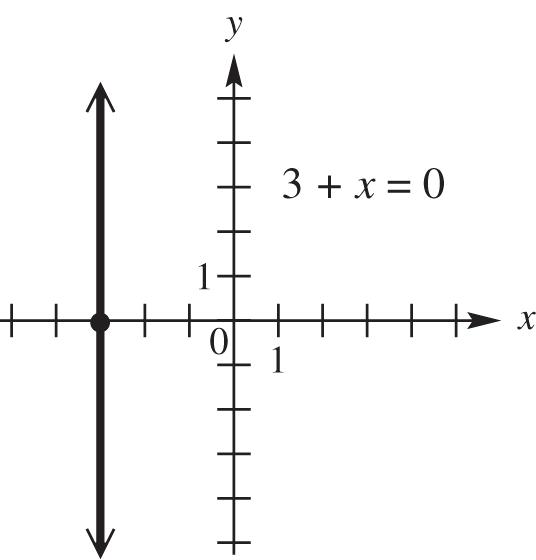
domain: { 3}; range: ,
31. y = 5 is a horizontal line with y-intercept 5. Choice A resembles this.
32. y = –5 is a horizontal line with y-intercept –5. Choice C resembles this.
33. x = 5 is a vertical line with x-intercept 5. Choice D resembles this.
34. x = –5 is a vertical line with x-intercept –5. Choice B resembles this. 35.
39. The rise is 2.5 feet while the run is 10 feet so the slope is 2.5 1 104 0.2525% . So A = 0.25, 2.5 10 C , D = 25%, and 1 4 E are all expressions of the slope.
40. The pitch or slope is 1 4 . If the rise is 4 feet then 1rise4 4run x or x = 16 feet. So 16 feet in the horizontal direction corresponds to a rise of 4 feet.
41. Through (2, –1) and (–3, –3)
Let 112 2, –1, –3, and xyx 2 –3. y
Then rise–3 – (–1)–2 y and run–3 – 2–5. x
The slope is rise–22 run–55 y m x
42. Through ( 3, 4) and (2, 8)
Let 1122 3, 4, 2, and –8. xyxy
Then rise–8 – 4–12 y and run2 – (3)5. x
The slope is rise–1212 . run55 y m x
43. Through (5, 8) and (3, 12)
Let 1122 5, 8, 3, and 12. xyxy
Then rise1284 y and run352. x
The slope is rise4 2. run2 y m x
44. Through (5, –3) and (1, –7) 1122 Let 5, –3,1,and –7. xyxy
Then rise–7 – (–3)–4 y and run1 – 5–4. x
The slope is 4 1. 4 y m x
45. Through (5, 9) and (–2, 9) 21 21 9 – 90 0 –2 5–7 yyy m xxx
46. Through (–2, 4) and (6, 4) 21 21 4 40 0 6 (–2)8 yyy m xxx
47. Horizontal, through (5, 1)
The slope of every horizontal line is zero, so m = 0.
48. Horizontal, through (3, 5)
The slope of every horizontal line is zero, so m = 0.
49. Vertical, through (4, –7)
The slope of every vertical line is undefined; m is undefined.
50. Vertical, through (–8, 5)
The slope of every vertical line is undefined; m is undefined.
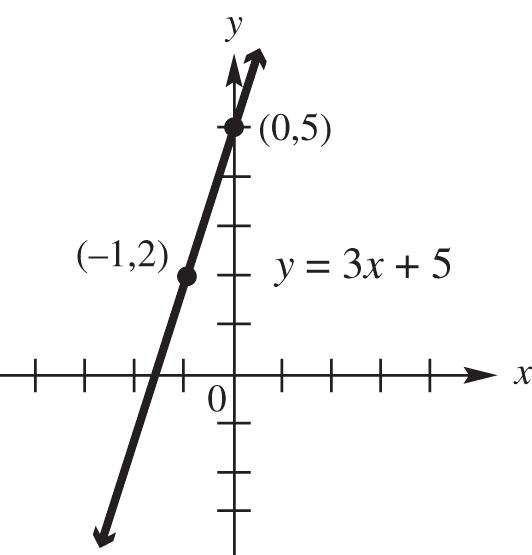
51. (a) 35yx
Find two ordered pairs that are solutions to the equation.
If x = 0, then 3055.yy
If x = 1, then 315352.yyy
Thus two ordered pairs are (0, 5) and ( 1, 2)
21 21 rise 253 3. run 101 yy m xx
(b)
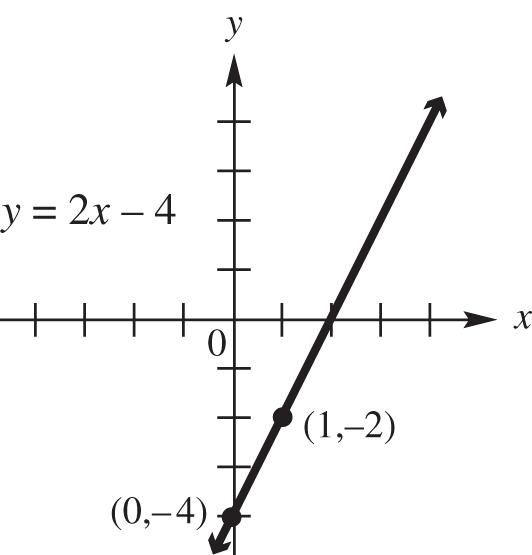
52. 24yx
Find two ordered pairs that are solutions to the equation. If 0, x then 204 y
4. y If 1, x then 214 y
242.yy Thus two ordered pairs are 0,4 and 1,2.
21 21 24 rise2 2. run 101 yy m xx
(b)
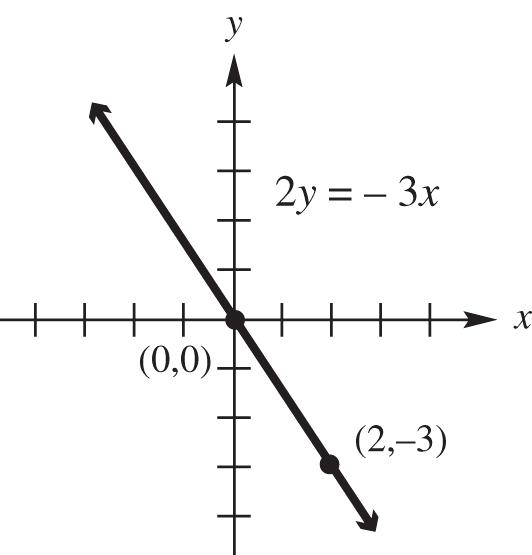
53. 23yx
Find two ordered pairs that are solutions to the equation. If 0, x then 200. yy If 3, y then 23363 xx
2. x Thus two ordered pairs are 0,0 and
2,3.
21 21 rise 303 . run 202 yy m xx
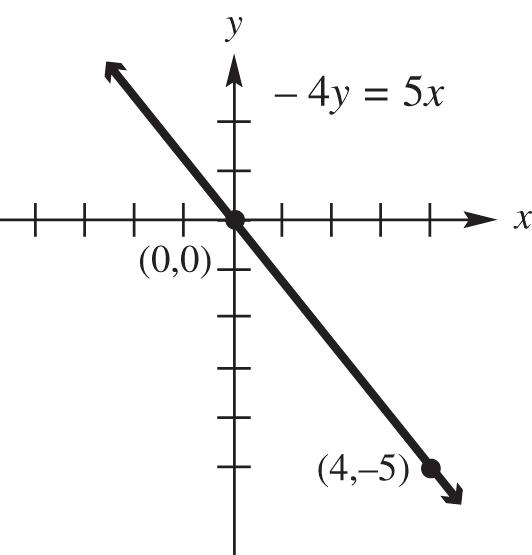
54. 45yx
Find two ordered pairs that are solutions to the equation. If 0, x then 400. yy
If 4, x then 454420 yy
5. y Thus two ordered pairs are 0,0 and 4,5.
21 21 rise 505 run 404 yy m xx (b)
55. 5210 xy
Find two ordered pairs that are solutions to the equation. If 0, x then 50210 y
5. y If 0, y then 52010 x 510 x 2. x
Thus two ordered pairs are 0,5 and 2,0. 21 21 05 rise5 . run202 yy m xx (b)
Copyright © 2017 Pearson Education,
56. 4312 xy
Find two ordered pairs that are solutions to the equation. If 0, x then 40312 y
312 y 4. y If 0, y then 43012412 xx 3. x Thus two ordered pairs are 0,4 and 3,0.
21 21 rise044 . run303 yy m xx
(b)
57. Through (–1, 3), 3 2 m
First locate the point (–1, 3). Because the slope is 3 2 , a change of 2 units horizontally (2 units to the right) produces a change of 3 units vertically (3 units up). This gives a second point, (1, 6), which can be used to complete the graph.
58. Through (–2, 8), 2 5 m . Because the slope is 2 5 , a change of 5 units horizontally (to the right) produces a change of 2 units vertically (2 units up). This gives a second point (3, 10), which can be used to complete the graph. Alternatively, a change of 5 units to the left produces a change of 2 units down. This gives the point ( 7, 6).
59. Through (3, –4), 1 3 – m . First locate the point (3, –4). Because the slope is 1 3 –, a change of 3 units horizontally (3 units to the right) produces a change of –1 unit vertically (1 unit down). This gives a second point, (6, –5), which can be used to complete the graph.
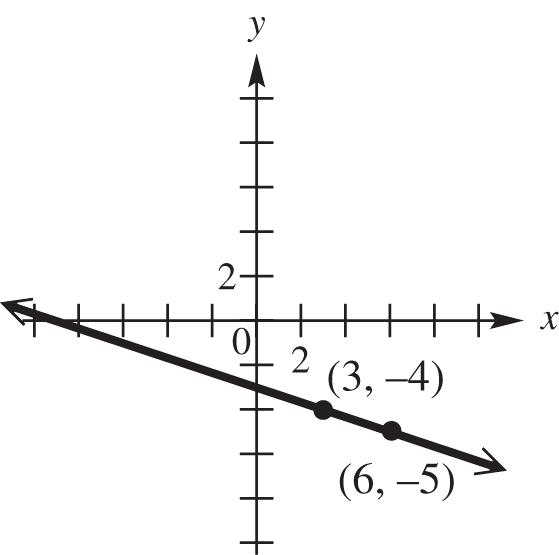
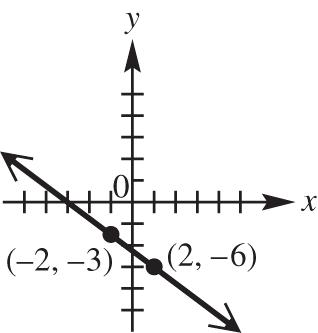
60. Through (–2, –3), 3 4 – m . Because the slope is 3–3 44 –, a change of 4 units horizontally (4 units to the right) produces a change of –3 units vertically (3 units down). This gives a second point (2, –6), which can be used to complete the graph.
61. Through 1 2 ,4 , m = 0.
The graph is the horizontal line through 1 2 ,4.
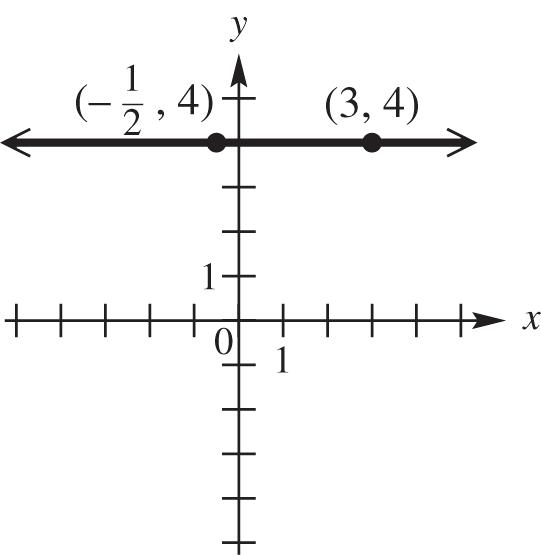
Exercise 61
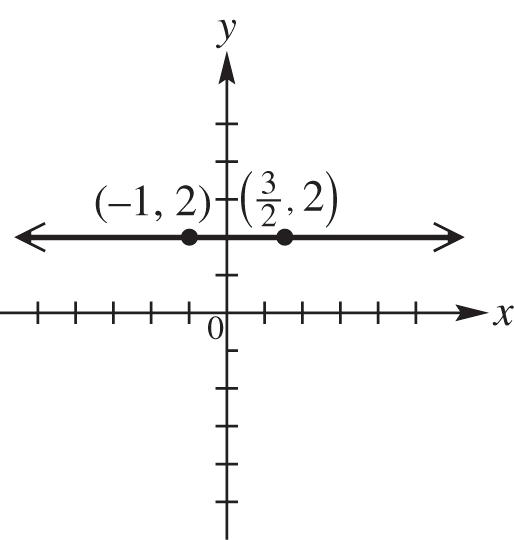
Exercise 62
62. Through 3 2 ,2, m = 0.
The graph is the horizontal line through 3 2 ,2.
63. Through 5 2 , 3 , undefined slope. The slope is undefined, so the line is vertical, intersecting the x-axis at 5 2 , 0.
64. Through 9 4 , 2 , undefined slope. The slope is undefined, so the line is vertical, intersecting the x-axis at
9 4 , 0.
65. The average rate of change is
fbfa m ba
20416
$4 044 (thousand) per year. The value of the machine is decreasing $4000 each year during these years.
66. The average rate of change is
fbfa m ba 2000200
$50 404 per month. The amount saved is increasing $50 each month during these months.
67. The graph is a horizontal line, so the average rate of change (slope) is 0. The percent of pay raise is not changing—it is 3% each year.
68. The graph is a horizontal line, so the average rate of change (slope) is 0. That means that the number of named hurricanes remained the same, 10, for the four consecutive years shown.
69.
256250852523 2012198032 78.8 thousand per year fbfa m ba
The number of high school dropouts decreased by an average of 78.8 thousand per year from 1980 to 2012.
70.
17095302 20132006 3593 $513.29 7 fbfa m
Sales of plasma flat-panel TVs decreased by an average of $513.29 million per year from 2006 to 2013.
71. (a) The slope of –0.0167 indicates that the average rate of change of the winning time for the 5000 m run is 0.0167 min less. It is negative because the times are generally decreasing as time progresses.
(b) The Olympics were not held during World Wars I (1914 1919) and II (1939–1945).
(c) 0.0167200046.4513.05 min y
The model predicts a winning time of 13.05 minutes. The times differ by 13.35 13.05 = 0.30 min.
72. (a) From the equation, the slope is 200.02. This means that the number of radio stations increased by an average of 200.02 per year.
(b) The year 2018 is represented by x = 68. 200.02682727.716,329.06 y
According to the model, there will be about 16,329 radio stations in 2018.
73.
20132008 335,652270,334 2013200820132008 65,318 13,063.6 5 ff
The average annual rate of change from 2008 through 2013 is about 13,064 thousand.
74. 20142006 3.744.53 2014200620142006 0.79 0.099 8 ff
The average annual rate of change from 2006 through 2014 is about –0.099.
75. (a)
The average rate of change was 8.17 thousand mobile homes per year.
(b) The negative slope means that the number of mobile homes decreased by an average of 8.17 thousand each year from 2003 to 2013.
76.
There was an average decrease of 1.6 births per thousand per year from 1991 through 2013.
77. (a)
10500Cxx
35 Rxx
(d)
1050035 50025 20 CxRx xx x x
20 units; do not produce
78. (a) 1502700Cxx
(b)
280 Rxx (c)
PxRxCx xx xx x
2801502700 2801502700 1302700
(d)
79. (a)
21 units; produce
CxRx xx x x
1502700280 2700130 20.77 or 21 units
4001650Cxx
(b) 305 Rxx (c)
PxRxCx xx xx x
3054001650 3054001650 951650
(d)
4001650305 9516500 951650 17.37units CxRx xx x x x
This result indicates a negative “breakeven point,” but the number of units produced must be a positive number. A calculator graph of the lines 1 4001650yCxx and 2 305 yRxx in the window [0, 70] × [0, 20000] or solving the inequality 3054001650 xx will show that
RxCx for all positive values of x (in fact whenever x is greater than 17.4). Do not produce the product because it is impossible to make a profit.
Cx
Rx
80. (a) 11180Cxx (b) 20 Rxx
(c)
2011180 20111809180
1118020 1809 20 CxRx xx x x
20 units; produce
2001000240 10004025 CxRxxx xx The break-even point is 25 units. (25)200251000$6000 C which is the same as (25)24025$6000 R
82. 2201000240 10002050 CxRxxx xx
The break-even point is 50 units instead of 25 units. The manager is not better off because twice as many units must be sold before beginning to show a profit.
83. The first two points are A(0, –6) and B(1, –3).
3 – (–6)3 3 1 – 01 m
84. The second and third points are B(1, –3) and C(2, 0).
0 – (–3)3 3 2 – 11 m
85. If we use any two points on a line to find its slope, we find that the slope is the same in all cases.
86. The first two points are A(0, –6) and B(1, –3).
22 22 (,)(1 – 0)[–3 – (–6)] 131910 dAB
87. The second and fourth points are B(1, –3) and D(3, 3).
22 22 (,)(3 – 1)[3 – (–3)] 26436 40210 dBD
88. The first and fourth points are A(0, –6) and D(3, 3).
22 22 (,)(3 – 0)[3 – (–6)] 39981 90310 dAD
89. 10210310; The sum is 310, which is equal to the answer in Exercise 88.
90. If points A, B, and C lie on a line in that order, then the distance between A and B added to the distance between B and C is equal to the distance between A and C
91. The midpoint of the segment joining A(0, –6) and G(6, 12) has coordinates
06612 22 , 66 22 , 3,3. The midpoint is M(3, 3), which is the same as the middle entry in the table.
92. The midpoint of the segment joining E(4, 6) and F(5, 9) has coordinates
4569915 2222 ,, = (4.5, 7.5). If the x-value 4.5 were in the table, the corresponding y-value would be 7.5.
Chapter 2 Quiz (Sections 2.1 2.4)
1. 22 2121 22 22 (,) 8(4)32 (4)(5)162541
2. To find an estimate for 2006, find the midpoint of (2004, 6.55) and (2008, 6.97: 200420086.556.97 , 22 2006,6.76 M
The estimated enrollment for 2006 was 6.76 million.
To find an estimate for 2010, find the midpoint of (2008, 6.97) and (2012, 7.50):
200820126.977.50 , 22 2010,7.235 M
The estimated enrollment for 2006 was about 7.24 million.
3. 4.
5. 22 4830xyxy
Complete the square on x and y separately. 22 22 (44)(816)3416 (2)(4)17 xxyy xy
The radius is 17 and the midpoint of the circle is (2, 4).
6. From the graph, f( 1) is 2.
7. Domain: (,); range: [0,)
Copyright © 2017 Pearson Education, Inc.
8. (a) The largest open interval over which f is decreasing is (,3)
(b) The largest open interval over which f is increasing is 3,
(c) There is no interval over which the function is constant.
9. (a) 11563 5142 m
(b) 440 0 1(7)6 m
(c) 41216 660 m the slope is undefined.
10. The points to use are (2009, 10,602) and (2013, 15,884). The average rate of change is 15,88410,6025282 1320.5 201320094
The average rate of change was 1320.5 thousand cars per year. This means that the number of new motor vehicles sold in the United States increased by an average of 1320.5 thousand per year from 2009 to 2013.
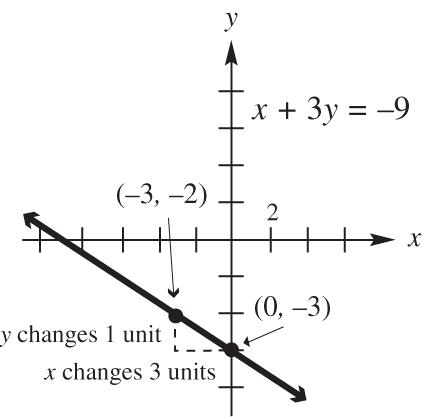
Section 2.5 Equations of Lines and Linear Models
1. The graph of the line 348yx has slope 4 and passes through the point (8, 3).
2. The graph of the line 27yx has slope –2 and y-intercept (0, 7).
3. The vertical line through the point (–4, 8) has equation x = –4.
4. The horizontal line through the point (–4, 8) has equation y = 8. For exercises 5 and 6, 6 7 67076 xyyxyx
5. Any line parallel to the graph of 670 xy must have slope 6 7
6. Any line perpendicular to the graph of 670 xy must have slope 7 6
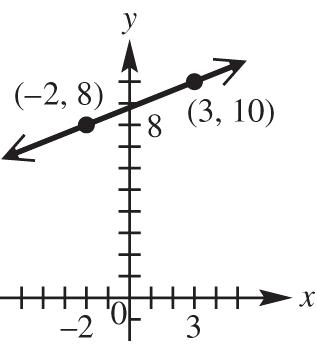
7. 1 4 2 yx is graphed in D. The slope is 1 4 and the y-intercept is (0, 2).
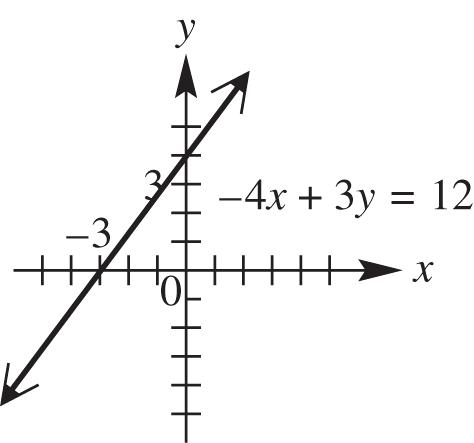
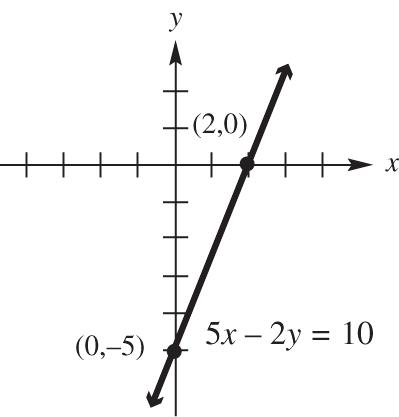
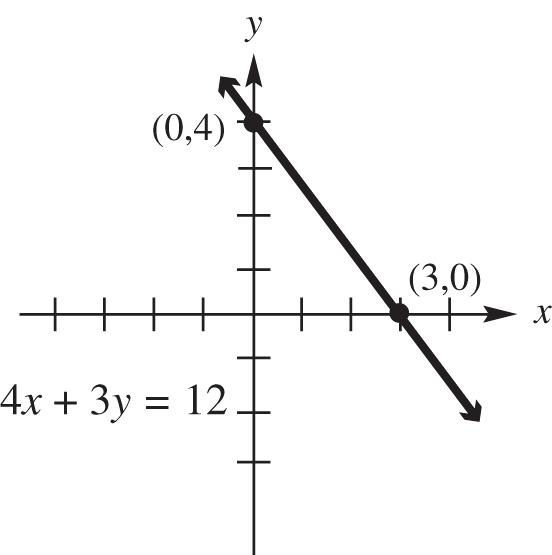
8. 4x + 3y = 12 or 3y = –4x + 12 4 3 or –4yx is graphed in B. The slope is 4 3 – and the y-intercept is (0, 4).
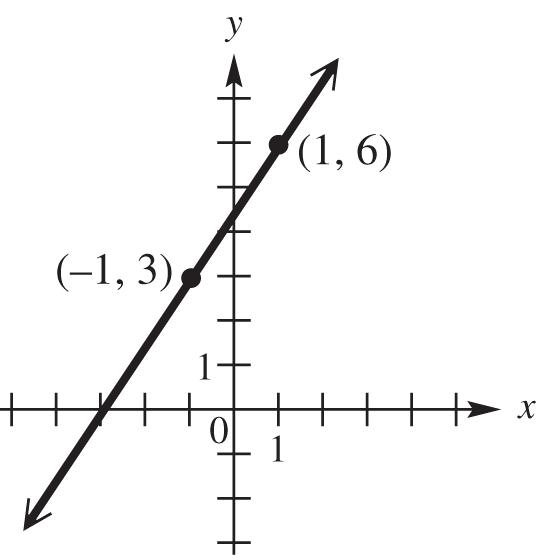
9. 3 2 – 11yx is graphed in C. The slope is 3 2 and a point on the graph is (1, –1).
10. y = 4 is graphed in A y = 4 is a horizontal line with y-intercept (0, 4).
11. Through (1, 3), m = –2.
Write the equation in point-slope form.
11 – –3–2–1yymxxyx
Then, change to standard form. 3–2225yxxy
12. Through (2, 4), m = –1
Write the equation in point-slope form.
11 – –4–1–2yymxxyx
Then, change to standard form. – 4–26yxxy
13. Through (–5, 4), 3 2 m
Write the equation in point-slope form.
3 2 – 45yx
Change to standard form.
2–4–35 2–8–3–15 32–7 yx yx xy
14. Through 3 4 (–4, 3), m
Write the equation in point-slope form.
3 4 – 34yx
Change to standard form.
4334 412312 3424or 3424 yx yx xyxy
15. Through (–8, 4), undefined slope
Because undefined slope indicates a vertical line, the equation will have the form x = a
The equation of the line is x = –8.
16. Through (5, 1), undefined slope
This is a vertical line through (5, 1), so the equation is x = 5.
17. Through (5, 8), m = 0
This is a horizontal line through (5, 8), so the equation is y = 8.
18. Through ( 3, 12), m = 0
This is a horizontal line through ( 3, 12), so the equation is y = 12.
19. Through (–1, 3) and (3, 4)
First find m. 4–31
3–(–1)4 m
Use either point and the point-slope form.
1 4 – 4–3 4163 413 413 yx yx xy xy
20. Through (2, 3) and ( 1, 2)
First find m 2311 1233
Use either point and the point-slope form.
1 3 3–2 3–92 37 37 yx yx xy xy
21. x-intercept (3, 0), y-intercept (0, –2)
The line passes through (3, 0) and (0, –2). Use these points to find m. –2 –02 0–33 m
Using slope-intercept form we have 2 3 – 2. yx
22. x-intercept (–4, 0), y-intercept (0, 3)
m
The line passes through the points (–4, 0) and (0, 3). Use these points to find m 3–03 0–(–4)4
Using slope-intercept form we have 3 4 3. yx
23. Vertical, through (–6, 4)
The equation of a vertical line has an equation of the form x = a. Because the line passes through (–6, 4), the equation is x = –6. (Because the slope of a vertical line is undefined, this equation cannot be written in slope-intercept form.)
24. Vertical, through (2, 7)
The equation of a vertical line has an equation of the form x = a. Because the line passes through (2, 7), the equation is x = 2. (Because the slope of a vertical line is undefined, this equation cannot be written in slope-intercept form.)
25. Horizontal, through ( 7, 4)
The equation of a horizontal line has an equation of the form y = b. Because the line passes through ( 7, 4), the equation is y = 4.
26. Horizontal, through ( 8, 2)
The equation of a horizontal line has an equation of the form y = b. Because the line passes through ( 8, 2), the equation is y = 2.
27. m = 5, b = 15
Using slope-intercept form, we have 515.yx
28. m = 2, b = 12
Using slope-intercept form, we have 212.yx
29. Through ( 2, 5), slope = 4
542 542 548 43 yx yx yx yx
30. Through (4, 7), slope = 2
724 728 21 yx yx yx
31. slope 0, y-intercept 3 2 0,
These represent 3 2 0 and . mb
Using slope-intercept form, we have 33 22 0.yxy
32. slope 0, y-intercept 5 4 0,
These represent 5 4 0 and . mb
Using slope-intercept form, we have 55 44 0.yxy
33. The line x + 2 = 0 has x-intercept (–2, 0). It does not have a y-intercept. The slope of his line is undefined. The line 4y = 2 has y-intercept 1 2 0,. It does not have an x-intercept. The slope of this line is 0.
34. (a) The graph of y = 3x + 2 has a positive slope and a positive y-intercept. These conditions match graph D.
(b) The graph of y = –3x + 2 has a negative slope and a positive y-intercept. These conditions match graph B.
(c) The graph of y = 3x – 2 has a positive slope and a negative y-intercept. These conditions match graph A.
(d) The graph of y = –3x – 2 has a negative slope and a negative y-intercept. These conditions match graph C.
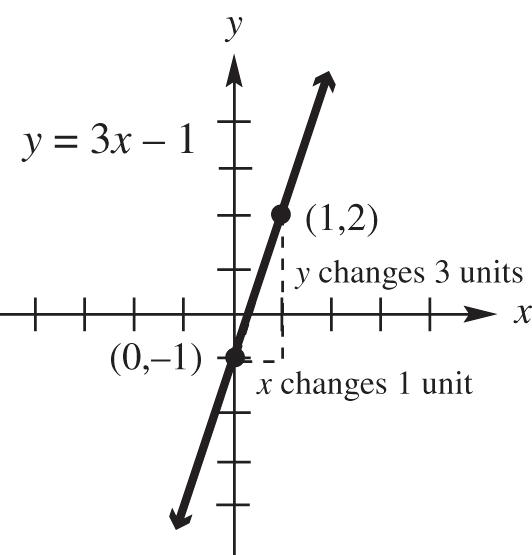
35. y = 3x – 1
This equation is in the slope-intercept form, y = mx + b slope: 3; y-intercept: (0, –1)
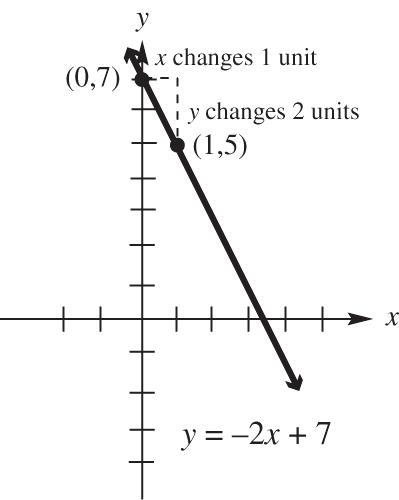
36. y = –2x + 7 slope: –2; y-intercept: (0, 7)
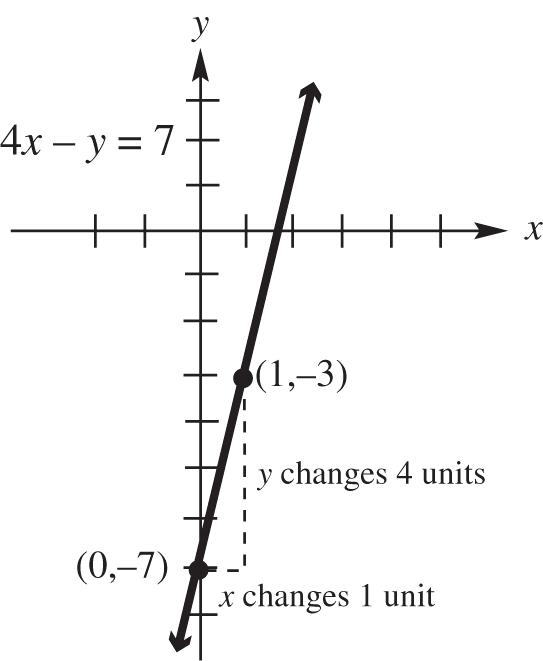
37. 4x – y = 7
Solve for y to write the equation in slopeintercept form. –
–474–7yxyx slope: 4; y-intercept: (0, –7)
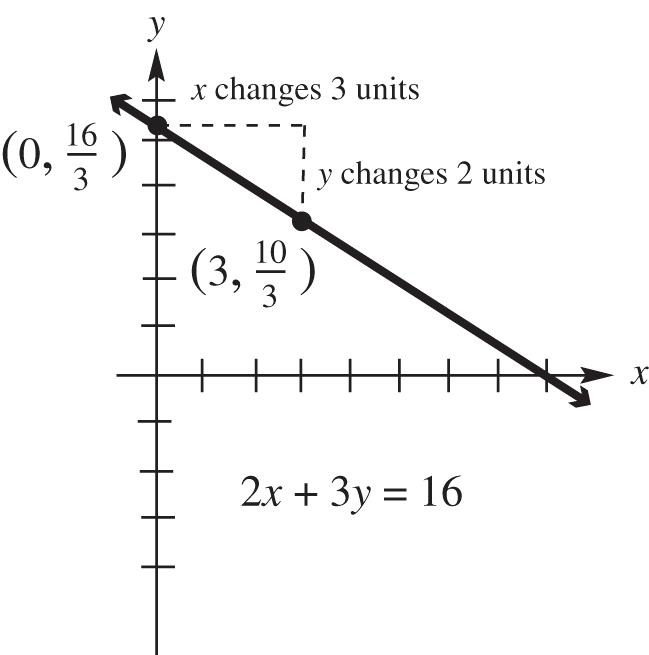
38. 2x + 3y = 16
Solve the equation for y to write the equation in slope-intercept form.
16 2 33 3–216–yxyx slope: 2 3 – ; y-intercept: 16 3 0,
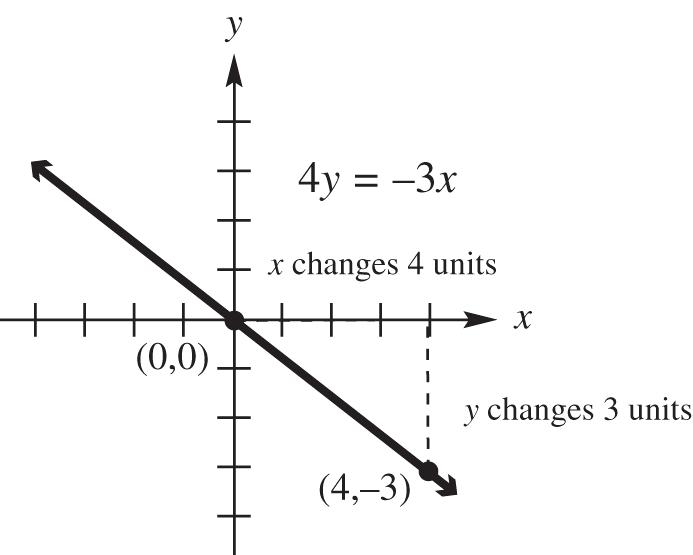
39. 33 44 4–3– or 0 yxyxyx
slope: 3 4 ; y-intercept (0, 0)
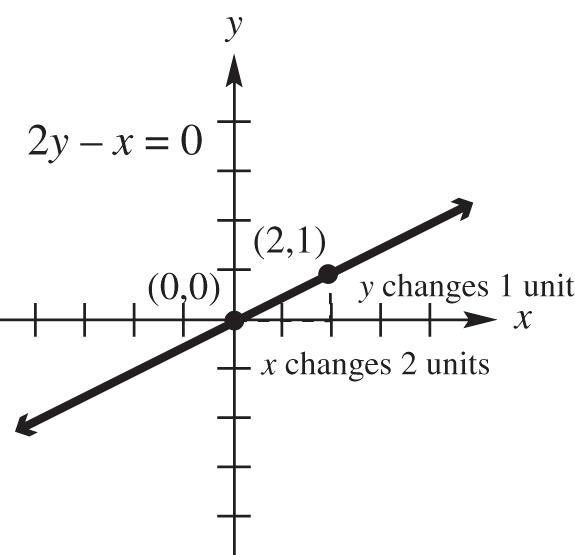
40. 11 2or22 0 yxyxyx
slope is 1 2 ; y-intercept: (0, 0)
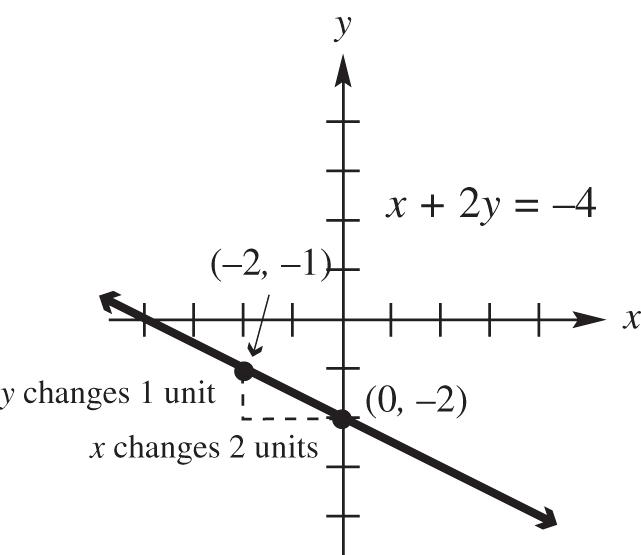
41. 24xy
Solve the equation for y to write the equation in slope-intercept form.
1 2 2–4–2 yxyx
slope: 1 2 – ; y-intercept: (0, 2)
Copyright © 2017 Pearson Education, Inc.
42. 39xy
Solve the equation for y to write the equation in slope-intercept form. 1 3
3–9–3 yxyx
slope: 1 3 – ; y-intercept: (0, 3)
43. 3 2 10 yx
Solve the equation for y to write the equation in slope-intercept form.
33 22101yxyx
slope: 3 2 ; y-intercept: (0, 1)
44. (a) Use the first two points in the table, A(–2, –11) and B(–1, –8). –8 – (–11)3 3 –1 – (–2)1 m
(b) When x = 0, y = 5. The y-intercept is (0, –5).
(c) Substitute 3 for m and –5 for b in the slope-intercept form.
3–5ymxbyx
45. (a) The line falls 2 units each time the x value increases by 1 unit. Therefore the slope is 2. The graph intersects the y-axis at the point (0, 1) and intersects the x-axis at 1 2 ,0 , so the y-intercept is (0, 1) and the x-intercept is 1 2 ,0.
(b) An equation defining f is y = 2x + 1.
46. (a) The line rises 2 units each time the x value increases by 1 unit. Therefore the slope is 2. The graph intersects the y-axis at the point (0, 1) and intersects the x-axis at 1 2 ,0 , so the y-intercept is (0, 1) and the x-intercept is 1 2 ,0.
(b) An equation defining f is y = 2x 1.
47. (a) The line falls 1 unit each time the x value increases by 3 units. Therefore the slope is 1 3 . The graph intersects the y-axis at the point (0, 2), so the y-intercept is (0, 2). The graph passes through (3, 1) and will fall 1 unit when the x value increases by 3, so the x-intercept is (6, 0).
(b) An equation defining f is 1 3 2. yx
48. (a) The line rises 3 units each time the x value increases by 4 units. Therefore the slope is 3 4 . The graph intersects the y-axis at the point (0, 3) and intersects the x-axis at (4, 0), so the y-intercept is (0, 3) and the x-intercept is 4.
(b) An equation defining f is 3 4 3. yx
49. (a) The line falls 200 units each time the x value increases by 1 unit. Therefore the slope is 200. The graph intersects the y-axis at the point (0, 300) and intersects the x-axis at 3 2 ,0, so the y-intercept is (0, 300) and the x-intercept is 3 2 ,0.
(b) An equation defining f is y = 200x + 300.
50. (a) The line rises 100 units each time the x value increases by 5 units. Therefore the slope is 20. The graph intersects the y-axis at the point (0, 50) and intersects the x-axis at 5 2 ,0, so the y-intercept is (0, 50) and the x-intercept is 5 2 ,0.
(b) An equation defining f is y = 20x 50.
51. (a) through (–1, 4), parallel to x + 3y = 5
Find the slope of the line x + 3y = 5 by writing this equation in slope-intercept form.
5 1 33 353–5 –xyyx yx
The slope is 1 3
Because the lines are parallel, 1 3 is also the slope of the line whose equation is to be found. Substitute 1 3 m , 1 –1, x and 1 4 y into the point-slope form.
11 1 3 1 3 – –4––1 –41 3–12––1311 yymxx yx yx yxxy
(b) Solve for y 111 33 3–11–yxyx
52. (a) through (3, –2), parallel to 2x – y = 5
Find the slope of the line 2x – y = 5 by writing this equation in slope-intercept form.
2–5––25 2–5 xyyx yx
The slope is 2. Because the lines are parallel, the slope of the line whose equation is to be found is also 2. Substitute m = 2, 1 3 x , and 1 2 y into the point-slope form.
11 – –22–322–6 –2–8 or 2–8 yymxx yxyx xyxy
(b) Solve for yy = 2x – 8
53. (a) through (1, 6), perpendicular to 3x + 5y = 1
Find the slope of the line 3x + 5y = 1 by writing this equation in slope-intercept form.
3515–31 –xyyx yx
3 1 55
This line has a slope of 3 5 . The slope of any line perpendicular to this line is 5 3 , because 35 53 1. Substitute 5 3 m , 1 1, x and 1 6 y into the point-slope form.
5 3 –6(–1) 3(–6)5(–1) 3–185–5 –135–3or 5–3–13 yx yx yx xyxy
(b) Solve for y. 513 33 3513yxyx
54. (a) through (–2, 0), perpendicular to 8x – 3y = 7
Find the slope of the line 8x – 3y = 7 by writing the equation in slope-intercept form.
87 33 8–37–3–87 –xyyx yx
This line has a slope of 8 3 . The slope of any line perpendicular to this line is 3 8 , because 83 38 1.
Substitute 3 8 m , 1 2, x and 1 0 y into the point-slope form.
3 8 –0–(2) 8–3(2) 8–3–638–6 yx yx yxxy
(b) Solve for y. 36 88 33 84 8–3–6––yxyx yx
55. (a) through (4, 1), parallel to y = 5
Because y = 5 is a horizontal line, any line parallel to this line will be horizontal and have an equation of the form y = b Because the line passes through (4, 1), the equation is y = 1.
(b) The slope-intercept form is y = 1.
56. (a) through 2,2, parallel to y = 3.
Because y = 3 is a horizontal line, any line parallel to this line will be horizontal and have an equation of the form y = b. Because the line passes through 2,2, the equation is y = –2.
(b) The slope-intercept form is y = 2
57. (a) through (–5, 6), perpendicular to x = –2.
Because x = –2 is a vertical line, any line perpendicular to this line will be horizontal and have an equation of the form y = b. Because the line passes through (–5, 6), the equation is y = 6.
Copyright © 2017 Pearson Education, Inc.
(b) The slope-intercept form is y = 6.
58. (a) Through (4, –4), perpendicular to x = 4
Because x = 4 is a vertical line, any line perpendicular to this line will be horizontal and have an equation of the form y = b. Because the line passes through (4, –4), the equation is y = –4.
(b) The slope-intercept form is y = –4.
59. (a) Find the slope of the line 3y + 2x = 6. 2 3 3263–26 –2 yxyx yx
Thus, 2 3 –. m A line parallel to 3y + 2x = 6 also has slope 2 3 –. Solve for k using the slope formula.
(b) Find the slope of the line 2y – 5x = 1. 5 1 22 251251 yxyx yx
Thus, 5 2 . m A line perpendicular to 2y – 5x = 1 will have slope 2 5 –, because
5 2 25 – –1. Solve this equation for k
60. (a) Find the slope of the line 2–34. xy 24 33 2–34–3–24 –xyyx yx
Thus, 2 3 m A line parallel to 2x – 3y = 4 also has slope 2 3 . Solve for r using the slope formula.
–62–62 –4–23–63 –62 66 –63 642 rr r rr
(b) Find the slope of the line x + 2y = 1. 11 22 212–1 –xyyx yx
Thus, 1 2 m A line perpendicular to the line x + 2y = 1 has slope 2, because 1 2 – (2)–1. Solve for r using the slope formula.
–6–6 22 –4–2–6 –6–12–6 rr rr
61. (a) First find the slope using the points (0, 6312) and (3, 7703).
770363121391 463.67 303 m
The y-intercept is (0, 6312), so the equation of the line is 463.676312.yx
(b) The value x = 4 corresponds to the year 2013. 463.67463128166.68 y
The model predicts that average tuition and fees were $8166.68 in 2013. This is $96.68 more than the actual amount.
62. (a) First find the slope using the points (0, 6312) and (2, 7136).
71366312824 412 202 m
The y-intercept is (0, 6312), so the equation of the line is 4126312.yx
(b) The value x = 4 corresponds to the year 2013.
412463127960 y
The model predicts that average tuition and fees were $7960 in 2013. This is $110 less than the actual amount.
63. (a) First find the slope using the points (0, 22036) and (4, 24525). 24525220362489 622.25 404 m
The y-intercept is (0, 22036), so the equation of the line is 622.2522,036.yx
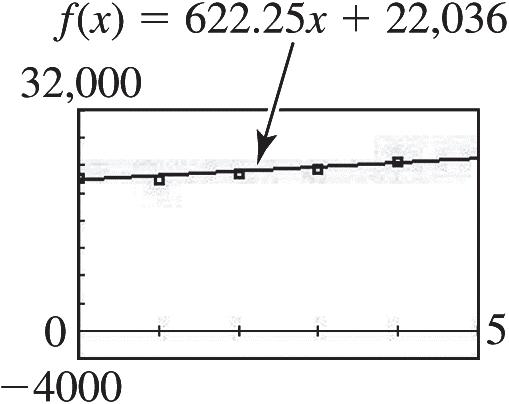
The slope of the line indicates that the average tuition increase is about $622 per year from 2009 through 2013.
(b) The year 2012 corresponds to x = 3.
622.25322,03623,902.75 y
According to the model, average tuition and fees were $23,903 in 2012. This is $443 more than the actual amount $23,460.
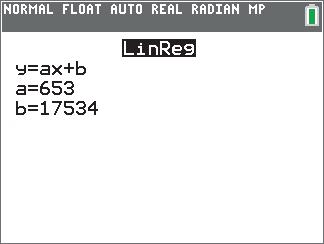
(c) Using the linear regression feature, the equation of the line of best fit is 65321,634.yx
64. (a) See the graph in the answer to part (b).There appears to be a linear relationship between the data. The farther the galaxy is from Earth, the faster it is receding.
(b) Using the points (520, 40,000) and (0, 0), we obtain 40,000–040,000 76.9. 520–0520 m
The equation of the line through these two points is y = 76.9x.
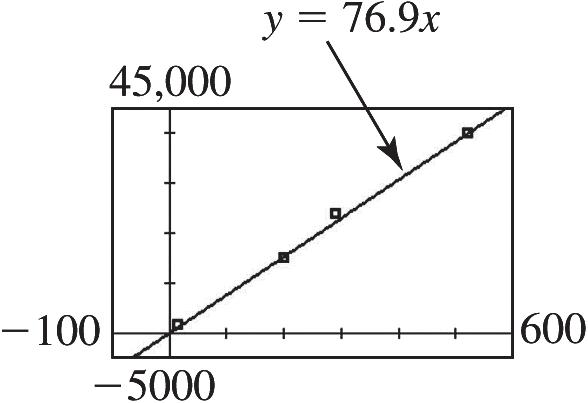
(c) 76.9 60,000 60,000 780 76.9 x xx
According to the model, the galaxy Hydra is approximately 780 megaparsecs away.
Using m = 76.9, we estimate that the age of the universe is approximately 12.35 billion years.
(e) 11 109 11 9 9.510 1.910 or 1910 50 9.510 9.510 100 A A
The range for the age of the universe is between 9.5 billion and 19 billion years.
65. (a) The ordered pairs are (0, 32) and (100, 212).
The slope is 212–321809 100–01005 m
Use 9 11 5 (, )(0,32) and xym in the point-slope form. 11 9 5 9 5 99 55 –(–) –32(–0) –32 32 32 yymxx yx yx yxFC
(b) 9 5 5 9 32 5932 5916095–160 95(–32)(–32) FC FC FCCF CFCF
(c) 5 9 (–32) 95(–32)95–160 4–160–40 FCFF FFFF FF F = C when F is –40º.
66. (a) The ordered pairs are (0, 1) and (100, 3.92).
The slope is 3.92–12.92 0.0292 100–0100 m and 1. b
Using slope-intercept form we have 0.02921yx or()0.02921. pxx
(b) Let x = 60. P(60) = 0.0292(60) + 1 = 2.752
The pressure at 60 feet is approximately 2.75 atmospheres.
67. (a) Because we want to find C as a function of I, use the points (12026, 10089) and (14167, 11484), where the first component represents the independent variable, I. First find the slope of the line. 11484100891395 0.6516 14167120262141 m
Now use either point, say (12026, 10089), and the point-slope form to find the equation.
100890.6516(–12026)
100890.6516–7836 0.65162253
(b) Because the slope is 0.6516, the marginal propensity to consume is 0.6516.
68. D is the only possible answer, because the x-intercept occurs when y = 0. We can see from the graph that the value of the x-intercept exceeds 10.
69. Write the equation as an equivalent equation with 0 on one side: 2742 xxx 27420 xxx . Now graph 2742yxxx in the window [–5, 5] × [–5, 5] to find the x-intercept:
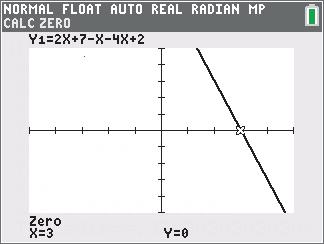
Solution set: {3}
70. Write the equation as an equivalent equation with 0 on one side: 724531 xxx 7245310 xxx . Now graph 724531yxxx in the window [–5, 5] × [–5, 5] to find the x-intercept:
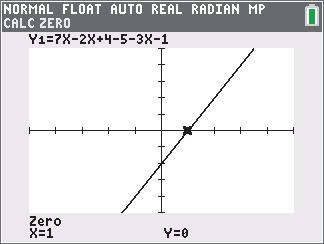
Solution set: {1}
71. Write the equation as an equivalent equation with 0 on one side: 321225 xx
3212250 xx . Now graph
321225yxx in the window [–5, 5] × [–5, 5] to find the x-intercept:
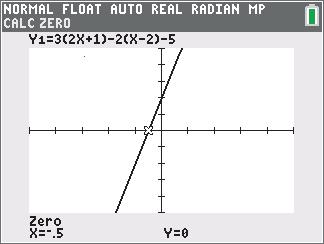
Solution set: 1 2 or 0.5
72. Write the equation as an equivalent equation with 0 on one side:
43422362 xxxx
434223620 xxxx Now graph
43422362yxxxx in the window [–2, 8] × [–5, 5] to find the x-intercept:
Solution set: {4}
73. (a) 252 2102 102 12 xx xx x x
Solution set: {12}
(b) Answers will vary. Sample answer: The solution does not appear in the standard viewing window x-interval [10, –10]. The minimum and maximum values must include 12.
74. Rewrite the equation as an equivalent equation with 0 on one side.
326482 6184820 xxx xxx
Now graph y = 6x 18 ( 4x + 8 2x) in the window [–10, 10] × [–30, 10].
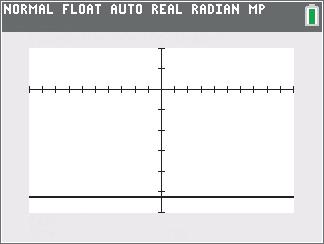
The graph is a horizontal line that does not intersect the x-axis. Therefore, the solution set is . We can verify this algebraically.
326482 61868026 xxx xx
Because this is a false statement, the solution set is
75. A(–1, 4), B(–2, –1), C(1, 14)
For A and B, 145 5 2(1)1 m
For B and C, 14(1)15 5 1(2)3 m
For A and C, 14410 5 1(1)2 m
Since all three slopes are the same, the points are collinear.
76. A(0, 7), B(–3, 5), C(2, 15)
For A and B, 5(7)12 4 303 m
For B and C, 15520 4 2(3)5 m
For A and C, 15(7)8 4 202 m
Since all three slopes are the same, the points are collinear.
77. A( 1, 3), B( 5, 12), C(1, 11)
For A and B, 12(3)15 5(1)4 m
For B and C, 111223 1(5)6 m
For A and C, 11(3)8 4 1(1)2 m
Since all three slopes are not the same, the points are not collinear.
78. A(0, 9), B(–3, –7), C(2, 19)
For A and B, 791616 3033 m
For B and C, 19(7)26 2(3)5 m
For A and C, 19910 5 202 m
Because all three slopes are not the same, the points are not collinear.
79. 22 111 222 111 (,)(–0)(–0) dOPxmx xmx
80. 22 222 222 222 (,)(–0)(–0) dOQxmx xmx
81. 22 212211 (,)(–)(–) dPQxxmxmx
82.
[(,)][(,)][(,)] dOPdOQdPQ xmxxmx xxmxmx xmxxmx xxmxmx
222 22 222222 111222 2 22 212211 222222 111222 22 212211
222222 111222 2222 221122 22 121211 211212 12121 2 2 022 220 xmxxmx xxxxmx mmxxmx xxmmxx mmxxxx
83. 121212 1212 –2–20 –2(1)0 mmxxxx xxmm
84. 1212 –2(1)0 xxmm Because 12 0 and 0, xx we have 1212 10 implying that –1. mmmm
Copyright © 2017 Pearson Education, Inc.
85. If two nonvertical lines are perpendicular, then the product of the slopes of these lines is –1.
Summary Exercises on Graphs, Circles, Functions, and Equations
1. (3,5), (2,3) PQ
(a)
22 22 (,)(23)(35) 18 16465
(b) The midpoint M of the segment joining points P and Q has coordinates
53 32525 , 22222,,1
(c) First find m: 3–58 8 2–31 m
Use either point and the point-slope form.
– 58–3yx
Change to slope-intercept form. 5824819yxyx
2. P(–1, 0), Q(4, –2)
(a) 22 22 (,)[4–(–1)](–2–0) 5(–2) 25429 dPQ
(b) The midpoint M of the segment joining points P and Q has coordinates – 140(–2)32 , , 2222 3 ,1. 2
(c) First find m: 2–022 4–155 m
Use either point and the point-slope form.
2 5
Change to slope-intercept form.
22 55 521 522
3. P(–2, 2), Q(3, 2)
(b) The midpoint M of the segment joining points P and Q has coordinates – 2322 , 22
(c) First find m:
All lines that have a slope of 0 are horizontal lines. The equation of a horizontal line has an equation of the form y = b. Because the line passes through (3, 2), the equation is y = 2.
22,2, P
2,32 Q (a)
22 22 (,)2–2232–2 –222 2810 dPQ
(b) The midpoint M of the segment joining points P and Q has coordinates 222232 , 22
324232 222,,22.
(c) First find m: 32222 2 2222 m
Use either point and the point-slope form.
– 22–22yx
Change to slope-intercept form. – 2242252yxyx
5. P(5, –1), Q(5, 1) (a) 22 22 (,)(5–5)[1–(–1)] 020442 dPQ
(b) The midpoint M of the segment joining points P and Q has coordinates 55–11 , 22
100 22,5,0.
Copyright © 2017 Pearson Education, Inc.
(c) First find m. 1–1 2 undefined 5–50 m
All lines that have an undefined slope are vertical lines. The equation of a vertical line has an equation of the form x = a The line passes through (5, 1), so the equation is x = 5. (Because the slope of a vertical line is undefined, this equation cannot be written in slope-intercept form.)
6. (1,1), (3,3) PQ
(a)
7.
22 22 (,)(3–1)(3–1) 44 16163242 dPQ
(b) The midpoint M of the segment joining points P and Q has coordinates
1313 , 22
22 , 22
(c) First find m: 3–14
Use either point and the point-slope form.
Change to slope-intercept form. 11 yxyx
23,35,63,35PQ
(a)
(b) The midpoint M of the segment joining points P and Q has coordinates
23633535 , 22 8365 22,43,35.
(c) First find m: 35350 0 632343 m
All lines that have a slope of 0 are horizontal lines. The equation of a horizontal line has an equation of the form y = b. Because the line passes through 23,35, the equation is 35. y
8. P(0, –4), Q(3, 1) (a) 22 22 (,)(3–0)[1–(–4)] 3592534 dPQ
(b) The midpoint M of the segment joining points P and Q has coordinates 03–413333 , 222222,,.
(c) First find m: 1–4 5 303 m
Using slope-intercept form we have 5 3 – 4. yx
9. Through 2,1 and 4,1
First find m: 1–121 4–(–2)63 m
Use either point and the point-slope form. 1 3 – 1–4yx
Change to slope-intercept form.
11 33 314334 31 yxyx yxyx
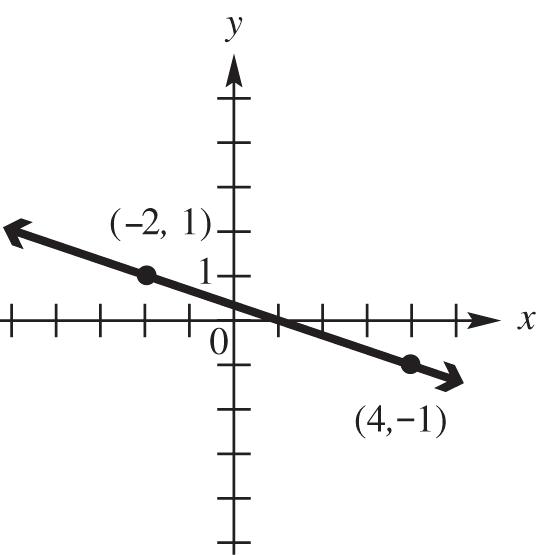
Copyright © 2017 Pearson Education, Inc.
10. the horizontal line through (2, 3)
The equation of a horizontal line has an equation of the form y = b. Because the line passes through (2, 3), the equation is y = 3.
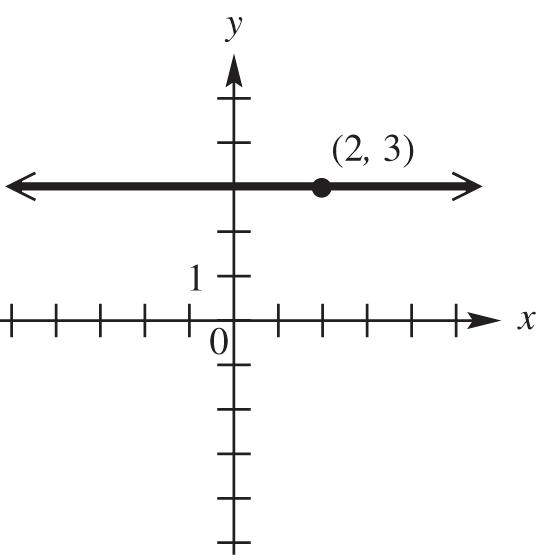
11. the circle with center (2, –1) and radius 3 2 22 22 (–2)–(–1)3 (–2)(1)9 xy xy
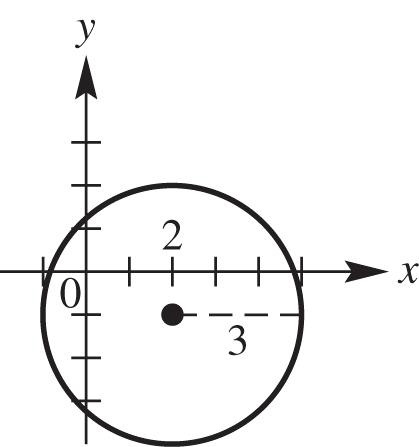
12. the circle with center (0, 2) and tangent to the x-axis
The distance from the center of the circle to the x-axis is 2, so r = 2. 22222 (–0)(–2)2(–2)4 xyxy
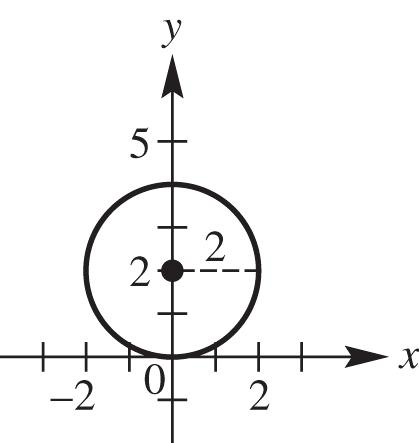
13. the line through (3, 5) with slope 5 6 Write the equation in point-slope form.
Change to standard form.
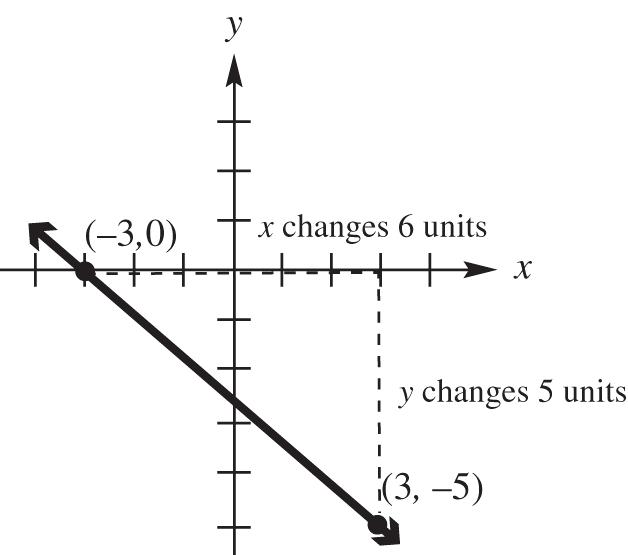
14. the vertical line through ( 4, 3)
The equation of a vertical line has an equation of the form x = a. Because the line passes through ( 4, 3), the equation is x = 4.
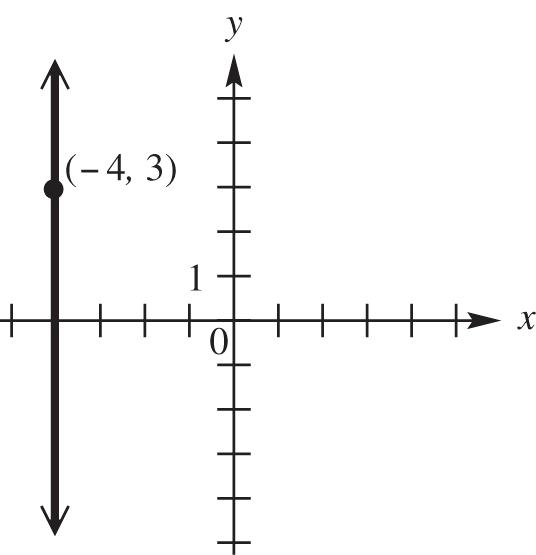
15. a line through (–3, 2) and parallel to the line 2x + 3y = 6
First, find the slope of the line 2x + 3y = 6 by writing this equation in slope-intercept form. 2 3 2363262 xyyxyx
The slope is 2 3 . Because the lines are parallel, 2 3 is also the slope of the line whose equation is to be found. Substitute 2 3 m , 1 3 x , and 1 2 y into the pointslope form.
2 11 3 2 3 – – 2 3 3223362–6 3–2 yymxxyx yxyx yxyx
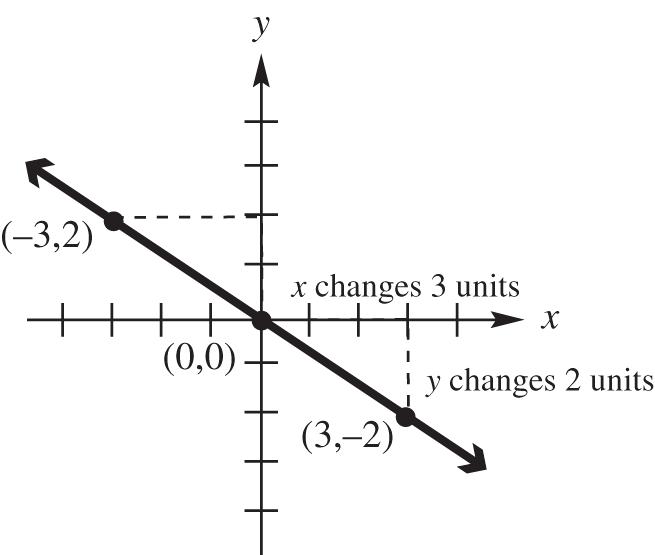
16. a line through the origin and perpendicular to the line 342 xy
First, find the slope of the line 342 xy by writing this equation in slope-intercept form. 3321 4442 3424–32 xyyx yxyx
This line has a slope of 3 4 The slope of any line perpendicular to this line is 4 3 , because 3 4 34 1. Using slope-intercept form we have 44 33 0 or .yxyx (continuedonnextpage)
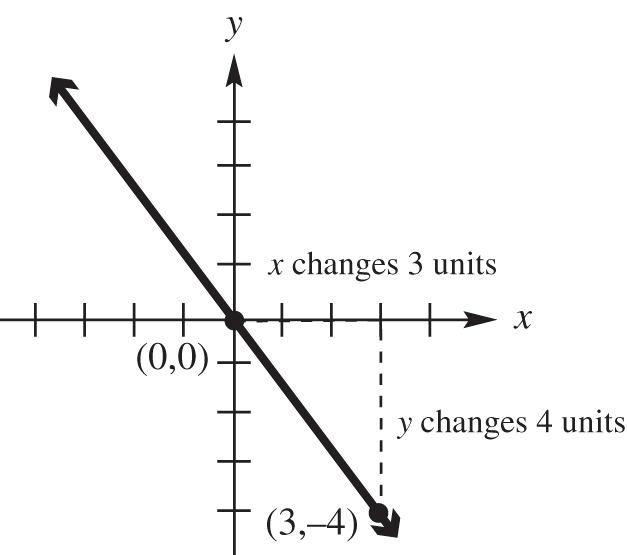
17. 22424 xxyy
Complete the square on x and y separately.
22 22 22 424 4421441 219 xxyy xxyy
Yes, it is a circle. The circle has its center at (2, 1) and radius 3.
18. 22610360 xxyy
Complete the square on x and y separately.
22 22 22 61036 691025–36925 352 xxyy xxyy
No, it is not a circle.
19. 2212200xxy
Complete the square on x and y separately.
22 22 2 2 1220 1236–2036 616 xxy xxy xy
Yes, it is a circle. The circle has its center at (6, 0) and radius 4.
20. 2221661 xxyy
Complete the square on x and y separately.
22 22 22 21661 211664–61164 184 xxyy xxyy xy
Yes, it is a circle. The circle has its center at ( 1, 8) and radius 2.
21. 222100xxy
Complete the square on x and y separately.
22 22 2 2 210 21–101 19 xxy xxy xy
No, it is not a circle.
22. 22 – 890xyy
Complete the square on x and y separately.
22 22 2 2 –89 – 816916 –425 xyy xyy xy
Yes, it is a circle. The circle has its center at (0, 4) and radius 5.
23. The equation of the circle is 222 (4)(5)4. xy
Let y = 2 and solve for x: 222 (4)(25)4 x 2222 (4)(3)4(4)7 xx 4747xx
The points of intersection are 47,2 and 47,2
24. Write the equation in center-radius form by completing the square on x and y separately:
22 22 22 22 10241440 10241440 (1025)(24144)25 (5)(12)25 xyxy xxyy xxyy xy
The center of the circle is (5, 12) and the radius is 5.
Now use the distance formula to find the distance from the center (5, 12) to the origin:
22 2121 22 (50)(120)2514413 dxxyy
The radius is 5, so the shortest distance from the origin to the graph of the circle is 13 5 = 8.
(continuedonnextpage)
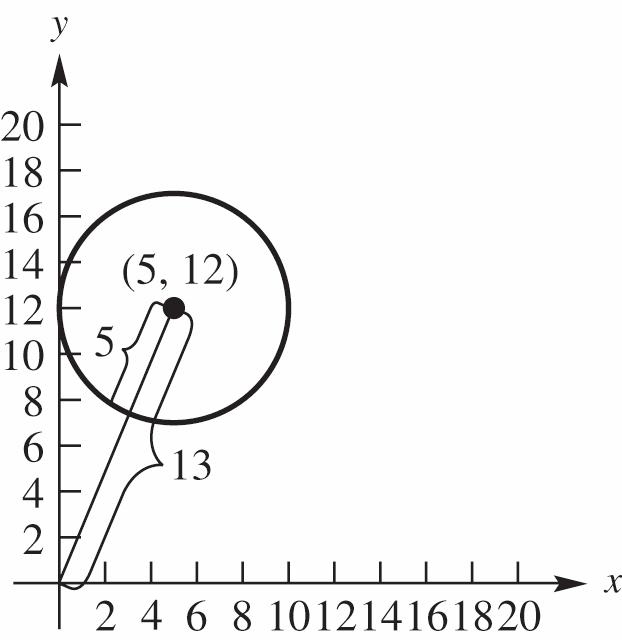
25. (a) The equation can be rewritten as 1163 4442 46 . yxyxyx x can be any real number, so the domain is all real numbers and the range is also all real numbers.
domain: ,; range: ,
(b) Each value of x corresponds to just one value of y. 46xy represents a function.
1133 4242yxfxx
33 112 2242222 1 f
26. (a) The equation can be rewritten as 2 5.yx y can be any real number. Because the square of any real number is not negative, 2 y is never negative. Taking the constant term into consideration, domain would be 5,. domain: 5,; range: ,
(b) Because ( 4, 1) and ( 4, 1) both satisfy the relation, 2 5 yx does not represent a function.
27. (a) 2 2 225xy is a circle centered at ( 2, 0) with a radius of 5. The domain will start 5 units to the left of –2 and end 5 units to the right of –2. The domain will be [ 2 5, 2 + 5] = [ 7, 3]. The range will start 5 units below 0 and end 5 units above 0. The range will be [0 5, 0 + 5] = [ 5, 5].
(b) Because ( 2, 5) and ( 2, 5) both satisfy the relation, 2 2 225xy does not represent a function.
28. (a) The equation can be rewritten as 22 3 1 22 23. yxyx x can be any real number. Because the square of any real number is not negative, 2 1 2 x is never negative. Taking the constant term into consideration, range would be
3 2 ,.
domain: ,; range: 3 2 ,
(b) Each value of x corresponds to just one value of y. 2 23xy represents a function.
112233 2222yxfxx
Section 2.6 Graphs of Basic Functions
1. The equation 2 fxx matches graph E. The domain is ,.
2. The equation of fxx matches graph G.
The function is increasing on 0,.
3. The equation 3 fxx matches graph A.
The range is ,.
4. Graph C is not the graph of a function. Its equation is 2 xy .
5. Graph F is the graph of the identity function. Its equation is fxx
6. The equation fxx matches graph B. 1.51 f
7. The equation 3 fxx matches graph H.
No, there is no interval over which the function is decreasing.
8. The equation of fxx matches graph D.
The domain is 0,.
9. The graph in B is discontinuous at many points. Assuming the graph continues, the range would be {…, 3, 2, 1, 0, 1, 2, 3, …}.
10. The graphs in E and G decrease over part of the domain and increase over part of the domain. They both increase over 0, and decrease over ,0.
11. The function is continuous over the entire domain of real numbers ,.
12. The function is continuous over the entire domain of real numbers ,.
13. The function is continuous over the interval
0,.
14. The function is continuous over the interval
,0.
15. The function has a point of discontinuity at (3, 1). It is continuous over the interval
,3 and the interval
3,.
16. The function has a point of discontinuity at x = 1. It is continuous over the interval
,1 and the interval
1,.
17. 2 if –1 () – 1 if –1 fxxxxx
(a) (–5)2(–5)–10 f
(b) (–1)2(–1)–2 f
(c) f(0) = 0 –1 = –1
(d) f(3) = 3 – 1 = 2
18. – 2 if 3 () 5– if 3 fxxx xx
(a) f(–5) = –5 – 2 = –7
(b) f(–1) = –1 – 2 = –3
(c) f(0) = 0 – 2 = –2
(d) f(3) = 5 – 3 = 2
19. 2 if –4 ()– if –42 3 if 2 xx fxxx xx
(a) f(–5) = 2 + (–5) = –3
(b) f(–1) = – (–1) = 1
(c) f(0) = –0 = 0
(d) (3)339 f
20. –2 if –3 3–1 if –32 –4 if 2 xx fxxx xx
(a) f(–5) = –2(–5) = 10
(b) f(–1) = 3(–1) – 1 = –3 – 1 = –4
(c) f(0) = 3(0) – 1 = 0 – 1 = –1
(d) f(3) = –4(3) = –12
21. – 1 if 3 () 2 if 3 fxxx x
Draw the graph of y = x – 1 to the left of x = 3, including the endpoint at x = 3. Draw the graph of y = 2 to the right of x = 3, and note that the endpoint at x = 3 coincides with the endpoint of the other ray.
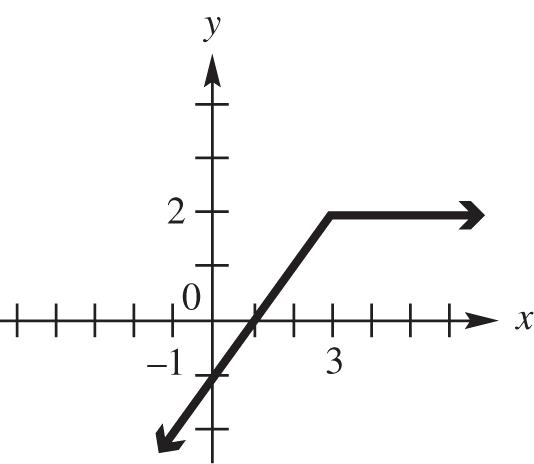
22. 6– if 3 () 3 if 3 fxxxx
Graph the line y = 6 – x to the left of x = 3, including the endpoint. Draw y = 3 to the right of x = 3. Note that the endpoint at x = 3 coincides with the endpoint of the other ray.
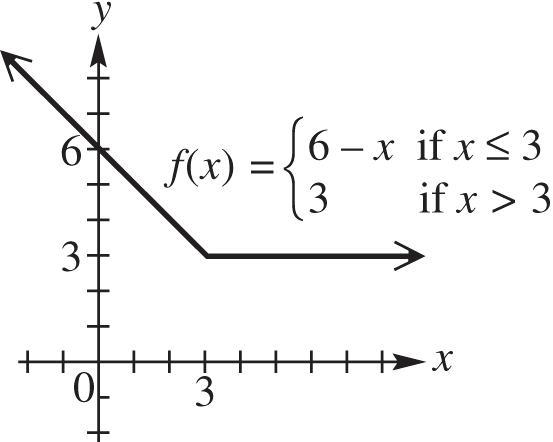
23. 4– if 2 () 12 if 2 fxxx xx
Draw the graph of y = 4 x to the left of x = 2, but do not include the endpoint. Draw the graph of y = 1 + 2x to the right of x = 2, including the endpoint.
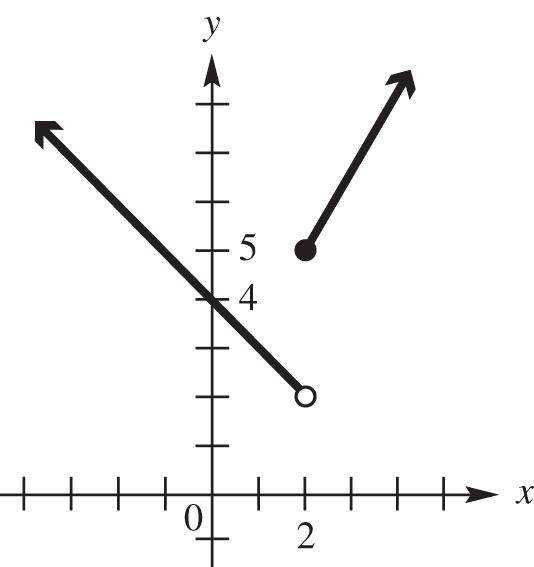
24. 21 if0 () if 0 fxxx xx
Graph the line y = 2x + 1 to the right of x = 0, including the endpoint. Draw y = x to the left of x = 0, but do not include the endpoint.
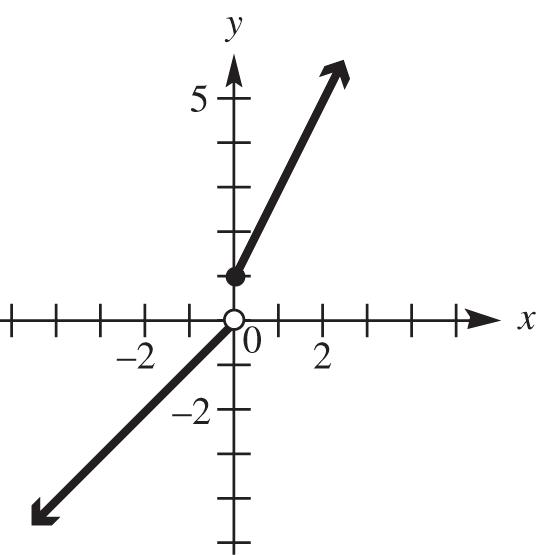
25. 3 if 1 () 1if 1 fxx x
Graph the line y = 3 to the left of x = 1, including the endpoint. Draw y = 1 to the right of x = 1, but do not include the endpoint.
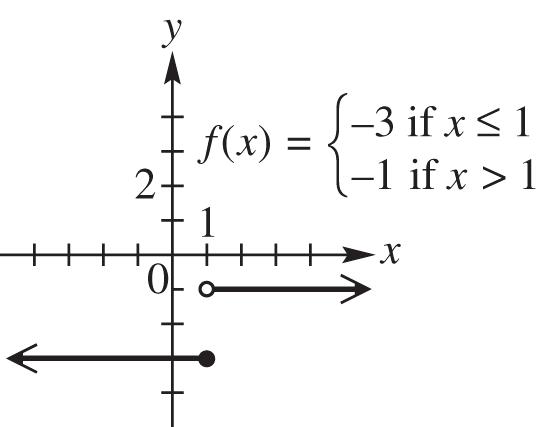
26. 2 if 1 () 2 if 1 fxx x
Graph the line y = – 2 to the left of x = 1, including the endpoint. Draw y = 2 to the right of x = 1, but do not include the endpoint.
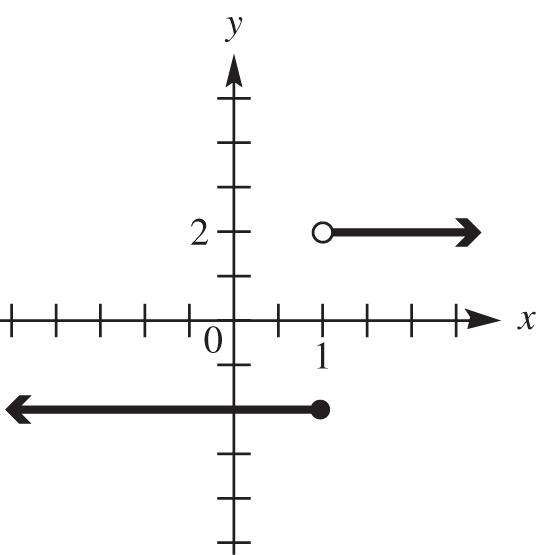
Exercise 26
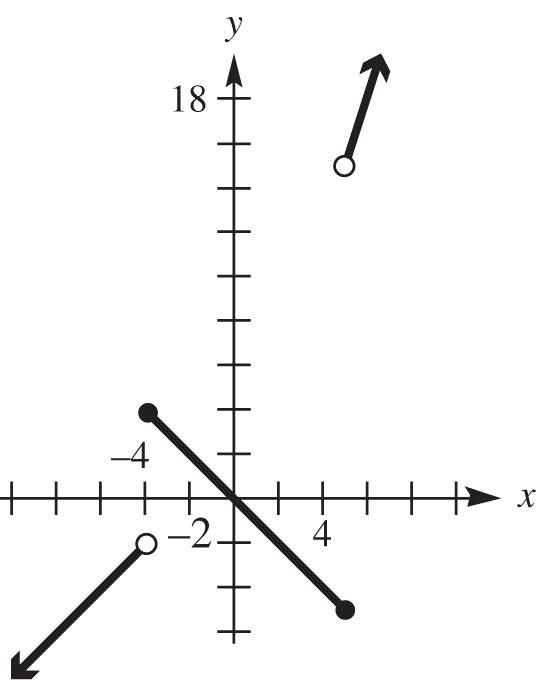
Exercise 27
27. 2 if –4 ()– if –45 3 if 5 xx fxxx xx
Draw the graph of y = 2 + x to the left of –4, but do not include the endpoint at x = 4. Draw the graph of y = –x between –4 and 5, including both endpoints. Draw the graph of y = 3x to the right of 5, but do not include the endpoint at x = 5.
28. –2 if –3 ()3–1 if –32 –4 if 2 xx fxxx xx
Graph the line y = –2x to the left of x = –3, but do not include the endpoint. Draw y = 3x – 1 between x = –3 and x = 2, and include both endpoints. Draw y = –4x to the right of x = 2, but do not include the endpoint. Notice that the endpoints of the pieces do not coincide.
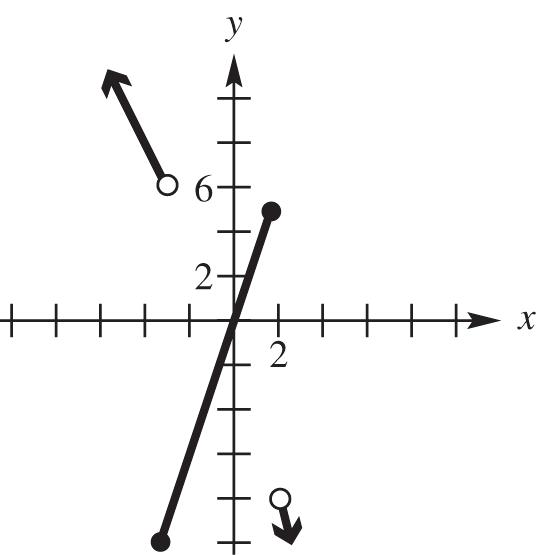
2 1 2 1 2 – +2 if 2 () if 2 xx fx xx
Graph the curve 2 1 2 2 yx to the left of x = 2, including the endpoint at (2, 0). Graph the line 1 2 yx to the right of x = 2, but do not include the endpoint at (2, 1). Notice that the endpoints of the pieces do not coincide.
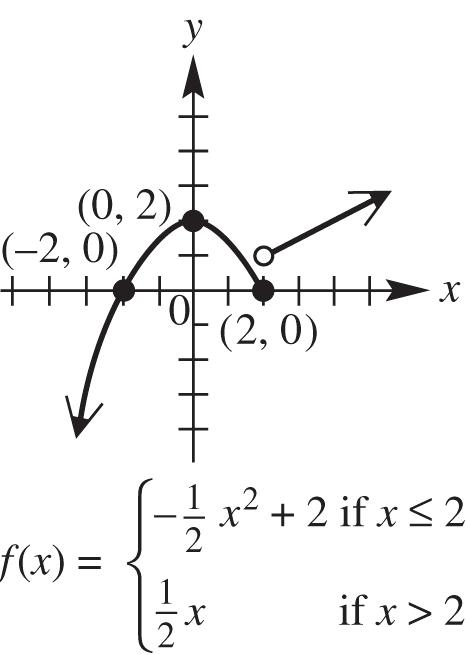
3 2 5if 0 () if 0 fxxx xx
Graph the curve 3 5 yx to the left of x = 0, including the endpoint at (0, 5). Graph the line 2 yx to the right of x = 0, but do not include the endpoint at (0, 0). Notice that the endpoints of the pieces do not coincide.
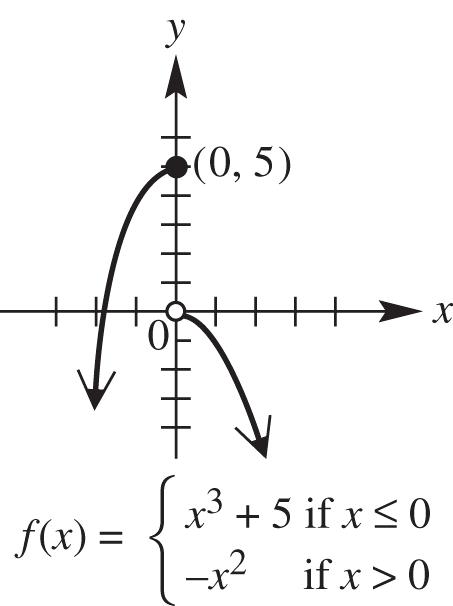
31. 2 2if 51 ()2if 10 2if 02 xx fxx xx
Graph the line 2 yx between x = 5 and x = 1, including the left endpoint at ( 5, 10), but not including the right endpoint at ( 1, 2). Graph the line y = 2 between x = 1 and x = 0, including the left endpoint at ( 1, 2) and not including the right endpoint at (0, 2). Note that ( 1, 2) coincides with the first two sections, so it is included. Graph the curve 2 2 yx from x = 0 to x = 2, including the endpoints at (0, 2) and (2, 2). Note that (0, 2) coincides with the second two sections, so it is included. The graph ends at x = 5 and x = 2.
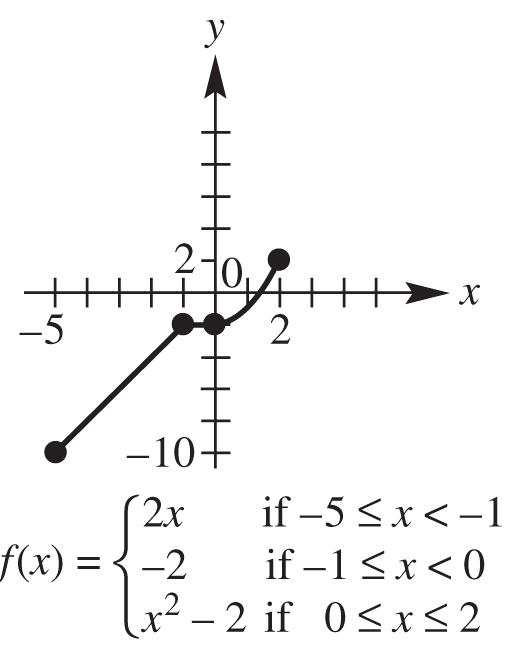
32. 2 2 0.5if 42 ()if 22 4if 24 xx fxxx xx
Graph the curve 2 0.5 yx between x = 4 and x = 2, including the endpoints at ( 4, 8) and ( 2, 2). Graph the line yx between x = 2 and x = 2, but do not include the endpoints at ( 2, 2) and (2, 2). Graph the curve 2 4 yx from x = 2 to x = 4, including the endpoints at (2, 0) and (4, 12). The graph ends at x = 4 and x = 4.
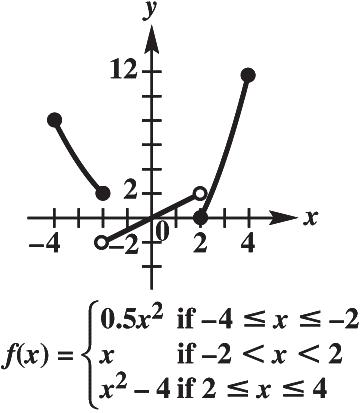
33. 3 2 3if 20 ()3if 01 4if 13 xx fxxx xxx
Graph the curve 3 3 yx between x = 2 and x = 0, including the endpoints at ( 2, 5) and (0, 3). Graph the line y = x + 3 between x = 0 and x = 1, but do not include the endpoints at (0, 3) and (1, 4). Graph the curve 2 4 yxx from x = 1 to x = 3, including the endpoints at (1, 4) and (3, 2). The graph ends at x = 2 and x = 3.
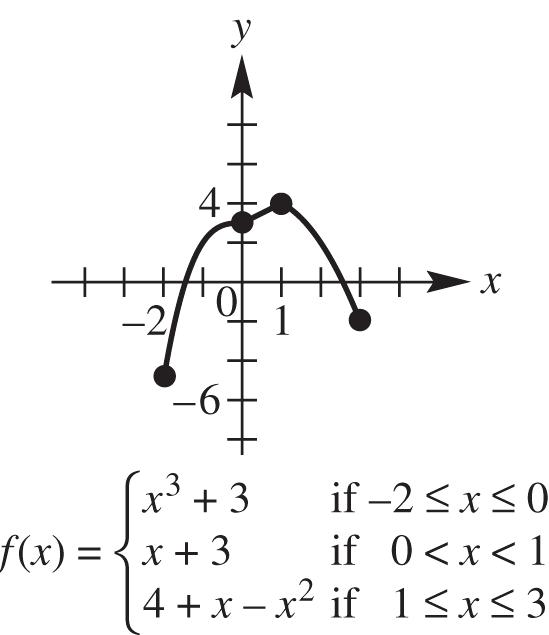
34. 2 3 1 2 2if 31 ()1 if 12 1if 23 xx fxxx xx
Graph the curve y = 2x to from x = 3 to x = 1, including the endpoint ( 3, 6), but not including the endpoint ( 1, 2). Graph the curve 2 1 yx from x = 1 to x = 2, including the endpoints ( 1, 2) and (2, 5).
Graph the curve 3 1 2 1 yx from x = 2 to x = 3, including the endpoint (3, 14.5) but not including the endpoint (2, 5). Because the endpoints that are not included coincide with endpoints that are included, we use closed dots on the graph.
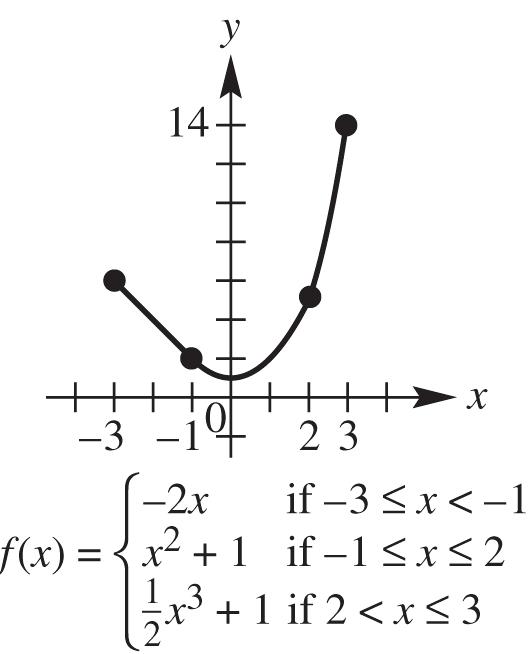
35. The solid circle on the graph shows that the endpoint (0, –1) is part of the graph, while the open circle shows that the endpoint (0, 1) is not part of the graph. The graph is made up of parts of two horizontal lines. The function which fits this graph is
–1 if 0 () 1 if 0. fxx x
domain: ,; range: {–1, 1}
36. We see that y = 1 for every value of x except x = 0, and that when x = 0, y = 0. We can write the function as
1 if 0 () 0 if 0. fxx x
domain: ,; range: {0, 1}
37. The graph is made up of parts of two horizontal lines. The solid circle shows that the endpoint (0, 2) of the one on the left belongs to the graph, while the open circle shows that the endpoint (0, –1) of the one on the right does not belong to the graph. The function that fits this graph is 2 if 0 () –1 if 1. fxx x
domain: (, 0](1, ); range: {–1, 2}
38. We see that y = 1 when 1 x and that y = –1 when x > 2. We can write the function as
1 if –1 () –1 if 2. fxx x
domain: (–, –1](2, ); range: {–1, 1}
39. For 0 x , that piece of the graph goes through the points ( 1, 1) and (0, 0). The slope is 1, so the equation of this piece is y = x. For x > 0, that piece of the graph is a horizontal line passing through (2, 2), so its equation is y = 2. We can write the function as if 0 (). 2 if 0 fxxx x
domain: (–, ) range: (,0]{2}
40. For x < 0, that piece of the graph is a horizontal line passing though ( 3, 3), so the equation of this piece is y = 3. For 0 x , the curve passes through (1, 1) and (4, 2), so the equation of this piece is yx . We can write the function as 3 if 0 (). if 0 x fx xx
domain: (–, ) range: {3}[0,)
41. For x < 1, that piece of the graph is a curve passes through ( 8, 2), ( 1, 1) and (1, 1), so the equation of this piece is 3 yx . The right piece of the graph passes through (1, 2) and (2, 3). 23 1 12 m , and the equation of the line is 211yxyx . We can write the function as 3 if 1 () 1if 1 fxxx xx domain: (–, ) range: (,1)[2,)
42. For all values except x = 2, the graph is a line. It passes through (0, 3) and (1, 1). The slope is 2, so the equation is y = 2x 3. At x = 2, the graph is the point (2, 3). We can write the function as 3if 2 (). 23if 2 fxx xx
domain: (–, ) range: (,1)(1,)
43. f (x) = x Plot points.
x –xf (x) = x –2 2 2
–1.5 1.5 1 –1 1 1
–0.5 0.5 0 0 0 0
0.5 –0.5 –1 1 –1 –1 1.5 –1.5 –2 2 –2 –2
More generally, to get y = 0, we need 0–10110. xxx
To get y = 1, we need 1–2 x 12 –21.xx
Follow this pattern to graph the step function.
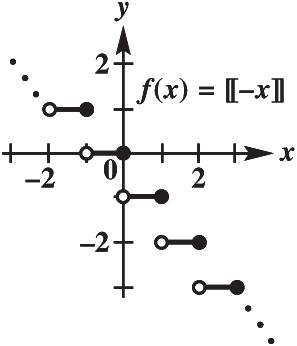
domain: ,; range: {...,–2,–1,0,1,2,...}
44. f (x) = x Plot points.
Follow this pattern to graph the step function.
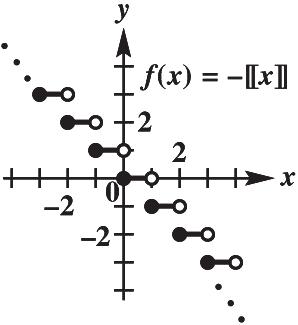
domain: ,; range: {...,–2,–1,0,1,2,...}
45. f (x) = 2 x
To get y = 0, we need 1 2 0210. xx
To get y = 1, we need 1 2 1221. xx
To get y = 2, we need 3 2 2231. xx
Follow this pattern to graph the step function.
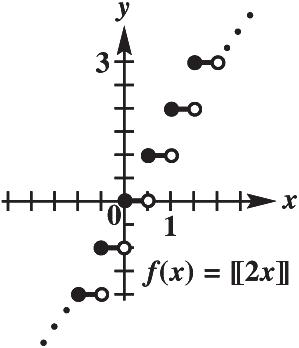
domain: ,; range: {...,–2,–1,0,1,2,...}
46. g (x) = 21 x
To get y = 0, we need 1 2 02111221. xxx
To get y = 1, we need 3 2 12–122231. xxx
Follow this pattern to graph the step function.
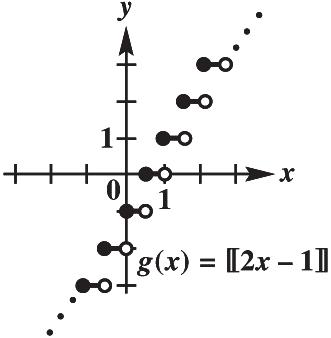
domain: ,; range: {..., 2,–1,0,1,2,...}
47. The cost of mailing a letter that weighs more than 1 ounce and less than 2 ounces is the same as the cost of a 2-ounce letter, and the cost of mailing a letter that weighs more than 2 ounces and less than 3 ounces is the same as the cost of a 3-ounce letter, etc.
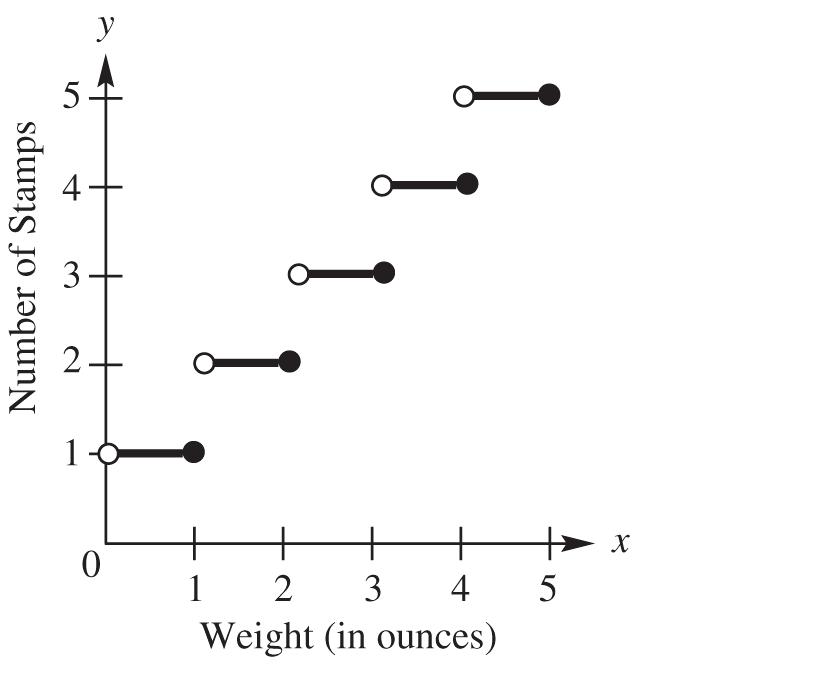
48. The cost is the same for all cars parking between 1 2 hour and 1-hour, between 1 hour and 1 2 1 hours, etc.
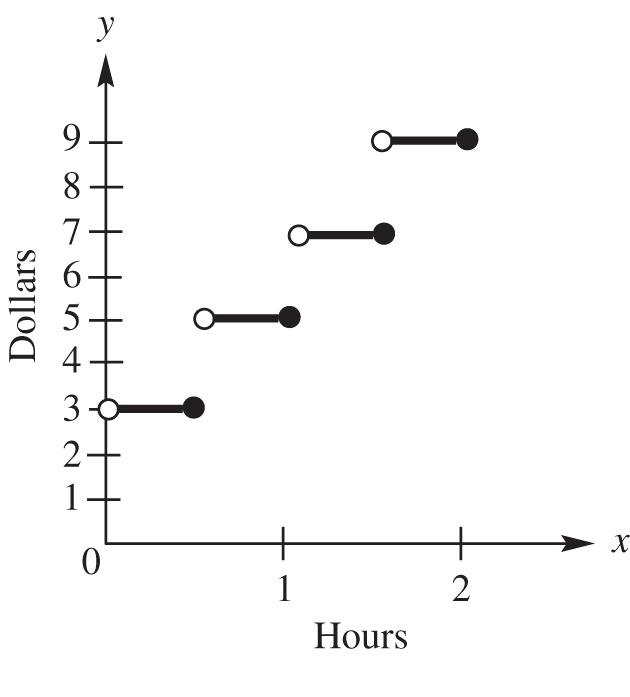
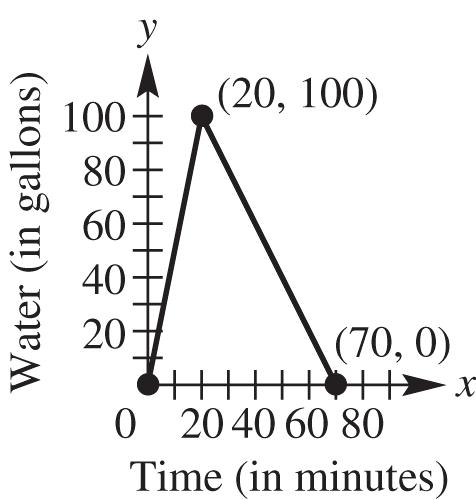
Copyright © 2017 Pearson Education, Inc.
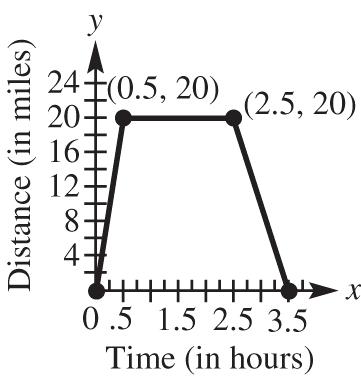
51. (a) For 08, x
49.834.2 1.95 80 m , so 1.9534.2.yx For 813 x , 52.249.8 0.48 138 m , so the equation is 52.20.48(13)yx 0.4845.96yx
(b) 1.9534.2if 08 () 0.4845.96if 813fxxx xx
52. When 03 x , the slope is 5, which means that the inlet pipe is open, and the outlet pipe is closed. When 35 x , the slope is 2, which means that both pipes are open. When 58 x , the slope is 0, which means that both pipes are closed. When 810 x , the slope is 3, which means that the inlet pipe is closed, and the outlet pipe is open.
53. (a) The initial amount is 50,000 gallons. The final amount is 30,000 gallons.
(b) The amount of water in the pool remained constant during the first and fourth days.
(c) (2)45,000;(4)40,000 ff
(d) The slope of the segment between (1, 50000) and (3, 40000) is 5000, so the water was being drained at 5000 gallons per day.
54. (a) There were 20 gallons of gas in the tank at x = 3.
(b) The slope is steepest between t = 1 and t ≈ 2.9, so that is when the car burned gasoline at the fastest rate.
55. (a) There is no charge for additional length, so we use the greatest integer function. The cost is based on multiples of two feet, so 2 ()0.8 fxx
if 618 x
(b)
Copyright © 2017 Pearson Education, Inc. 50.
56. (a) 6.5 if 04 ()5.548 if 46 –30195 if 66.5 xx fxxx xx
Draw a graph of y = 6.5x between 0 and 4, including the endpoints. Draw the graph of y = –5.5x + 48 between 4 and 6, including the endpoint at 6 but not the one at 4. Draw the graph of y = –30x + 195, including the endpoint at 6.5 but not the one at 6. Notice that the endpoints of the three pieces coincide.
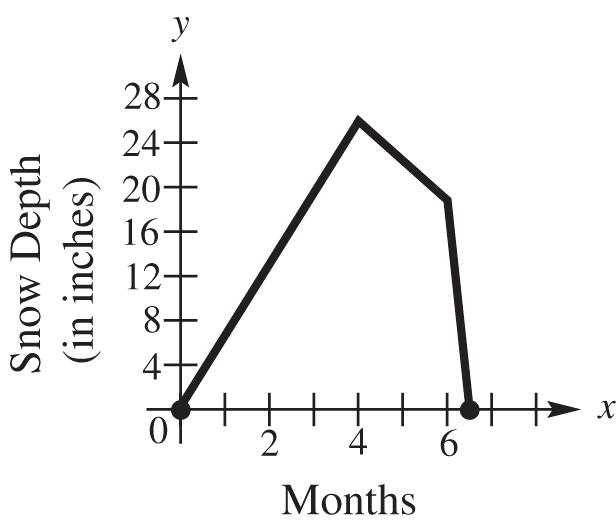
(b) From the graph, observe that the snow depth, y, reaches its deepest level (26 in.) when x = 4, x = 4 represents 4 months after the beginning of October, which is the beginning of February.
(c) From the graph, the snow depth y is nonzero when x is between 0 and 6.5. Snow begins at the beginning of October and ends 6.5 months later, in the middle of April.
Section 2.7 Graphing Techniques
1. To graph the function 2 3, fxx shift the graph of 2 yx down 3 units.
2. To graph the function 2 5, fxx shift the graph of 2 yx up 5 units.
3. The graph of 2 4 fxx is obtained by shifting the graph of 2 yx to the left 4 units.
4. The graph of 2 7 fxx is obtained by shifting the graph of 2 yx to the right 7 units.
5. The graph of fxx is a reflection of the graph of fxx across the x-axis.
6. The graph of fxx is a reflection of the graph of fxx across the y-axis.
7. To obtain the graph of 3 23, fxx shift the graph of 3 yx 2 units to the left and 3 units down.
8. To obtain the graph of 3 36, fxx shift the graph of 3 yx 3 units to the right and 6 units up.
9. The graph of fxx is the same as the graph of yx because reflecting it across the y-axis yields the same ordered pairs.
10. The graph of 2 xy is the same as the graph of 2 xy because reflecting it across the x-axis yields the same ordered pairs.
11. (a) B; 2 (7)yx is a shift of 2 , yx 7 units to the right.
(b) D; 2 7 yx is a shift of 2 , yx 7 units downward.
(c) E; 2 7 yx is a vertical stretch of 2 , yx by a factor of 7.
(d) A; 2 (7)yx is a shift of 2 , yx 7 units to the left.
(e) C; 2 7 yx is a shift of 2 , yx 7 units upward.
12. (a) E; 3 4 yx is a vertical stretch of 3 , yx by a factor of 4.
(b) C; 3 yx is a reflection of 3 , yx over the x-axis.
(c) D; 3 yx is a reflection of 3 , yx over the y-axis.
(d) A; 3 4 yx is a shift of 3 , yx 4 units to the right.
(e) B; 3 4 yx is a shift of 3 , yx 4 units down.
13. (a) B; 2 2 yx is a shift of 2 , yx 2 units upward.
(b) A; 2 2 yx is a shift of 2 , yx 2 units downward.
(c) G; 2 (2)yx is a shift of 2 , yx 2 units to the left.
(d) C; 2 (2)yx is a shift of 2 , yx 2 units to the right.
(e) F; 2 2 yx is a vertical stretch of 2 , yx by a factor of 2.
(f) D; 2 yx is a reflection of 2 , yx across the x-axis.
(g) H; 2 (2)1yx is a shift of 2 , yx 2 units to the right and 1 unit upward.
(h) E; 2 (2)1yx is a shift of 2 , yx 2 units to the left and 1 unit upward.
(i) I; 2 (2)1yx is a shift of 2 , yx 2 units to the left and 1 unit down.
14. (a) G; 3 yx is a shift of , yx 3 units to the left.
(b) D; 3 yx is a shift of , yx 3 units downward.
(c) E; 3 yx is a shift of , yx 3 units upward.
(d) B; 3 yx is a vertical stretch of , yx by a factor of 3.
(e) C; yx is a reflection of yx across the x-axis.
(f) A; 3 yx is a shift of , yx 3 units to the right.
(g) H; 32 yx is a shift of , yx 3 units to the right and 2 units upward.
(h) F; 32 yx is a shift of , yx 3 units to the left and 2 units upward.
(i) I; 32 yx is a shift of , yx 3 units to the right and 2 units downward.
15. (a) F; 2 yx is a shift of yx 2 units to the right.
(b) C; 2 yx is a shift of yx 2 units downward.
(c) H; 2 yx is a shift of yx 2 units upward.
(d) D; 2 yx is a vertical stretch of yx by a factor of 2.
(e) G; yx is a reflection of yx across the x-axis.
(f) A; yx is a reflection of yx across the y-axis.
(g) E; 2 yx is a reflection of 2 yx across the x-axis. 2 yx is a vertical stretch of yx by a factor of 2.
(h) I; 22 yx is a shift of yx 2 units to the right and 2 units upward.
(i) B; 22 yx is a shift of yx 2 units to the left and 2 units downward.
16. The graph of 3 216fxx is the graph of 3 fxx stretched vertically by a factor of 2, shifted left 1 unit and down 6 units. 17.
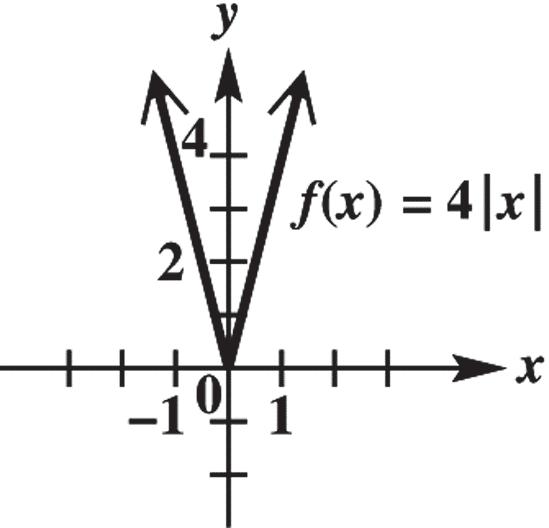
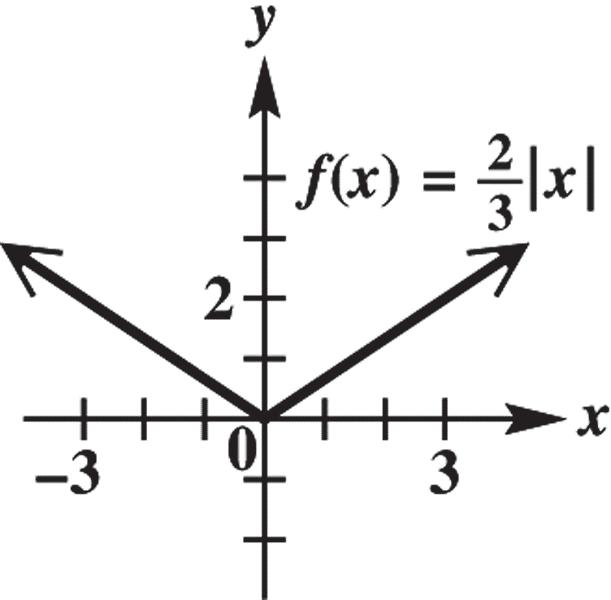
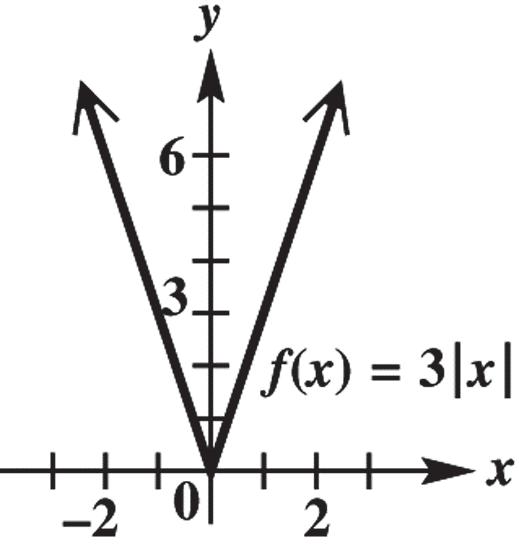
Copyright © 2017 Pearson Education, Inc.
continuedonnextpage)
continued)
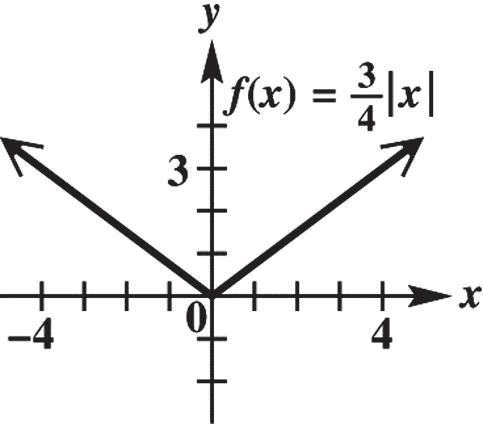
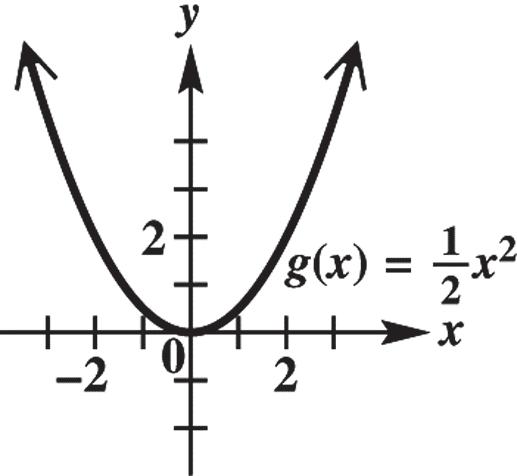
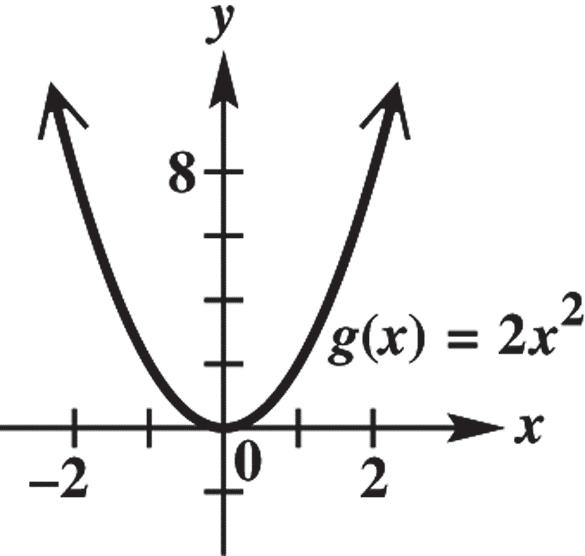
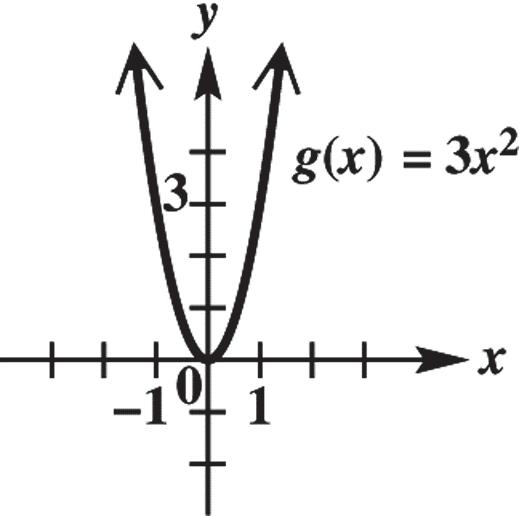
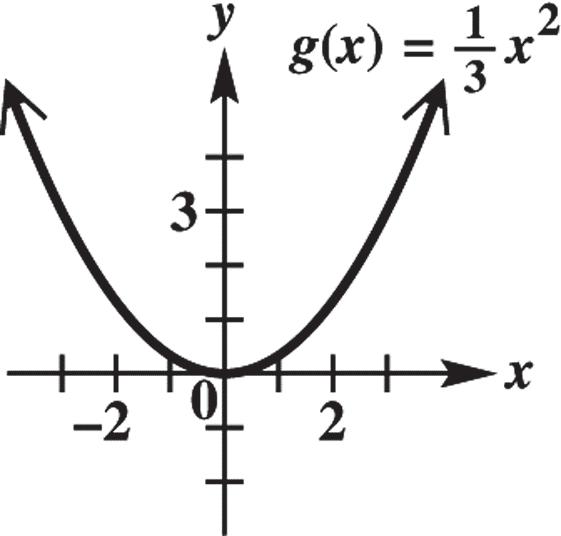
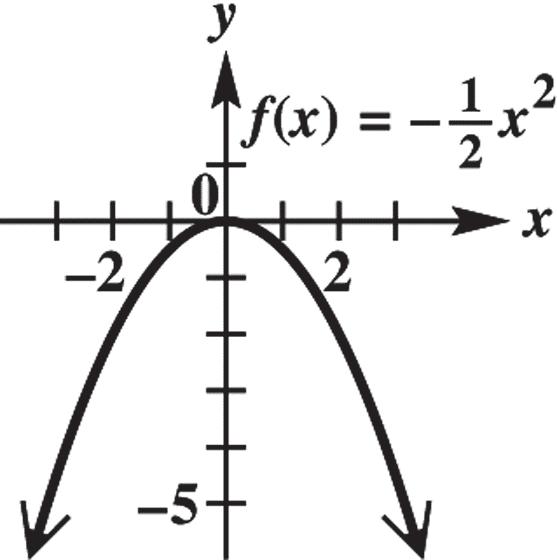
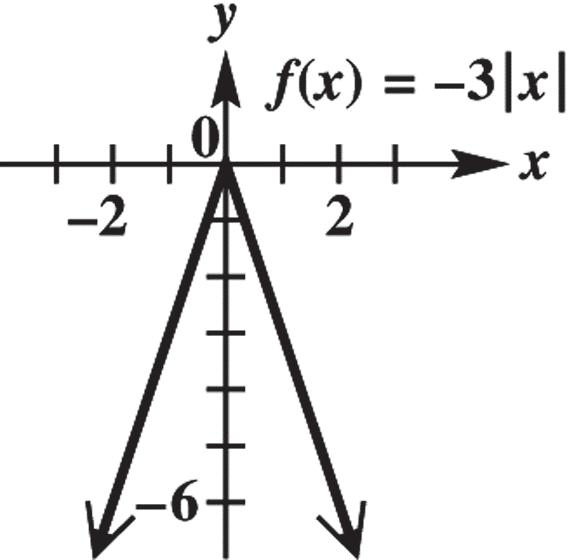
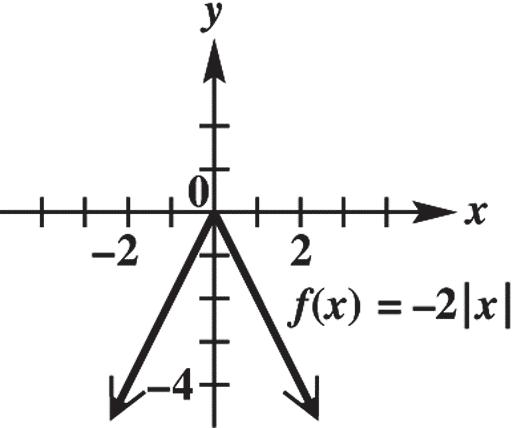

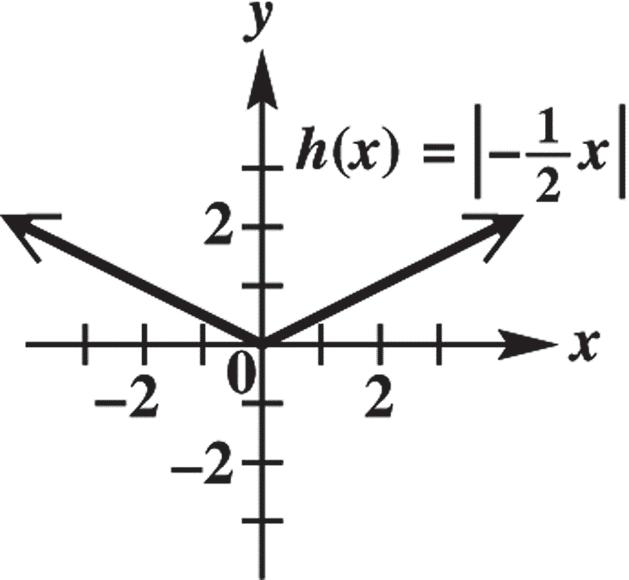
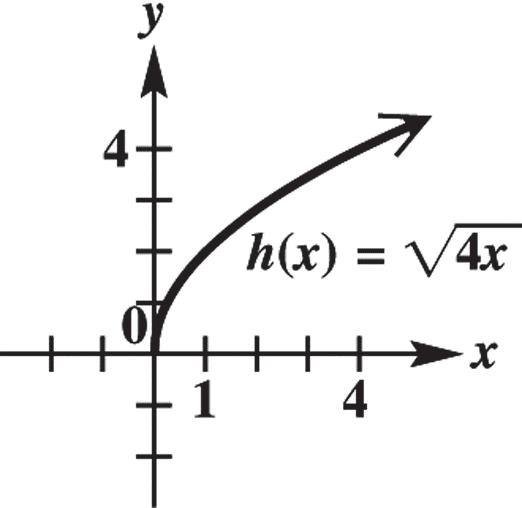
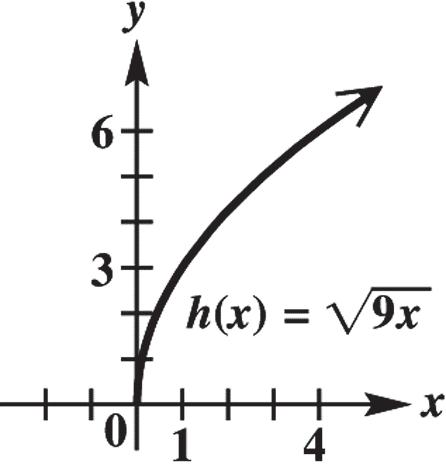
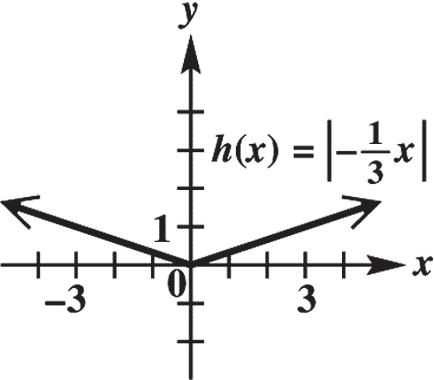
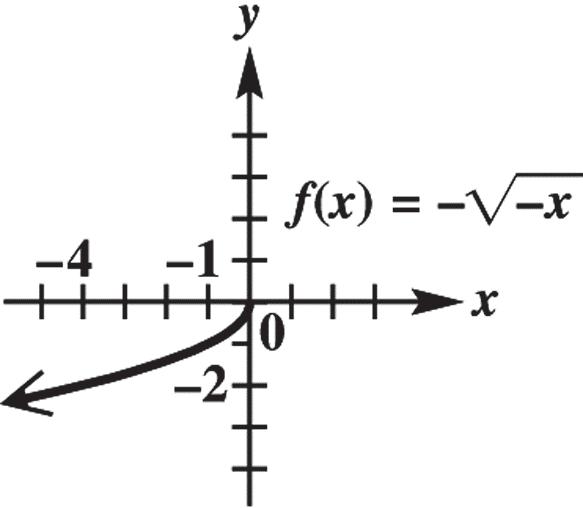
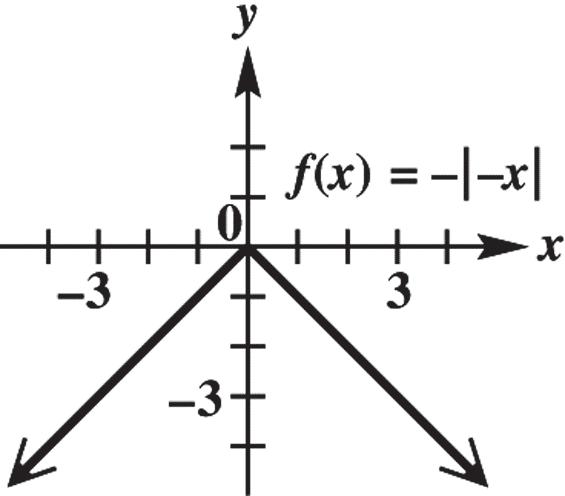
35. (a) 4 yfx is a horizontal translation of f, 4 units to the left. The point that corresponds to (8, 12) on this translated function would be
84,124,12.
(b) 4 yfx is a vertical translation of f, 4 units up. The point that corresponds to (8, 12) on this translated function would be 8,1248,16.
36. (a) 1 4 yfx is a vertical shrinking of f, by a factor of 1 4 The point that corresponds to (8, 12) on this translated function would be
1 4 8,128,3.
(b) 4 yfx is a vertical stretching of f, by a factor of 4. The point that corresponds to (8, 12) on this translated function would be
8,4128,48.
37. (a) (4)yfx is a horizontal shrinking of f, by a factor of 4. The point that corresponds to (8, 12) on this translated function is
1 4 8,122,12.
(b) 1 4 yfx is a horizontal stretching of f, by a factor of 4. The point that corresponds to (8, 12) on this translated function is 84,1232,12.
38. (a) The point that corresponds to (8, 12) when reflected across the x-axis would be (8, 12).
(b) The point that corresponds to (8, 12) when reflected across the y-axis would be ( 8, 12).
39. (a) The point that is symmetric to (5, –3) with respect to the x-axis is (5, 3).
(b) The point that is symmetric to (5, –3) with respect to the y-axis is (–5, –3).
(c) The point that is symmetric to (5, –3) with respect to the origin is (–5, 3).
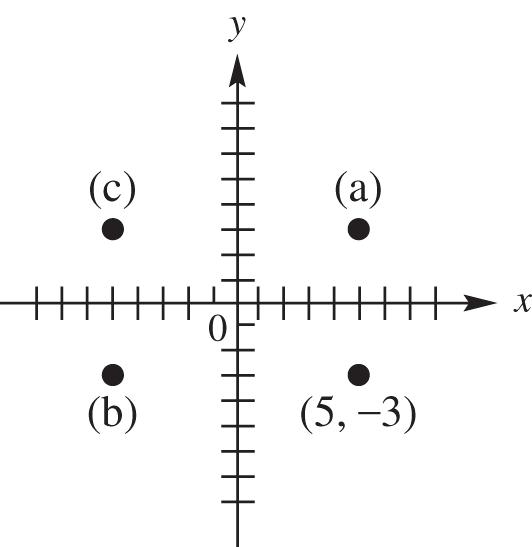
40. (a) The point that is symmetric to (–6, 1) with respect to the x-axis is (–6, –1).
(b) The point that is symmetric to (–6, 1) with respect to the y-axis is (6, 1).
(c) The point that is symmetric to (–6, 1) with respect to the origin is (6, –1).
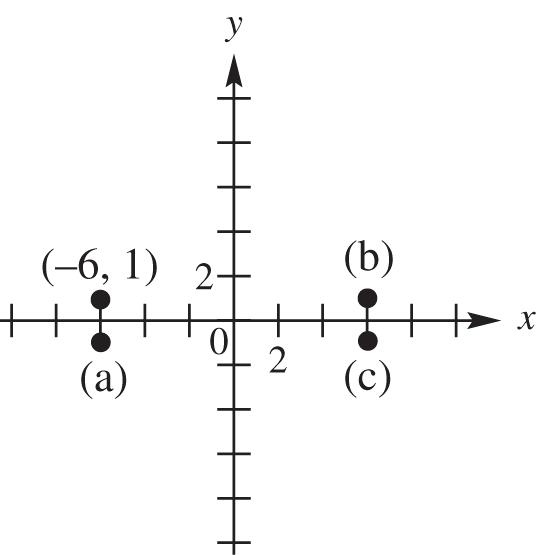
41. (a) The point that is symmetric to (–4, –2) with respect to the x-axis is (–4, 2).
(b) The point that is symmetric to (–4, –2) with respect to the y-axis is (4, –2).
(c) The point that is symmetric to (–4, –2) with respect to the origin is (4, 2).
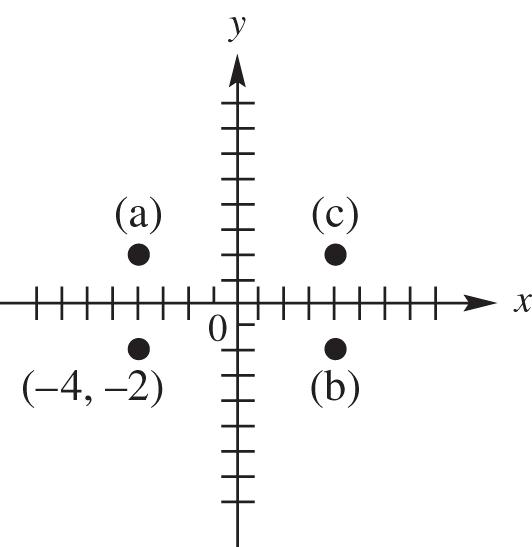
42. (a) The point that is symmetric to (–8, 0) with respect to the x-axis is (–8, 0) because this point lies on the x-axis.
(b) The point that is symmetric to the point (–8, 0) with respect to the y-axis is (8, 0).
(c) The point that is symmetric to the point (–8, 0) with respect to the origin is (8, 0).
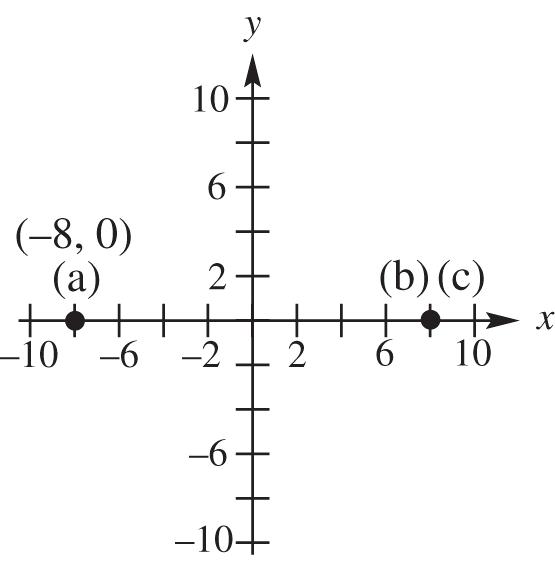
43. The graph of y = |x 2| is symmetric with respect to the line x = 2.
44. The graph of y = |x + 1| is symmetric with respect to the line x = 1.
45. 2 5 yx
Replace x with –x to obtain 22 ()55yxx . The result is the same as the original equation, so the graph is symmetric with respect to the y-axis. Because y is a function of x, the graph cannot be symmetric with respect to the x-axis. Replace x with –x and y with –y to obtain 222 ()222. yxyxyx
The result is not the same as the original equation, so the graph is not symmetric with respect to the origin. Therefore, the graph is symmetric with respect to the y-axis only.
46. 4 23yx
Replace x with –x to obtain 44 2()323yxx
The result is the same as the original equation, so the graph is symmetric with respect to the y-axis. Because y is a function of x, the graph cannot be symmetric with respect to the x-axis. Replace x with –x and y with –y to obtain 44 – 2()323yxyx
4 23yx . The result is not the same as the original equation, so the graph is not symmetric with respect to the origin. Therefore, the graph is symmetric with respect to the y-axis only.
47. 22 12 xy
Replace x with –x to obtain 2222 ()1212 xyxy
The result is the same as the original equation, so the graph is symmetric with respect to the y-axis. Replace y with –y to obtain 2222()1212 xyxy
The result is the same as the original equation, so the graph is symmetric with respect to the x-axis. Because the graph is symmetric with respect to the x-axis and y-axis, it is also symmetric with respect to the origin.
48. 22 6 yx
Replace x with –x to obtain 2 22266 yxyx
The result is the same as the original equation, so the graph is symmetric with respect to the y-axis. Replace y with –y to obtain 2222 ()66 yxyx
The result is the same as the original equation, so the graph is symmetric with respect to the x-axis. Because the graph is symmetric with respect to the x-axis and y-axis, it is also symmetric with respect to the origin. Therefore, the graph is symmetric with respect to the x-axis, the y-axis, and the origin.
49. 3 4 yxx
Replace x with –x to obtain 33 3 4()()4() 4. yxxyxx yxx
The result is not the same as the original equation, so the graph is not symmetric with respect to the y-axis. Replace y with –y to obtain 33 44. yxxyxx
The result is not the same as the original equation, so the graph is not symmetric with respect to the x-axis. Replace x with –x and y with –y to obtain 33 33 4()()4() 44. yxxyxx yxxyxx
The result is the same as the original equation, so the graph is symmetric with respect to the origin. Therefore, the graph is symmetric with respect to the origin only.
50. 3 yxx
Replace x with –x to obtain 33 ()(). yxxyxx
The result is not the same as the original equation, so the graph is not symmetric with respect to the y-axis. Replace y with –y to obtain 33 .yxxyxx The result is not the same as the original equation, so the graph is not symmetric with respect to the x-axis. Replace x with –x and y with –y to obtain ()()33 yxxyxx
3 yxx The result is the same as the original equation, so the graph is symmetric with respect to the origin. Therefore, the graph is symmetric with respect to the origin only.
51. 2 8 yxx
Replace x with –x to obtain ()()822 8. yxxyxx
The result is not the same as the original equation, so the graph is not symmetric with respect to the y-axis. Because y is a function of x, the graph cannot be symmetric with respect to the x-axis. Replace x with –x and y with –y to obtain 2 ()()8yxx
2288.yxxyxx
The result is not the same as the original equation, so the graph is not symmetric with respect to the origin. Therefore, the graph has none of the listed symmetries.
52. y = x + 15
Replace x with –x to obtain ()15 15. yxyx
The result is not the same as the original equation, so the graph is not symmetric with respect to the y-axis. Because y is a function of x, the graph cannot be symmetric with respect to the x-axis. Replace x with –x and y with –y to obtain ()1515.yxyx The result is not the same as the original equation, so the graph is not symmetric with respect to the origin. Therefore, the graph has none of the listed symmetries.
53. 3 2 fxxx
3 33 2 22
The function is odd.
54. 53 2 fxxx 53 5353 2 22 fxxx xxxxfx
The function is odd.
55. 42 0.526fxxx 42 42 0.526 0.526 fxxx xxfx
The function is even.
56. 2 0.754fxxx
2 2 0.75 4 0.754 fxxx xxfx
The function is even.
57. 3 9 fxxx
3 33 9 99 fxxx xxxxfx
The function is neither.
58.
4 58fxxx 4 4 58 58 fxxx xxfx
The function is neither.
59. 2 1 fxx
This graph may be obtained by translating the graph of 2 yx 1 unit downward.
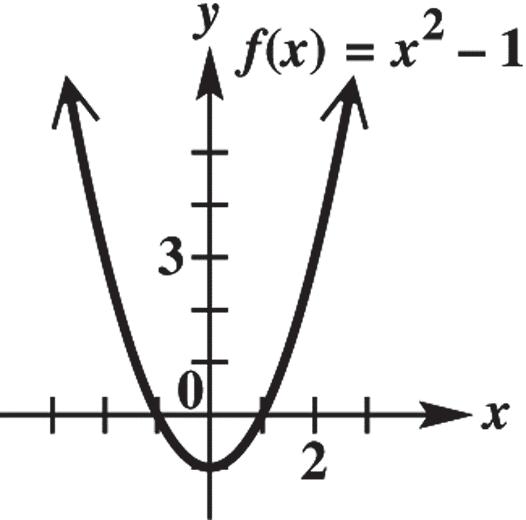
60.
2 2 fxx
This graph may be obtained by translating the graph of 2 yx 2 units downward.
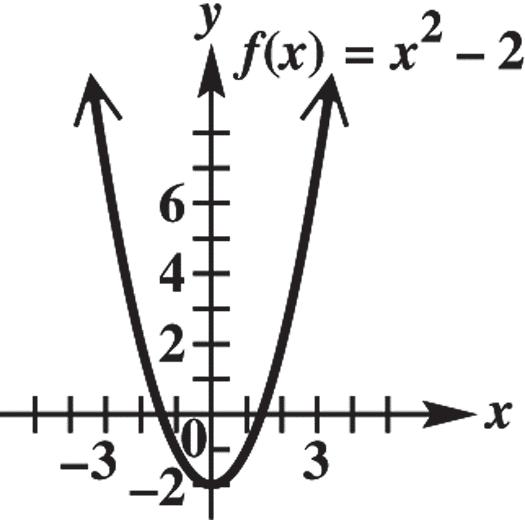
61. 2 2 fxx
This graph may be obtained by translating the graph of 2 yx 2 units upward.
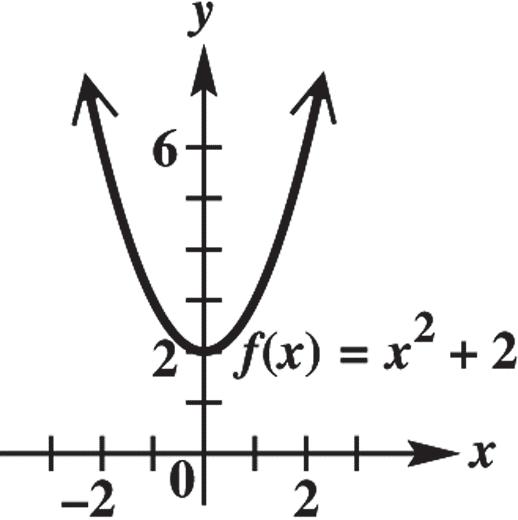
62. 2 3 fxx
This graph may be obtained by translating the graph of 2 yx 3 units upward.
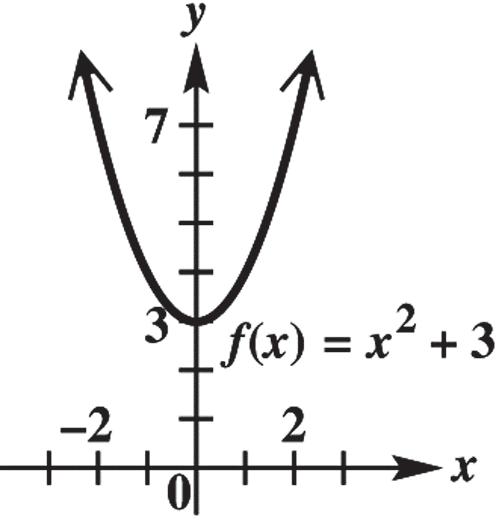
63. 2 4 gxx
This graph may be obtained by translating the graph of 2 yx 4 units to the right.
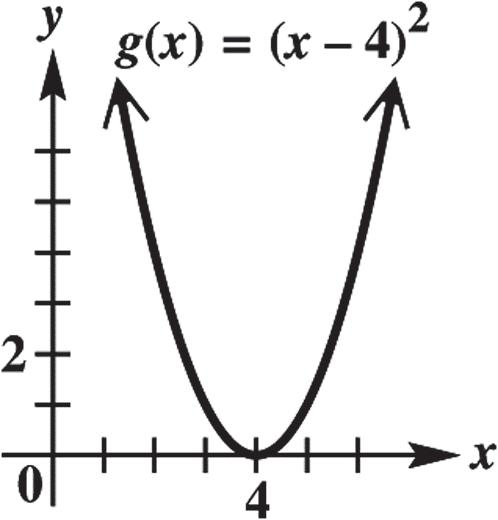
64. 2 2 gxx
This graph may be obtained by translating the graph of 2 yx 2 units to the right.
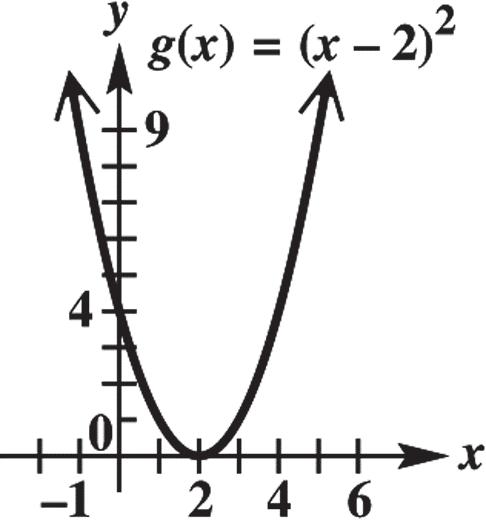
65. 2 2 gxx
This graph may be obtained by translating the graph of 2 yx 2 units to the left.
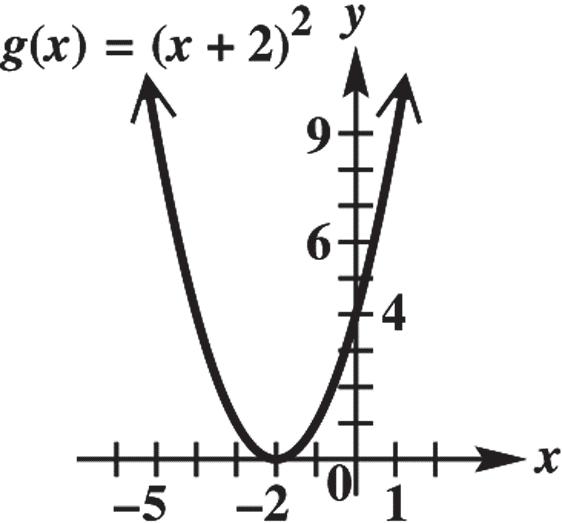
66.
2 3 gxx
This graph may be obtained by translating the graph of 2 yx 3 units to the left.
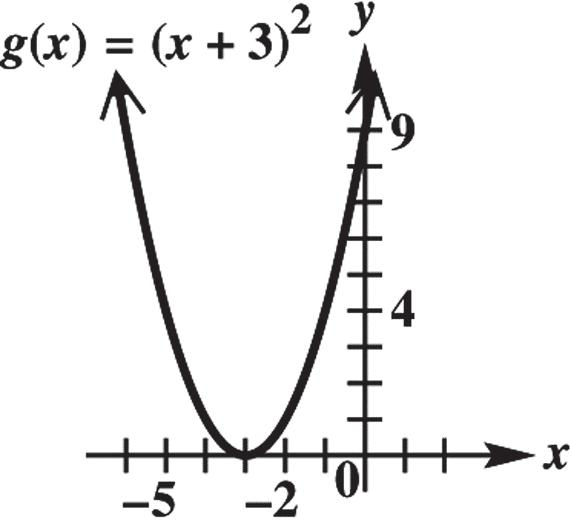
67. 1 gxx
The graph is obtained by translating the graph of yx 1 unit downward.
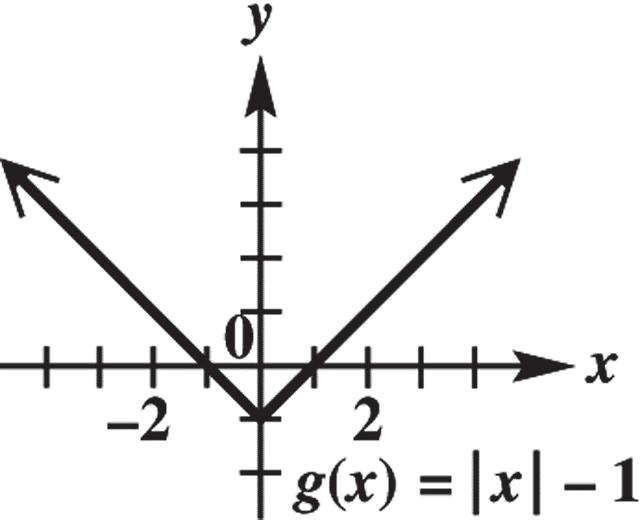
68. 32 gxx
This graph may be obtained by translating the graph of yx 3 units to the left and 2 units upward.
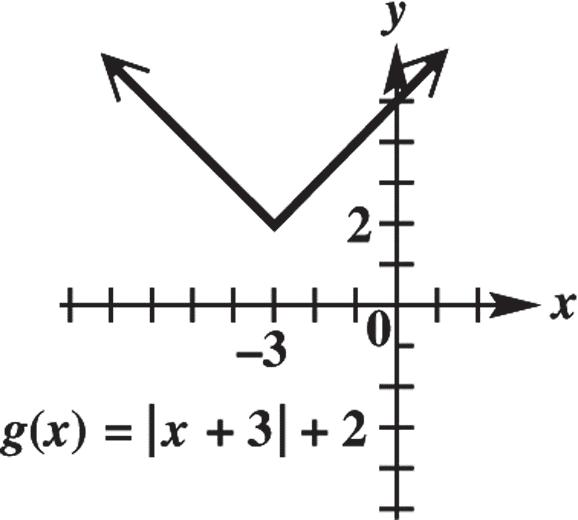
69.
(1)3hxx
This graph may be obtained by translating the graph of 3 yx 1 unit to the left. It is then reflected across the x-axis.
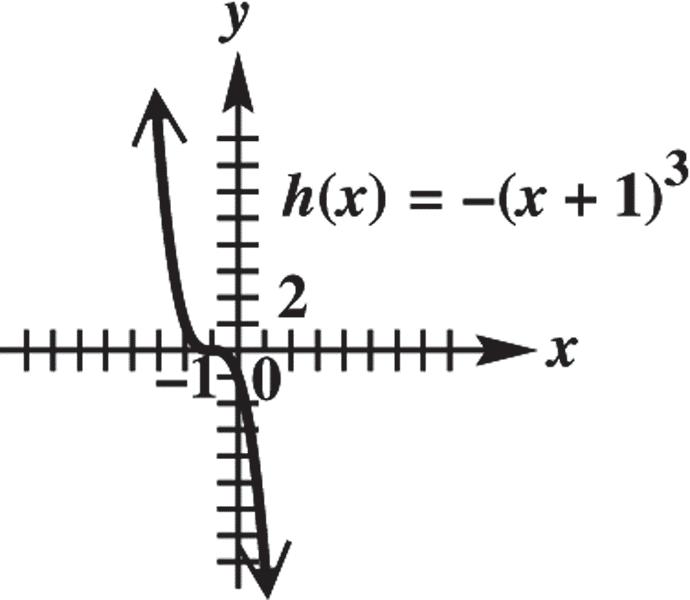
70.
(1)3hxx
This graph can be obtained by translating the graph of 3 yx 1 unit to the right. It is then reflected across the x-axis. (We may also reflect the graph about the x-axis first and then translate it 1 unit to the right.) 71.
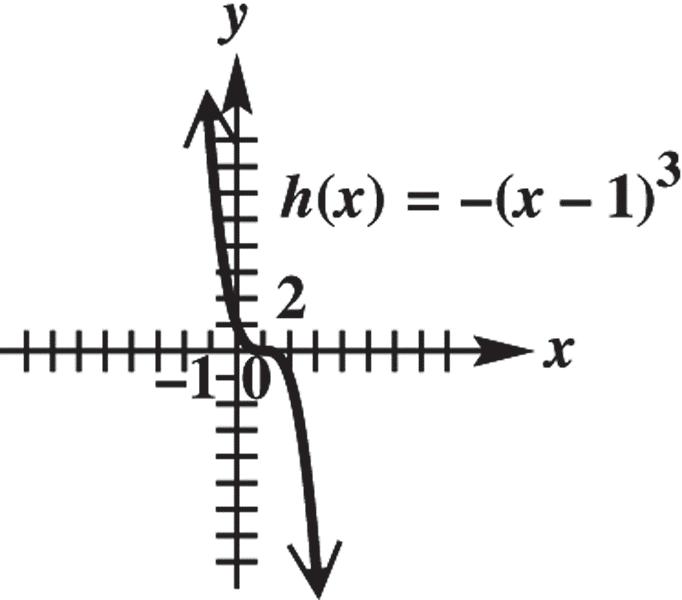
2 21hxx
This graph may be obtained by translating the graph of 2 yx 1 unit down. It is then stretched vertically by a factor of 2. 72.
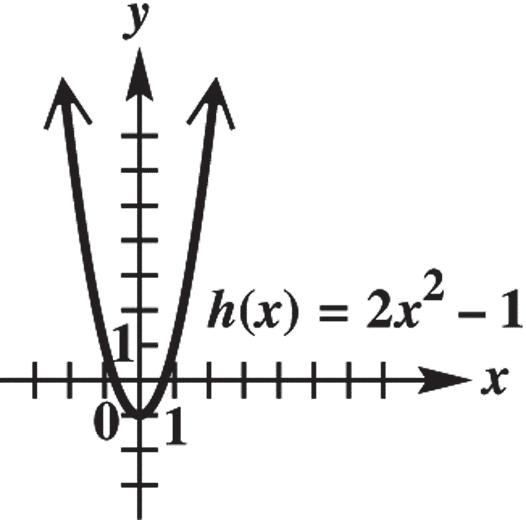
2 32hxx
This graph may be obtained by stretching the graph of 2 yx vertically by a factor of 3, then shifting the resulting graph down 2 units.
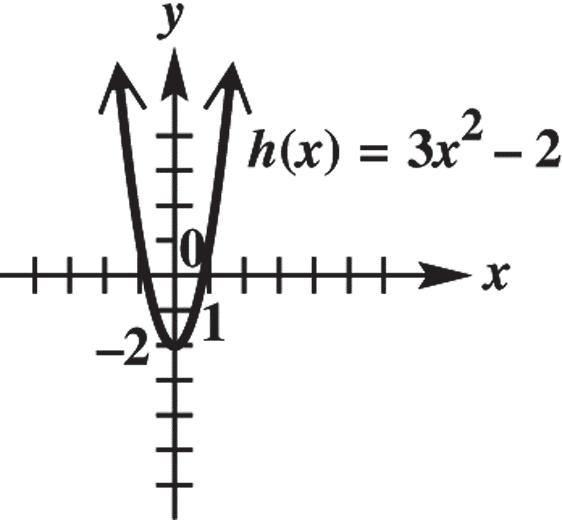
2 2(2)4fxx
This graph may be obtained by translating the graph of 2 yx 2 units to the right and 4 units down. It is then stretched vertically by a factor of 2. 74.
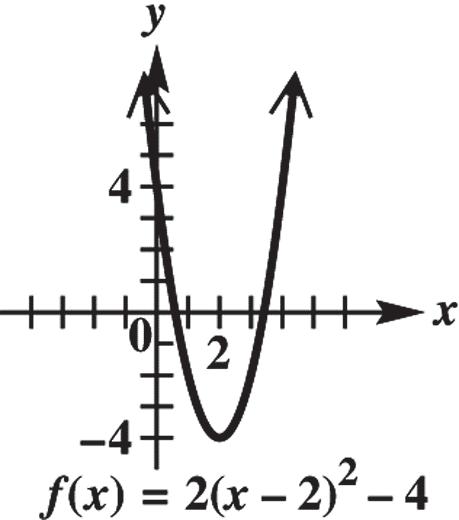
2 3(2)1fxx
This graph may be obtained by translating the graph of 2 yx 2 units to the right and 1 unit up. It is then stretched vertically by a factor of 3 and reflected over the x-axis. 75.
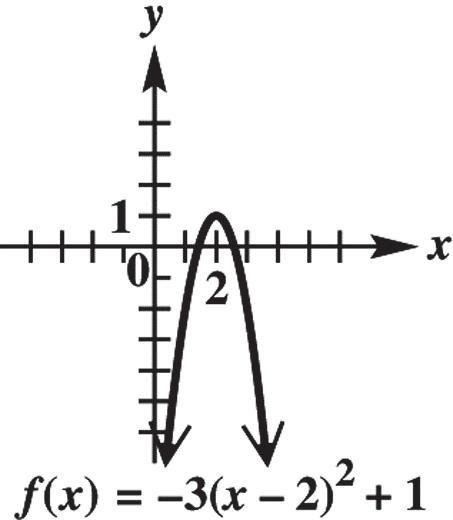
2 fxx
This graph may be obtained by translating the graph of yx two units to the left.
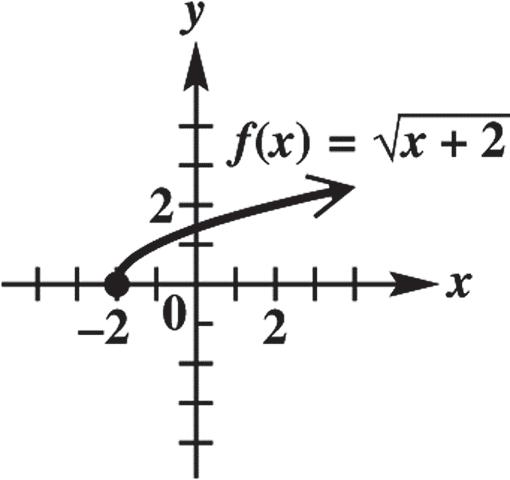
76.
3 fxx
This graph may be obtained by translating the graph of yx three units to the right.
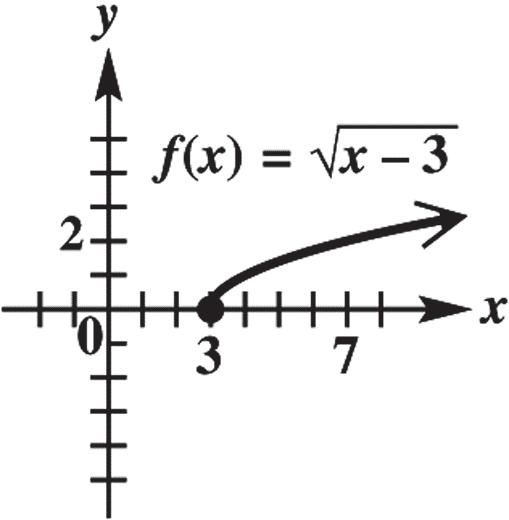
77.
fxx
This graph may be obtained by reflecting the graph of yx across the x-axis.
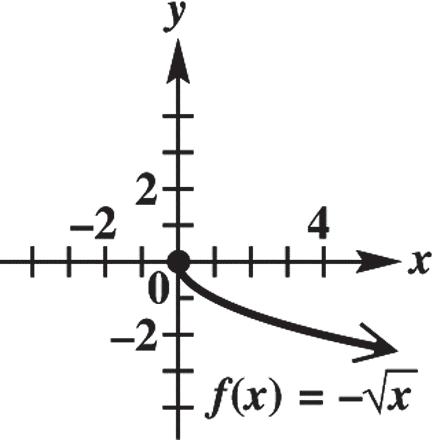
78. 2 fxx
This graph may be obtained by translating the graph of yx two units down.
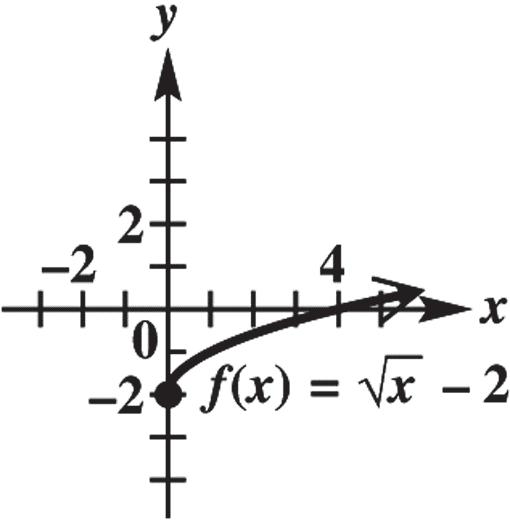
79.
21fxx
This graph may be obtained by stretching the graph of yx vertically by a factor of two and then translating the resulting graph one unit up.
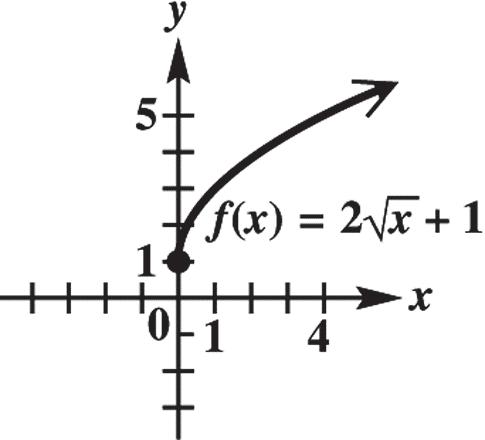
80. 32fxx
This graph may be obtained by stretching the graph of yx vertically by a factor of three and then translating the resulting graph two units down.
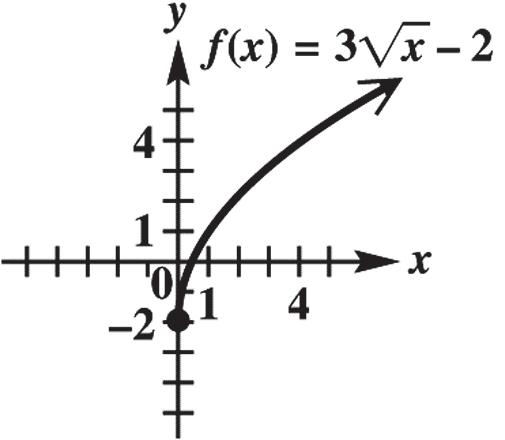
81.
3 1 2 4 gxx
This graph may be obtained by stretching the graph of 3 yx vertically by a factor of 1 2 , then shifting the resulting graph down four units.
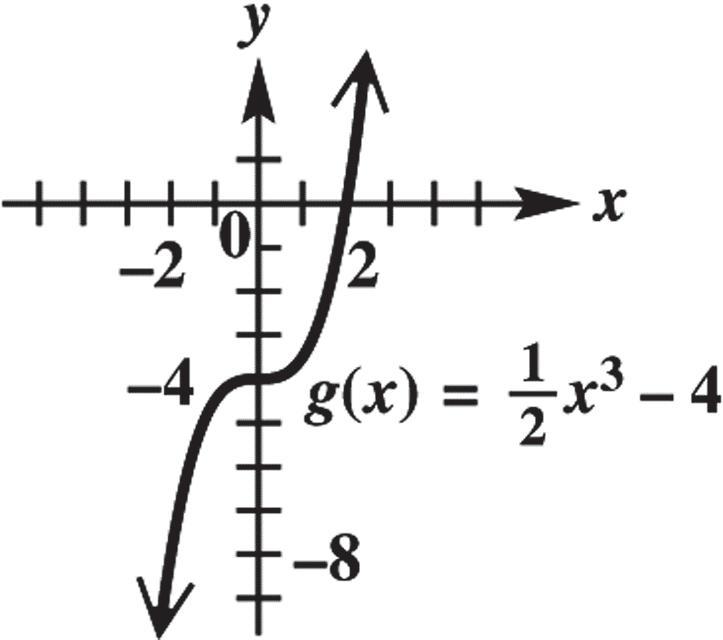
82. 3 1 2 2 gxx
This graph may be obtained by stretching the graph of 3 yx vertically by a factor of 1 2 , then shifting the resulting graph up two units.
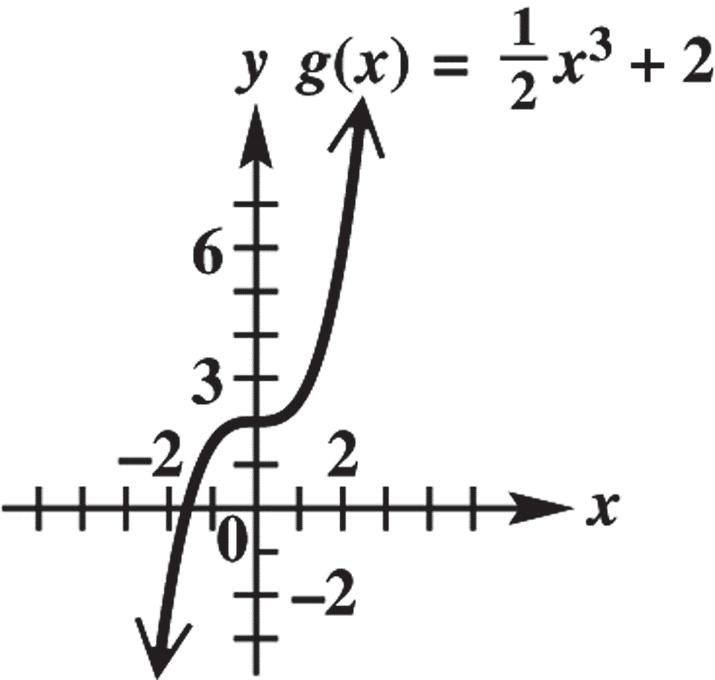
83. 3 3 gxx
This graph may be obtained by shifting the graph of 3 yx three units left.
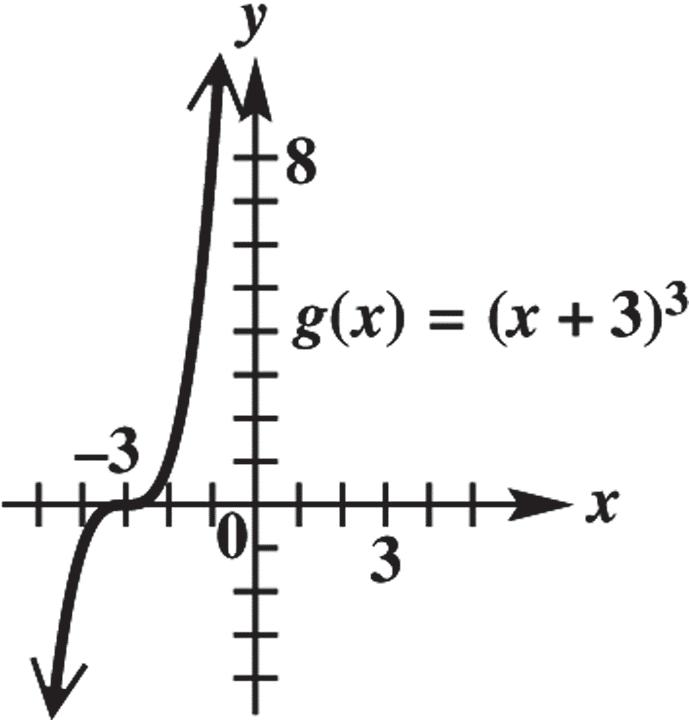
84. 3 2 fxx
This graph may be obtained by shifting the graph of 3 yx two units right.
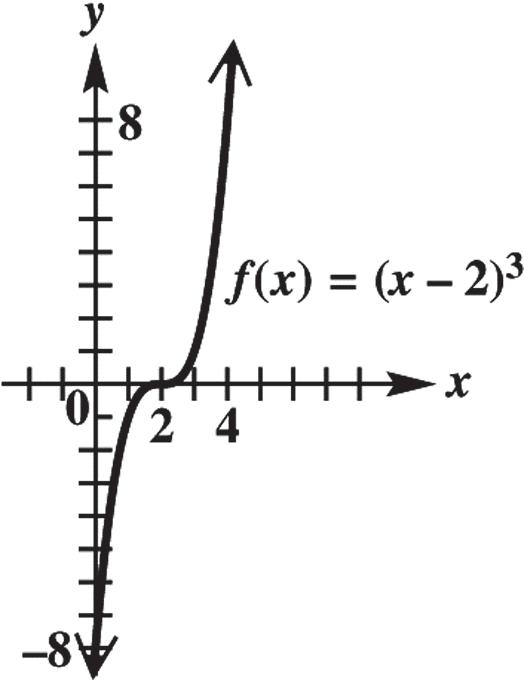
85. 2 2 3 2 fxx
This graph may be obtained by translating the graph of 2 yx two units to the right, then stretching the resulting graph vertically by a factor of 2 3 .
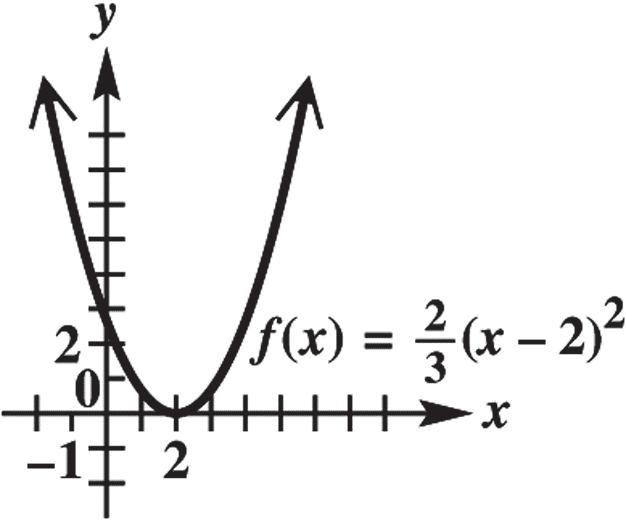
86. Because () (),gxxxfx the graphs are the same.
87. (a) y = g(–x)
The graph of g(x) is reflected across the y-axis.
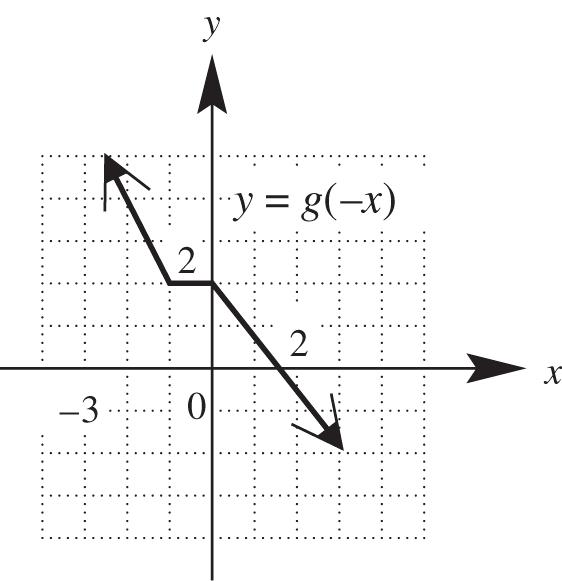
(b) y = g(x – 2)
The graph of g(x) is translated to the right 2 units.
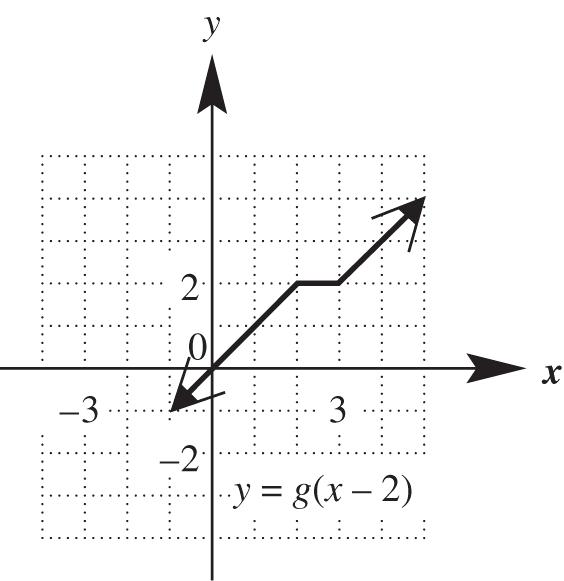
(c) y = –g(x)
The graph of g(x) is reflected across the x-axis.
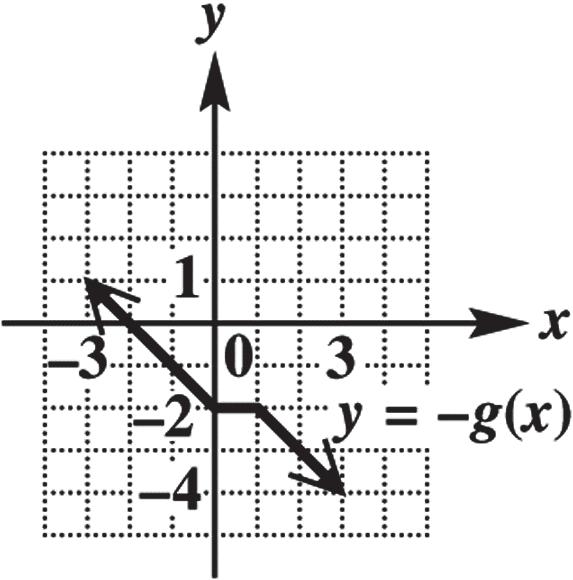
(d) y = –g(x) + 2
The graph of g(x) is reflected across the x-axis and translated 2 units up.
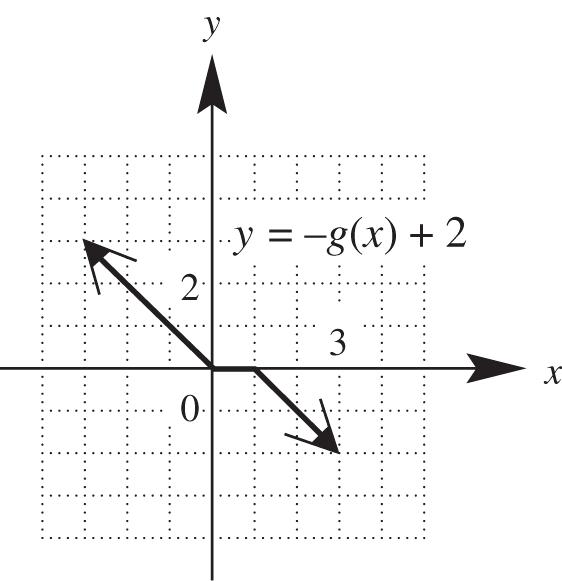
88. (a) yfx
The graph of f(x) is reflected across the x-axis.
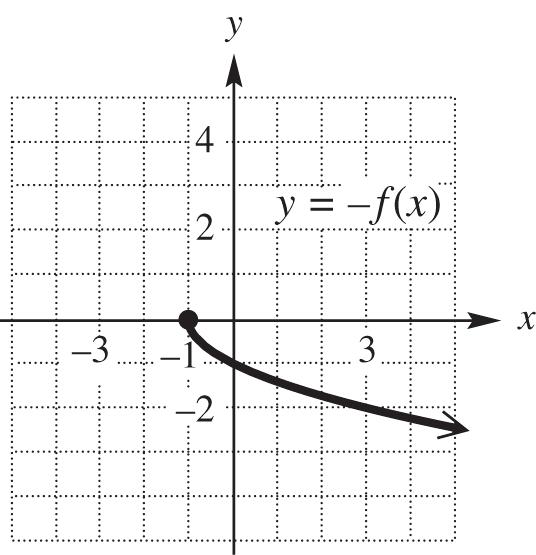
(b) 2 yfx
The graph of f(x) is stretched vertically by a factor of 2.
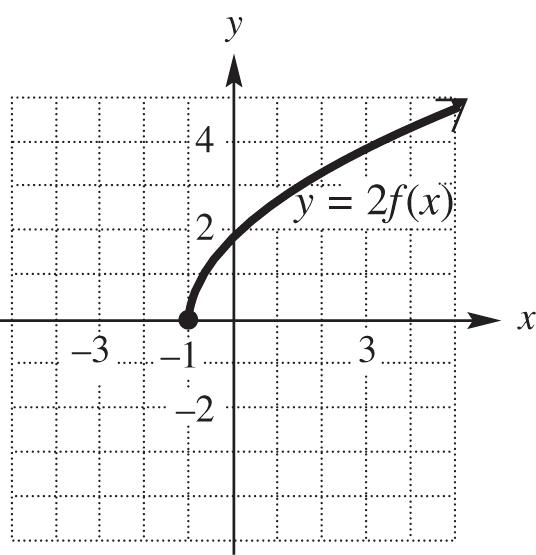
(c) yfx
The graph of f(x) is reflected across the y-axis.
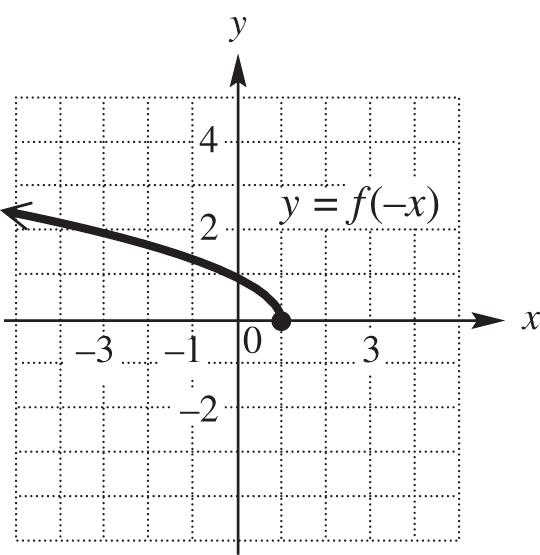
(d) 1 2 yfx
The graph of f(x) is compressed vertically by a factor of 1 2
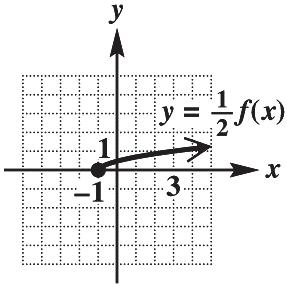
89. It is the graph of fxx translated 1 unit to the left, reflected across the x-axis, and translated 3 units up. The equation is 13. yx
90. It is the graph of gxx translated 4 units to the left, reflected across the x-axis, and translated two units up. The equation is 42. yx
91. It is the graph of fxx translated one unit right and then three units down. The equation is 13. yx
92. It is the graph of fxx translated 2 units to the right, shrunken vertically by a factor of 1 2 , and translated one unit down. The equation is 1 2 21. yx
93. It is the graph of gxx translated 4 units to the left, stretched vertically by a factor of 2, and translated four units down. The equation is 244.yx
94. It is the graph of fxx reflected across the x-axis and then shifted two units down. The equation is 2 yx .
95. Because f (3) = 6, the point (3, 6) is on the graph. Because the graph is symmetric with respect to the origin, the point (–3, –6) is on the graph. Therefore, f (–3) = –6.
96. Because f (3) = 6, (3, 6) is a point on the graph. The graph is symmetric with respect to the y-axis, so (–3, 6) is on the graph. Therefore, f (–3) = 6.
97. Because f (3) = 6, the point (3, 6) is on the graph. The graph is symmetric with respect to the line x = 6 and the point (3, 6) is 3 units to the left of the line x = 6, so the image point of (3, 6), 3 units to the right of the line x = 6 is (9, 6). Therefore, f (9) = 6.
98. Because f (3) = 6 and f (–x) = f (x), f (–3) = f (3). Therefore, f (–3) = 6.
99. Because (3, 6) is on the graph, (–3, –6) must also be on the graph. Therefore, f (–3) = –6.
100. If f is an odd function, f (–x) = –f (x). Because f (3) = 6 and f (–x) = –f (x), f (–3) = –f (3). Therefore, f (–3) = –6.
101. f (x) = 2x + 5
Translate the graph of ()fx up 2 units to obtain the graph of ()(25)227. txxx
Now translate the graph of t(x) = 2x + 7 left 3 units to obtain the graph of ()2(3)7267213. gxxxx
(Note that if the original graph is first translated to the left 3 units and then up 2 units, the final result will be the same.)
102. f (x) = 3 – x
Translate the graph of ()fx down 2 units to obtain the graph of ()(3)21. txxx
Now translate the graph of 1 txx right 3 units to obtain the graph of ()(3)1314. gxxxx
(Note that if the original graph is first translated to the right 3 units and then down 2 units, the final result will be the same.)
103. (a) Because f(–x) = f(x), the graph is symmetric with respect to the y-axis.
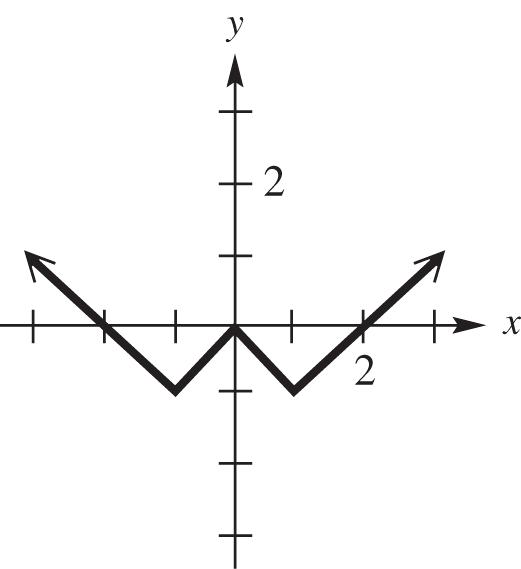
(b) Because f(–x) = –f(x), the graph is symmetric with respect to the origin.
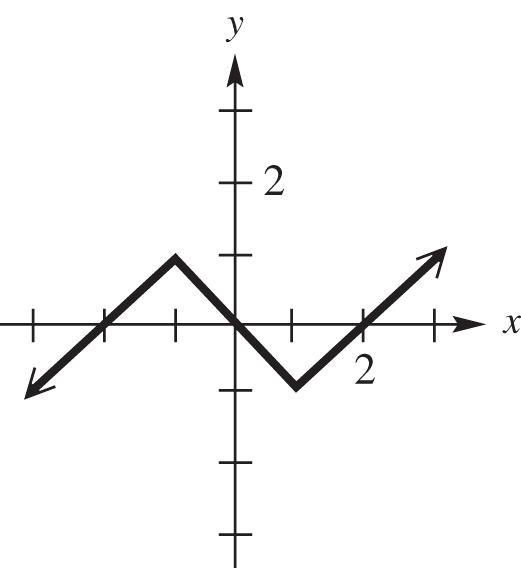
104. (a) f(x) is odd. An odd function has a graph symmetric with respect to the origin. Reflect the left half of the graph in the origin.
(b) f(x) is even. An even function has a graph symmetric with respect to the y-axis. Reflect the left half of the graph in the y-axis.
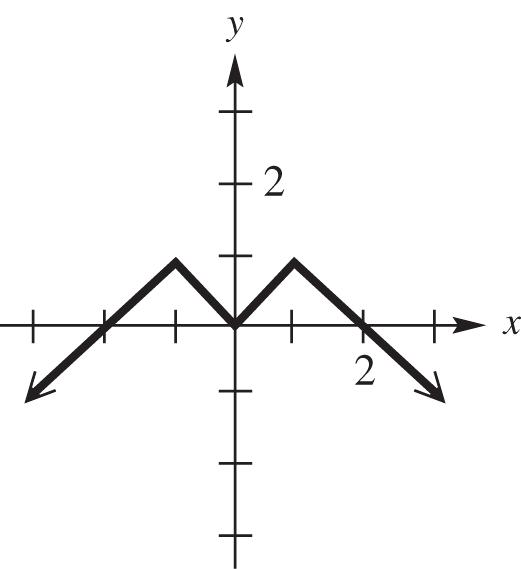
Chapter 2 Quiz (Sections 2.5 2.7)
1. (a) First, find the slope: 95 2 1(3) m
Choose either point, say, ( 3, 5), to find the equation of the line: 52((3))2(3)5yxyx 211yx
(b) To find the x-intercept, let y = 0 and solve for x: 11 2 0211xx . The x-intercept is 11 2 ,0.
2. Write 3x 2y = 6 in slope-intercept form to find its slope: 3 2 3263. xyyx
Then, the slope of the line perpendicular to this graph is 2 3 2 3 4((6))yx 22 33 (6))4 yxyx
3. (a) 8 x (b) 5 y
4. (a) Cubing function; domain: (,) ; range: (,) ; increasing over (,)
(b) Absolute value function; domain: (,) ; range: [0,) ; decreasing over (,0) ; increasing over (0,)
Copyright © 2017 Pearson Education, Inc.
(c) Cube root function: domain: (,) ; range: (,) ; increasing over (,)
5.
A 5.5-minute call costs $2.75.
6. if 0 () 23if 0 fxxx xx
For values of x < 0, the graph is the line y = 2x + 3. Do not include the right endpoint (0, 3). Graph the line yx for values of x ≥ 0, including the left endpoint (0, 0).
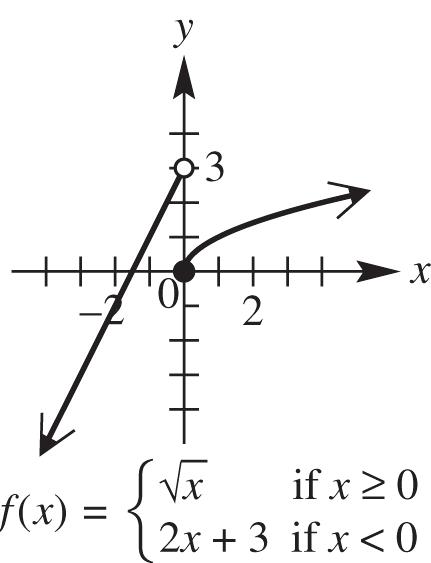
7. 3 ()1fxx
Reflect the graph of 3 () fxx across the x-axis, and then translate the resulting graph one unit up.
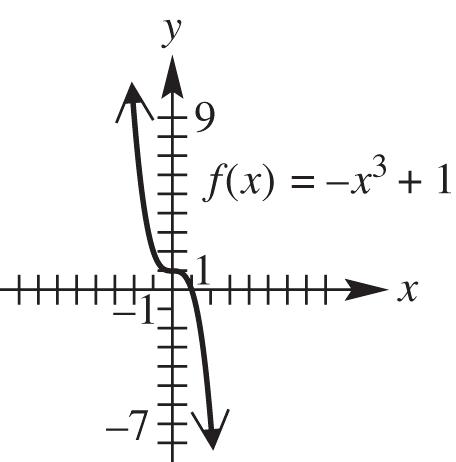
8. ()213fxx
Shift the graph of () fxx one unit right, stretch the resulting graph vertically by a factor of 2, then shift this graph three units up.
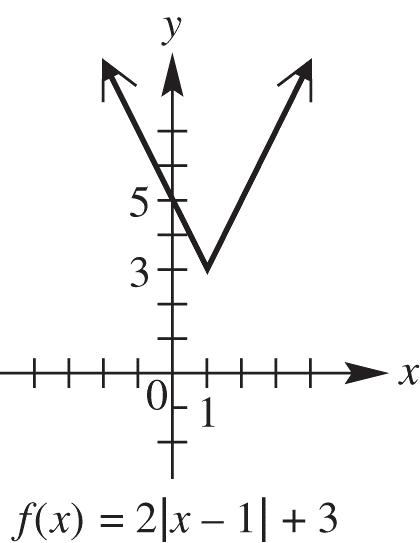
9. This is the graph of () gxx , translated four units to the left, reflected across the x-axis, and then translated two units down. The equation is 42 yx
10. (a) 2 7 fxx
Replace x with –x to obtain
2 2 ()7 7 fxx fxxfx
The result is the same as the original function, so the function is even.
(b) 3 1 fxxx
Replace x with –x to obtain
3 3 1 1 fxxx xxfx
The result is not the same as the original equation, so the function is not even.
Because , fxfx the function is not odd. Therefore, the function is neither even nor odd.
(c) 10199fxxx
Replace x with –x to obtain
10199 10199 10199 fxxx xx xx fx
Because f( x) = f(x), the function is odd.
Section 2.8 Function Operations and Composition
In exercises 1–10, 1 fxx and 2 gxx
2 222 2127 fgfg
2 222 2121
2 222 21212 fgfg
2 2 213 2 24 2 ff gg
22 222215
6. 2 2221219gfgfg
7. f is defined for all real numbers, so its domain is
8. g is defined for all real numbers, so its domain is ,.
9. f + g is defined for all real numbers, so its domain is ,.
10. f g is defined for all real numbers except those values that make
0, gx so its domain is
,00,.
In Exercises 11–18, 2 ()3fxx and ()26gxx
11. 2 ()(3)(3)(3) (3)32(3)6 12012 fgfg
fgfg
12. 2 ()(5)(5)(5) [(5)3][2(5)6] 281644
fgfg
13. 2 ()(1)(1)(1) [(1)3][2(1)6] 484
fgfg
14. 2 ()(4)(4)(4) [(4)3][2(4)6] 19(2)21
15. 2 ()(4)(4)(4) [43][2(4)6] 19(2)38 fgfg
16. 2 ()(3)(3)(3) [(3)3][2(3)6] 1212144 fgfg
17. 2 (1)(1)341 (1) (1)2(1)682
18. 2 (5)(5)328 (5)7 (5)2(5)64 ff gg
19. ()34, ()25fxxgxx
()()()() (34)(25)9 fgxfxgx xxx
2 2 ()()()()(34)(25) 615820 6720 fgxfxgxxx xxx xx
()34 () ()25 ffxx x ggxx
The domains of both f and g are the set of all real numbers, so the domains of f + g, f – g, and fg are all ,. The domain of f g is the set of all real numbers for which
0. gx This is the set of all real numbers except 5 2 , which is written in interval notation as 55 22 , , .
20. f (x) = 6 – 3x, g(x) = –4x + 1 ()()()() (63)(41) 77 fgxfxgx xx x
()()()() (63)(41)5 fgxfxgx xxx 2 2 ()()()()(63)(41) 246123 12276 fgxfxgxxx xxx xx
()63 () ()41 ffxx x ggxx
The domains of both f and g are the set of all real numbers, so the domains of f + g, f – g, and fg are all ,. The domain of f g is the set of all real numbers for which 0. gx This is the set of all real numbers except 1 4 , which is written in interval notation as 11 44 –,, .
21. ()23,22()3 fxxxgxxx 22 2 ()()()() (23)(3) 343 fgxfxgx xxxx xx
22 22 2 ()()()() (23)(3) 233 23 fgxfxgx xxxx xxxx xx
(continuedonnextpage)
(continued)
()()()() (23)(3) 226339 2599 fgxfxgx xxxx xxxxxx xxxx
22 43232 432
2 2 ()23 () () 3 ffxxx x ggxxx
The domains of both f and g are the set of all real numbers, so the domains of f + g, f – g, and fg are all ,. The domain of f g is the set of all real numbers for which
0. gx If 2 30 xx , then by the quadratic formula 111 2 i x . The equation has no real solutions. There are no real numbers which make the denominator zero. Thus, the domain of f g is also ,.
22. ()42,22()32 fxxxgxxx
22 2 ()()()() (42)(32) 52 fgxfxgx xxxx xx
22 22 2 ()()()() (42)(32) 4232 352 fgxfxgx xxxx xxxx xx
22 43232 432 ()()()() (42)(32) 4128264 41024 fgxfxgx xxxx xxxxxx xxxx
2 2 ()42 () () 32 ffxxx x ggxxx
The domains of both f and g are the set of all real numbers, so the domains of f + g, f – g, and fg are all ,. The domain of f g is the set of all real numbers x such that 2 320xx . Because 2 32(1)(2)xxxx , the numbers which give this denominator a value of 0 are x = 1 and x = 2. Therefore, the domain of f g is the set of all real numbers except 1 and 2, which is written in interval notation as (–,1)(1,2)(2,)
23. 1 ()41, ()fxxgx x 1
()()()()41 fgxfxgxx x 1
()()()()41 fgxfxgxx x
()()()() 141 41 fgxfxgx x x xx
1 ()41 ()41 () x ffxx xxx ggx
Because 1 4 41041, xxx the domain of f is 1 4 ,. The domain of g is
,00,. Considering the intersection of the domains of f and g, the domains of f + g, f – g, and fg are all 1 4 ,. Because 1 0 x for any value of x, the domain of f g is also
1 4 ,.
24. 1 ()54, ()fxxgx x ()()()() 11 5454 fgxfxgx xx xx
()()()() 11 5454 fgxfxgx xx xx
()()()() 154 54 fgxfxgx x x xx
1 ()54 ()54 () x ffxx xxx ggx
Because 4 5 54054, xxx the domain of f is 4 5 ,.
The domain of g is ,00,. Considering the intersection of the domains of f and g, the domains of f + g, f – g, and fg are all 4 5 ,.
1 0 x for any value of x, so the domain of f g is also
4 5 ,.
25.
MF TMF
2008280 and2008470, thus 200820082008 280470750(thousand).
26.
MF TMF
2012390 and2012630, thus 201220122012 3906301020(thousand).
27. Looking at the graphs of the functions, the slopes of the line segments for the period 2008 2012 are much steeper than the slopes of the corresponding line segments for the period 2004 2008. Thus, the number of associate’s degrees increased more rapidly during the period 2008 2012.
28. If 20042012,(), kTkr and F(k) = s, then M(k) = rs.
29.
It represents the dollars in billions spent for general science in 2000.
30.
It represents the dollars in billions spent on space and other technologies in 2010.
31. Spending for space and other technologies spending decreased in the years 1995 2000 and 2010–2015.
32. Total spending increased the most during the years 2005 2010.
33. (a)
()(1)(1)(1)1(3)4
()(0)(0)(0)0(4)0 fgfg
(d) (1)11 (1) (1)33
gg
34. (a) ()(0)(0)(0)022 fgfg
(b) ()(1)(1)(1) 213 fgfg
(c) ()(1)(1)(1)212 fgfg
(d) (2)4 (2)2 (2)2 ff gg
35. (a) ()(1)(1)(1)033 fgfg (b) ()(2)(2)(2) 145 fgfg
(c) ()(0)(0)(0)122 fgfg
(d) (2)3 (2)undefined (2)0 ff gg
36. (a) ()(1)(1)(1)312 fgfg (b) ()(0)(0)(0)202 fgfg
(c) ()(1)(1)(1)3(1)3 fgfg
(d) (1)3 (1)3 (1)1 ff gg
37. (a)
222725fgfg
(b) ()(4)(4)(4)1055 fgfg
(c) ()(2)(2)(2)060 fgfg
(d) (0)5 (0)undefined (0)0 ff gg
38. (a)
222549fgfg
(b) ()(4)(4)(4)000 fgfg
(c) ()(2)(2)(2)428 fgfg
(d) (0)8 (0)8 (0)1 ff gg
41. Answers may vary. Sample answer: Both the slope formula and the difference quotient represent the ratio of the vertical change to the horizontal change. The slope formula is stated for a line while the difference quotient is stated for a function f
42. Answers may vary. Sample answer: As h approaches 0, the slope of the secant line PQ approaches the slope of the line tangent of the curve at P.
43.
2 fxx
(a) ()2()2 fxhxhxh
(b) ()()(2)(2) 22 fxhfxxhx xhxh
(c) ()() 1 fxhfxh hh
1 fxx
(a) ()1()1 fxhxhxh
(b) ()()(1)(1) 11 fxhfxxhx xhxh
(c) ()() 1 fxhfxh hh
45. 62fxx
(a) ()6()2662 fxhxhxh
46.
(b) ()() (662)(62) 662626 fxhfx xhx xhxh
(c) ()()6 6 fxhfxh hh
411fxx
(a) ()4()114411 fxhxhxh
(b) ()() (4411)(411) 44114114 fxhfx xhx xhxh
(c) ()()4 4 fxhfxh hh
47. 25fxx
(a) ()2()5 225 fxhxh xh
(b) ()() (225)(25) 225252 fxhfx xhx xhxh
(c) ()()2 2 fxhfxh hh
48. ()42fxx
(a) ()4()2 442 fxhxh xh
49. 1 ()fx x
(a) 1 ()fxh xh
51. 2 () fxx
(a) ()()2222 fxhxhxxhh (b) 222 2 ()()2 2 fxhfxxxhhx xhh
(c) 2 ()()2 (2) 2 fxhfxxhh hh hxh h xh
52. 2 () fxx (a)
2 22 22 ()() 2 2 fxhxh xxhh xxhh
(b) 222 222 2 ()()2 2 2 fxhfxxxhhx xxhhx xhh
(c) 2 ()()2 (2) 2 fxhfxxhh hh hxh h xh
53. 2 ()1 fxx
(a) 2 22 22 ()1() 1(2) 12 fxhxh xxhh xxhh
(b) 222 222 2 ()() (12)(1) 121 2 fxhfx xxhhx xxhhx xhh
(c) 2 ()()2 (2) 2 fxhfxxhh hh hxh h xh
54. 2 ()12 fxx (a) 2 22 22 ()12() 12(2) 1242 fxhxh xxhh xxhh
(b)
222 222 2 ()() 124212 124212 42 fxhfx xxhhx xxhhx xhh
(c) 2 ()()42 (42) 42 fxhfxxhh hh hxh h xh
55. 2 ()31 fxxx
(a) 2 22 ()31 2331 fxhxhxh xxhhxh
(b)
22 2 222 2 ()() 2331 31 233131 23 fxhfx xxhhxh xx xxhhxhxx xhhh
(c) 2 ()()23 (23) 23 fxhfxxhhh hh hxh h xh
56. 2 ()42 fxxx
(a) 2 22 ()42 2442 fxhxhxh xxhhxh
(b)
22 2 222 2 ()() 2442 42 244242 24 fxhfx xxhhxh xx xxhhxhxx xhhh
2 ()()24 (24) 24 fxhfxxhhh hh hxh h xh
232223431fxxf
2212131fffff
32235gxxg
225532ggggg
65. ()(2)[(2)](3)1 fgfgf
66. ()(7)[(7)](6)9 fgfgf
67. ()(3)[(3)](1)9 gfgfg
68. ()(6)[(6)](9)12 gfgfg
69. ()(4)[(4)](3)1 fffff
70. ()(1)[(1)](9)12 ggggg
71. ()(1)[(1)](9) fgfgf
However, f (9) cannot be determined from the table given.
72. (())(7)(((7))) ((6))(9)12 gfggfg gfg
73. (a) ()()(())(57) 6(57)9 304293033 fgxfgxfx x xx
The domain and range of both f and g are (,) , so the domain of fg is (,)
(b) ()()(())(69) 5(69)7 304573052 gfxgfxgx x xx
The domain of gf is (,)
74. (a) ()()(())(31) 8(31)12 24812244 fgxfgxfx x xx
The domain and range of both f and g are (,) , so the domain of fg is (,)
(b) ()()(())(812) 3(812)1 243612435 gfxgfxgx x xx
The domain of gf is (,)
75. (a) ()()(())(3)3 fgxfgxfxx
The domain and range of g are (,) , however, the domain and range of f are [0,) . So, 303xx Therefore, the domain of fg is [3,)
(b)
()()(())3 gfxgfxgxx
The domain and range of g are (,) , however, the domain and range of f are [0,) .Therefore, the domain of gf is [0,)
76. (a) ()()(())(1)1 fgxfgxfxx
The domain and range of g are (,) , however, the domain and range of f are [0,) . So, 101xx . Therefore, the domain of fg is [1,) .
(b) ()()(())1 gfxgfxgxx
The domain and range of g are (,), however, the domain and range of f are [0,). Therefore, the domain of gf is [0,).
77. (a) 2 23 ()()(())(31) (31) fgxfgxfxx xx
The domain and range of f and g are (,), so the domain of fg is (,). (b) 3 2 33 63
()()(())() 31 31 gfxgfxgx xx xx
The domain and range of f and g are (,), so the domain of gf is (,).
78. (a) 42 42 42 ()()(())(4) 42 2 fgxfgxfxx xx xx
The domain of f and g is (,), while the range of f is (,) and the range of g is 4,, so the domain of fg is (,).
(b) 42 ()()(())(2) (2)(2)4 gfxgfxgx xx
The domain of f and g is (,), while the range of f is (,) and the range of g is 4,, so the domain of gf is (,).
79. (a) ()()(())(3)31 fgxfgxfxx
The domain and range of g are (,) , however, the domain of f is [1,), while the range of f is [0,). So, 1 3 310xx . Therefore, the domain of fg is 1 3 , (b) ()()(())1 31 gfxgfxgx x
The domain and range of g are (,) , however, the range of f is [0,) . So 101xx . Therefore, the domain of gf is [1,) .
80. (a) ()()(())(2)22 fgxfgxfxx
The domain and range of g are (,) , however, the domain of f is [2,) . So, 2201 xx . Therefore, the domain of fg is 1, .
Copyright © 2017 Pearson Education, Inc.
(b) ()()(())2 gfxgfxgx
22 x
The domain and range of g are (,) , however, the range of f is [0,) . So 202xx . Therefore, the domain of gf is [2,)
81. (a)
2 1 ()()(())(1) fgxfgxfxx
The domain and range of g are (,) , however, the domain of f is (,0)(0,) . So, 101xx
Therefore, the domain of fg is (,1)(1,)
(b)
22 ()()(())1 gfxgfxgxx
The domain and range of f is (,0)(0,) , however, the domain and range of g are (,) . So 0 x Therefore, the domain of gf is (,0)(0,) .
82. (a) 4 4 ()()(())(4) fgxfgxfxx
The domain and range of g are (,) , however, the domain of f is (,0)(0,) . So, 404xx
Therefore, the domain of fg is (,4)(4,)
(b) 44
()()(())4 gfxgfxgxx
The domain and range of f is (,0)(0,) , however, the domain and range of g are (,) . So 0 x . Therefore, the domain of gf is (,0)(0,) .
83. (a)
11 ()()(()) 2 fgxfgxfxx
The domain and range of g are (,0)(0,) , however, the domain of f is [2,) . So, 1 20 x 1 2 0 or xx (using test intervals). Therefore, the domain of fg is 1 2 ,0,
(b) 1 2 ()()(())2 x gfxgfxgx
The domain of f is [2,) and its range is [0,). The domain and range of g are (,0)(0,) . So 202xx
Therefore, the domain of gf is (2,) .
84. (a) 22 ()()(()) 4 fgxfgxfxx
The domain and range of g are (,0)(0,) , however, the domain of f is [4,) . So, 2 40 x 1 2 0 or xx (using test intervals). Therefore, the domain of fg is 1 2 ,0,
(b) 2 4 ()()(())4 x gfxgfxgx
The domain of f is [4,) and its range is [0,). The domain and range of g are (,0)(0,) . So 404xx Therefore, the domain of gf is (4,)
85. (a)
11 55 ()()(()) fgxfgxfxx
The domain of g is (,5)(5,) , and the range of g is (,0)(0,)
The domain of f is [0,) . Therefore, the domain of fg is 5,
(b) 1 5 ()()(()) x gfxgfxgx
The domain and range of f is [0,). The domain of g is (,5)(5,).
Therefore, the domain of gf is [0,).
86. (a) 33 66 ()()(()) fgxfgxfxx
The domain of g is (,6)(6,) , and the range of g is (,0)(0,)
The domain of f is [0,) . Therefore, the domain of fg is 6,.
(b) 3 6 ()()(()) x gfxgfxgx
The domain and range of f is [0,) . The domain of g is (,6)(6,) . Therefore, the domain of gf is [0,).
Copyright © 2017 Pearson Education, Inc.
87. (a) 11 1212
()()(()) x fgxfgxfxxx
The domain and range of g are (,0)(0,) . The domain of f is (,2)(2,), and the range of f is (,0)(0,) . So, 12 00 x x x or 1 2 0 x or 1 2 x (using test intervals). Thus, 0 x and 1 2 x . Therefore, the domain of fg is
11 22 ,00,,.
(b)
()()(()) 2 gfxgfxgxx x
11 21(2)
The domain and range of g are (,0)(0,). The domain of f is (,2)(2,), and the range of f is (,0)(0,). Therefore, the domain of gf is (,2)(2,).
88. (a) 11 14 14 ()()(()) xx x x fgxfgxf
The domain and range of g are (,0)(0,). The domain of f is (,4)(4,), and the range of f is (,0)(0,). So, 14 00 x x x or 1 4 0 x or 1 4 140xx (using test intervals). Thus, x ≠ 0 and x ≠ 1 4 . Therefore, the domain of fg is
11 44 ,00,,.
(b) 11 41(4) ()()(()) 4 gfxgfxgxx x
The domain and range of g are (,0)(0,) . The domain of f is (,4)(4,) , and the range of f is (,0)(0,) . Therefore, the domain of gf is (,4)(4,).
89. (2)(1)2 and (3)(2)5 Since (1)7 and (1)3,(3)7. gfggfg gffg x
90. ()fx is odd, so (1)(1)(2)2.ff
Because ()gx is even, (1)(1)2gg and (2)(2)0.gg ()(1)1, fg so (1)1 fg and (2)1. f ()fx is odd, so (2)(2)1.ff Thus, ()(2)(2)(0)0 fgfgf
and ()(1)(1)(2)1 fgfgf and ()(2)(2)(0)0. fgfgf x –2 –1 0 1 2
91. Answers will vary. In general, composition of functions is not commutative. Sample answer:
233232 692611 322323 64367 fgxfxx
Thus,
fgx is not equivalent to
3 3 3 7 77 77
3 3 33 3 7 77
Copyright © 2017 Pearson Education,
In Exercises 97 102, we give only one of many possible answers.
97. 2 ()(62)hxx
Let g(x) = 6x – 2 and 2 () fxx . 2 ()()(62)(62)() fgxfxxhx
98. ()(1112)22 hxxx 22 Let ()1112 and ().gxxxfxx 2 22 ()()(1112) (1112)() fgxfxx xxhx
99. 2 ()1hxx
Let 2 ()1and (). gxxfxx 22 ()()(1)1(). fgxfxxhx
100. ()(23)3hxx 3
Let ()23 and ().gxxfxx 3 ()()(23)(23)() fgxfxxhx
101. ()612hxx
Let ()6 and ()12.gxxfxx ()()(6)612() fgxfxxhx
102. 3 ()234hxx
Let 3 ()23 and ()4.gxxfxx 3 ()()(23)234() fgxfxxhx
103. f(x) = 12x, g(x) = 5280x ()()[()](5280) 12(5280)63,360 fgxfgxfx xx
The function fg computes the number of inches in x miles.
104. 3,1760 fxxgxx
1760 317605280 fgxfgxfx xx
fgx compute the number of feet in x miles.
105. 2 3 () 4 xx (a) 33222 (2)(2)(4)3 44 xxxx
(b) 2 (16)(28)3(8) 643 square units A
106. (a) 44 4 xxxsss
(b) 2 2 2 416ysxx
(c) 2 636 2.25 square units 1616 y
107. (a) 2 ()4 and () rttrr 22 ()()[()] (4)(4)16 rtrt ttt
(b) ()() rt defines the area of the leak in terms of the time t, in minutes.
(c) (3)16(3)14422 ft
108. (a) 22 ()()[()] (2)(2)4 rtrt ttt
(b) It defines the area of the circular layer in terms of the time t, in hours.
(c) ()(4)4(4)6422 mi r
109. Let x = the number of people less than 100 people that attend.
(a) x people fewer than 100 attend, so 100 – x people do attend N(x) = 100 – x
(b) The cost per person starts at $20 and increases by $5 for each of the x people that do not attend. The total increase is $5x, and the cost per person increases to $20 + $5x. Thus, G(x) = 20 + 5x.
(c) ()()()(100)(205) CxNxGxxx
(d) If 80 people attend, x = 100 – 80 = 20.
201002020520 8020100 80120$9600
110. (a) 1 0.02 yx
(b) 2 0.015(500)yx
(c) 12yy represents the total annual interest.
3. A(–6, 3), B(–6, 8) 22 2 (,)[6(6)](83) 05255 dAB
Midpoint: 6(6)38121111 , , 6, 22222
(d) 12 12 ()(250) (250)(250)
$16.25 yy yy
0.02(250)0.015(250500)
50.015(750)1511.25
111. (a) 1 2 gxx (b) 1 fxx
112. If the area of a square is 2 x square inches, each side must have a length of x inches. If 3 inches is added to one dimension and 1 inch is subtracted from the other, the new dimensions will be x + 3 and x – 1. Thus, the area of the resulting rectangle is (x) = (x + 3)(x – 1).
Chapter 2 Review Exercises
1. P(3, –1), Q(–4, 5) 22 22 (,)(43)[5(1)] (7)6493685 dPQ
Midpoint: 3(4)15141,,,2 22222
2. M(–8, 2), N(3, –7) 22 22 (,)[3(8)](72) 11(9)12181202
dMN
Midpoint: 832(7)55 , , 2222
4. Label the points A(5, 7), B(3, 9), and C(6, 8). 22 2 2 (,)3597 22448 dAB 22 22 (,)(65)(87) 11112 dAC
22 2 2 (,)6389 319110 dBC
Because
222 8210, triangle
ABC is a right triangle with right angle at (5, 7).
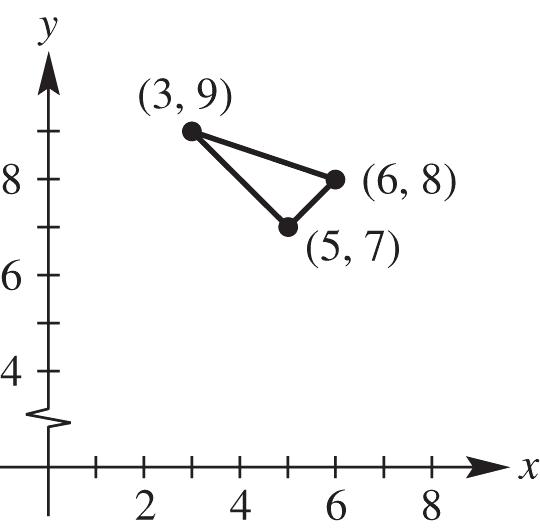
5. Let B have coordinates (x, y). Using the midpoint formula, we have 610 8,2,22 610 82 22 616104 226 xy xy xy xy
The coordinates of B are (22, 6).
6. P(–2, –5), Q(1, 7), R(3, 15) 22 22 (,)(1(2))(7(5)) (3)(12)9144 153317
dPQ
dQR
22 22 (,)(31)(157) 2846468217
dPR
22 22 (,)(3(2))(15(5)) (5)(20)25400517
(continuedonnextpage)
Copyright © 2017 Pearson Education, Inc.
(continued)
(,)(,)317217 dPQdQR
517(,), dPR so these three points are collinear.
7. Center (–2, 3), radius 15 222 222 22 ()() [(2)](3)15 (2)(3)225 xhykr xy xy
8. Center (5, 7), radius 3
9. Center (–8, 1), passing through (0, 16)
The radius is the distance from the center to any point on the circle. The distance between (–8, 1) and (0, 16) is 2222 (0(8))(161)815 6422528917. r
The equation of the circle is 222 22 [(8)](1)17 (8)(1)289 xy xy
10. Center (3, –6), tangent to the x-axis
The point (3, –6) is 6 units directly below the x-axis. Any segment joining a circle’s center to a point on the circle must be a radius, so in this case the length of the radius is 6 units.
14. The center of the circle is (5, 6). Use the distance formula to find the radius: 222(45)(96)1910 r
The equation is 22 (5)(6)10 xy
15. 2246120 xxyy
Complete the square on x and y to put the equation in center-radius form.
22 22 22 4 6 12 44691249 231 xxyy xxyy xy
The circle has center (2, –3) and radius 1.
16. 22610300 xxyy
Complete the square on x and y to put the equation in center-radius form. 22 22 (69)(1025)30925 (3)(5)4 xxyy xy
The circle has center (3, 5) and radius 2. 17.
22 22 22 22499499 4444 22 73499 4 22444 22 7354 224 2142620 7310 7 3 1 731 xxyy xxyy xxyy xxyy xy xy
222 222 22 ()() (3)[(6)]6 (3)(6)36 xhykr xy xy
11. The center of the circle is (0, 0). Use the distance formula to find the radius: 222(30)(50)92534 r
The equation is 22 34 xy
12. The center of the circle is (0, 0). Use the distance formula to find the radius: 222(20)(30)4913 r
The equation is 22 13 xy .
13. The center of the circle is (0, 3). Use the distance formula to find the radius: 222(20)(63)4913 r
The equation is 22(3)13xy
The circle has center 73 22 , and radius 549636 54 42 44
22 22 22 221211212525 4444 2 2 5146 11 224 3333150 1150 1150 11 50 xxyy xxyy xxyy xxyy xy
The circle has center 5 11 22 , and radius 146 2 .
19. This is not the graph of a function because a vertical line can intersect it in two points.
domain: [ 6, 6]; range: [ 6, 6]
20. This is not the graph of a function because a vertical line can intersect it in two points.
domain: ,; range: 0,
Copyright © 2017 Pearson Education, Inc.
21. This is not the graph of a function because a vertical line can intersect it in two points.
domain: ,; range: (,1][1,)
22. This is the graph of a function. No vertical line will intersect the graph in more than one point.
domain: ,; range: 0,
23. This is not the graph of a function because a vertical line can intersect it in two points.
domain: 0,; range: ,
24. This is the graph of a function. No vertical line will intersect the graph in more than one point.
domain: ,; range: ,
25. 2 6 yx
Each value of x corresponds to exactly one value of y, so this equation defines a function.
26. The equation 2 1 3 xy does not define y as a function of x. For some values of x, there will be more than one value of y. For example, ordered pairs (3, 3) and (3, –3) satisfy the relation. Thus, the relation would not be a function.
27. The equation 2 yx does not define y as a function of x. For some values of x, there will be more than one value of y. For example, ordered pairs (3, 1) and (3, 1) satisfy the relation.
28. The equation 4 y x defines y as a function of x because for every x in the domain, which is (–,0)(0,) , there will be exactly one value of y
29. In the function ()4 fxx , we may use any real number for x. The domain is ,.
30. 8 () 8 fxx x x can be any real number except 8 because this will give a denominator of zero. Thus, the domain is (–,8)(8,).
31. 63 fxx
In the function 63 yx , we must have 630 x 6306322 xxxx Thus, the domain is ,2.
32. (a) As x is getting larger on the interval 2,, the value of y is increasing.
(b) As x is getting larger on the interval ,2, the value of y is decreasing.
(c) f(x) is constant on ( 2, 2).
In exercises 33–36, 2 236.fxxx
33. 2 323336 29336 189615 f
34. 2 0.520.530.56 20.2530.56 0.51.568 f
35. 2 0203066 f
36. 2 236fkkk
37. 2 5 2555251 xyyxyx
The graph is the line with slope 2 5 and y-intercept (0, –)1. It may also be graphed using intercepts. To do this, locate the x-intercept: 0 y
5 2 250525 xxx
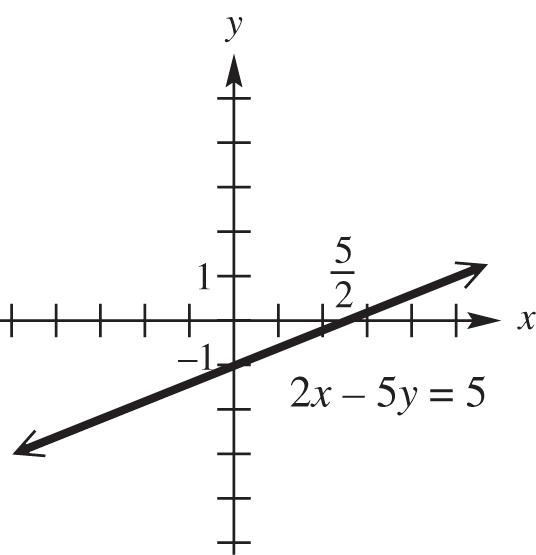
38. 3 7 371473142 xyyxyx
The graph is the line with slope of 3 7 and y-intercept (0, 2). It may also be graphed using intercepts. To do this, locate the x-intercept by setting y = 0:
14 3 37014314 xxx
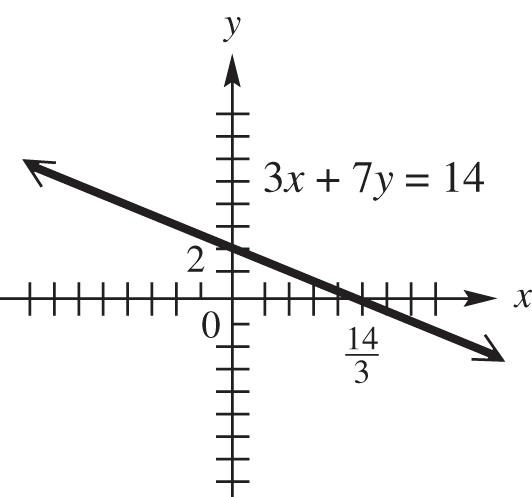
39. 2 5 252052204 xyyxyx
The graph is the line with slope of 2 5 and y-intercept (0, 4). It may also be graphed using intercepts. To do this, locate the x-intercept: x-intercept: 0 y
2502022010 xxx
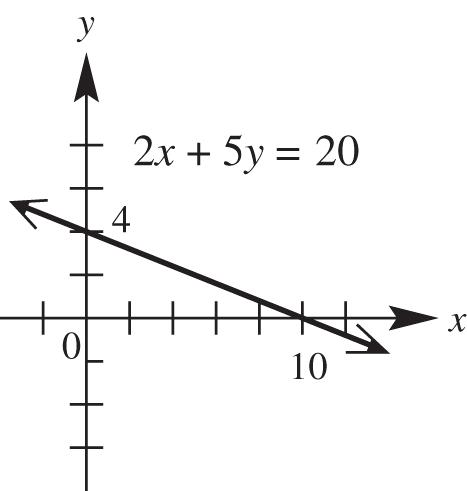
40. 1 3 3 yxyx
The graph is the line with slope 1 3 and y-intercept (0, 0), which means that it passes through the origin. Use another point such as (6, 2) to complete the graph.
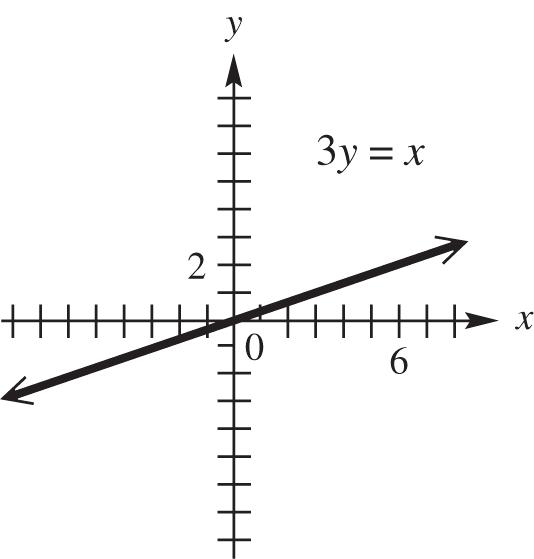
41. f (x) = x
The graph is the line with slope 1 and y-intercept (0, 0), which means that it passes through the origin. Use another point such as (1, 1) to complete the graph.
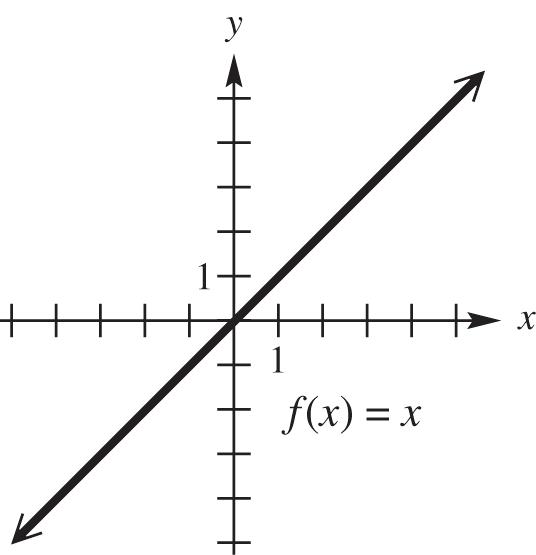
42. 1 4 48 48 2 xy yx yx
The graph is the line with slope 1 4 and y-intercept (0, –2). It may also be graphed using intercepts. To do this, locate the x-intercept:
04088yxx
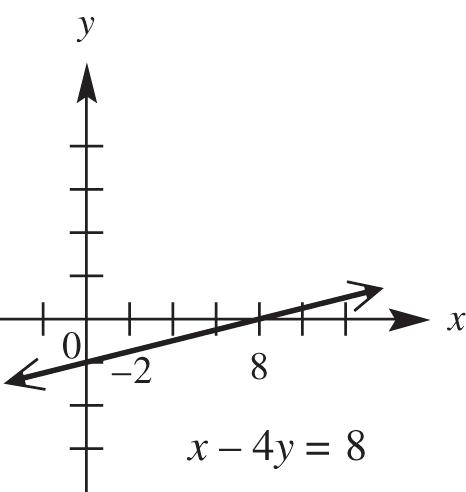
43. x = –5
The graph is the vertical line through (–5, 0).
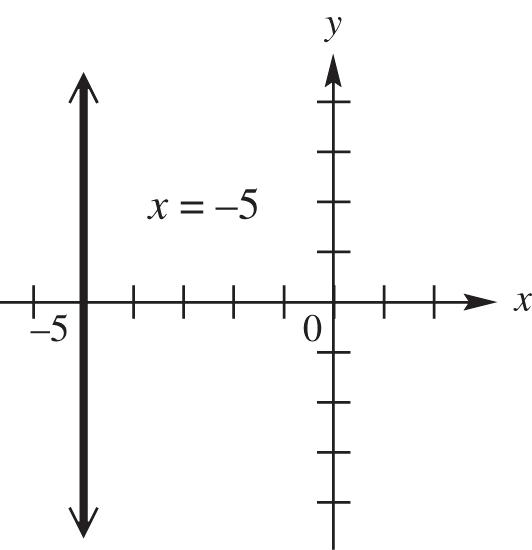
44. f (x) = 3
The graph is the horizontal line through (0, 3).
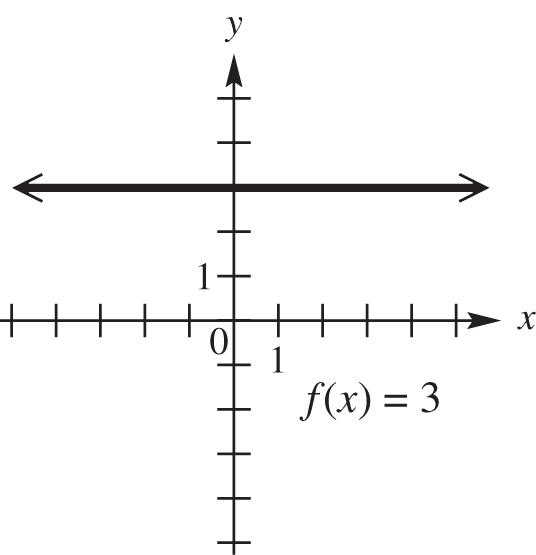
45. 202yy
The graph is the horizontal line through (0, 2).
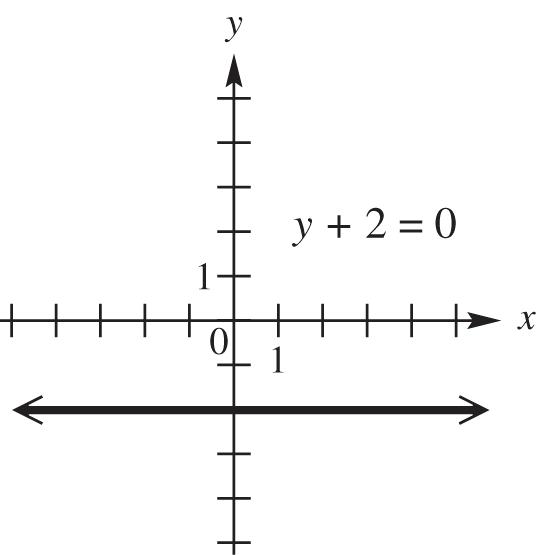
46. The equation of the line that lies along the x-axis is y = 0.
47. Line through (0, 5), 2 3 m
Note that 22 33 m
Begin by locating the point (0, 5). Because the slope is 2 3 , a change of 3 units horizontally (3 units to the right) produces a change of –2 units vertically (2 units down). This gives a second point, (3, 3), which can be used to complete the graph.
(continuedonnextpage)
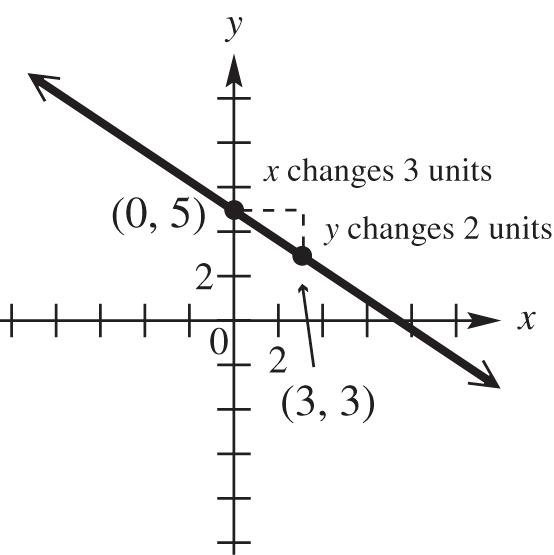
48. Line through (2, –4), 3 4 m
First locate the point (2, –4).
Because the slope is 3 4 , a change of 4 units horizontally (4 units to the right) produces a change of 3 units vertically (3 units up). This gives a second point, (6, –1), which can be used to complete the graph.
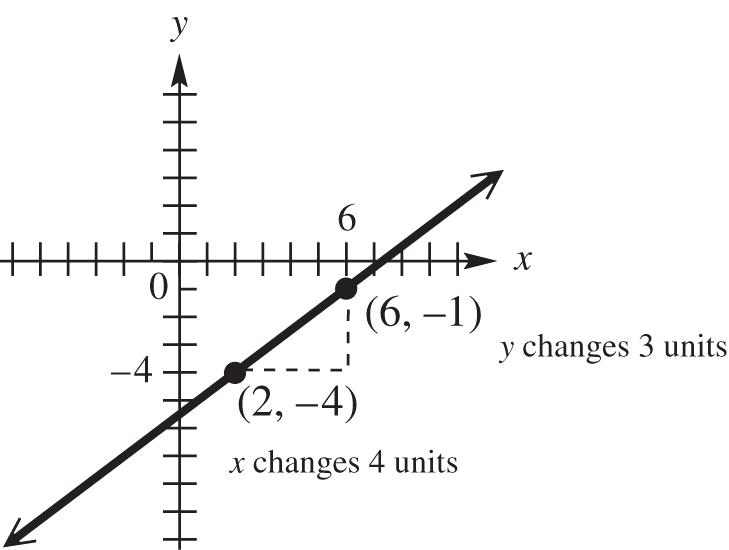
49. through (2, –2) and (3, –4)
50. through (8, 7) and 1 2 ,2 21 115 21 2 2 279 8 2186 9 15155 yy m xx
51. through (0, –7) and (3, –7)
77 0 0 303 m
52. through (5, 6) and (5, –2) 21 21 268 550 yy m xx
The slope is undefined.
53. 1123 xy
Solve for y to put the equation in slopeintercept form. 3 11 22 2113yxyx
Thus, the slope is 11 2
54. 9x – 4y = 2.
Solve for y to put the equation in slopeintercept form. 9 1 42 492yxyx
Thus, the slope is 9 4
55. 202xx
The graph is a vertical line, through (2, 0). The slope is undefined.
56. x – 5y = 0.
Solve for y to put the equation in slopeintercept form. 1 5 5 yxyx
Thus, the slope is 1 5
57. Initially, the car is at home. After traveling for 30 mph for 1 hr, the car is 30 mi away from home. During the second hour the car travels 20 mph until it is 50 mi away. During the third hour the car travels toward home at 30 mph until it is 20 mi away. During the fourth hour the car travels away from home at 40 mph until it is 60 mi away from home. During the last hour, the car travels 60 mi at 60 mph until it arrived home.
58. (a) This is the graph of a function because no vertical line intersects the graph in more than one point.
(b) The lowest point on the graph occurs in December, so the most jobs lost occurred in December. The highest point on the graph occurs in January, so the most jobs gained occurred in January.
(c) The number of jobs lost in December is approximately 6000. The number of jobs gained in January is approximately 2000.
(d) It shows a slight downward trend.
59. (a) We need to first find the slope of a line that passes between points (0, 30.7) and (12, 82.9) 21 21 82.930.752.2 4.35
Now use the point-intercept form with b = 30.7 and m = 4.35. y = 4.35x + 30.7
The slope, 4.35, indicates that the number of e-filing taxpayers increased by 4.35% each year from 2001 to 2013.
(b) For 2009, we evaluate the function for x = 8. y = 4.35(8) + 30.7 = 65.5
65.5% of the tax returns are predicted to have been filed electronically.
60. We need to find the slope of a line that passes between points (1980, 21000) and (2013, 63800)
21 21 63,80021,000 20131980 42,800 $1297 per year 33 yy m xx
The average rate of change was about $1297 per year.
61. (a) through (3, –5) with slope –2 Use the point-slope form. 11()
(5)2(3) 52(3) 526 21 yymxx yx yx yx yx
(b) Standard form: 2121yxxy
62. (a) through (–2, 4) and (1, 3) First find the slope.
341 1(2)3 m
Now use the point-slope form with 1 11 3 (,)(1,3) and . xym 11 1 3 10 1 33 () 3(1) 3(3)1(1) 391 310 yymxx yx yx yx yxyx
(b) Standard form: 10 1 33 310 310 yxyx xy
63. (a) through (2, –1) parallel to 3x – y = 1
Find the slope of 3x – y = 1. 313131 xyyxyx
The slope of this line is 3. Because parallel lines have the same slope, 3 is also the slope of the line whose equation is to be found. Now use the point-slope form with 11 (,)(2,1) and 3. xym 11() (1)3(2) 13637 yymxx yx yxyx
(b) Standard form: 373737yxxyxy
64. (a) x-intercept (–3, 0), y-intercept (0, 5)
Two points of the line are (–3, 0) and (0, 5). First, find the slope.
The slope is 5 3 and the y-intercept is (0, 5). Write the equation in slopeintercept form: 5 3 5 yx
(b) Standard form: 5 3 53515
65. (a) through (2, –10), perpendicular to a line with an undefined slope
A line with an undefined slope is a vertical line. Any line perpendicular to a vertical line is a horizontal line, with an equation of the form y = b. The line passes through (2, –10), so the equation of the line is y = –10.
(b) Standard form: y = –10
66. (a) through (0, 5), perpendicular to 8x + 5y = 3
Find the slope of 8x + 5y = 3. 83 55 853583 xyyx yx
The slope of this line is 8 5 The slope of any line perpendicular to this line is 5 8 , because 85 58 1.
The equation in slope-intercept form with slope 5 8 and y-intercept (0, 5) is 5 8 5. yx
(b) Standard form: 5 8 58540 58405840 yxyx xyxy
67. (a) through (–7, 4), perpendicular to y = 8
The line y = 8 is a horizontal line, so any line perpendicular to it will be a vertical line. Because x has the same value at all points on the line, the equation is x = –7. It is not possible to write this in slopeintercept form.
(b) Standard form: x = –7
68. (a) through (3, –5), parallel to y = 4
This will be a horizontal line through (3, –5). Because y has the same value at all points on the line, the equation is y = –5.
(b) Standard form: y = –5
69. ()3fxx
The graph is the same as that of , yx except that it is translated 3 units downward.
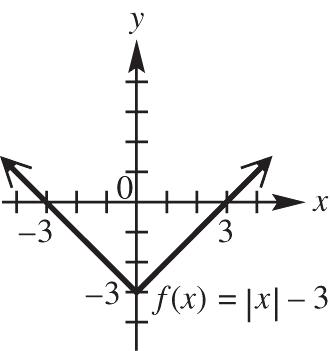
70. () fxx
The graph of () fxx is the reflection of the graph of yx about the x-axis.
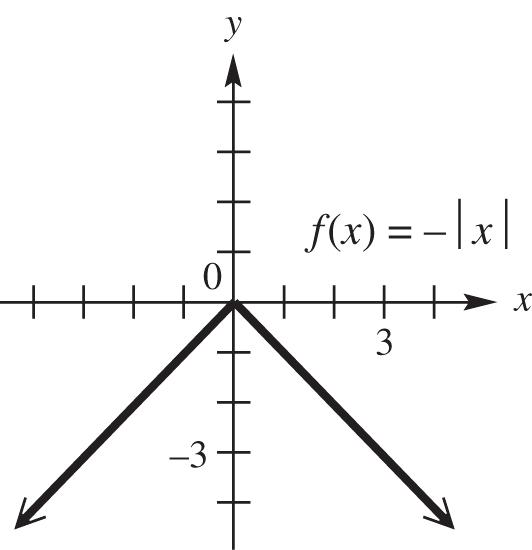
71. 2 ()13fxx
The graph of 2 ()13fxx is a translation of the graph of 2 yx to the left 1 unit, reflected over the x-axis and translated up 3 units.
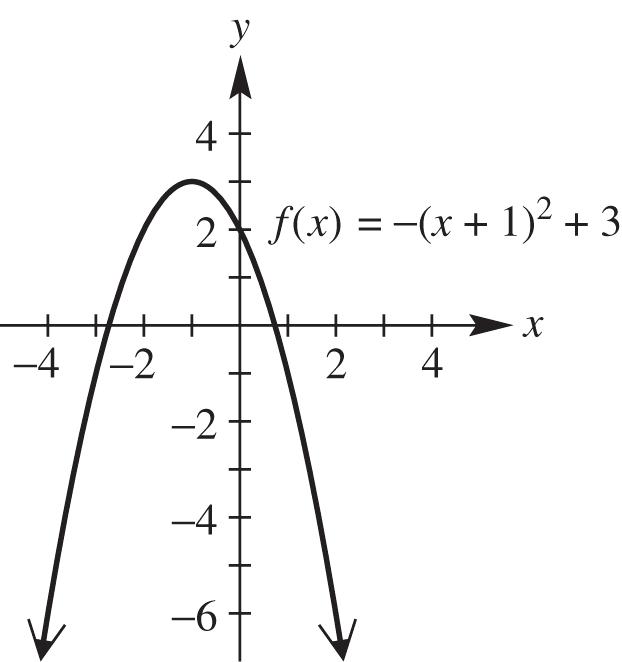
72. ()2fxx
The graph of ()2fxx is the reflection of the graph of yx about the x-axis, translated down 2 units.
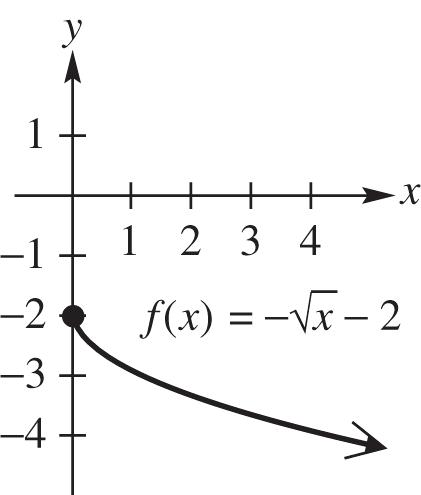
73. ()3fxx
To get y = 0, we need 031 x 34. x To get y = 1, we need 132 x 45. x
Follow this pattern to graph the step function.
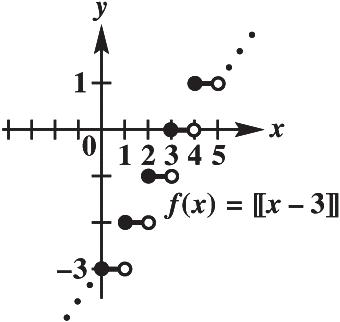
74. 3 ()212fxx
The graph of 3 ()212fxx is a translation of the graph of 3 yx to the left 1 unit, stretched vertically by a factor of 2, and translated down 2 units.
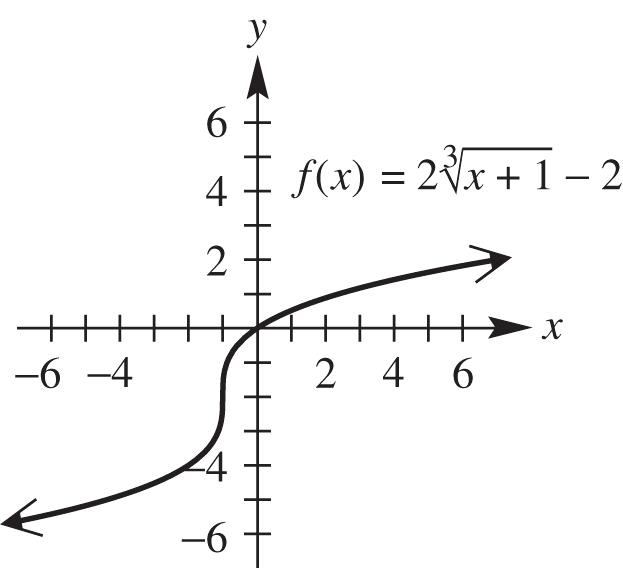
75. 42 if 1 () 35 if 1 fxxx xx
Draw the graph of y = –4x + 2 to the left of x = 1, including the endpoint at x = 1. Draw the graph of y = 3x – 5 to the right of x = 1, but do not include the endpoint at x = 1. Observe that the endpoints of the two pieces coincide.
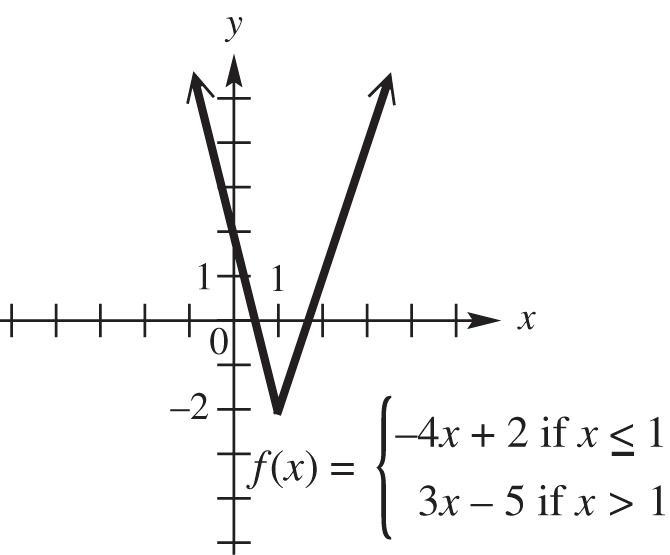
Copyright © 2017 Pearson Education, Inc.
76. 2 3 if 2 () 4 if 2 fxxx xx
Graph the curve 2 3 yx to the left of x = 2, and graph the line y = –x + 4 to the right of x = 2. The graph has an open circle at (2, 7) and a closed circle at (2, 2).
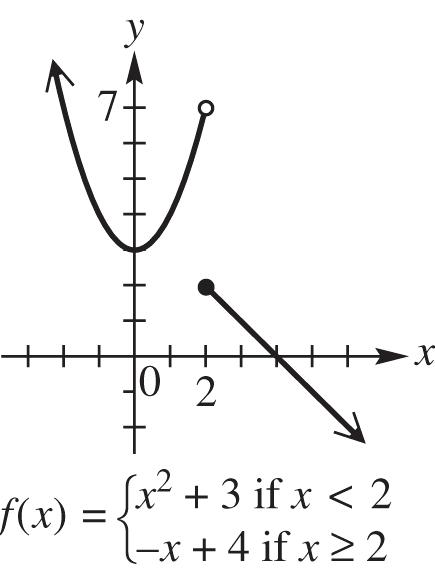
77. if 3 () 6 if 3 fxxx xx
Draw the graph of yx to the left of x = 3, but do not include the endpoint. Draw the graph of y = 6 – x to the right of x = 3, including the endpoint. Observe that the endpoints of the two pieces coincide.
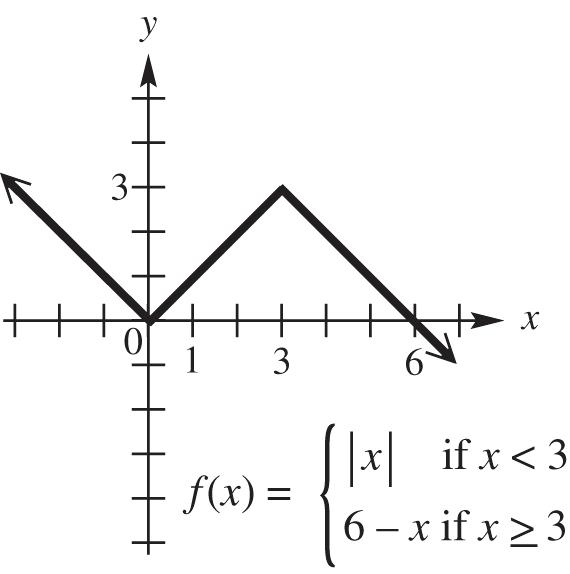
78. Because x represents an integer, .xx Therefore, 2.xxxxx
79. True. The graph of an even function is symmetric with respect to the y-axis.
80. True. The graph of a nonzero function cannot be symmetric with respect to the x-axis. Such a graph would fail the vertical line test
81. False. For example, 2 () fxx is even and (2, 4) is on the graph but (2, –4) is not.
82. True. The graph of an odd function is symmetric with respect to the origin.
83. True. The constant function 0 fx is both even and odd. Because 0,fxfx the function is even. Also
00,fxfx so the function is odd.
84. False. For example, 3 () fxx is odd, and (2, 8) is on the graph but (–2, 8) is not.
85. 2 10 xy
Replace x with –x to obtain 2 ()10. xy
The result is not the same as the original equation, so the graph is not symmetric with respect to the y-axis. Replace y with –y to obtain 22 ()1010.xyxy The result is the same as the original equation, so the graph is symmetric with respect to the x-axis. Replace x with –x and y with –y to obtain 22 ()()10()10. xyxy
The result is not the same as the original equation, so the graph is not symmetric with respect to the origin. The graph is symmetric with respect to the x-axis only.
86. 22 5530 yx
Replace x with –x to obtain 2222 55()305530. yxyx
The result is the same as the original equation, so the graph is symmetric with respect to the y-axis. Replace y with –y to obtain 2222 5()5305530. yxyx
The result is the same as the original equation, so the graph is symmetric with respect to the x-axis. The graph is symmetric with respect to the y-axis and x-axis, so it must also be symmetric with respect to the origin. Note that this equation is the same as 22 6 yx , which is a circle centered at the origin.
87. 23 xy
Replace x with –x to obtain 2323 () . xyxy The result is the same as the original equation, so the graph is symmetric with respect to the y-axis. Replace y with –y to obtain 2323 (). xyxy
The result is not the same as the original equation, so the graph is not symmetric with respect to the x-axis. Replace x with –x and y with –y to obtain 2323 ()(). xyxy
The result is not the same as the original equation, so the graph is not symmetric with respect to the origin. Therefore, the graph is symmetric with respect to the y-axis only.
Copyright © 2017 Pearson Education, Inc.
88. 3 4 yx
Replace x with –x to obtain 3 4 yx
The result is not the same as the original equation, so the graph is not symmetric with respect to the y-axis. Replace y with –y to obtain 33 ()44 yxyx 3 4 yx
The result is not the same as the original equation, so the graph is not symmetric with respect to the x-axis. Replace x with –x and y with –y to obtain 333 ()()444. yxyxyx
The result is not the same as the original equation, so the graph is not symmetric with respect to the origin. Therefore, the graph has none of the listed symmetries.
89. 64 xy
Replace x with –x to obtain 6()4 xy 64 xy . The result is not the same as the original equation, so the graph is not symmetric with respect to the y-axis. Replace y with –y to obtain 6()464 xyxy . The result is not the same as the original equation, so the graph is not symmetric with respect to the x-axis. Replace x with –x and y with –y to obtain 6()()4 xy 64 xy . This equation is not equivalent to the original one, so the graph is not symmetric with respect to the origin. Therefore, the graph has none of the listed symmetries.
90. yx
Replace x with –x to obtain (). yxyx The result is not the same as the original equation, so the graph is not symmetric with respect to the y-axis. Replace y with –y to obtain yxyx The result is the same as the original equation, so the graph is symmetric with respect to the x-axis. Replace x with –x and y with –y to obtain (). yxyx The result is not the same as the original equation, so the graph is not symmetric with respect to the origin. Therefore, the graph is symmetric with respect to the x-axis only.
91. y = 1
This is the graph of a horizontal line through (0, 1). It is symmetric with respect to the y-axis, but not symmetric with respect to the x-axis and the origin.
92. xy
Replace x with –x to obtain xyxy
The result is the same as the original equation, so the graph is symmetric with respect to the y-axis. Replace y with –y to obtain xyxy The result is the same as the original equation, so the graph is symmetric with respect to the x-axis. Because the graph is symmetric with respect to the xaxis and with respect to the y-axis, it must also by symmetric with respect to the origin.
93. 22 0 xy
Replace x with x to obtain 2 22200xyxy The result is the same as the original equation, so the graph is symmetric with respect to the y-axis. Replace y with y to obtain 2 22200. xyxy The result is the same as the original equation, so the graph is symmetric with respect to the x-axis. Because the graph is symmetric with respect to the x-axis and with respect to the y-axis, it must also by symmetric with respect to the origin.
94. 2 2 24 xy
Replace x with x to obtain
22 2 2 2424.xyxy
The result is the same as the original equation, so the graph is symmetric with respect to the y-axis. Replace y with y to obtain
2 2 24. xy The result is not the same as the original equation, so the graph is not symmetric with respect to the x-axis. Replace x with –x and y with –y to obtain
22 2 2 2424,xyxy which is not equivalent to the original equation. Therefore, the graph is not symmetric with respect to the origin.
95. To obtain the graph of () gxx , reflect the graph of () fxx across the x-axis.
96. To obtain the graph of ()2hxx , translate the graph of () fxx down 2 units.
97. To obtain the graph of ()24kxx , translate the graph of () fxx to the right 4 units and stretch vertically by a factor of 2.
98. If the graph of ()34fxx is reflected about the x-axis, we obtain a graph whose equation is (34)34.yxx
99. If the graph of ()34fxx is reflected about the y-axis, we obtain a graph whose equation is ()3()434.yfxxx
100. If the graph of ()34fxx is reflected about the origin, every point (x, y) will be replaced by the point (–x, –y). The equation for the graph will change from 34yx to 3()4yx 34yx 34.yx
101. (a) To graph ()3,yfx translate the graph of y = f (x), 3 units up.
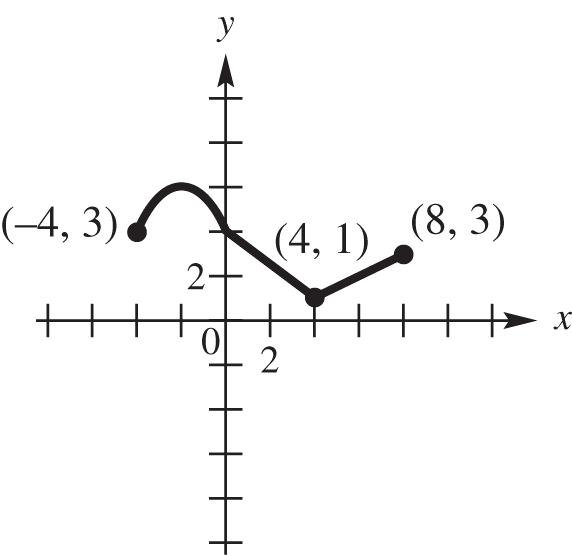
(b) To graph (2),yfx translate the graph of y = f (x), 2 units to the right.
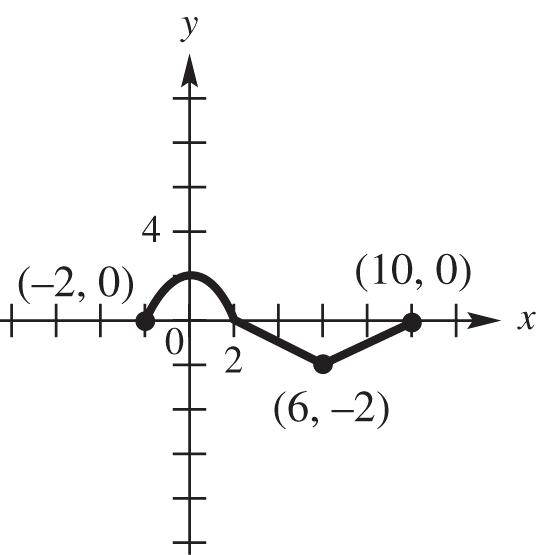
(c) To graph (3)2,yfx translate the graph of y = f (x), 3 units to the left and 2 units down.
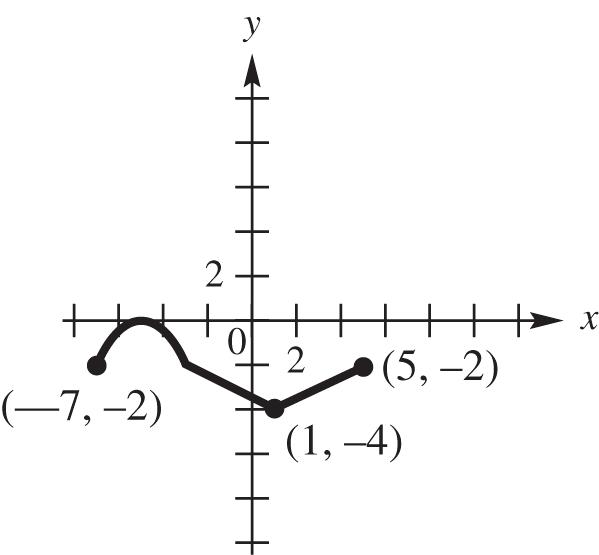
(d) To graph ()yfx , keep the graph of y = f (x) as it is where 0 y and reflect the graph about the x-axis where y < 0.
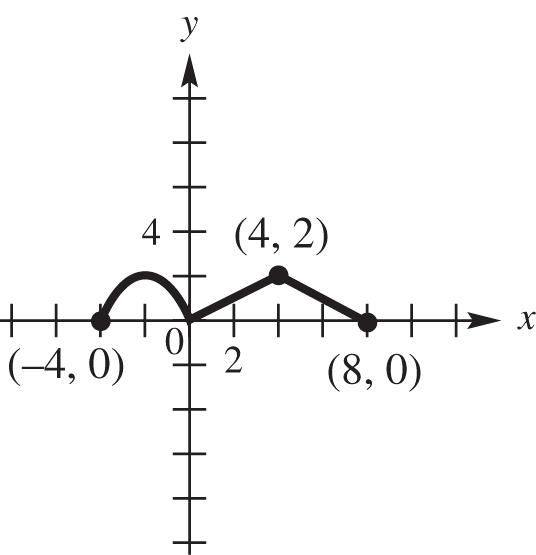
102. No. For example suppose 2 fxx and 2.gxx Then ()()(())(2)22 fgxfgxfxx
The domain and range of g are (,) , however, the domain of f is [2,) . So, 2201 xx . Therefore, the domain of fg is 1, . The domain of g, (,), is not a subset of the domain of ,1,. fg
For Exercises 103–110, 2 ()34fxx=− and 2 ()34.gxxx=−−
103. 22 4322 432 ()()()() (34)(34) 391241216 39161216 fgxfxgx xxx xxxxx xxxx
fgfg
104. 22 ()(4)(4)(4) (344)(4344) (3164)(16344) (484)(16124) 44044
fgfg
105. 22 ()(4)(4)(4) [3(4)4][(4)3(4)4] [3(16)4][163(4)4] [484][16124] 442468
106. 22 22 22 2 ()(2)(2)(2) [3(2)4][(2)3(2)4] [3(4)4][43(2)4] (124)(464) 1668 fgkfkgk kkk kkk kkk kk
Copyright © 2017 Pearson Education,
107. 2 2 (3)334394 (3) (3)9334 3334 2742323 99444
108.
(1)
109. The domain of (fg)(x) is the intersection of the domain of f (x) and the domain of g(x). Both have domain
,, so the domain of (fg)(x) is
110. 22 2 3434 () (1)(4) 34 fxx x gxx xx
Because both fx and
gx have domain
,, we are concerned about values of x that make
0. gx Thus, the expression is undefined if (x + 1)(x – 4) = 0, that is, if x = –1 or x = 4. Thus, the domain is the set of all real numbers except x = –1 and x = 4, or (–,–1)(–1,4)(4,).
111. 29fxx
()2()9229 fxhxhxh
Thus, ()()2 2. fxhfxh hh
()()(229)(29) 229292 fxhfxxhx xhxh
112. 2 ()53 fxxx 2 22 ()()5()3 2553 fxhxhxh xxhhxh
222 222 2 ()() (2553)(53) 255353 25 fxhfx xxhhxhxx xxhhxhxx xhhh
2 ()()25 (25) 25 fxhfxxhhh hh hxh xh h
For Exercises 113–118, 2 ()2 and ().fxxgxx 113.
2 ()()[()]2 22 gfxgfxgx xx
114. 22 ()()[()]()2 fgxfgxfxx
2, so33211.fxxf
Therefore,
331gfgfg
2 11.
116.
2 2 , so 6636. gxxg Therefore,
36234
6636fgfgf
.
11123gfgfgg
Because 3 is not a real number,
1 gf is not defined.
118. To find the domain of , fg we must consider the domain of g as well as the composed function, . fg Because
2 2 fgxfgxx
we need to determine when 2 20. x
Step1: Find the values of x that satisfy 2 20. x 2 22xx
Step2: The two numbers divide a number line into three regions.
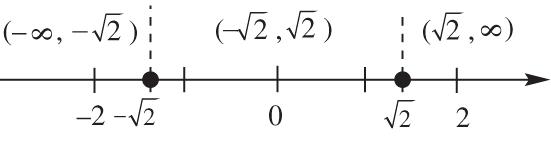
Step3 Choose a test value to see if it satisfies the inequality, 2 20. x
Interval Test Value Is 2 20 x true or false? ,2 2 2 220?
20 True 2,2 0 2 020?
20 False 2, 2 2 220?
The domain of fg is
,22,.
20 True
119.
111718fgfg
120. ()(3)(3)(3)990 fgfg
121.
()(1)(1)(1)326 fgfg
122. (0)5 (0)undefined (0)0 ff gg
123. ()(2)[(2)](1)2 gfgfg
124. ()(3)[(3)](2)1 fgfgf
125. ()(2)[(2)](2)1 fgfgf
126. ()(3)[(3)](4)8 gfgfg
127. Let x = number of yards. f (x) = 36x, where f ( x) is the number of inches. g(x) = 1760x, where g(x) is the number of yards. Then ()()()1760(36) gfxgfxx 63,360. x
There are 63,360x inches in x miles
128. Use the definition for the perimeter of a rectangle. P= length + width + length + width ()226 Pxxxxxx This is a linear function.
129. If 3 4 3 () Vrr and if the radius is increased by 3 inches, then the amount of volume gained is given by 4433 33 ()(3)()(3). g VrVrVrrr
130. (a) 2 Vrh If d is the diameter of its top, then h = d and 2 . rd So, 3 2 2 244 ()()(). dddVddd
(b) 2 22 Srrh
2 222 2 2 222 23 222 ()22()ddd ddd Sddd
Chapter 2 Test
1. (a) The domain of 3 fxx occurs when 0. x In interval notation, this correlates to the interval in D, 0,.
(b) The range of 3 fxx is all real numbers greater than or equal to 0. In interval notation, this correlates to the interval in D, 0,.
(c) The domain of 2 3 fxx is all real numbers. In interval notation, this correlates to the interval in C, ,.
(d) The range of 2 3 fxx is all real numbers greater than or equal to 3. In interval notation, this correlates to the interval in B, 3,.
(e) The domain of 3 3 fxx is all real numbers. In interval notation, this correlates to the interval in C,
,.
(f) The range of 3 3 fxx is all real numbers. In interval notation, this correlates to the interval in C, ,.
(g) The domain of 3 fxx is all real numbers. In interval notation, this correlates to the interval in C, ,.
(h) The range of 3 fxx is all real numbers greater than or equal to 0. In interval notation, this correlates to the interval in D, 0,.
(i) The domain of 2 xy is 0 x because when you square any value of y, the outcome will be nonnegative. In interval notation, this correlates to the interval in D, 0,.
(j) The range of 2 xy is all real numbers. In interval notation, this correlates to the interval in C, ,.
2. Consider the points 2,1 and 3,4. 413 3(2)5 m
3. We label the points A 2,1 and B 3,4. 22 22 (, )[3(2)](41) 5325934 dAB
4. The midpoint has coordinates 231415 , 2222,.
5. Use the point-slope form with 3 11 5 (,)(2,1) and . xym
11 3 5 3 5 () 1[(2)] 1(2)513(2) 55365311 35113511 yymxx yx yxyx yxyx xyxy
6. Solve 3x – 5y = –11 for y. 3 11 55 3511 5311 xy yx yx
Therefore, the linear function is 3 11 55 ().fxx
7. (a) The center is at (0, 0) and the radius is 2, so the equation of the circle is 22 4 xy
(b) The center is at (1, 4) and the radius is 1, so the equation of the circle is 22 (1)(4)1 xy
8. 22 410130xyxy
Complete the square on x and y to write the equation in standard form:
The circle has center ( 2, 5) and radius 4.
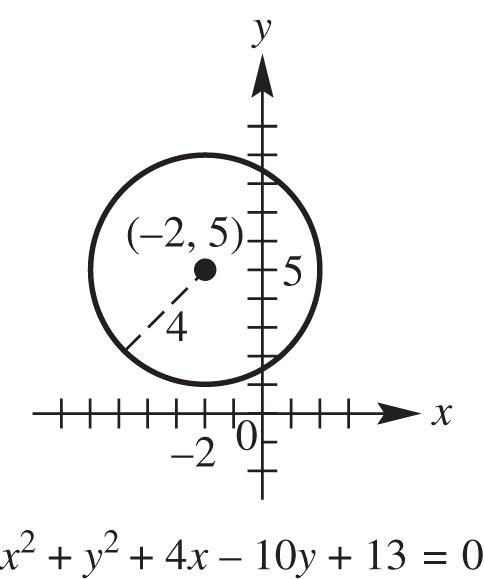
9. (a) This is not the graph of a function because some vertical lines intersect it in more than one point. The domain of the relation is [0, 4]. The range is [–4, 4].
(b) This is the graph of a function because no vertical line intersects the graph in more than one point. The domain of the function is (–,–1)(–1,). The range is (–,0)(0,). As x is getting larger on the intervals ,1 and 1,, the value of y is decreasing, so the function is decreasing on these intervals. (The function is never increasing or constant.)
10. Point A has coordinates (5, –3).
(a) The equation of a vertical line through A is x = 5.
(b) The equation of a horizontal line through A is y = –3.
11. The slope of the graph of 32yx is –3.
(a) A line parallel to the graph of 32yx has a slope of –3. Use the point-slope form with 11 (,)(2,3) and 3. xym 11() 33(2) 33639 yymxx yx yxyx
(b) A line perpendicular to the graph of 32yx has a slope of 1 3 because
12. (a)
(d)
13. To graph 21 fxx , we translate the graph of , yx 2 units to the right and 1 unit down.
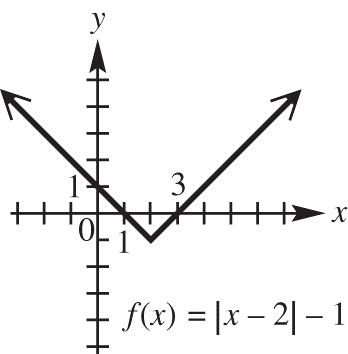
14. ()1fxx
To get y = 0, we need 011 x
10. x To get y = 1, we need 112 x 01. x Follow this pattern to graph the step function.
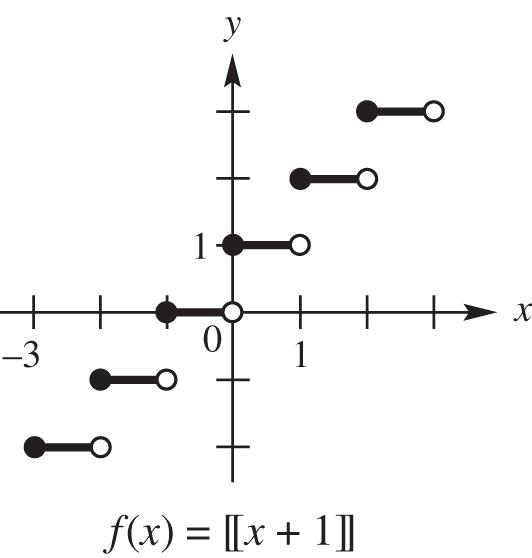
15. 1 2 3 if 2 () 2 if 2 x fxxx
For values of x with x < –2, we graph the horizontal line y = 3. For values of x with 2, x we graph the line with a slope of 1 2 and a y-intercept of (0, 2). Two points on this line are (–2, 3) and (0, 2).
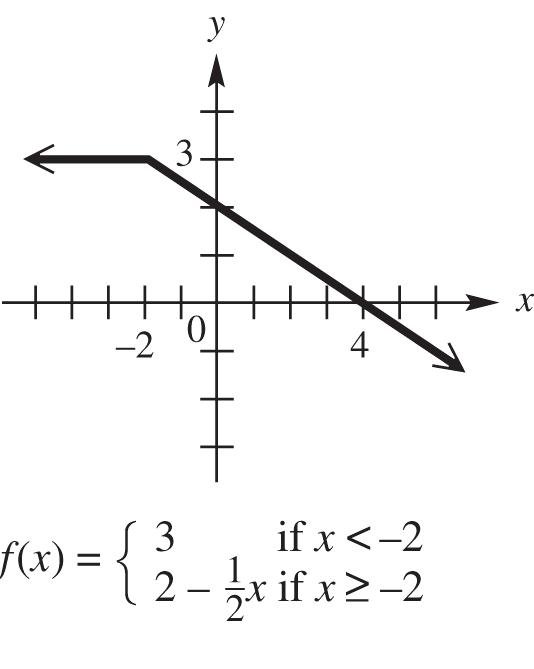
16. (a) Shift f (x), 2 units vertically upward.
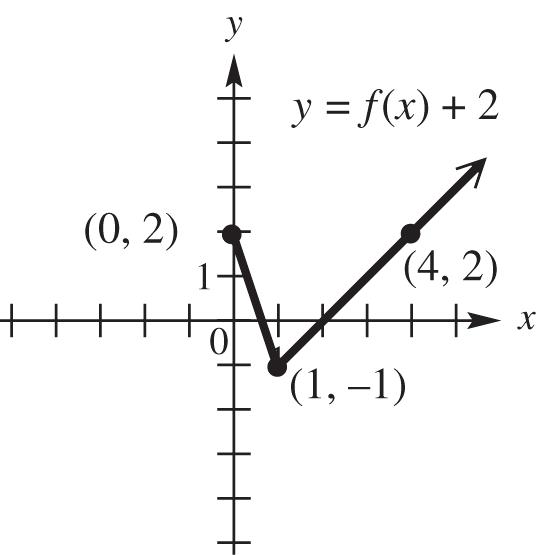
(b) Shift f (x), 2 units horizontally to the left.
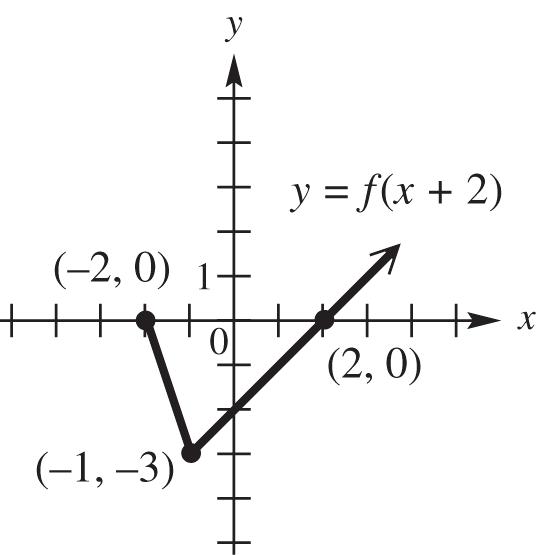
(c) Reflect f (x), across the x-axis.
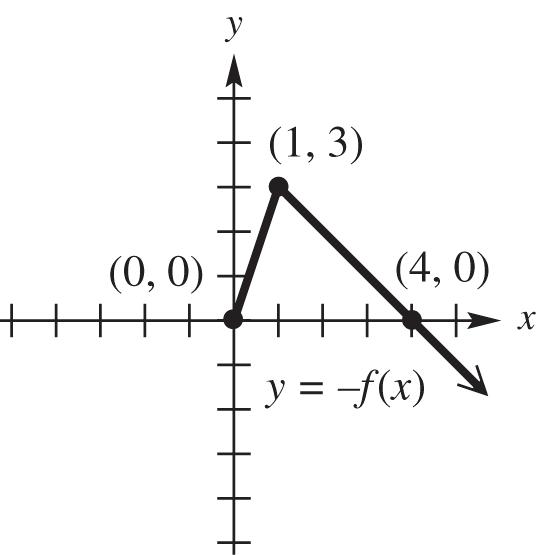
(d) Reflect f ( x), across the y-axis.
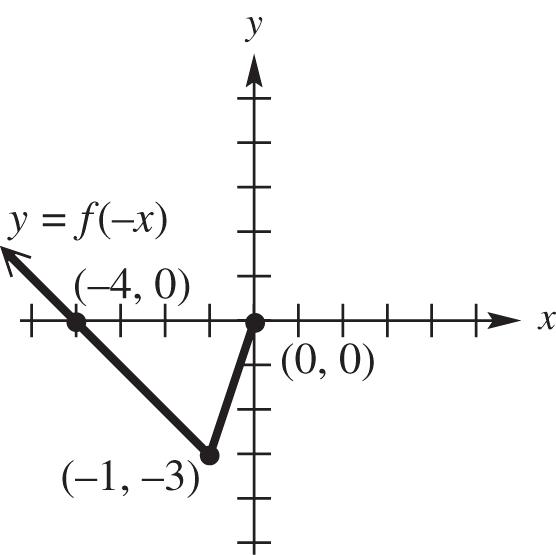
(e) Stretch f (x), vertically by a factor of 2.
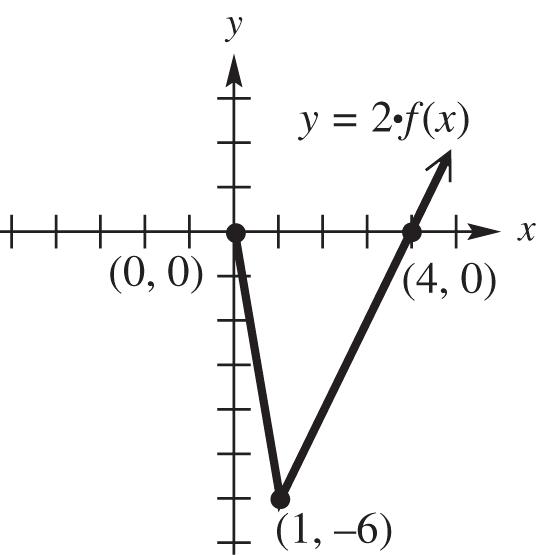
17. Starting with , yx we shift it to the left 2 units and stretch it vertically by a factor of 2. The graph is then reflected over the x-axis and then shifted down 3 units.
18. 22 323 xy
(a) Replace y with –y to obtain 2222 32()3323. xyxy
The result is the same as the original equation, so the graph is symmetric with respect to the x-axis.
(b) Replace x with –x to obtain 2222 3()23323. xyxy
The result is the same as the original equation, so the graph is symmetric with respect to the y-axis.
(c) The graph is symmetric with respect to the x-axis and with respect to the y-axis, so it must also be symmetric with respect to the origin.
19. 2 ()232, ()21fxxxgxx
(a)
2 2 2 ()()()() 23221 23221 21 fgxfxgx xxx xxx xx
(b) 2 ()232 () ()21 ffxxx x ggxx
(c) We must determine which values solve the equation 210. x 1 2 21021 xxx Thus, 1 2 is excluded from the domain, and the domain is 11 22 ,,.
(d) 2 ()232 fxxx
2 22 22 232 22332 242332 fxhxhxh xxhhxh xxhhxh
22 2 22 2 2 ()() (242332) (232) 2423 32232 423 fxhfx xxhhxh xx xxhhx hxx xhhh
2 ()()423 (423) 423 fxhfxxhhh hh hxh h xh
fgfg
(e) 2 ()(1)(1)(1) (21312)(211) (21312)(211) (232)(21) 1(1)0
(f) 2 ()(2)(2)(2) (22322)(221) (24322)(221) (862)(41) 4(3)12
210201gxxg
011. Therefore,
2 00 121312 21312 2321 fgfg f
For exercises 20 and 21, 1 fxx and
27.gxx 20.
27 (27)126 fgfgxfx xx
The domain and range of g are (,) , while the domain of f is [0,) . We need to find the values of x which fit the domain of f: 2603 xx . So, the domain of fg is [3,) .
21.
1 217 gfgfxgx x
The domain and range of g are (,) , while the domain of f is [0,) . We need to find the values of x which fit the domain of f: 101xx . So, the domain of gf is [1,) .
22. (a) C(x) = 3300 + 4.50x (b) R(x) = 10.50x (c) ()()() 10.50(33004.50) 6.003300
PxRxCx xx x
(d) ()0 6.0033000 6.003300
550 Px x x x
She must produce and sell 551 items before she earns a profit.
Chapter 2
Graphs and Functions
Section 2.1 Rectangular Coordinates and Graphs
Classroom Example 1 (page 184)
(a) (transportation, $12,153)
(b) (health care, $4917)
Classroom Example 2 (page 186)
25169194
Classroom Example 3 (page 186)
2 2 2 2 22 (,)5012 25934 (,)4032 162541 (,)4531 81485
The longest side has length 85
222 ? 344185 344185
The triangle formed by the three points is not a right triangle.
Classroom Example 4 (page 187)
The distance between (2,5) and (0,3) is 205344822
Classroom Example 5 (page 188)
(a) The coordinates of M are 7(2)5139,,4 222
(b) Let (x, y) be the coordinates of Q. Use the midpoint formula to find the coordinates:
820 22,4,4 8 4880 2 20 420812 2 xy x xx y yy
The coordinates of Q are (0, 12).
Classroom Example 6 (page 188)
The year 2011 lies halfway between 2009 and 2013, so we must find the coordinates of the midpoint of the segment that has endpoints (2009, 124.0) and (2013, 137.4)
The estimate of $130.7 billion is $0.1 billion more than the actual amount.
Classroom Example 7 (page 189)
Choose any real number for x, substitute the value in the equation and then solve for y. Note that additional answers are possible.
(a) x y = 2x + 5
1 2(1)57 y
The distance between (0,3) and (8,5) is 80536464 12882
The distance between (2,5) and (8,5) is 2855100100 200102 PQ QR PR
22 22 2 2
Because 2282102 , the points are collinear.
0 2(0)55 y
3 2(3)51 y
Three ordered pairs that are solutions are ( 1, 7), (0, 5), and (3, 1). Other answers are possible.
(b) y 3 1 xy
9 339182 x
2 332111 x
1 3 3 1100 x
0 3 3 0111 x
7 337182 x
Ordered pairs that are solutions are ( 2, 9), ( 1, 2), (0, 1), (1, 0) and (2, 7).
Other answers are possible.
(c) x 2 1 yx
2 2 (2)13 y
1 2 (1)10 y
0 2 011 y
1 2 110 y
2 2 213 y
Ordered pairs that are solutions are ( 2, 3), ( 1, 0), (0, 1), (1, 0) and (2, 3).
Other answers are possible.
Classroom Example 8 (page 190)
(a) Let y = 0 to find the x-intercept, and then let x = 0 to find the y-intercept: 5 2 025 2(0)55 xx yy
Find a third point on the graph by letting x = 1 and solving for y: 2157 y
The three points are 5 2 ,0 , (0, 5), and ( 1, 7).
Note that (3, 1) is also on the graph.
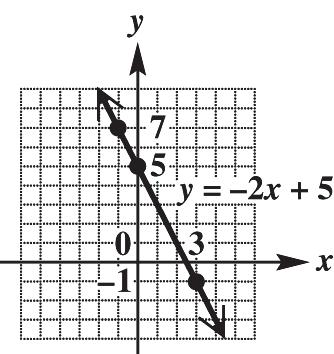
(b) Let y = 0 to find the x-intercept, and then let x = 0 to find the y-intercept: 3 3 3 0111 01011 x yyy
Find a third point by letting x = 2 and solving for y: 3 3 21217yyy
Find a fourth point by letting x = 2 and solving for y: 3 3 21219yyy
The points to be plotted are (0, 1), (1, 0), (2, 7), and ( 2, 9). Note that ( 1, 2) is also on the graph.
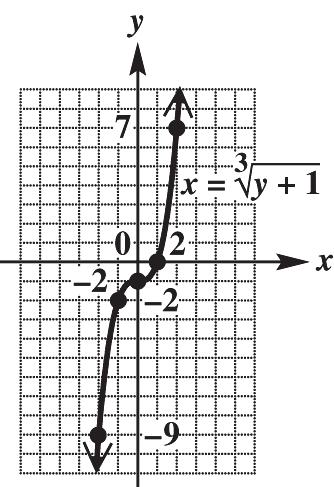
(c) Let y = 0 to find the x-intercept, and then let x = 0 to find the y-intercept: 222 2 01111 011 xxxx y
Find a third point by letting x = 2 and solving for y: 2 213 y . Find a fourth point by letting x = 2 and solving for y: 2 213 y
The points to be plotted are ( 1, 0), (1, 0), (0, 1), (2, 3), and ( 2, 3)
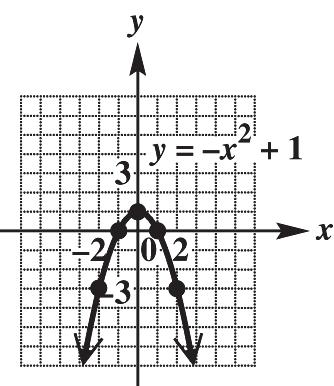
Section 2.2 Circles
Classroom Example 1 (page 195)
(a) (h, k) = (1, 2) and r = 3
22 2 2 2 2 22 123 129 xhykr xy xy
(b) (h, k) = (0, 0) and r = 2
22 2 22 2 22 002 4 xhykr xy xy
Classroom Example 2 (page 196)
(a)
This is a circle with center (1, 2) and radius 3.
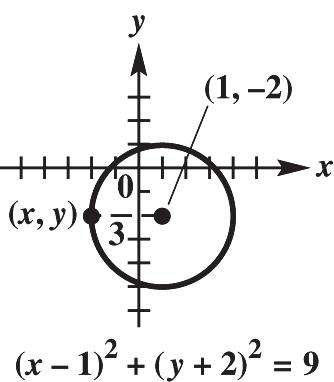
(b) 22 4 xy
This is a circle with center (0, 0) and radius 2.
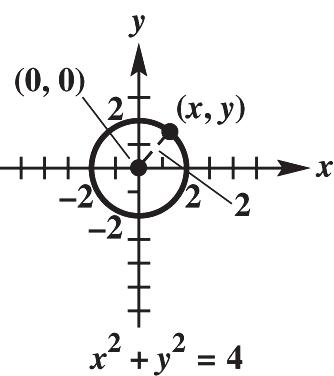
Classroom Example 3 (page 197)
Complete the square twice, once for x and once for y:
Because c = 64 and 64 > 0, the graph is a circle. The center is ( 2, 4) and the radius is 8.
Classroom Example 4 (page 198)
Group the terms, factor out 2, and then complete the square:
Factor and then divide both sides by 2: 22 22 13 2250 22 13 25 22 xy xy
and the radius is 5.
Because c = 25 and 25 > 0, the graph is a circle. The center is 13 , 22
Classroom Example 5 (page 198)
Complete the square twice, once for x and once for y:
Because c = 2 and 2 < 0, the graph is nonexistent.
Classroom Example 6 (page 199)
Determine the equation for each circle and then substitute x = 3 and y = 4.
Station A:
22 2 22 2 2 2 144 31444 44 1616 xy
Station B:
2 2 2 2 2 2 2 22 605 625 36425 3425 91625 2525 xy xy
Station C:
2 2 2 22 22 2 2 5210 52100 3542100 86100 6436100 100100 xy xy
Because ( 3, 4) satisfies all three equations, we can conclude that the epicenter is ( 3, 4).
Section 2.3 Functions
Classroom Example 1 (page 204)
4,0,3,1,3,1
M is a function because each distinct x value has exactly one y value.
2,3,3,2,4,5,5,4
N is a function because each distinct x value has exactly one y value.
4,3,0,6,2,8,4,3
P is not a function because there are two y-values for x = 4.
Classroom Example 2 (page 205)
(a) Domain: { 4, 1, 1, 3}
Range: { 2, 0, 2, 5}
The relation is a function.
(b) Domain: {1, 2, 3}
Range: {4, 5, 6, 7}
The relation is not a function because 2 maps to 5 and 6.
(c) Domain: { 3, 0, 3, 5}
Range: {5}
The relation is a function.
Classroom Example 3 (page 206)
(a) Domain: { 2, 4}; range: {0, 3}
(b) Domain: (,) ; range: (,)
(c) Domain: [ 5, 5]; range: [ 3, 3]
(d) Domain: (,) ; range: (,4]
Classroom Example 4 (page 207)
(a)
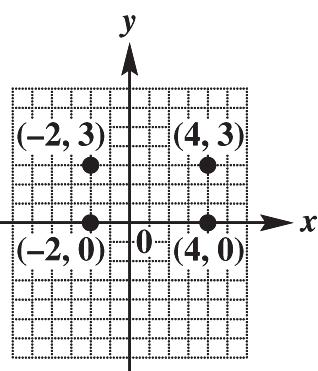
Not a function
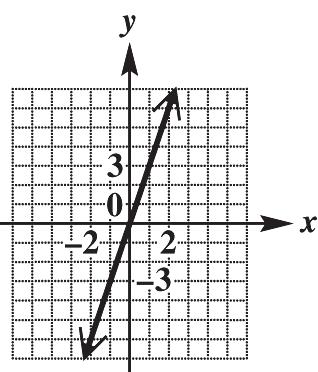
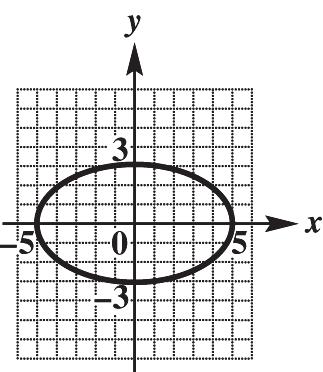
Not a function
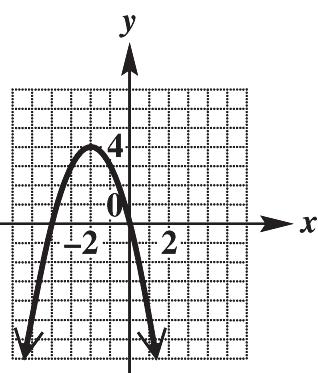
Function
Classroom Example 5 (page 208)
(a)
25yx represents a function because y is always found by multiplying x by 2 and subtracting 5. Each value of x corresponds to just one value of y. x can be any real number, so the domain is all real numbers or (,)
Because y is twice x, less 5, y also may be any real number, and so the range is also all real numbers, (,)
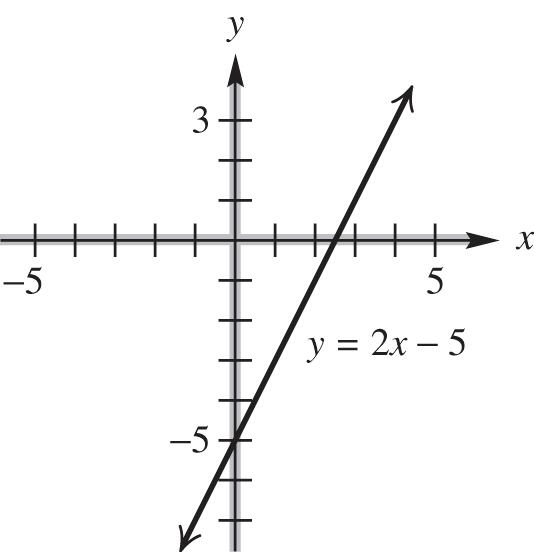
(b) For any choice of x in the domain of 2 3 yx , there is exactly one corresponding value for y, so the equation defines a function. The function is defined for all values of x, so the domain is (,) . The square of any number is always positive, so the range is [3,) .
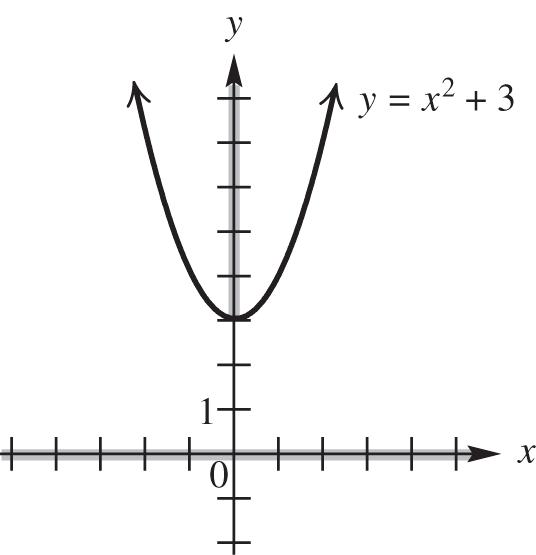
(c) For any choice of x in the domain of xy , there are two possible values for y. Thus, the equation does not define a function. The domain is [0,) while the range is (,)
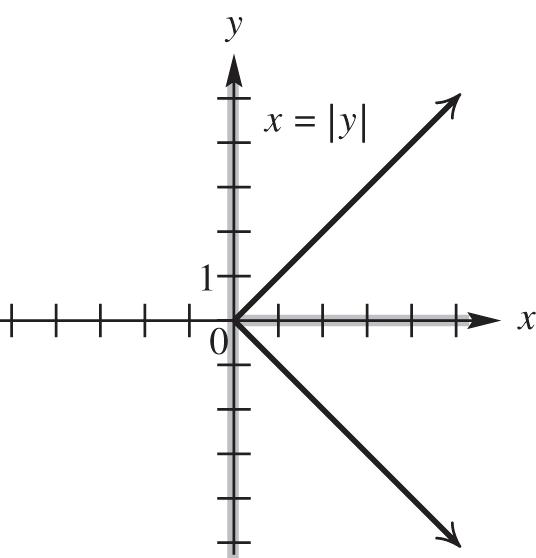
(d) By definition, y is a function of x if every value of x leads to exactly one value of y. Substituting a particular value of x, say 1, into yx corresponds to many values of y. The ordered pairs (0, 2) (1, 1) (1, 0) (3, 1) and so on, all satisfy the inequality. This does not represent a function. Any number can be used for x or for y, so the domain and range of this relation are both all real numbers, (,)
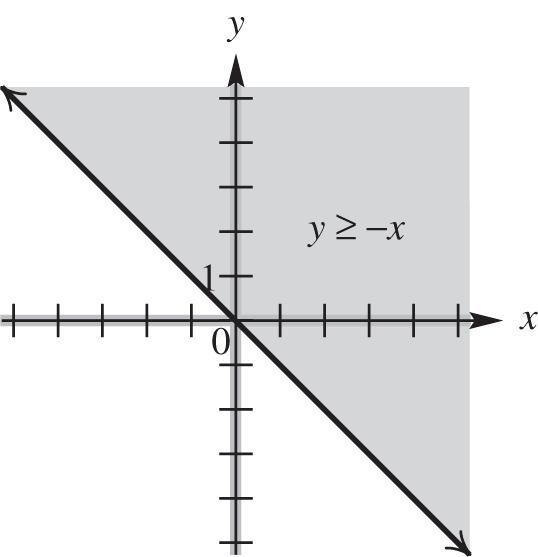
(e) For 3 2 y x , we see that y can be found by dividing x + 2 into 3. This process produces one value of y for each value of x in the domain. The domain includes all real numbers except those that make the denominator equal to zero, namely x = 2. Therefore, the domain is (,2)(2,) . Values of y can be negative or positive, but never zero. Therefore the range is (,0)(0,)
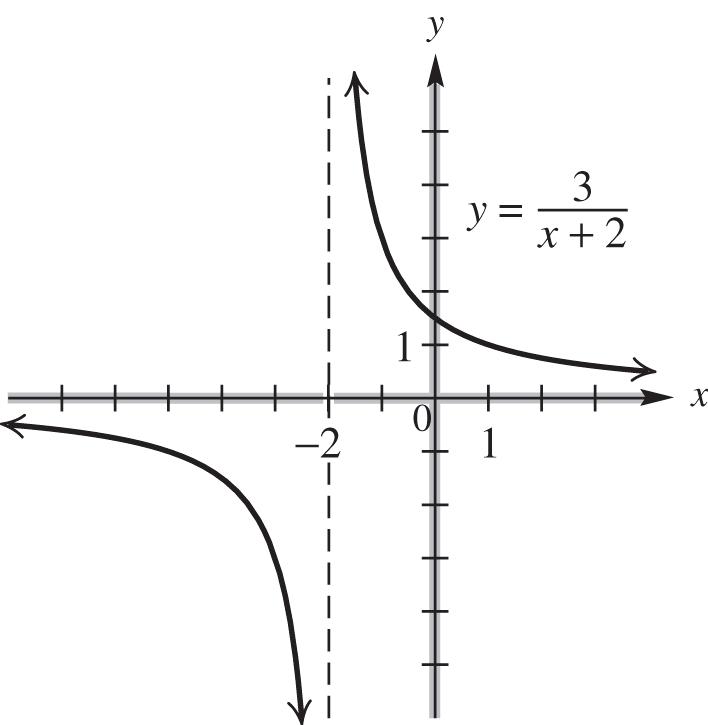
Classroom Example 6 (page 210)
(a) 2 (3)(3)6(3)413 f
(b) 2 ()64 frrr
(c) (2)3(2)137 grrr
Classroom Example 7 (page 210)
(a) 2 (1)2(1)97 f
(b) (1)6 f
(c) (1)5 f
(d) (1)0 f
Classroom Example 8 (page 211)
(a) 2 2 2 ()23 (5)(5)2(5)312 ()23 fxxx f fttt
(b) 2 2362 3 2 ()2 3 216 (5)(5)233 2 ()2 3 xyyx fxx f ftt
Classroom Example 9 (page 213)
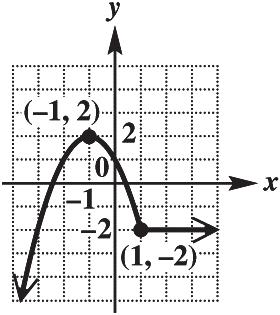
The function is increasing on (,1), decreasing on (–1, 1) and constant on (1,).
Classroom Example 10 (page 213)
The example refers to the following figure.
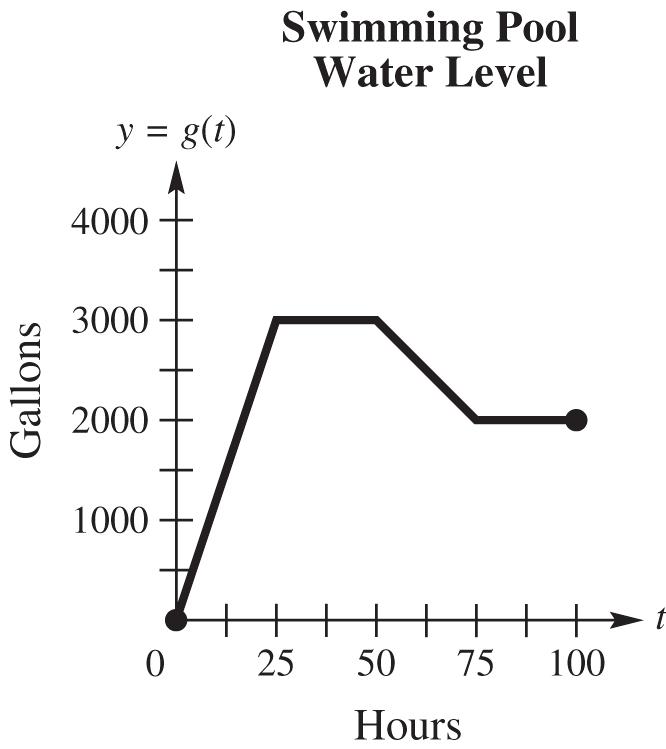
(a) The water level is changing most rapidly from 0 to 25 hours.
(b) The water level starts to decrease after 50 hours.
(c) After 75 hours, there are 2000 gallons of water in the pool.
Section 2.4 Linear Functions
Classroom Example 1 (page 220)
3 2 ()6fxx ; Use the intercepts to graph the function.
3 2 (0)066: f y-intercept
33 22 0664: xxx x-intercept
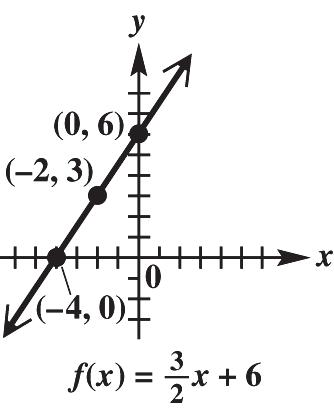
Domain: (,), range: (,)
Section 2.4 Linear Functions 25
Classroom Example 2 (page 220)
()2fx is a constant function. Its graph is a horizontal line with a y-intercept of 2.
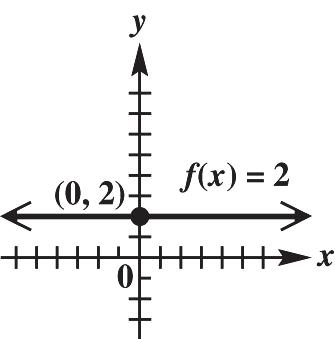
Domain: (,), range: {2}
Classroom Example 3 (page 221)
x = 5 is a vertical line intersecting the x-axis at (5, 0).
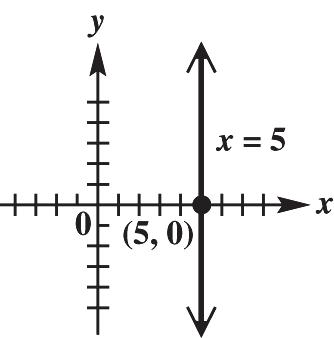
Domain:{5}, range: (,)
Classroom Example 4 (page 221)
340; xy Use the intercepts.
3040400:-intercept yyyy
3400300:-intercept xxxx
The graph has just one intercept. Choose an additional value, say 4, for x
34401240 4123 yy yy
Graph the line through (0, 0) and (4, 3).
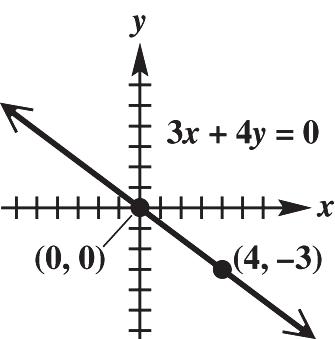
Domain: (,), range: (,)
Copyright © 2017 Pearson Education, Inc
Classroom Example 5 (page 223)
(a) 4(6)105 2242 m
(b) 880 0 5(3)8 m
(c) 101020 4(4)0 m the slope is undefined.
Classroom Example 6 (page 224)
2x 5y = 10
Solve the equation for y 2510
The slope is 2 , 5 the coefficient of x.
Classroom Example 7 (page 224)
First locate the point ( 2, 3). Because the slope is 4 3 , a change of 3 units horizontally (3 units to the right) produces a change of 4 units vertically (4 units up). This gives a second point, (1, 1), which can be used to complete the graph.
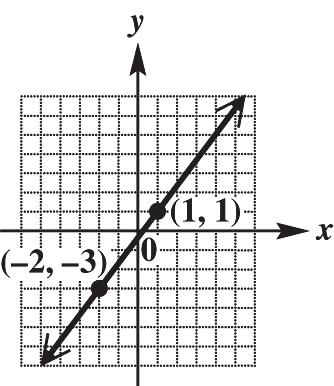
Classroom Example 8 (page 225)
The average rate of change per year is 86589547889 296.33 million 201320103
The graph confirms that the line through the ordered pairs fall from left to right, and therefore has negative slope. Thus, the amount spent by the federal government on R&D for general science decreased by an average of $296.33 million (or $296,330,000) each year from 2010 to 2013.
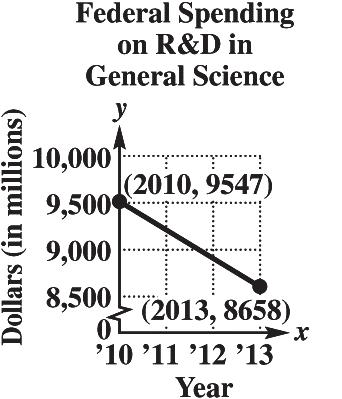
Classroom Example 9 (page 226)
(a) ()1202400Cxx (b) ()150 Rxx (c) ()()() 150(1202400) 302400 PxRxCx xx x
(d) ()0302400080 Pxxx
At least 81 items must be sold to make a profit.
Section 2.5 Equations of Lines and Linear Models
Classroom Example 1 (page 234) (5)2(3) 526 21 yx yx yx
Classroom Example 2 (page 234)
First find the slope: 3(1)4 459 m
Now use either point for 11 (,) xy : 4 9 3[(4)] 9(3)4(4) 927416 9411 4911 yx yx yx yx xy
Classroom Example 3 (page 235)
Write the equation in slope-intercept form: 3 4 341243123 xyyxyx
The slope is 3 4 , and the y-intercept is (0, 3).
Classroom Example 4 (page 236)
First find the slope: 421 222 m
Now, substitute 1 2 for m and the coordinates of one of the points (say, (2, 2)) for x and y into the slopeintercept form y = mx + b, then solve for b: 1 2 223bb . The equation is 1 2 3 yx
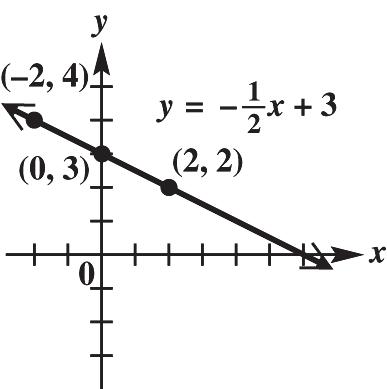
Classroom Example 5 (page 236)
The example refers to the following figure:
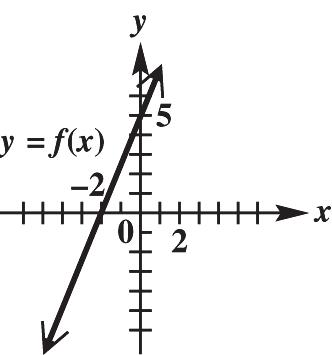
(a) The line rises 5 units each time the x-value increases by 2 units. So the slope is 5 2 . The y-intercept is (0, 5), and the x-intercept is ( 2, 0).
(b) An equation defining f is 5 2 ()5fxx
Classroom Example 6 (page 238)
(a) Rewrite the equation 325 xy in slopeintercept form to find the slope: 35 22 325xyyx The slope is 3 2
The line parallel to the equation also has slope 3 2 . An equation of the line through (2, 4) that is parallel to 325 xy is 33 22 (4)(2)43yxyx 3 2 7 yx or 3x 2y = 14.
(b) The line perpendicular to the equation has slope 2 3 . An equation of the line through (2, 4) that is perpendicular to 325 xy is 224 (4)(2)4333 yxyx 8 2 33yx or 2x +3y = 8.
Classroom Example 7 (page 240)
(a) First find the slope: 77036695 504 31 m
Now use either point for 11 (,) xy : 6695504(1) 6695504504 5046191 yx yx yx
(b) The year 2015 is represented by x = 6. 504(6)61919215 y
According to the model, average tuition and fees for 4-year colleges in 2015 will be about $9215.
Classroom Example 8 (page 242)
Write the equation as an equivalent equation with 0 on one side.
32(5)238 xxx 32(5)2380 xxx
Now graph the equation to find the x-intercept.
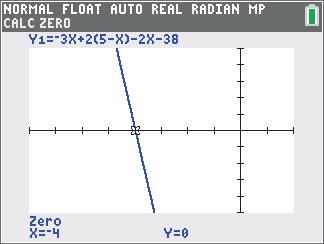
The solution set is { 4}.
Section 2.6 Graphs of Basic Functions
Classroom Example 1 (page 249)
(a) The function is continuous over (,0)(0,)
(b) The function is continuous over its entire domain (,).
Copyright © 2017 Pearson Education, Inc
Classroom Example 2 (page 252)
(a) Graph each interval of the domain separately. If x < 1, the graph of f(x) = 2x + 4 has an endpoint at (1, 6), which is not included as part of the graph. To find another point on this part of the graph, choose x = 0, so y = 4. Draw the ray starting at (1, 6) and extending through (0, 4). Graph the function for x ≥ 1, f(x) = 4 x similarly. This part of the graph has an endpoint at (1, 3), which is included as part of the graph. Find another point, say (4, 0), and draw the ray starting at (1, 3) which extends through (4, 0).
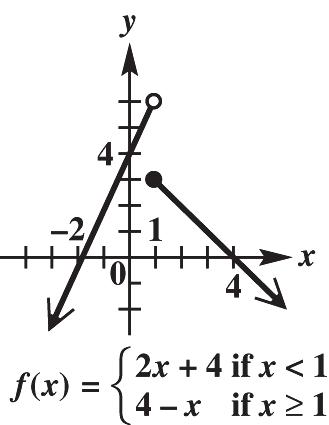
(b) Graph each interval of the domain separately. If x ≤ 0, the graph of f(x) = x 2 has an endpoint at (0, 2), which is included as part of the graph. To find another point on this part of the graph, choose x = 2, so y = 0. Draw the ray starting at (0, 2) and extending through ( 2, 0). Graph the function for x > 0, 2 ()2fxx similarly. This part of the graph has an endpoint at (0, 2), which is not included as part of the graph. Find another point, say (2, 2), and draw the curve starting at (0, 2) which extends through (2, 2). Note that the two endpoints coincide, so (0, 2) is included as part of the graph.
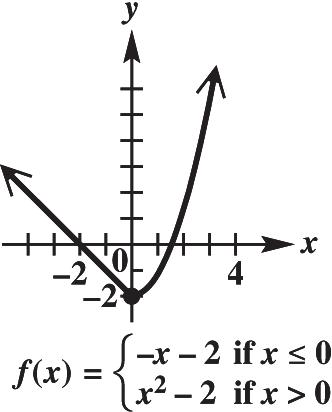
Classroom Example 3 (page 254)
Create a table of sample ordered pairs:
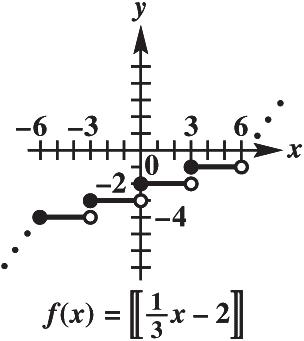
Classroom Example 4 (page 254)
For x in the interval (0, 2], y = 20. For x in (2, 3], y = 20 + 2 = 22. For x in (3, 4], y = 22 + 2 = 24. For x in (4, 5], y = 24 + 2 = 26. For x in (5, 6], y = 26 + 2 = 28.
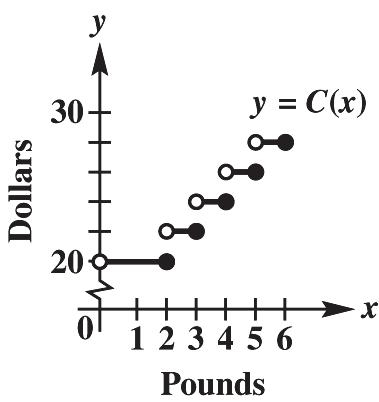
Section 2.7 Graphing Techniques
Classroom Example 1 (page 260)
Use this table of values for parts (a) (c)
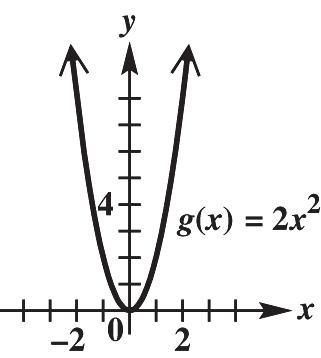
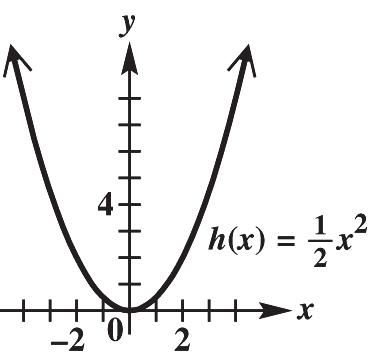
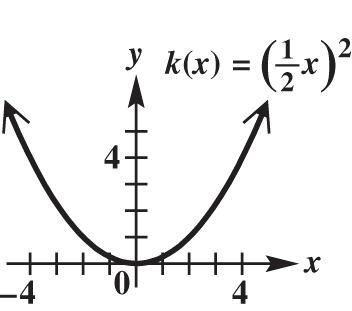
Classroom Example 2 (page 262)
Use this table of values for parts (a) and (b)
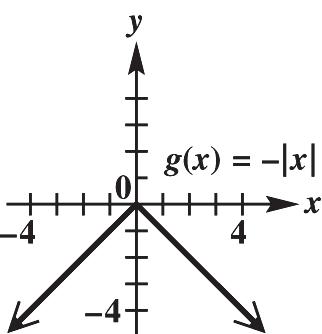
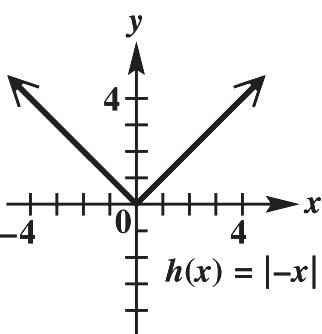
Classroom Example 3 (page 263)
(a) xy
Replace x with –x to obtain xy . The result is not the same as the original equation, so the graph is not symmetric with respect to the y-axis. Replace y with –y to obtain xyxy The result is the same as the original equation, so the graph is symmetric with respect to the xaxis. The graph is symmetric with respect to the x-axis only.
(b) 3 yx
Replace x with –x to obtain 3 yx 3 yx . The result is the same as the original equation, so the graph is symmetric with respect to the y-axis. Replace y with –y to obtain 3 yx . The result is not the same as the original equation, so the graph is not symmetric with respect to the x-axis. Therefore, the graph is symmetric with respect to the y-axis only.
(c) 26 xy
Replace x with –x to obtain 2()6 xy
26 xy . The result is not the same as the original equation, so the graph is not symmetric with respect to the y-axis. Replace y with –y to obtain 2()6 xy
26 xy . The result is not the same as the original equation, so the graph is not symmetric with respect to the x-axis. Therefore, the graph is not symmetric with respect to either axis.
(d) 22 25 xy
Replace x with –x to obtain 22 ()25 xy 22 25 xy . The result is the same as the original equation, so the graph is symmetric with respect to the y-axis. Replace y with –y to obtain 22()25xy 22 25 xy . The result is the same as the original equation, so the graph is symmetric with respect to the x-axis. Therefore, the graph is symmetric with respect to both axes. Note that the graph is a circle of radius 5, centered at the origin.
Classroom Example 4 (page 265)
(a) 3 2 yx
Replace x with –x and y with –y to obtain 333 ()2()22 yxyxyx . The result is the same as the original equation, so the graph is symmetric with respect to the origin.
(b) 2 2 yx
Replace x with –x and y with –y to obtain 222 ()2()22 yxyxyx The result is not the same as the original equation, so the graph is not symmetric with respect to the origin.
Classroom Example 5 (page 266)
(a) 53 ()23 gxxxx
Replace x with –x to obtain 53 53 53 ()()2()3() 23 (23)() gxxxx xxx xxxgx
g(x) is an odd function.
(b) 2 ()23hxx
Replace x with –x to obtain 22 ()2()323() hxxxhx h(x) is an even function.
(c) 2 ()69 kxxx
Replace x with –x to obtain 2 2 ()()6()9 69() and () kxxx xxkxkx
k(x) is neither even nor odd.
Classroom Example 6 (page 267)
Compare a table of values for 2 () gxx with 2 ()2fxx . The graph of f(x) is the same as the graph of g(x) translated 2 units up.
x 2 () gxx 2 ()2fxx
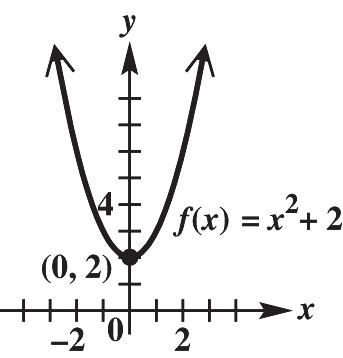
Classroom Example 7 (page 268)
Compare a table of values for 2 () gxx with 2 ()(4)fxx . The graph of f(x) is the same as the graph of g(x) translated 4 units left. x 2 () gxx 2 ()(4)fxx
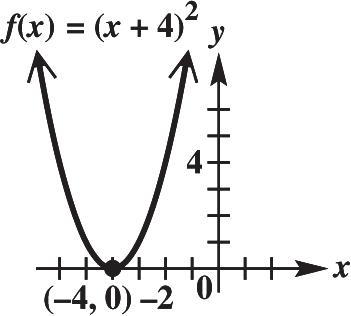
Classroom Example 8 (page 269)
(a) 2 ()(1)4fxx
This is the graph of 2 () gxx , translated one unit to the right, reflected across the x-axis, and then translated four units up.
x 2 () gxx 2 ()(1)4fxx 2 4 5
(continuedonnextpage)
continued)
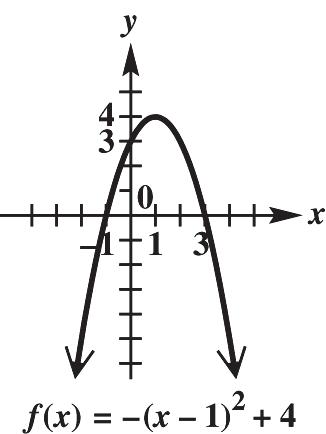
(b) ()23fxx
This is the graph of () gxx , translated three units to the left, reflected across the x-axis, and then stretched vertically by a factor of two. x () gxx ()23fxx
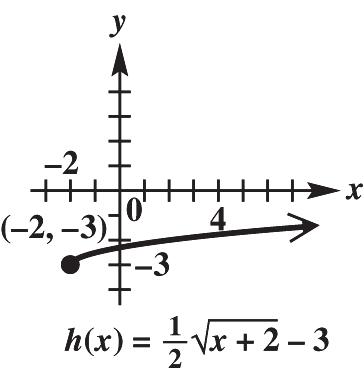
Classroom Example 9 (page 270)
The graphs in the exercises are based on the following graph.
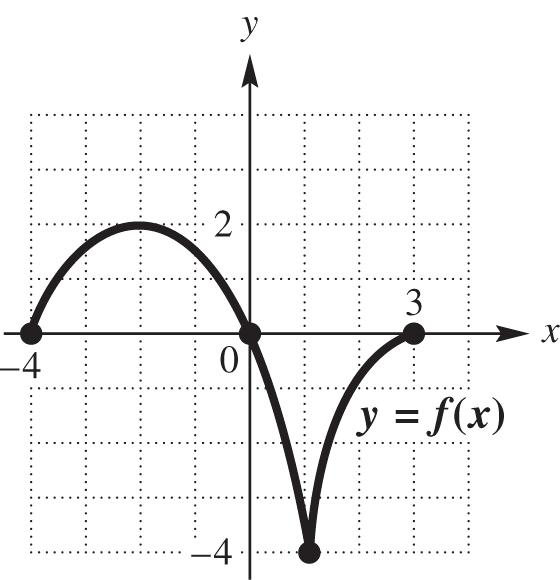
(a) ()()2gxfx
This is the graph of f(x) translated two units down.
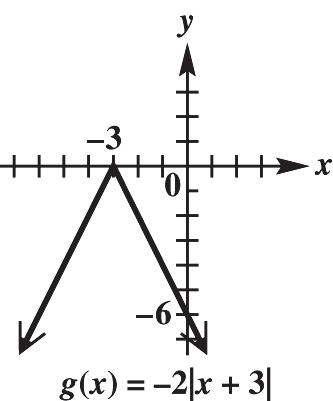
(c) 1 2 ()23hxx
This is the graph of () gxx , translated two units to the left, shrunk vertically by a factor of 2, and then translated 3 units down.
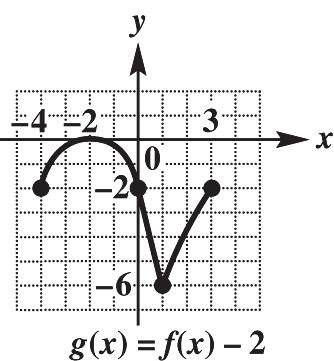
(b) ()(2)hxfx
This is the graph of f(x) translated two units right.
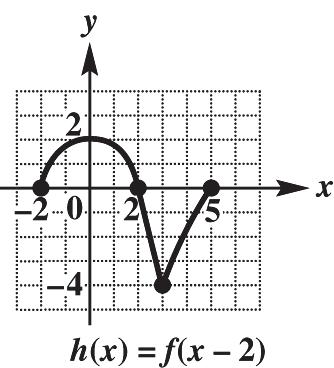
(c) ()(1)2kxfx
This is the graph of f(x) translated one unit left, and then translated two units up.
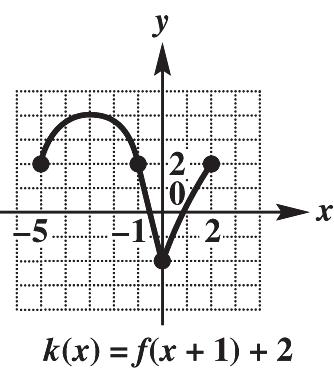
(d) ()() Fxfx
This is the graph of f(x) reflected across the y-axis.
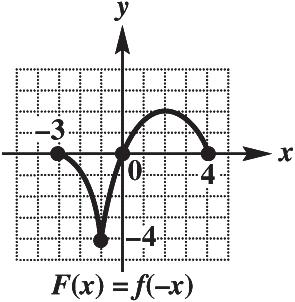
Section 2.8 Function Operations and Composition
Classroom Example 1 (page 278)
For parts (a) (d), ()34fxx and 2 ()21gxx
(a) (0)3(0)44 f and 2 (0)2(0)11 g , so ()(0)415 fg
(b) (4)3(4)48 f and 2 (4)2(4)131 g , so ()(4)83123 fg
(c) (2)3(2)410 f and 2 (2)2(2)17 g , so ()(2)(10)(7)70 fg
(d) (3)3(3)45 f and 2 (3)2(3)117 g , so 5 (3) 17 f g
Classroom Example 2 (page 279)
For parts (a) (e), 2 ()3 fxxx and ()45gxx
(a) 22 ()()(3)(45)5
(c) 2 322 32 ()()(3)(45) 451215 4715 fgxxxx xxxx xxx
(d) 2 3 () 45 fxx x gx
(e) The domains of f and g are both (,) . So, the domains of f + g, fg, and fg are the intersection of the domains of f and g, (,) . The domain of f g includes those real numbers in the intersection of the domains of f and g for which ()450gxx 5 4 x . So the domain of f g is
Classroom Example 3 (page 280)
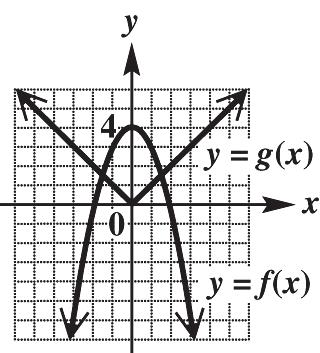
From the figure, we have f(1) = 3 and g(1) = 1, so (f + g)(1) = 3 + 1 = 4. f(0) = 4 and g(0) = 0, so (fg)(0) = 4 0 = 4.
f( 1) = 3 and g( 1) = 1, so (fg)( 1) = (3)(1) = 3
f( 2) = 0 and g( 2) = 2, so
0 2 (2)0 f g
xf(x) g(x)
From the table, we have f(1) = 1 and g(1) = 6, so (f + g)(1) = 1 + 6 = 7. f(0) = 1 and g(0) = 4, so (fg)(1) = 1 4 = 5.
f( 1) = 3 and g( 1) = 2, so (fg)( 1) = ( 3)(2) = 6
f( 2) = 5 and g( 2) = 0, so
5 0 (2) f g f g is undefined.
(c) ()34,() fxxgxx
From the formulas, we have (1)3(1)47 f and (1)11 g , so
(f + g)(1) = 7 + ( 1) = 6. (0)3(0)44 f and (0)00 g , so
(fg)(1) = 4 0 = 4. (1)3(1)41 f and (1)11 g , so (fg)( 1) =(1)( 1) = 1. (2)3(2)42 f and (2)22 g , so 2 (2)1. 2 f g
Classroom Example 4 (page 281)
Step1: Find ()fxh : 2 22 22 ()3()2()4 3(2)224 363224 fxhxhxh xxhhxh xxhhxh
Step2: Find ()() fxhfx : 222 2 ()() (363224)(324) 632 fxhfx xxhhxhxx xhhh
Step3: Find the difference quotient: 2 ()()632 632fxhfxxhhhxh hh
Classroom Example 5 (page 283)
For parts (a) and (b), ()4fxx and 2 ()gx x
(a) First find g(2): 2 (2)1 2 g . Now find ()(2)((2))(1)145 fgfgf
(b) First find f(5): (5)5493 f . Now find 2 3 ()(5)((5))(3) gfgfg
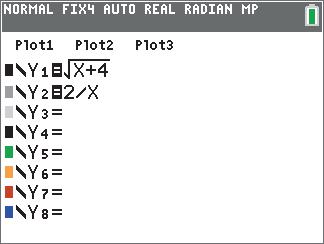
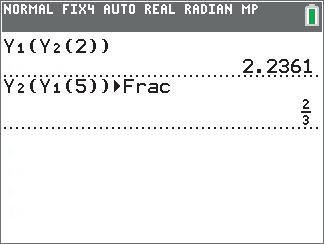
The screens show how a graphing calculator evaluates the expressions in this classroom example.
Classroom Example 6 (page 283)
For parts (a) and (b), ()1fxx and ()25gxx
(a) ()()(())(25)124 fgxfgxxx
The domain and range of g are both (,)
However, the domain of f is [1,) . Therefore, ()gx must be greater than or equal to 1: 2512 xx . So, the domain of fg is [2,) .
(b) ()()(())215 gfxgfxx
The domain of f is [1,) , while the range of f is [0,) . The domain of g is (,) . Therefore, the domain of () gf is restricted to that portion of the domain of g that intersects with the domain of f, that is [1,)
Classroom Example 7 (page 284)
For parts (a) and (b), 5 () 4 fx x and 2 ()gx x
(a) 55 ()()(()) 2424 fgxfgxx xx
The domain and range of g are both all real numbers except 0. The domain of f is all real numbers except 4. Therefore, the expression for ()gx cannot equal 4. So, 21 4 2 x x . So, the domain of fg is the set of all real numbers except for 1 2 , and 0. This is written 11 22 ,,00,
Copyright © 2017 Pearson Education, Inc
(b) 228 ()()(()) 5(4)5 gfxgfxx x
The domain of f is all real numbers except 4, while the range of f is all real numbers except 0. The domain and range of g are both all real numbers except 0, which is not in the range of f. So, the domain of gf is the set of all real numbers except for 4. This is written
Classroom Example 8 (page 285)
()25fxx and 2 ()3 gxxx 2 2 2 22 2
()()(3)2(3)5 625 gfxgxxx xxx xx fgxfxxxx
()()(25)3(25)(25) 3(42025)25 125870
In general, 22 125870625, xxxx so
()()()() gfxfgx .
Classroom Example 9 (page 286)
2 ()()4(32)5(32)8 fgxxx
Answers may vary. Sample answer: 2 ()458 fxxx and ()32gxx


