CLICK HERE TO ACCESS THE COMPLETE Test Bank
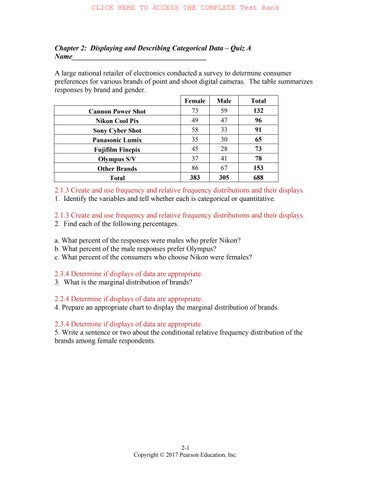
Chapter 2: Displaying and Describing Categorical Data – Quiz A Name_____________________________________ A large national retailer of electronics conducted a survey to determine consumer preferences for various brands of point and shoot digital cameras. The table summarizes responses by brand and gender. Cannon Power Shot Nikon Cool Pix Sony Cyber Shot Panasonic Lumix Fujifilm Finepix Olympus S/V Other Brands Total
Female 73 49 58 35 45 37 86 383
Male 59 47 33 30 28 41 67 305
Total 132 96 91 65 73 78 153 688
2.1.3 Create and use frequency and relative frequency distributions and their displays. 1. Identify the variables and tell whether each is categorical or quantitative. 2.1.3 Create and use frequency and relative frequency distributions and their displays. 2. Find each of the following percentages. a. What percent of the responses were males who prefer Nikon? b. What percent of the male responses prefer Olympus? c. What percent of the consumers who choose Nikon were females? 2.3.4 Determine if displays of data are appropriate. 3. What is the marginal distribution of brands? 2.2.4 Determine if displays of data are appropriate. 4. Prepare an appropriate chart to display the marginal distribution of brands. 2.3.4 Determine if displays of data are appropriate. 5. Write a sentence or two about the conditional relative frequency distribution of the brands among female respondents.
2-1 Copyright © 2017 Pearson Education, Inc.