Introduction
1. [Fall2008]
Foreachdatasetgivenbelow,givespecificexamplesofclassification, clustering,associationrulemining,andanomalydetectiontasksthat canbeperformedonthedata.Foreachtask,statehowthedatamatrix shouldbeconstructed(i.e.,specifytherowsandcolumnsofthematrix).
(a) AmbulatoryMedicalCaredata1,whichcontainsthedemographic andmedicalvisitinformationforeachpatient(e.g.,gender,age, durationofvisit,physician’sdiagnosis,symptoms,medication,etc).
Answer:
Classification
Task:Diagnosewhetherapatienthasadisease.
Row:Patient
Column:Patient’sdemographicandhospitalvisitinformation(e.g.,symptoms),alongwith aclassattributethatindicateswhetherthepatienthasthedisease.
Clustering
Task:Findgroupsofpatientswithsimilarmedicalconditions
Row:Apatientvisit
Column:Listofmedicalconditionsofeachpatient
Associationrulemining
Task:Identifythesymptomsandmedicalconditionsthatco-occurtogetherfrequently
Row:Apatientvisit
Column:Listofsymptomsanddiagnosedmedicalconditionsofthepatient
Anomalydetection
Task:Identifyhealthylookingpatientswithraremedicaldisorders
Row:Apatientvisit
Column:Listofdemographicattributes,symptoms,andmedicaltestresultsofthepatient
1Seeforexample,theNationalHospitalAmbulatoryMedicalCareSurvey http://www. cdc.gov/nchs/about/major/ahcd/ahcd1.htm
(b) Stockmarketdata,whichincludethepricesandvolumesofvarious stocksondifferenttradingdays.
Answer:
Classification
Task:Predictwhetherthestockpricewillgoupordownthenexttradingday
Row:Atradingday
Column:Tradingvolumeandclosingpriceofthestocktheprevious5daysandaclass attributethatindicateswhetherthestockwentupordown
Clustering
Task:Identifygroupsofstockswithsimilarpricefluctuations
Row:Acompany’sstock
Column:Changesinthedailyclosingpriceofthestockoverthepasttenyears
Associationrulemining
Task:Identifystockswithsimilarfluctuationpatterns(e.g., {Google-Up,Yahoo-Up})
Row:Atradingday
Column:Listofallstock-upandstock-downeventsonthegivenday.
Anomalydetection
Task:Identifyunusualtradingdaysforagivenstock(e.g.,unusuallyhighvolume)
Row:Atradingday
Column:Tradingvolume,changeindailystockprice(dailyhigh lowprices),andaverage pricechangeofitscompetitorstocks
(c) DatabaseofMajorLeagueBaseball(MLB).
Classification
Task:PredictthewinnerofagamebetweentwoMLBteams.
Row:Agame.
Column:Statisticsofthehomeandvisitingteamsovertheirpast10gamestheyhadplayed (e.g.,averagewinningpercentageandhittingpercentageoftheirplayers)
Clustering
Task:Identifygroupsofplayerswithsimilarstatistics
Row:Aplayer
Column:Statisticsoftheplayer
Associationrulemining
Task:Identifyinterestingplayerstatistics(e.g.,40%ofright-handedplayershaveabatting percentagebelow20%whenfacingleft-handedpitchers)
Row:Aplayer
Column:Discretizedstatisticsoftheplayer
Anomalydetection
Task:Identifyplayerswhoperformedconsiderablybetterthanexpectedinagivenseason
Row:A(player,season)paire.g,(player1in2007)
Column:Ratiostatisticsofaplayer(e.g.,ratioofaveragebattingpercentagein2007to careeraveragebattingpercentage)
Data
2.1TypesofAttributes
1. Classifythefollowingattributesasbinary,discrete,orcontinuous.Also classifythemasqualitative(nominalorordinal)orquantitative(interval orratio).Somecasesmayhavemorethanoneinterpretation,sobriefly indicateyourreasoningifyouthinktheremaybesomeambiguity.
(a) Numberofcoursesregisteredbyastudentinagivensemester.
Answer: Discrete,quantitative,ratio.
(b) Speedofacar(inmilesperhour).
Answer: Discrete,quantitative,ratio.
(c) Decibelasameasureofsoundintensity.
Answer: Continuous,quantitative,intervalorratio.Itisactually alogratiotype(whichissomewherebetweenintervalandratio).
(d) HurricaneintensityaccordingtotheSaffir-SimpsonHurricaneScale.
Answer: Discrete,qualitative,ordinal.
(e) Socialsecuritynumber.
Answer: Discrete,qualitative,nominal.
2. Classifythefollowingattributesas:
• discreteorcontinuous.
• qualitativeorquantitative
• nominal,ordinal,interval,orratio
Somecasesmayhavemorethanoneinterpretation,sobrieflyindicate yourreasoningifyouthinktheremaybesomeambiguity.
(a) JulianDate,whichisthenumberofdayselapsedsince12noon GreenwichMeanTimeofJanuary1,4713BC.
Answer: Continuous,quantitative,interval
(b) Movieratingsprovidedbyusers(1-star,2-star,3-star,or4-star).
Answer: Discrete,qualitative,ordinal
(c) Moodlevelofablogger(cheerful,calm,relaxed,bored,sad,angry orfrustrated).
Answer: Discrete,qualitative,nominal
(d) AveragenumberofhoursauserspentontheInternetinaweek.
Answer: Continuous,quantitative,ratio
(e) IPaddressofamachine.
Answer: Discrete,qualitative,nominal (f) Richterscale(intermsofenergyreleaseduringanearthquake).
Answer: Continuous,qualitative,ordinal Intermsofenergyrelease,thedifferencebetween0.0and1.0isnot thesameasbetween1.0and2.0.Ordinalattributesarequalitative; yet,canbecontinuous.
(g) Salaryabovethemediansalaryofallemployeesinanorganization.
Answer: Continuous,quantitative,interval
(h) Undergraduatelevel(freshman,sophomore,junior,andsenior)for measuringyearsincollege.
Answer: Discrete,qualitative,ordinal
3. Foreachattributegiven,classifyitstypeas:
• discreteorcontinuousAND
• qualitativeorquantitativeAND
• nominal,ordinal,interval,orratio
Indicateyourreasoningifyouthinktheremaybesomeambiguityin somecases.
Example: Ageinyears.
Answer: Discrete,quantitative,ratio.
2.1 TypesofAttributes 5
(a) DailyusertrafficvolumeatYouTube.com(i.e.,numberofdaily visitorswhovisitedtheWebsite).
Answer: Discrete,quantitative,ratio.
(b) Airpressureofacar/bicycletire(inpsi).
Answer: Continuous,quantitative,ratio.
(c) HomelandSecurityAdvisorySystemratings-codered/orange/etc.
Answer: Discrete,qualitative,ordinal.
(d) Amountofseismicenergyrelease,measuredinRichterscale.
Answer: Continuous,qualitative,ordinal.
(e) Creditcardnumber.
Answer: Discrete,qualitative,nominal.
(f) Thewealthofanationmeasuredintermsofgrossdomesticproduct (GDP)percapitaabovetheworld’saverageof$10,500.
Answer: Continuous,quantitative,interval.
4. Foreachattributegiven,classifyitstypeas:
• discreteorcontinuousAND
• qualitativeorquantitativeAND
• nominal,ordinal,interval,orratio
Indicateyourreasoningifyouthinktheremaybesomeambiguityin somecases.
Example: Ageinyears.
Answer: Discrete,quantitative,ratio.
(a) Favoritemovieofeachperson.
Answer: Discrete,qualitative,nominal
(b) NumberofdayssinceJan1,2011.
Answer: Discrete,quantitative,interval.
(c) Categoryofahurricane(TheSaffir-SimpsonHurricaneWindScale rangesfromcategory1tocategory5).
Answer: Discrete,qualitative,ordinal.
(d) Numberofstudentsenrolledinaclass.
Answer: Discrete,quantitative,ratio
5. Foreachattributegiven,classifyitstypeas:
• discreteorcontinuousAND
• qualitativeorquantitativeAND
• nominal,ordinal,interval,orratio
Indicateyourreasoningifyouthinktheremaybesomeambiguityin somecases.
Example: TemperatureinKelvin
Answer: Continuous,quantitative,ratio.
(a) Numberofyearssince1BC.Forexample,2BCisyear-1,1BCis year0,1ADisyear1,and2013ADisyear2013(note,thereisno 0ADinGregoriancalendar).
Answer: Discrete/Continuous,quantitative,interval.
(b) GPAofastudent.
Answer: Continuous,qualitative,ordinal.
(c) Moodlevelofablogger(cheerful,calm,relaxed,bored,sad,angry orfrustrated).
Answer: Discrete,qualitative,nominal.
(d) Soundintensityindecibelscale.
Answer: Continuous,qualitative,ordinal.Intermsofsoundintensity,thedifferencebetween0dBand1dBisnotthesameasthe differencebetween10dBand11dB(decibelsareinlogscale);thus, itisnotanintervalattribute.
6. Statethetypeofeachattributegivenbelowbeforeandafterwehave performedthefollowingtransformation.
(a) Haircolorofapersonismappedtothefollowingvalues:black= 0,brown=1,red=2,blonde=3,grey=4,white=5. Answer: Nominal(bothbeforeandaftertransformation).
(b) Gradeofastudent(from0to100)ismappedtothefollowingscale: A=4.0,A-=3.5,B=3.0,B-=2.5,C=2.0,C-=1.5,D=1.0, D-=0.5,E=0.0
Answer: Ratio(beforetransformation)toordinal(aftertransformation).
2.1 TypesofAttributes 7
(c) Ageofapersonisdiscretizedtothefollowingscale:Age < 12,12 ≤ Age < 21,21 ≤ Age < 45,45 ≤ Age < 65,Age > 65.
Answer: Ratio(beforetransformation)toordinal(aftertransformation)
(d) Annualincomeofapersonisdiscretizedtothefollowingscale:Income < $20K,$20K ≤ Income < $60K,$60K ≤ Income < $120K, $120K ≤ Age < $250K,Age ≥ $250K.
Answer: Ratio(beforetransformation)toordinal(aftertransformation).
(e) Heightofapersonischangedfrommeterstofeet.
Answer: Ratio(bothbeforeandaftertransformation)
(f) Heightofapersonischangedfrommetersto {Short,Medium,Tall}.
Answer: Ratio(beforetransformation)toordinal(aftertransformation).
(g) Heightofapersonischangedfromfeettonumberofinchesabove 4feet.
Answer: Ratio(beforetransformation)tointerval(aftertransformation).
(h) Weightofapersonisstandardizedbysubtractingitwiththemean oftheweightforallpeopleanddividingbyitsstandarddeviation.
Answer: Ratio(beforetransformation)tointerval(aftertransformation)
7. Statewhetheritismeaningful(basedonthepropertiesoftheattribute values)toapplythefollowingoperationstothedatagivenbelow
(a) Averageamplitudeofseismicwaves(inRichterscale)forthe10 deadliestearthquakesinAsia.
Answer: NobecauseRichterscaleisordinal.
(b) Averagenumberofcharactersinacollectionofspammessages. Answer: Yesbecausenumberofcharactersisaratioattribute.
(c) Pearson’scorrelationbetweenshirtsizeandheightofanindividual. Answer: Nobecauseshirtsizeisordinal.
(d) MedianzipcodeofhouseholdsintheUnitedStates. Answer: Nobecausezipcodeisnominal.
(e) Entropyofstudents(basedontheGPAtheyobtainedforagiven course).
Answer: Yesbecauseentropyisapplicabletonominalattributes.
(f) Geometricmeanoftemperature(inFahrenheit)foragivencity. Answer: Nobecausetemperature(inFahrenheit)isnotaratio attribute.
2.2DataPreprocessing
1. Considerthefollowingdatasetthatcontainstheageandgenderinformationfor9userswhovisitedagivenwebsite.
(a) Supposeyouapplyequalintervalwidthapproachtodiscretizethe Ageattributeinto3bins.ShowtheuserIDsassignedtoeachofthe 3bins.
Answer: Binwidth= 68 17 3 = 51 3 =17.
Bin1:1,2,3,4,5
Bin2:6,7,8
Bin3:9
(b) Repeatthepreviousquestionusingtheequalfrequencyapproach. Answer: Sincethereare9usersand3bins,everybinmustcontain 3users.
Bin1:1,2,3
Bin2:4,5,6
Bin3:7,8,9
(c) Repeatquestion(a)usingasuperviseddiscretizationapproach(with Genderasclassattribute).Specifically,choosethebinsinsucha waythattheirmembersareas“pure”aspossible(i.e.,belonging tothesameclass).
Answer:
Bin1:1,2,3,4
Bin2:5,6,7
Bin3:8,9
2. ConsideranattributeXofadatasetthattakesthevalues {x1,x2, ··· ,x9} (sortedinincreasingorderofmagnitude).Weapplytwomethods(equal intervalwidthandequalfrequency)todiscretizetheattributeinto3 bins.Thebinsobtainedareshownbelow:
EqualWidth:
EqualFrequency:
Explainwhatwillbetheeffectofapplyingthefollowingtransformations oneachdiscretizationmethod,i.e.,whethertheelementsassignedto eachbincanchangeifyoudiscretizetheattribute after applyingthe transformationfunctionbelow.Notethat X denotestheaveragevalue and σx denotesstandarddeviationofattributeX.
(a) X → X X (i.e.,iftheattributevaluesarecentered).
Answer: Nochangeforequalwidthbecausethedistancebetween xi and xi+1 isunchanged.Nochangeforequalfrequencybecause therelativeorderingofdatapointsremainthesame(i.e.,if xi < xi+1 then xi X<xi+1 X).
(b) X → X X σx (i.e.,iftheattributevaluesarestandardized).
Answer: Sincethedistancesbetweeneverypairofpoints(xi,xi+1) changeuniformly(byaconstantfactorof σx,theelementsinthe binsareunchangedforequalwidthdiscretization.Nochangefor equalfrequencybecausetherelativeorderingofdatapointsremain thesame.
(c) X → exp X X σx (i.e.,ifthevaluesarestandardizedandexponentiated).
Answer: Thebinelementsmaychangeforequalwidthbecause thedistancesbetween xi and xi+1 maynotchangeuniformly.No changeforequalfrequencybecausetherelativeorderingofdata pointsremainthesame.
3. Consideradatasetthathas3attributes(x1, x2,and x3).ThedistributionofeachattributeisasfollowsandshowninFigure
• x1 hasauniformdistributionintherangebetween0and1.
• x2 isgeneratedfromamixtureof3Gaussiandistributionscentered at0.1,0.5,and0.9,respectively.Thestandarddeviationofthe
distributionsare0.02,0.1,and0.02,respectively.Assumeeach pointisgeneratedfromoneofthe3distributionsandthenumber ofpointsassociatedwitheachdistributionisdifferent.
• x3 isgeneratedfromanexponentialdistributionwithmean0.1.
(a) Whichattribute(s)islikelytoproducethesamebinsregardlessof whetheryouuseequalwidthorequalfrequencyapproaches(assumingthenumberofbinsisnottoolarge).
Answer: x1.
(b) Whichattribute(s)ismoresuitableforequalfrequencythanequal widthdiscretizationapproaches.
Answer: x3.
(c) Whichattribute(s)isnotappropriateforbothequalwidthand equalfrequencydiscretizationapproaches.
Answer: x2
(d) Ifall3areinitiallyratioattributes,whataretheirattributetypes afterdiscretization?
Answer: Ordinal.
4. Ane-commercecompanyisinterestedinidentifyingthehighestspending customersatitsonlinestoreusingassociationrulemining.Oneofthe rulesidentifiedis:
21 ≤ Age < 45ANDNumberOfVisits > 50 → AmountSpent > $500,
wheretheAgeattributewasdiscretizedinto5bins,NumberOfVisits wasdiscretizedinto8bins,andAmountSpentwasdiscretizedinto8 bins.Theconfidenceofanassociationrule A,B → C isdefinedas
Confidence(A,B → C)= P (C|A,B)= P (A,B,C) P (A,B) (2.1)
where P (C|A,B)istheconditionalprobabilityof C given A and B, P (A,B,C)isthejointprobabilityof A, B,and C,and P (A,B)isthe jointprobabilityof A and B.Theprobabilitiesareempiricallyestimatedbasedontheirrelativefrequenciesinthedata.Forexample, P (AmountSpent > $500)isgivenbytheproportionofonlineuserswho visitedthestoreandspentmorethan$500.
2.2
(a) SupposeweincreasethenumberofbinsfortheAgeattributefrom 5to6sothatthediscretizedAgeintherulebecomes21 ≤ Age < 30insteadof21 ≤ Age < 45,willtheconfidenceoftherulebe non-increasing,non-decreasing,staysthesame,orcouldgoeither way(increase/decrease)?
Answer: Canincrease/decrease.
(b) SupposeweincreasethenumberofbinsfortheAmountSpentattributefrom8to10,sothattherighthandsideoftherulebecomes $500 < AmountSpent < $1000,willtheconfidenceoftherulebe non-increasing,non-decreasing,staysthesame,orcouldgoeither way(increase/decrease)?
Answer: Non-increasing.
(c) SupposethevaluesforNumberOfVisitsattributearedistributed accordingtoaPoissondistributionwithameanvalueequalsto4. Ifwediscretizetheattributeinto4binsusingtheequalfrequency approach,whatarethebinvaluesafterdiscretization?Hint:you needtorefertothecumulativedistributiontableforPoissondistributiontoanswerthequestion.
Answer: Choosethebinvaluessuchthatthecumulativedistributioniscloseto0.25,0.5,and0.75.Thiscorrespondstobinvalues: 0to2,3,4to5,andgreaterthan5.
5. Nullvaluesindatarecordsmayrefertomissingorinapplicablevalues. Considerthefollowingtableofemployeesforahypotheticalorganization:
Name
Salescommission Occupation
John 5000 Sales
Mary 1000 Sales
Bob null Non-sales
Lisa null Non-sales
Thenullvaluesinthetablerefertoinapplicablevaluessincesalescommissionarecalculatedforsalesemployeesonly.Supposeweareinterested tocalculatethesimilaritybetweenusersbasedontheirsalescommission.
(a) Explainwhatisthelimitationoftheapproachtocomputesimilarity ifwereplacethenullvaluesinsalescommissionby0.
Answer: MarywillbemoresimilartoBobandLisathantoJohn.
(b) Explainwhatisthelimitationoftheapproachtocomputesimilarity ifwereplacethenullvaluesinsalescommissionbytheaveragevalue ofsalescommission(i.e.,3000).
Answer: BothMaryandJohnarelesssimilartoeachotherthan toBobandLisa.
(c) Proposeamethodthatcanhandlenullvaluesinthesalescommissionsothatemployeesthathavethesameoccupationarecloserto eachotherthantoemployeesthathavedifferentoccupations.
Answer: Onewayistochangethesimilarityfunctionasfollows:
Similarity(a,b)=
, ifbothaandbarenull; 0, ifoneofaorbisnull; s(a,b), otherwise.
where s(a,b)istheoriginalsimilaritymeasureusedforthesales commission.
6. ConsideradatasetfromanonlinesocialmediaWebsitethatcontains informationabouttheageandnumberoffriendsfor5,000users.
(a) Supposethenumberoffriendsforeachuserisknown.However, only4000outof5000usersprovidetheirageinformation.The averageageofthe4,000usersis30yearsold.Ifyoureplacethe missingvaluesforagewiththevalue30,willtheaverageagecomputedforthe5,000usersincreases,decreases,orstaysthesame(as 30)?
Answer: Averageagedoesnotchange.
(b) Supposethecovariancebetweenageandnumberoffriendscalculatedusingthe4,000users(withnomissingvalues)is20.Ifyou replacethemissingvaluesforagewiththeaverageageofthe4,000 users,wouldthecovariancebetweenageandnumberoffriendsincreases,decreases,orstaysthesame(as20)?Assumethatthe averagenumberoffollowersforall5,000usersisthesameasthe averagefor4,000users.
Answer: Covariancewilldecrease.Let C1 = 4000 i=1 (xi x)(yi y)/3999bethecovariancecomputedusingthe4,000userswithout missingvalues.Ifweimputethemissingvaluesforagewithaverage age, x remainsunchangedaccordingtopart(a).Furthermore, y is assumedtobeunchanged.Thus,thenewcovarianceis
7. Considerthefollowingdatamatrixontheright,inwhichtwoofits valuesaremissing(thematrixontheleftshowsitstruevalues).
0 23260 2270
0 08470 7125
0 12750 3902
0 1329 0 1461
0 37240 1756
0.49750.8536
0.69260.7834
0.79330.7375
0.82290.2147
0 84970 4980
1 05920 7600
1 50281 0122
0 23260 2270 0 08470 7125
0 12750 3902 ? 0 1461
0 37240 1756
0.49750.8536
0.69260.7834
0.79330.7375
0.82290.2147 0 84970 4980 1 0592? 1 50281 0122
(a) Imputethemissingvaluesforthematrixontherightbytheirrespectivecolumnaverages.Showtheimputedvaluesandcalculate theirroot-mean-square-error(RMSE).
RMSE= (A4,1 ˜ A4,1)2 +(A11,2 ˜ A11,2)2 2
where Ai,j denotesthetruevalueofthe(i,j)-thelementofthedata matrixand ˜ Ai,j denotesitscorrespondingimputedvalue.
Answer: Thecolumnaveragesare[0.58190.4962].Theimputed valuesare
0.23260.2270 0.08470.7125 0.12750.3902
0.5819 0.1461
0 37240 1756 0 49750 8536
0 69260 7834
0 79330 7375
0 82290 2147
0.84970.4980
1.05920.4962 1.50281.0122
andtheRMSEvalueis
RMSE= (0.1329 0.5819)2 +(0.7600 0.4962)2 2 =0 3683
(b) TheExpectation-Maximization(E-M)algorithmisawell-known approachforimputingmissingvalues.AssumingthedataisgeneratedfromamultivariateGaussiandistribution,E-Miteratively computesthefollowingconditionalmeanforeachattributeanduses ittoimputethemissingvalues:
wheretheindices i,j ∈{1, 2} refertooneofthetwoattributesof thedataandΣ 1 denoteinverseofthecovariancematrix.Repeat thepreviousquestionbyapplyingtheE-Malgorithmiterativelyfor
2.2 DataPreprocessing 15
5times.Assumethecovariancematrixofthedataisknownand givenby
Inthefirstiteration,computethemeanvalueforeachcolumnusing onlythenon-missingvalues.Insubsequentiterations,compute themeanvalueforeachcolumnusingboththenon-missingand imputedvalues.Showtheimputedvaluesaftereachiterationand computetheroot-mean-square-error.Comparetheerroragainst theanswerinpart(a).
Answer:
Theinverseofthecovariancematrixis
Theresultsaftereachiterationareshownbelow:
Theroot-mean-square-errorforEMalgorithmisconsiderablylower thanthatusingmeanimputation.
8. ThepurposeofthisexerciseistoillustratetherelationshipbetweenPCA andSVD.Let A bean N × d rectangulardatamatrixand C beits d × d covariancematrix.
(a) Suppose IN isan N ×N identitymatrixand 1N isan N ×N matrix whoseelementsareequalto1,i.e., ∀i,j :(1)ij =1.Showthatthe covariancematrix C canbeexpressedintothefollowingform:
Answer: Thecovariancebetweencolumns i and j inmatrix A is givenby
ij = k(Aki Ai)(
where Ai and Aj aretheircorrespondingcolumnaverages.Amatrix ofcolumnaveragesfor A canbecomputedasfollows:
Thus,eachterm(Aki Ai)inEquation(2.3)canbeexpressedin matrixnotationas Aki 1
A]ki.Thecovariance matrix C canthereforebecomputedasfollows:
wherewehaveusethefollowingpropertyofmatrixtranspose(XY)T = YT XT onthelastline.Furthermore,sincetheidentitymatrixand thematrixofallonesaresymmetric,i.e., IT N = IN and 1T N = 1N , therefore(IN 1 N 1N )T =(IN 1 N 1N ).Finally,itcanbeshown thatthematrix(IN 1 N 1N )isidempotent,whichmeansitisthe
sameasthesquareofthematrix:
2.2
DataPreprocessing 17
where 1N 1N = N 1N isan N × N matrixwhoseelementsareequal to N .Substituting(2.6)into(2.5),weobtain:
(b) Usingsingularvaluedecomposition,thematrix A canbefactorizedasfollows: A = UΣVT ,where U isthe N × N leftsingular matrix, Σ isthe N × d matrixcontainingthesingularvalues,and V isthe d × d rightsingularmatrix.Similarly,usingeigenvalue decomposition,thecovariancematrixcanbefactorizedasfollows: C = XΛXT .ShowtherelationshipbetweenSVDandPCAisgiven bythefollowingequation:
2VT 1 N AT 1N A
Answer: Fromthepreviousquestion,wecanwrite:
Since A = UΣVT and U isanorthogonalmatrix,
If N>d,thenΣhas N d rowsofallzeros.Ifweremovesuchrows, Σbecomesa d × d squarematrixandΣT Σ=Σ2.Bysubstituting C = XΛXT and AT A = VΣ2V intoEquation(2.8),wehave: XΛXT = 1 N 1 VΣ2VT 1 N A1N A . 17
(c) Findtherelationshipbetweentherightsingularmatrix V andthe matrixofprincipalcomponents X ifthedatamatrix A hasbeen column-centered(i.e.,everycolumnof A hasbeensubtractedby thecolumnmean)beforeapplyingSVD.
Answer: Ifthematrix A hasbeencolumn-centered,thenitscolumnmeaniszero,whichmeans AT 1N isamatrixofallzeros. Thus,thelastequationinthepreviousquestionreducesto:
Thissuggeststhattherightsingularmatrix V correspondstothe principalcomponents X,whilethesquarerootofthesingularvalues arethesameas N 1timestheeigenvalues.
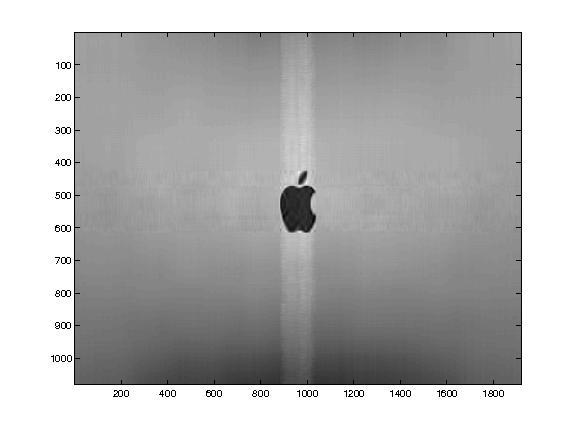
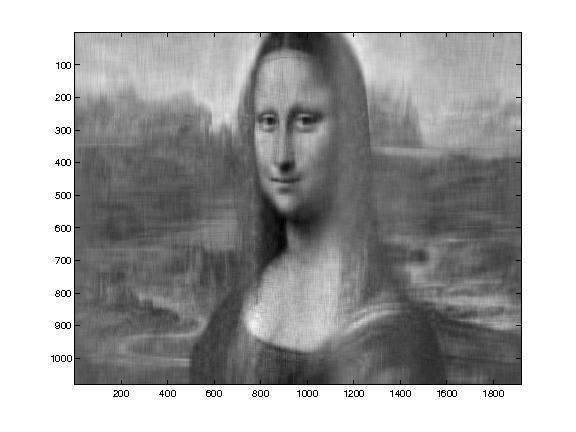
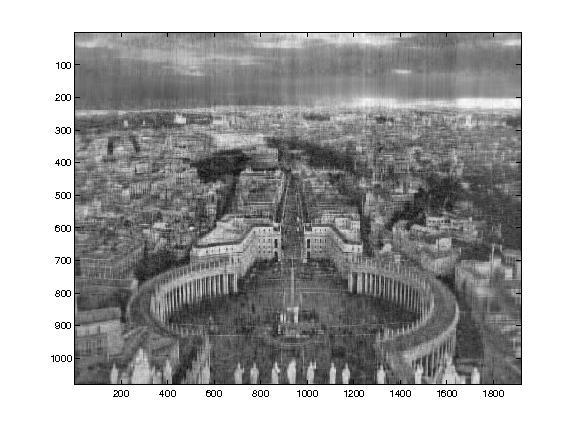
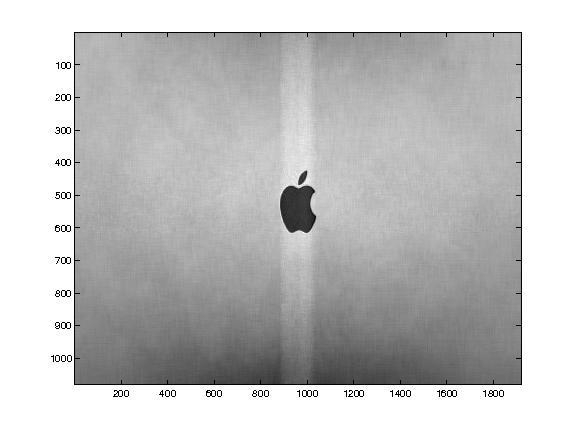
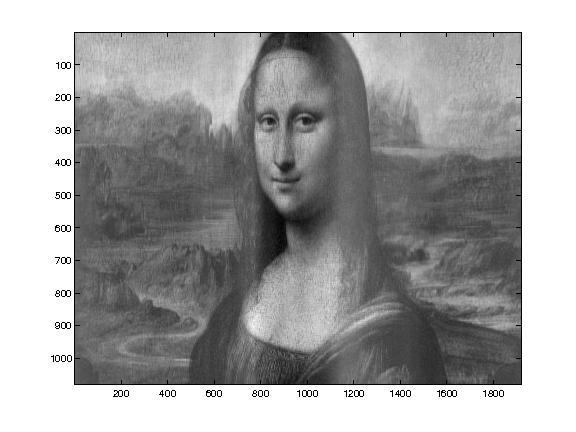
9. Principalcomponentanalysis(PCA)canbeusedforimagecompression bytransformingahigh-resolutionimageintoitslowerrankapproximation.Inthisexercise,youwillbeprovidedwiththefollowingthree imagesofsize1080 × 1920pixelseach(thefilenamesare img1.jpg, img2.jpg,and img3.jpg).

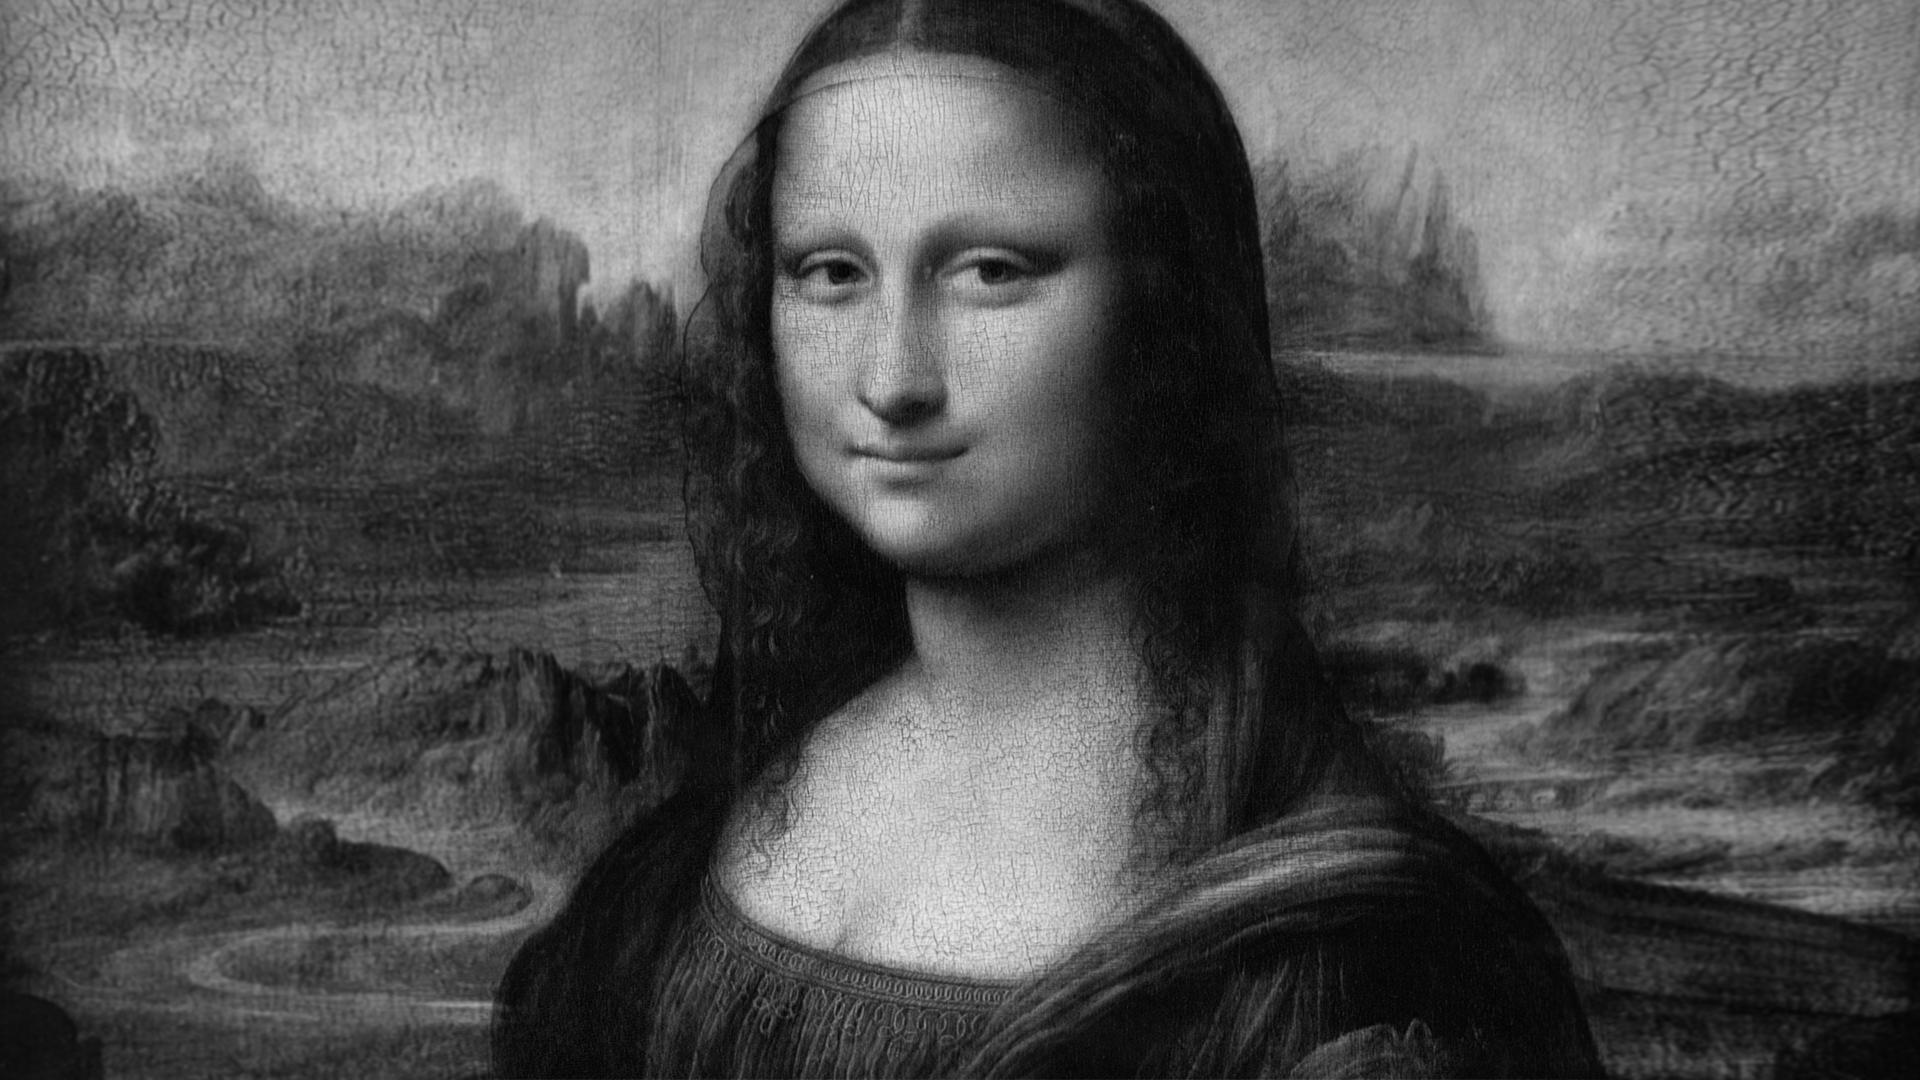

YouwilluseMatlabtoapplyPCAtoeachofthefollowingimages.
(a) Loadeachimageusingthe imread command.Forexample: matlab>A=imread(’img1.jpg’);
(b) Plottheimageingrayscale. matlab>imagesc(A); matlab>colormap(gray);
2.2 DataPreprocessing 19
Answer: SeeFigure2.1.
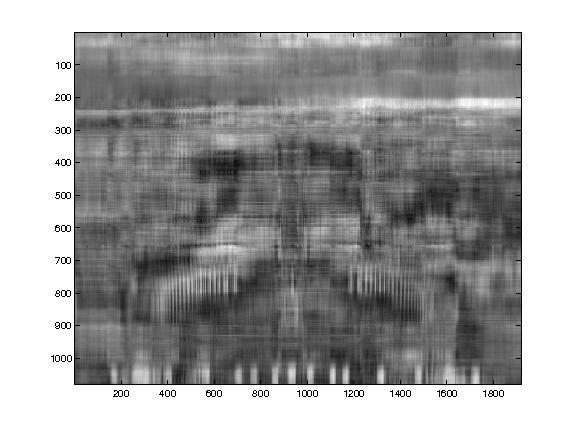
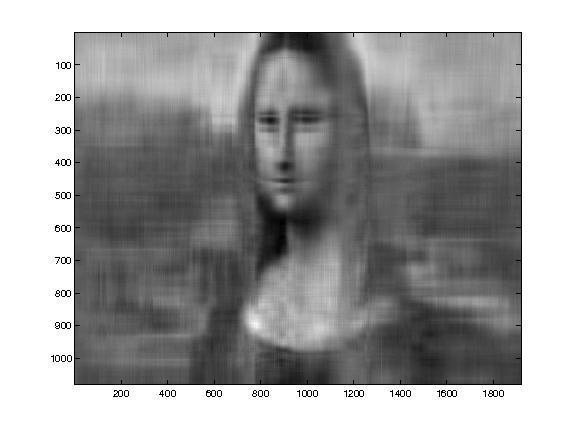
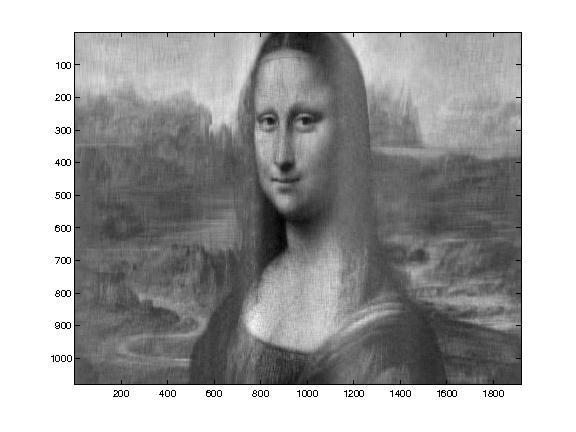
(c) Applyprincipalcomponentanalysistoobtainareducedrankapproximationoftheimage.
Forexample,toobtainarank-10approximation(i.e.,usingthefirst 10principalcomponents),usethefollowingcommands: matlab>A=double(A);%convertAfromuint8todoubleformat matlab>[U,V]=princomp(A);%applyprincipalcomponentanalysis matlab>rank=10;%setranktobe10 matlab>B=V(:,1:rank)*U(:,1:rank)’;%BisthecompressedimageofA matlab>figure; matlab>imagesc(B); matlab>colormap(gray);
Foreachimage,varytherank(i.e.,numberofprincipalcomponents)asfollows:10,30,50,and100.Saveeachimageasfollows: matlab>saveas(gcf,’filename.jpg’,’jpeg’);
Insertthecompressed(reducedrank)imagestothesolutionfileof yourhomework(don’tsubmitthejpgfilesindividually).
Answer: SeeFigure2.2.
(d) ComparethesizeofmatrixA(inbytes)tothetotalsizesofmatrices UandV(inbytes).Computethecompressionratio:
Compressionratio= SizeofmatrixA SizeofmatrixU+SizeofmatrixV
foreachreducedrank(10,30,50,100)oftheimages.Youcanuse the whos commandtodeterminethesizeofthematrices: matlab>whosAUV
Answer: SeeTable2.1.
Table2.1. Compressionratioforvariousimages
(a)rank10img1 (b)rank10img2 (c)rank10img3


(d)rank30img1 (e)rank30img2 (f)rank30img3
(g)rank50img1 (h)rank50img2 (i)rank50img3


(j)rank100img1 (k)rank100img2 (l)rank100img3
Figure2.2. Reduced-rankimagesusingPCA
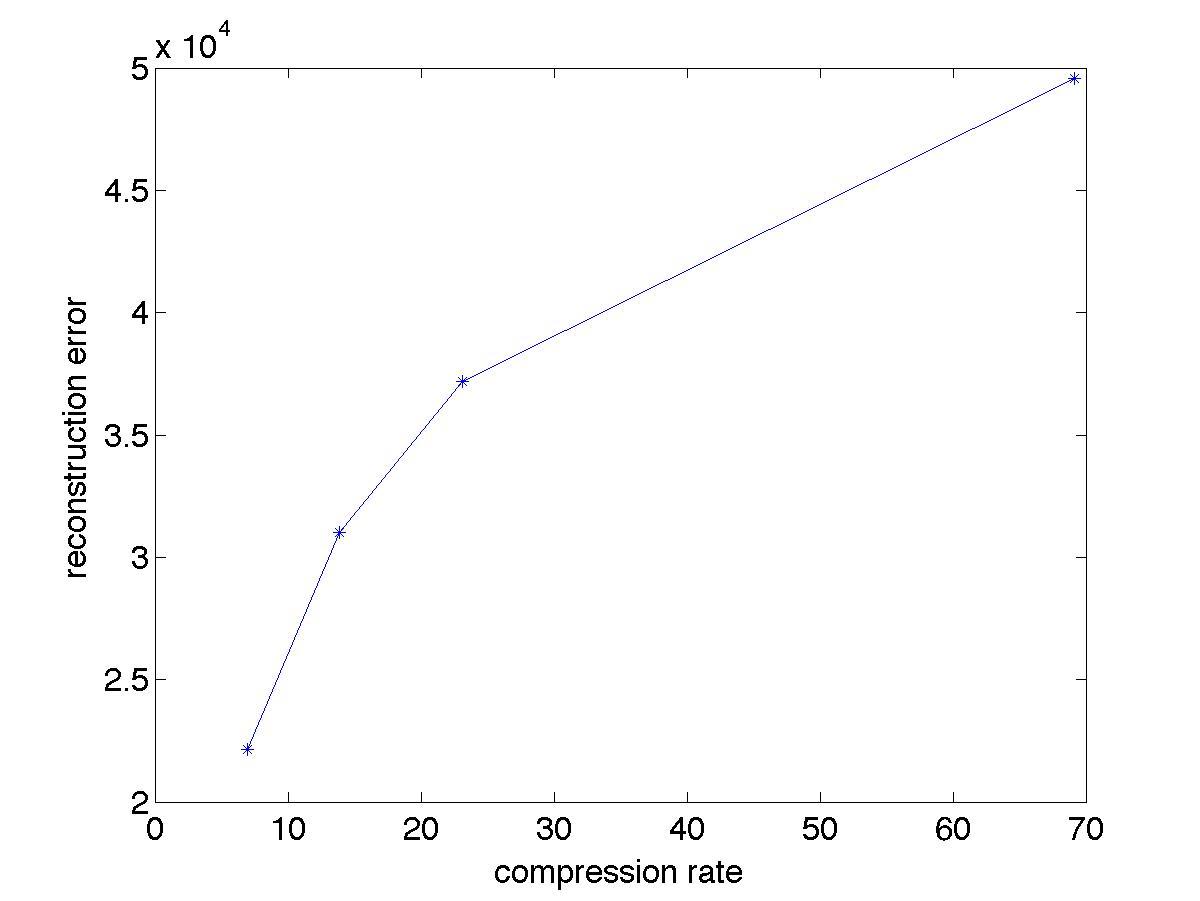
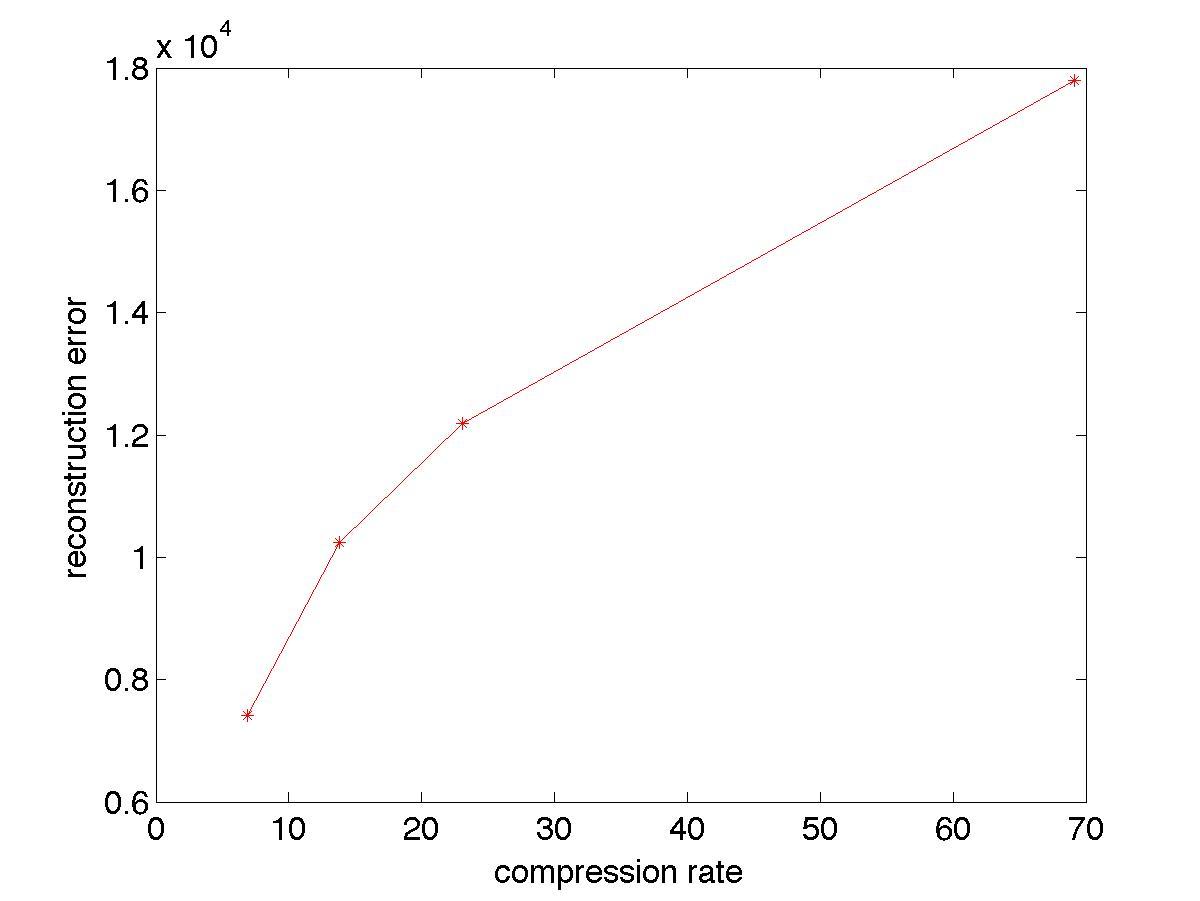
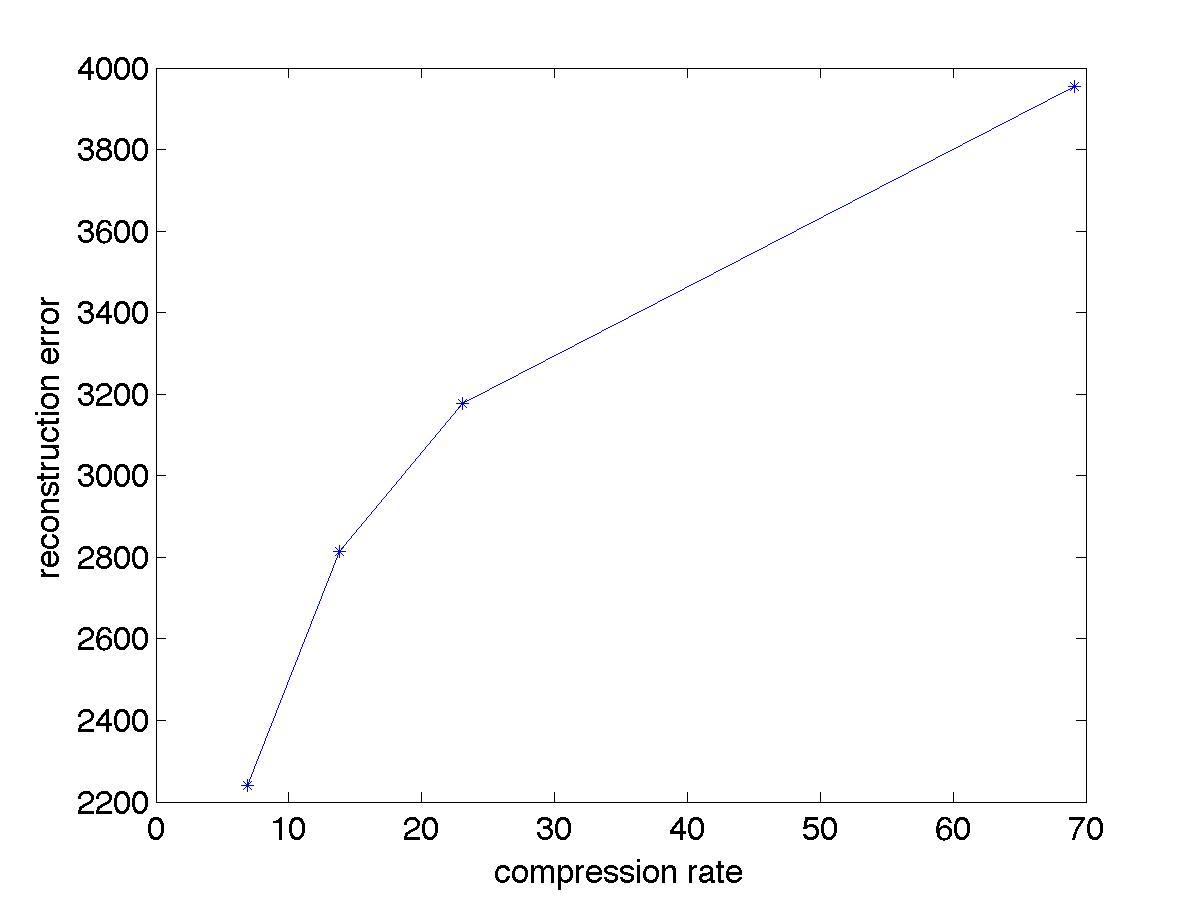
(e) Computethereconstructionerror A B F ofeachreducedrank image,where · F denotetheFrobeniusnormofamatrix.Note thatthehigherthereconstructionerror,thelowerthequalityof thecompressedimage.Plotagraphofreconstructionerror(y-axis) versuscompressionratio(x-axis)foreachimage.
Answer: SeeTable2.2andFigure2.3.
(f) Statetheminimumnumberofprincipalcomponents(10,30,50, 100)neededto(visually)retainmostofthesalientfeaturesofeach
2.2 DataPreprocessing 21
image rank reconstructionerror
img1 10 4 9565 × 104
img1 30 3 7198 × 104
img1 50 3 0998 × 104
img1 100 2 2135 × 104
img2 10 1 7798 × 104
img2 30 1 2190 × 104
img2 50 1 0236 × 104
img2 100 7 4063 × 103
img3 10 3 9544 × 103
img3 30 3 1775 × 103
img3 50 2 8146 × 103
img3 100 2 2397 × 103
Table2.2. Reconstructionerrorforvariousimages
(a)img1 (b)img2 (c)img3
Figure2.3. Reconstructionerrorversuscompressionratio
image(i.e.,thecitysquarein img1.jpg,shapeofthefacein img2. jpg,andshapeoftheapplein img3.jpg).Whichimagerequires theleastnumberofprincipalcomponents?Whichimagerequires themostnumberofprincipalcomponents?
Answer: img1.jpg:50components img2.jpg:30components img3.jpg:10components
2.3MeasuresofSimilarityandDissimilarity
1. Considerthefollowingbinaryvectors:
x1 =(1, 1, 1, 1, 1)
x2 =(1, 1, 1, 0, 0)
y1 =(0, 0, 0, 0, 0)
y2 =(0, 0, 0, 1, 1)
(a) AccordingtoJaccardcoefficient,whichpairofvectors—(x1, x2)or (y1, y2)—aremoresimilartoeachother?
Answer:
Jaccard(x1, x2)= 3 5 =0 6.
Jaccard(y1, y2)= 0 5 =0.
Therefore,accordingtoJaccardcoefficient,(x1, x2)aremoresimilar.
(b) Accordingtosimplematchingcoefficient,whichpairofvectors— (x1, x2)or(y1, y2)—aremoresimilartoeachother?
Answer:
SMC(x1, x2)= 3 5 =0.6.
SMC(y1, y2)= 3 5 =0 6.
Therefore,accordingtosimplematchingcoefficient,theyareboth equallysimilar.
(c) AccordingtoEuclideandistance,whichpairofvectors—(x1, x2)or (y1, y2)—aremoresimilartoeachother?
Answer:
Euclidean(x1, x2)= √2=1 4142.
Euclidean(y1, y2)= √2=1 4142.
Therefore,accordingtoEuclideandistance,theyarebothequally similar.
2. Consideraweighted,undirected,graph G (seeFigure2.4asanexample). Let e(u,v)betheweightoftheedgebetweennodes u and v,where e(u,u)=0and e(u,v)= ∞ if u and v isdisconnected.Assumethe
2.3 MeasuresofSimilarityandDissimilarity 23 graphisaconnectedcomponent,i.e.,thereexistsapathbetweenevery twonodes.Supposethepathlength, d(u,v),isdefinedasfollows:
d(u,v)=
0if u = v; e(u,v), ifthereisanedgebetween u and v; minw=u=v d(u,w)+ d(w,v), otherwise.
Is d(u,v)ametric?Stateyourreasonsclearly.(Checkwhetherthe positivity,symmetry,andtriangleinequalitypropertiesarepreserved.).
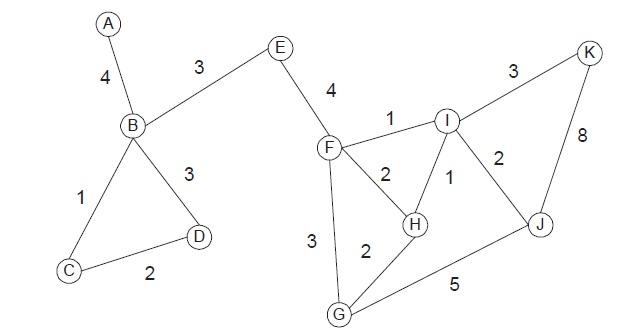
Figure2.4. Weightedundirectedgraph.
Answer:
(a) Positivitypropertyispreservedbydefinitionsince d(u,u)=0and d(u,v) > 0if u = v
(b) Symmetrypropertyispreservedsincethegraphisundirected.
(c) Triangleinequalityisnotpreserved.Acounter-exampleis d(K,J ) ≥ d(K,I)+ d(I,J ).
Therefore d(u,v)isnotametric.
3. Fordocumentanalysis,numerousmeasureshavebeenproposedtodeterminethe semanticsimilarity betweentwowordsusingadomainontology suchasWordNet.Forexample,wordssuchas dog and cat havehigher semanticsimilaritythan dog and money (sincetheformerreferstotwo typesofcarnivores).Figure2.5belowshowsanexampleforcomputingtheWu-Palmersimilaritybetween dog and cat basedontheirpath
24Chapter2 Data
lengthintheWordNethypernymhierarchy.Thedepth h referstothe lengthoftheshortestpathfromtheroottotheirlowestcommonhypernym(e.g., carnivore forthewordpair dog and cat),whereas k isthe minimumpathlengthbetweenthetwowords.
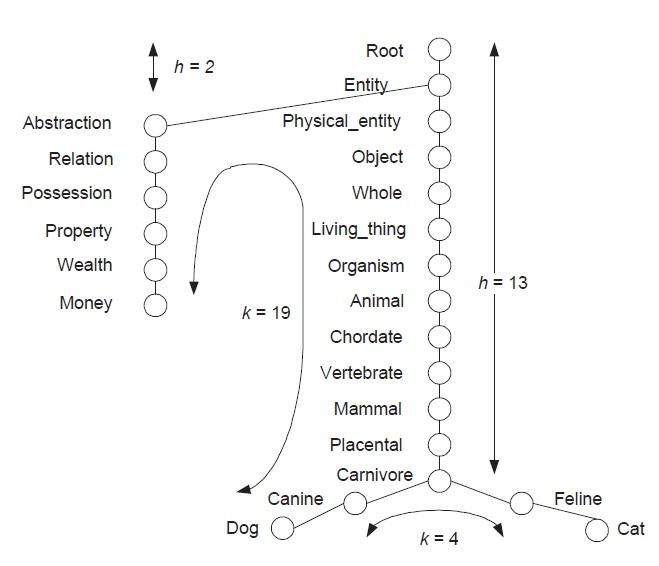
SampleofthehypernymhierarchyinWordNet.
TheWu-Palmersimilaritymeasureisdefinedasfollows: W = 2h k +2h
Forexample1,for dog and cat, W =26/(4+26)=0 867,whereasfor dog and money, W =4/(19+4)=0 174.
(a) WhatisthemaximumandminimumpossiblevalueforWu-Palmer similarity?
1Inthissimplifiedexample,weassumeeachwordhasexactly1sense.Ingeneral,a wordcanhavemultiplesenses.Asaresult,theWu-Palmermeasureisgivenbythehighest similaritythatcanbeachievedusingoneofitspossiblesenses.
2.3 MeasuresofSimilarityandDissimilarity 25
Answer: Maximumvalueis1;minimumvalueapproaches0. (b) Let1 W betheWu-Palmerdistancemeasure.
• Does1 W satisfythepositivityproperty? Answer: Yes.Since1 W = k 2h =0when k =0,thisimplies that d(u,v)=0ifandonlyif u = v
• Does1 W satisfythesymmetryproperty? Answer: Yesbecause W isasymmetricmeasure.
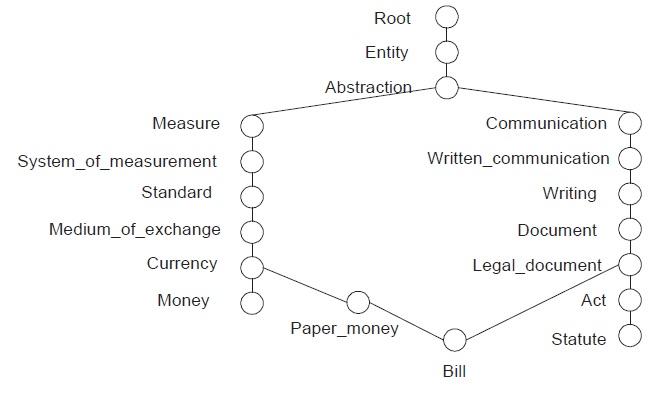
• Does1 W satisfythetriangleinequalityproperty? Answer: Nobecauseeachnodecanhavemorethanonepath totheroot,somemaybeshorterthanothers.Forexample,the words(money,statute)areverydissimilartoeachother.But (money,bill)and(bill,statute)areverysimilar,thusviolating triangleinequality.Theactualpathforthesewordsinthe WordNetontologyareshowninFigure2.6.
4. Supposeyouaregivenacensusdata,whereeverydataobjectcorrespondstoahouseholdandthefollowingcontinuousattributesareusedto characterizeeachhousehold:totalhouseholdincome,numberofhouseholdresidents,propertyvalue,numberofbedrooms,andnumberofvehiclesowned.Supposeweareinterestedinclusteringthehouseholds basedontheseattributes.